Town of Innisfil 2018 Community Profile - Innisfil Accelerates
←
→
Page content transcription
If your browser does not render page correctly, please read the page content below
Town of Innisfil
                                                         2018 Community Profile

                                   V 2.0
                              Septemer 2018
                           © 2018 Town of Innisfil

Information in this document is subject to change without notice. Although all data is
believed to be the most accurate and up-to-date, the reader is advised to verify all data
before making any decisions based upon the information contained in this document.

For further information, please contact:
Economic Development Office
Town of Innisfil
2101 Innisfil Beach Road
Innisfil, ON | L9S 1A1

Phone: 705-436-3710

                                           innisfil.ca
Town of Innisfil
                                                         2018 Community Profile

                                           V 2.0
                                 October 2018
                         © 2018 Town of Innisfil

Information in this document is subject to change without notice. Although all
data is believed to be the most accurate and up-to-date, the reader is advised
to verify all data before making any decisions based upon the information
contained in this document.

For further information, please contact:
Economic Development Office
Town of Innisfil
2101 Innisfil Beach Road
Innisfil, ON
L9S 1A1
Phone: 705-436-3710
Email: business@innisfil.ca

                                           innisfil.ca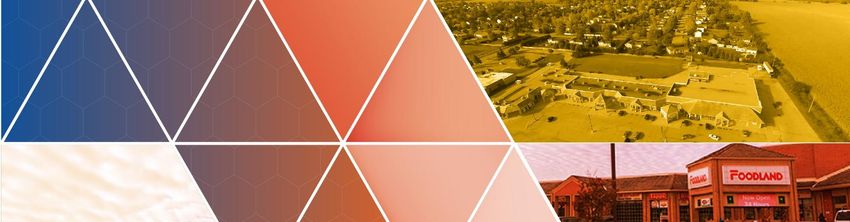
Town of Innisfil
                                                                                             2018 Community Profile

Table of Contents
    DATA SOURCES .............................................................................................................................. 1
    INTRODUCTION .............................................................................................................................. 2
              Location ............................................................................................................................................. 3
              Climate ............................................................................................................................................... 5
    DEMOGRAPHICS ........................................................................................................................... 6
              Population Size and Growth ........................................................................................................... 6
              Age Profile ......................................................................................................................................... 7
              Income ............................................................................................................................................... 9
              Mobility Characteristics ................................................................................................................. 12
              Language Characteristics ............................................................................................................ 13
              Level of Education ......................................................................................................................... 14
    LABOUR FORCE ............................................................................................................................ 18
              Key Indicators .................................................................................................................................. 18
              Labour Force by Occupation ...................................................................................................... 19
              Labour Force by Industry............................................................................................................... 21
              General Wages by Occupation.................................................................................................. 23
              Largest Employers........................................................................................................................... 25
              Place of Work .................................................................................................................................. 27
    TRANSPORTATION AND SHIPPING ............................................................................................ 29
              Highways .......................................................................................................................................... 29
              Rail Services ..................................................................................................................................... 31
              Airports.............................................................................................................................................. 32
              Ports................................................................................................................................................... 33
    TAXES AND UTILITIES .................................................................................................................... 34
              Local Property Tax Rates ............................................................................................................... 34
              Federal and Provincial Income Tax Rates ................................................................................. 34
              Water/Wastewater and Waste Management ......................................................................... 36
              Electricity .......................................................................................................................................... 38
              Natural Gas ..................................................................................................................................... 39
    PLANNING, AND DEVELOPMENT RELATED FEES ...................................................................... 40
              Planning Related Fees/Charges.................................................................................................. 40
              Development Charges and Fees ................................................................................................ 42
    BUSINESS SUPPORT PROGRAMS AND SERVICES ..................................................................... 43
              National and Provincial Support.................................................................................................. 43
              Local/Regional Support ................................................................................................................ 44
              Education and Training ................................................................................................................. 45
    QUALITY OF LIFE........................................................................................................................... 46
              Housing Characteristics................................................................................................................. 46
              Social and Community Services .................................................................................................. 47
              Education ........................................................................................................................................ 48
              Recreational Facilities.................................................................................................................... 49
              Events................................................................................................................................................ 50
              Local Media .................................................................................................................................... 51
              Communications Infrastructure ................................................................................................... 53
APPENDIX – PROVINCIAL AND FEDERAL INCENTIVES................................................................... 54

                                                                        innisfil.ca
Town of Innisfil
                                                                                             2018 Community Profile

List of Tables
Table 1: Innisfil, Average Temperature (°C), 1981-2010 ................................................................................. 5
Table 2: Census Population Change ................................................................................................................ 6
Table 3: Age Distribution, 2018 ........................................................................................................................... 8
Table 4: Total Individual Income Levels, 2018.................................................................................................. 9
Table 5: Family Income Levels, 2018 ............................................................................................................... 10
Table 6: Household Income Levels, 2018 ....................................................................................................... 10
Table 7: Mobility Rates, 2018............................................................................................................................. 12
Table 8: Knowledge of Official Languages, 2018 ......................................................................................... 13
Table 9: Most Common Non-Official Languages Spoken, 2018 ................................................................ 13
Table 10: Educational Attainment, 2018 ........................................................................................................ 15
Table 11: Major Field of Study, Population Aged 15 Years or Older, 2018 ............................................... 17
Table 12: Labour Force Characteristics, 2018 ............................................................................................... 18
Table 13: Labour Force by Occupation, 2018............................................................................................... 20
Table 14: Labour Force by Industry, 2018 ....................................................................................................... 21
Table 15: General Wages by Occupation .................................................................................................... 23
Table 16: Largest Private Sector Employers ................................................................................................... 25
Table 17: Largest Public Sector Employers..................................................................................................... 26
Table 18: Where the Innisfil Resident Labour Force Works, 2018 ................................................................ 27
Table 19: Place of Residence for Persons Working in Innisfil, 2018 ............................................................. 28
Table 20: Distance to Urban Centres .............................................................................................................. 29
Table 21: Distance to Major US Border Crossings .......................................................................................... 30
Table 22: Regional Airports ............................................................................................................................... 32
Table 23: Regional Ports .................................................................................................................................... 33
Table 24: Local Property Tax Rates, 2016 ....................................................................................................... 34
Table 25: Corporate Taxes – General Corporation (2018) .......................................................................... 34
Table 26: Corporate Taxes – Canadian Controlled (2018) ......................................................................... 34
Table 27: Sales Tax .............................................................................................................................................. 35
Table 28: Personal Income Tax, 2018 .............................................................................................................. 35
Table 29: Water and Sewer Charges, 2018.................................................................................................... 36
Table 30: Landfill and Tipping Fees.................................................................................................................. 37
Table 31: Electricity Rates .................................................................................................................................. 38
Table 32: Natural Gas Rates, Commercial and Industrial,2018.................................................................. 39

                                                                         innisfil.ca
Town of Innisfil
                                                                                               2018 Community Profile
Table 33: Land Use Planning Fees ................................................................................................................... 40
Table 34: Area Specific Development Charge, Effective 2017 ................................................................. 42
Table 35: Business Support Programs .............................................................................................................. 43
Table 36: Local Business Support ..................................................................................................................... 44
Table 37: Dwelling Characteristics, 2018 ........................................................................................................ 46
Table 38: Social and Protective Services ....................................................................................................... 47
Table 39: Primary and Secondary Schools..................................................................................................... 48
Table 40: Radio ................................................................................................................................................... 51
Table 41: Television ............................................................................................................................................. 51
Table 42: Print ...................................................................................................................................................... 51
Table 43: Online .................................................................................................................................................. 52
Table 44: Monthly Print....................................................................................................................................... 52
Table 45: Communications Infrastructure ...................................................................................................... 53

List of Figures
Figure 1: Innisfil Location Map ............................................................................................................................ 3
Figure 2: Transportation Corridor, GTA and the County of Simcoe............................................................. 4
Figure 3: Innisfil, Temperature and Precipitation Averages, 1981-2010 ...................................................... 5
Figure 4: Age Distribution Chart, 2018............................................................................................................... 7
Figure 5: Income Distribution of Private Households, 2018 .......................................................................... 11
Figure 6: Educational Attainment, Age Group 25-64, 2018 ........................................................................ 14
Figure 7: Major Field of Study, Population Aged 15 Years or Older, 2018 ................................................ 16
Figure 8: Labour Force by Occupation, 2018................................................................................................ 19

                                                                           innisfil.ca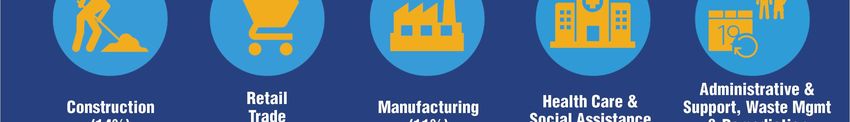


Town of Innisfil
2018 Community Profile
DATA SOURCES
Please note that every effort has been made to use the most
current data available. The major sources of information for this
document are:
The 2006, 2011, and 2016 Census from Statistics Canada;
Manifold SuperDemographics data is 2018 from Manifold
Data Mining Inc.; and
EMSI Analyst Data.
The most recent Census was conducted in May 2016. SuperDemographics 2018
is the most up to date estimation of population characteristics, based on
mathematical models that draw from various data sources.
Manifold Projection Method
Manifold estimates demographic data annually, including population
projections for 5 and 10 years in the future. Manifold methodologies are based
on the following techniques:
Enhanced cohort survival methods;
Nearest neighborhood and regression techniques; and
Structural coherence techniques.
Manifold Data Sources include:
Statistics Canada Real Estate Boards/Companies
Health Canada Canadian Bankers Association
Regional Health Ministries Bank of Canada
Citizenship and Immigration Canada Canada Post Corporation
Regional School Boards Consumer and business directories books
Proprietary survey and research Flyer Distribution Association
Publications of hospitals, CMHC, BBM and partners
|1 innisfil.ca
Town of Innisfil
                                                    2018 Community Profile

   INTRODUCTION

Innisfil offers the best of all worlds!
The Town has many of the characteristics of a small lakeside
community while offering the amenities of a larger urban
centre. Just 45 minutes north of Toronto, Innisfil offers prime
access to major markets through a variety of transportation
options. Innisfil offers development opportunities, a variety of housing options,
and is home to a strong local workforce.

Innisfil Heights Strategic Settlement Employment Area
An area of approximately 1,000 acres in size that consists of a wide range of
industrial, commercial, and tourism-based uses on a range of lot sizes. It is a
gateway into the Town of Innisfil and County of Simcoe that is bisected by
Highway 400, providing high visibility and ideal access to a high volume of users.
To find out more about opportunities in Innisfil and Innisfil Heights, please see
business.innisfil.ca or contact the Economic Development Office.

   |2                                 innisfil.ca
Town of Innisfil
2018 Community Profile
Location
Innisfil is a town in Ontario, Canada, located on the western shore of
Lake Simcoe in The County of Simcoe, immediately south of Barrie and
80 kilometres north of Toronto.
With ease of accessibility from main Highways in the 400 series, the Town is
situated just 45 minutes north of Toronto and five hours west of Ottawa.
Figure 1: Innisfil Location Map
Source: Google Maps, McSweeney & Associates, 2018
|3 innisfil.caTown of Innisfil
2018 Community Profile
The Town includes within its borders Highway 400, and Highway 89 which
provides strong east-west access to the County of Simcoe. The map below
illustrates residential and commercial access routes to Toronto and the GTA,
Barrie and County of Simcoe.
Figure 2: Transportation Corridor, GTA and the County of Simcoe
Source: Town of Innisfil
|4 innisfil.caTown of Innisfil
2018 Community Profile
Climate
Innisfil derives its climatic data (normal and averages) from the
Environment Canada staffed Barrie Weather Station. Table 1 and
Figure 3 illustrate precipitation levels, average and extreme
temperatures.
Table 1: Innisfil, Average Temperature (°C), 1981-2010
Temp. (°C) Jan Feb Mar Apr May Jun Jul Aug Sep Oct Nov Dec
Daily Average -7.7 -6.6 -2.1 5.6 12.3 17.9 20.8 19.7 15.3 8.7 2.7 -3.5
Daily Maximum -2.9 -1.5 3.2 11 18.1 23.6 26.3 25.1 20.7 13.5 6.5 0.4
Daily Minimum -12.4 -11.7 -7.4 0.2 6.5 12.3 15.3 14.3 10 3.9 -1 -7.3
Extreme
14 14 24 30.5 35 35 36 36.5 34.5 30 21.5 19.5
Maximum
Extreme
-35 -33 -30.5 -15 -4 1 6 0 -1.5 -6.5 -19.5 -33
Minimum
Source: Environment Canada, Station. Temperature and Precipitation Graph for 1981 to 2010 Canadian
Climate. Weather Station: BARRIE. http://bit.ly/2l0ZIvW
Figure 3: Innisfil, Temperature and Precipitation Averages, 1981-2010
Precipitation (mm) Daily Average (°C) Daily Maximum (°C) Daily Minimum (°C)
30 100
25 90
20 80
70
15
Precipitation (MM)
Temperature (°C)
60
10
50
5
40
0
30
-5 20
-10 10
-15 0
JAN FEB MAR APR MAY JUN JUL AU G SEP OCT NOV DEC
Source: Environment Canada, Barrie Weather Station. * This station meets WMO standards for temperature.
http://bit.ly/2l0ZIvW
|5 innisfil.caTown of Innisfil
2018 Community Profile
DEMOGRAPHICS
Population Size and Growth
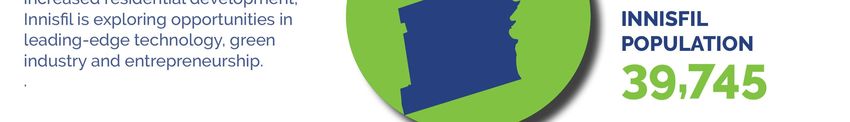
Between 2006 and 2016, the census population in Innisfil
grew from 31,175 to 36,566 (see Table 2), that is
approximately 17.3 % growth over 10 years. The remainder of
the document uses Manifold 2018 demographic and labour
force data estimates.
Table 2: Census Population Change
Population 1996 2001 2006 2011 2016 2018*
Innisfil 24,711 28,666 31,175 32,727 36,566 39,745
% Change n/a 16.0% 8.8% 5.0% 11.7% n/c
1996 2001 2006 2011 2016 2018*
Ontario 10,753,573 11,410,046 12,160,282 12,851,821 13,448,494 14,125,923
% Change n/a 6.1% 6.6% 5.7% 4.6% n/c
Source: Statistics Canada Census Profiles 1996, 2001, 2006, 2011, 2016 and Manifold SuperDemographics 2018
* = Estimates, n/c = not comparable, n/a = not available
17.3 %
growth over 10 years!
|6 innisfil.caTown of Innisfil
2018 Community Profile
Age Profile
Figure 4 illustrates the density chart of Innisfil’s population
by age compared to that of Ontario.
The Town has a slightly lower percentage of people ages
25-45, and a large percentage concentrated around
ages 40-65.
Figure 4: Age Distribution Chart, 2018
10.0%
9.0%
8.0%
7.0%
6.0%
5.0%
4.0%
3.0%
2.0%
1.0%
0.0%
Innisfil % Ontario %
Source: McSweeney & Associates from Manifold Data Mining Inc. SuperDemographics 2018.
|7 innisfil.caTown of Innisfil
2018 Community Profile
Table 3 has 2018 population estimates by age group. It compares the
percentage of total population by age group against Ontario.
Table 3: Age Distribution, 2018
Characteristics Innisfil Innisfil Ontario
Total Population 39,745 100.0% 14,256,784
0 to 4 years 2,056 5.2% 5.1%
5 to 9 years 2,374 6.0% 5.6%
10 to 14 years 2,465 6.2% 5.8%
15 to 19 years 2,391 6.0% 5.8%
20 to 24 years 2,365 6.0% 6.5%
2,233 5.6% 6.7%
Median Age:
25 to 29 years
2,301 5.8% 6.5%
42.5 vs 41.4 in
30 to 34 years
Ontario
35 to 39 years 2,438 6.1% 6.4%
40 to 44 years 2,549 6.4% 6.4% Average Age:
45 to 49 years 2,805 7.1% 6.8% 41 vs 42 in
50 to 54 years 3,296 8.3% 7.4% Ontario
55 to 59 years 3,493 8.8% 7.7%
60 to 64 years 2,840 7.1% 6.8%
65 to 69 years 1,942 4.9% 5.2%
70 to 74 years 1,637 4.1% 4.2%
75 to 79 years 1,139 2.9% 2.9%
80 to 84 years 755 1.9% 2.1%
85 years and over 668 1.7% 2.3%
Source: McSweeney & Associates from Manifold Data Mining Inc. SuperDemographics 2018.
|8 innisfil.caTown of Innisfil
2018 Community Profile
Income
Table 4 shows the breakdown of total individual incomes in 20181.
The median individual income was slightly higher than in the
province, while the average individual income level was on par
with that of Ontario.
Table 4: Total Individual Income Levels, 2018
Characteristic Innisfil Innisfil Ontario
Population 15 years and over 32,850 100.0% 100%
Without income 1,354 4.1% 4.4%
With income 31,496 95.9% 95.6%
Under $5,000 4,277 13.0% 14.2%
$5,000 to $9,999 5,059 15.4% 16.5%
$10,000 to $14,999 4,429 13.5% 12.8%
$15,000 to $19,999 3,613 11.0% 10.4%
$20,000 to $29,999 3,176 9.7% 9.3%
$30,000 to $39,999 2,685 8.2% 7.4%
$40,000 to $49,999 2,074 6.3% 5.8%
$50,000 to $59,999 1,655 5.0% 4.4%
$60,000 to $79,999 1,302 4.0% 3.5%
$80,000 to $99,999 960 2.9% 3.0%
$100,000 and over 2,239 6.8% 8.2%
Characteristic Innisfil Ontario
Median total income $ $37,257 $36,160
Average total income $ $46,014 $46,227
Source: McSweeney & Associates from Manifold Data Mining Inc. SuperDemographics 2018 *(2017 incomes).
Table 5 indicates that in 2018, Innisfil had a slightly higher median family income
(by 1%) than Ontario. The average family income in Innisfil, however, was 8%
lower compared to the provincial figures.
1 Please note that the 2018 Manifold data uses 2017 income data, as it is the most recent information available.
|9 innisfil.caTown of Innisfil
2018 Community Profile
Table 5: Family Income Levels, 2018
Characteristic Innisfil Ontario
Total number of economic families (by income in 2017) 11,717 3,968,764
Median family income $ $101,473 $100,603
Average family income $ $114,283 $123,693
Source: McSweeney & Associates from Manifold Data Mining Inc. SuperDemographics 2018 (2017 incomes).
Table 6 demonstrates, using 2017 income data, that the median income for
households in Innisfil was higher than that of Ontario. The largest household
income level segment in Innisfil was $150,000 and over, annually.
Table 6: Household Income Levels, 2018
Characteristic Innisfil Innisfil Ontario
Total number of private households 14,157 100.0% 100.0%
Under $5,000 114 0.8% 1.5%
$5,000 to $9,999 104 0.7% 1.4%
$10,000 to $14,999 171 1.2% 2.4%
$15,000 to $19,999 268 1.9% 3.4%
$20,000 to $29,999 834 5.8% 7.5%
$30,000 to $39,999 1,046 7.2% 7.9%
$40,000 to $49,999 1,064 7.4% 8.0%
$50,000 to $59,999 1,037 7.2% 7.0%
$60,000 to $79,999 2,061 14.3% 11.7%
$80,000 to $99,999 1,957 13.6% 11.7%
$100,000 to $124,999 1,821 12.6% 10.1%
$125,000 to $149,999 1,446 10.0% 8.0%
$150,000 and over 2,505 17.4% 17.5%
Median household income $ $91,173 $79,939
Average household income $ $107,643 $103,488
Source: McSweeney & Associates from Manifold Data Mining Inc. SuperDemographics 2018 (2017 incomes).
| 10 innisfil.caTown of Innisfil
2018 Community Profile
Figure 5 illustrates the distribution of household income for Innisfil and Ontario. The
town’s income distribution can be described as not symmetrical, with more than
half of the population earning over $60,000 annually.
Figure 5: Income Distribution of Private Households, 2018
16%
14%
Innisfil % Ontario %
12%
10%
8%
6%
4%
2%
0%
Source: McSweeney & Associates from Manifold Data Mining Inc. SuperDemographics 2018 (2017 incomes).
| 11 innisfil.caTown of Innisfil
2018 Community Profile
Mobility Characteristics
Residents in Innisfil are equally likely to change place of residence
within one or five years, compared to the province. Estimates
indicate those movers to Innisfil tend to be relocating from within
the Town or province rather than outside of Ontario or Canada (Table 7).
Table 7: Mobility Rates, 2018
Characteristics Innisfil Innisfil Ontario
Mobility status – place of residence year ago2
Total population 39,311 100.0% 100.0%
Non-movers3 34,719 88% 87.5%
Movers4 4,591 12% 12.5%
Non-migrants5 1,319 3% 7.2%
Migrants6 3,272 8% 5.3%
Internal migrants 3,183 8% 4.2%
Intra-provincial migrants 3,059 8% 3.7%
Interprovincial migrants 124 0% 0.5%
External migrants 90 0% 1.2%
Mobility status – place of residence status five years ago
Total population 37,598 96% 95.8%
Non-movers 23,764 60% 60.0%
Movers 13,834 35% 35.8%
Non-migrants 4,054 10% 19.5%
Migrants 9,780 25% 16.2%
Internal migrants 9,489 24% 12.1%
Intra-provincial migrants 9,300 24% 10.7%
Interprovincial migrants 189 0% 1.4%
External migrants 291 1% 4.2%
Source: McSweeney & Associates from Manifold Data Mining Inc. SuperDemographics 2018.
2 Refers to the relationship between a person's usual place of residence on Census Day and his or her usual place of residence
one year earlier. A person is classified as a non-mover if no difference exists. Otherwise, a person is classified as a mover and this
categorization is called Mobility status (1 year ago). Within the category of movers, a further distinction is made between non-
migrants and migrants; this difference is called migration status.
3 Non-movers are persons who, on Census Day, were living at the same address as the one at which they resided one year
earlier.
4 Movers are persons who, on Census Day, were living at a different address from the one at which they resided one year
earlier.
5 Non-migrants are movers who, on Census Day, were living at a different address, but in the same census subdivision (CSD) as
the one they lived in one year earlier.
6 Migrants are movers who, on Census Day, were residing in a different CSD one year earlier (internal migrants) or who were
living outside Canada one year earlier (external migrants).
| 12 innisfil.caTown of Innisfil
2018 Community Profile
Language Characteristics
Table 8 indicates knowledge of Canada’s official
languages. Nearly 98% of residents in Innisfil speak English,
which is above the provincial figure. Only 0.6% of the
population speaks neither official language (versus 2.4% in
Ontario).
Table 8: Knowledge of Official Languages, 2018
Characteristics Innisfil Innisfil Ontario
Total population 39,745 100.0% 100.0%
English 38,916 97.9% 93.1%
French 505 1.3% 3.8%
English and French 82 0.2% 0.7%
Neither English nor French 243 0.6% 2.4%
Source: McSweeney & Associates from Manifold Data Mining Inc. SuperDemographics 2018.
Moreover, Table 9 illustrates the most common languages outside of the official
languages of Canada.
Table 9: Most Common Non-Official Languages Spoken, 2018
Characteristics Innisfil Innisfil %
Total population 39,745 100.0%
Italian 802 2.02%
Portuguese 551 1.39%
Spanish 534 1.34%
German 335 0.84%
Polish 283 0.71%
Hungarian 151 0.38%
Dutch 143 0.60%
Source: McSweeney & Associates from Manifold Data Mining Inc. SuperDemographics 2018.
| 13 innisfil.caTown of Innisfil
2018 Community Profile
Level of Education
Figure 6 and Table 10 illustrate education attainment for
residents ages 25 to 64. Approximately, 32% completed only
high school, while over 50% completed post-secondary
education.
University level was reached by nearly 13% of the population,
3% of which corresponds to education above the Bachelor level.
Figure 6: Educational Attainment, Age Group 25-64, 2018
University diploma or degree at the bachelor 32%
level or above 14%
25%
College,or other non-university certificate
29%
3.2%
Apprenticeship or trades certificate or diploma
10%
24%
High school certificate or equivalent
32%
10%
No certificate, diploma or degree
13%
0% 5% 10% 15% 20% 25% 30% 35%
Ontario Innisfil
Source: McSweeney & Associates from Manifold Data Mining Inc. SuperDemographics 2018.
| 14 innisfil.caTown of Innisfil
2018 Community Profile
Table 10: Educational Attainment, 2018
Characteristics7 Innisfil Innisfil Ontario
Total population 25 to 64 years 21,954 100.0% 100.0%
No certificate, diploma or degree 2,920 13% 10.4%
Certificate, diploma or degree 7,006 32% 24.4%
High school certificate or equivalent 12,028 55% 65.2%
Postsecondary certificate, diploma or degree 2,244 10% 6.2%
Apprenticeship or trades certificate or diploma 981 4% 3.1%
College, CEGEP or other non-university 1,263 6% 3.2%
certificate or diploma
University certificate, diploma or degree 6,419 29% 24.6%
University certificate or diploma below 358 2% 2.3%
bachelor level
University certificate or degree 3,007 14% 32.0%
Bachelor's degree 2,303 10% 21.3%
University certificate or diploma above 245 1% 2.0%
bachelor level
Source: McSweeney & Associates from Manifold Data Mining Inc. SuperDemographics 2018.
7 By highest certificate, diploma or degree obtained may not add up to 100% due to nested categories
| 15 innisfil.caTown of Innisfil
2018 Community Profile
Figure 7 and Table 11 illustrate major fields of study of residents ages 15 years and
older. Architecture, engineering and related technologies is the most prominent
field of study, with higher uptake in this field compared to the province.
Figure 7: Major Field of Study, Population Aged 15 Years or Older, 2018
Personal, protective and transportation services
Health and related fields
Agriculture, natural resources and conservation
Architecture, engineering, and related
technologies
Mathematics, computer and information sciences
Physical and life sciences and technologies
Business, management and public administration
Social and behavioural sciences and law
Humanities
Visual and performing arts, and communications
technologies
Education
0% 2% 4% 6% 8% 10% 12% 14%
Ontario % Innisfil %
Source: McSweeney & Associates from Manifold Data Mining Inc. SuperDemographics 2018.
| 16 innisfil.caTown of Innisfil
2018 Community Profile
Table 11: Major Field of Study, Population Aged 15 Years or Older, 2018
Major Field of Study Innisfil Innisfil Ontario
Total population aged 15 years and over 32,948 100.0% 100.0%
No postsecondary certificate, diploma or
18,171 55.2% 45.6%
degree
Education 658 2.0% 3.6%
Visual and performing arts, & communications
491 1.5% 2.0%
tech
Humanities 445 1.4% 3.2%
Social and behavioral sciences and law 1,336 4.1% 6.5%
Business, management and public
3,020 9.2% 11.8%
administration
Physical and life sciences and technologies 294 0.9% 2.1%
Mathematics, computer and information
383 1.2% 2.5%
sciences
Architecture, engineering, and related
4,489 13.6% 11.2%
technologies
Agriculture, natural resources and conservation 184 0.6% 0.9%
Health and related fields 2,417 7.3% 7.6%
Personal, protective and transportation services 1,061 3.2% 2.9%
Source: McSweeney & Associates from Manifold Data Mining Inc. SuperDemographics 2017.
| 17 innisfil.caTown of Innisfil
2018 Community Profile
LABOUR FORCE
Key Indicators
Innisfil is home to a labour force that is over 22,000
persons strong. As illustrated in Table 12, the labour force
participation and employment rate are above that of
Ontario. The unemployment rate is lower than that of the
province.
Table 12: Labour Force Characteristics, 2018
County
Characteristic Innisfil Barrie Essa of Ontario
Simcoe
Total population aged 15
32,850 122,356 18,649 429,057 11,909,027
years and older
In the labour force8 22,579 84,899 4,000 280,867 7,699,753
Employed 20,997 78,530 13,167 261,254 7,124,260
Unemployed 1,582 6,369 832 19,613 575,492
Not in the labour force 10,271 37,457 4,649 148,190 4,209,274
Participation rate % 68.73 69.39 75.07 65.46 64.65
Employment rate % 63.92 64.18 70.61 60.89 59.82
Unemployment rate % 7.00 7.50 5.95 6.98 7.47
Source: McSweeney & Associates from Manifold Data Mining Inc. SuperDemographics 2018.
Note that Innisfil, Barrie and Essa are Census Subdivision, while County of Simcoe is a Census Division.
8Labour force - Refers to persons who were either employed or unemployed. Unemployed - Refers to persons
15 years and over, excluding institutional residents, who, during the week (Sunday to Saturday) prior to Census
Day (May 16, 2006), were without paid work or without self-employment work and were available for work and
either:
(a) had actively looked for paid work in the past four weeks;
(b) were on temporary lay-off and expected to return to their job;
(c) had definite arrangements to start a new job in four weeks or less.
| 18 innisfil.caTown of Innisfil
2018 Community Profile
Labour Force by Occupation
Figure 8 and Table 13 illustrate Innisfil’s labour force make up by
occupation:
Trades transport and equipment operators are the
largest occupation group (23%) in the community.
The percentage of the labour force in sales and services (22%) is also
substantial.
Figure 8: Labour Force by Occupation9, 2018
0% 5% 10% 15% 20% 25%
Trades, transport and equipment operators and 23%
related occupations 13%
Sales and service occupations 22%
23%
Business, finance and administration occupations 14%
16%
Management occupations 10%
11%
Occupations in education, law and social, 9%
community and government services 12%
Occupations in manufacturing and utilities 6%
5%
Health occupations 4%
6%
Natural and applied sciences and related 4%
occupations 7%
Natural resources, agriculture and related 2%
production occupations 2%
Occupations in art, culture, recreation and sport 2%
3%
Innisfil % Ontario %
Source: McSweeney & Associates from Manifold Data Mining Inc. SuperDemographics 2018.
10Occupation data are produced according to the NOC 2011:
http://www.statcan.gc.ca/eng/subjects/standard/noc/2011/index
| 19 innisfil.caTown of Innisfil
2018 Community Profile
Table 13: Labour Force by Occupation, 2018
Characteristic Innisfil Innisfil Ontario
Total labour force 15 years and over 22,579 100.0% 100.0%
Occupation - Not applicable 598 2.65% 2.6%
All occupations 21,981 97.35% 97.4%
7 Trades, transport and equipment operators and 5,300 23.47% 12.8%
related occupations
6 Sales and service occupations 4,927 21.82% 22.5%
1 Business, finance and administration 3,222 14.27% 15.6%
occupations
0 Management occupations 2,357 10.44% 11.0%
4 Occupations in education, law and social, 2,026 8.97% 11.6%
community and government services
9 Occupations in manufacturing and utilities 1,294 5.73% 5.1%
3 Health occupations 1,016 4.50% 6.3%
2 Natural and applied sciences and related 908 4.02% 7.3%
occupations
8 Natural resources, agriculture and related 506 2.24% 1.8%
production occupations
5 Occupations in art, culture, recreation and sport 424 1.88% 3.3%
Source: McSweeney & Associates from Manifold Data Mining Inc. SuperDemographics 2017.
| 20 innisfil.caTown of Innisfil
2018 Community Profile
Labour Force by Industry
As shown in Table 14, the largest percentage of the labour
force is employed in the Construction trade (14%), Retail
trade (13%), and Manufacturing (11%) industries, which
account for larger percentages of the population compared
to these same industries in Ontario. Health care is also an
important employment industry in the economy.
Table 14: Labour Force by Industry, 2018
Industry 10 Innisfil Innisfil Ontario
Total labour force 15 years and over 22,579 100% 100.0%
All industries 21,981 97% 97.4%
23 Construction 3,054 14% 6.6%
44-45 Retail trade 2,861 13% 10.7%
31-33 Manufacturing 2,488 11% 9.3%
10North American Industry Classification System 2012:
http://www23.statcan.gc.ca/imdb/p3VD.pl?Function=getVD&TVD=118464
| 21 innisfil.caTown of Innisfil
2018 Community Profile
Industry 10 Innisfil Innisfil Ontario
62 Health care and social assistance 1,897 8% 10.3%
56 Administrative and support, waste
1,279 6% 4.7%
management and remediation services
61 Educational services 1,255 6% 7.3%
48-49 Transportation and warehousing 1,196 5% 4.6%
72 Accommodation and food services 1,175 5% 6.6%
54 Professional, scientific and technical
1,086 5% 7.9%
services
81 Other services (except public
1,055 5% 4.2%
administration)
91 Public administration 1,020 5% 5.8%
41 Wholesale trade 987 4% 3.9%
52 Finance and insurance 634 3% 5.4%
Industry - not applicable 598 3% 2.6%
51 Information and cultural industries 458 2% 2.6%
71 Arts, entertainment and recreation 441 2% 2.2%
53 Real estate and rental and leasing 428 2% 2.2%
11 Agriculture, forestry, fishing and hunting 276 1.2% 1.5%
22 Utilities 218 1.0% 0.8%
21 Mining, quarrying, and oil and gas
100 0.4% 11.0%
extraction
55 Management of companies and
0 0.0% 5.3%
enterprises
Source: McSweeney & Associates from Manifold Data Mining Inc. SuperDemographics 2018.
| 22 innisfil.caTown of Innisfil
2018 Community Profile
General Wages by Occupation
Below is a sampling of local wage rates for the closest and most
representative region available (Kitchener-Waterloo-Barrie
Region).
Table 15: General Wages by Occupation11
Low Wage Average Wage High Wage
Category
($/hour) ($/hour) ($/hour)
Senior government managers and
officials 25.96 53.57 87.18
(NOC 0012-0)
Financial managers (NOC 0111-0) 24.00 45.67 71.79
Human resources managers (NOC
25.48 43.27 66.67
0112-0)
Engineering managers (NOC 0211-0) 35.00 52.88 81.73
Administrative assistants (NOC 1241-
14.00 20.00 30.52
B)
Health information management
14.00 21.33 35.00
occupations (NOC 1252-B)
Statistical officers and related
research support occupations (NOC 20.13 37.36 76.92
1254-B)
Data entry clerks (NOC 1422-C) 14.00 19.75 24.62
Production logistics co-ordinators
19.00 25.00 34.97
(NOC 1523-C)
Transportation route and crew 15.87 21.63 32.97
schedulers (NOC 1526-C)
Electrical and electronics engineers 25.00 40.87 66.67
(NOC 2133-A)
Architects (NOC 2151-A) 23.00 31.79 48.08
Biological technologists and 15.00 25.00 38.78
technicians (NOC 2221-B)
Forestry technologists and 16.00 20.54 27.00
technicians (NOC 2223-B)
For more wage rates please visit:
11
www.jobbank.gc.ca/LMI_report_area.do?&area=29315&reportOption=wage
| 23 innisfil.caTown of Innisfil
2018 Community Profile
Low Wage Average Wage High Wage
Category
($/hour) ($/hour) ($/hour)
Landscape and horticulture 16.00 20.54 27.00
technicians and specialists (NOC
2225-B)
Dentists (annual income) (NOC 3113- 33,602 116,903 266,338
A)
Occupational therapists (NOC 3143- 28.85 38.46 44.00
A)
Animal health technologists and 14.00 16.83 24.00
veterinary technicians (NOC 3213-B)
Paramedical occupations (NOC 25.00 36.50 41.50
3234-B)
Nurse aides, orderlies and patient 14.00 19.00 25.80
service associates (NOC 3413-C)
Home support workers, housekeepers 14.00 16.23 19.86
and related occupations (NOC 4412-
C)
Source: Produced by Human Resources and Skills Development Canada's Labour Market Information Service.
Last updated November 1st, 2018.
| 24 innisfil.caTown of Innisfil
2018 Community Profile
Largest Employers
Tables 16 and 17 identify some of the largest private and public
employers by NAICS and employment level in the County of
Simcoe.
Table 16: Largest Private Sector Employers
# of Employees
Name NAICS
(approximate)
Honda of Canada Manufacturing 33611 4,300
Casino Rama Resort 72112 2,712
F&P Manufacturing 33635 846
Simcoe Parts Service Inc. 48412/49311 810
Napoleon/Wolf Steel Ltd. 33341 800
44112/ 52691/
Georgian International Limited 675
48121
Horseshoe Resort 72111 630
Raytheon ELCAN Optical Technologies 33461 600
Sinton Transportation 485110 589
Transcom North America 56143 490
Source: McSweeney & Associates from Simcoe Economic Development http://bit.ly/2pNz9fn
| 25 innisfil.caTown of Innisfil
2018 Community Profile
Table 17: Largest Public Sector Employers
# of Employees
Name NAICS
(approximate)
Simcoe County District School Board 61111 6,600
Canadian Forces Base Borden 91111 5,000
Simcoe Muskoka Catholic District School
61111 3,400
Board
Georgian College 61121 2,500
Royal Victoria Regional Health Centre 62211 2,465
County of Simcoe 91391 1,750
OPP General Headquarters 91213 1,550
Soldiers’ Memorial Hospital 62211 1,282
Waypoint Centre For Mental Health Care 62322 1,246
City of Barrie 91391 1,265
OLG Slots at Georgian Downs 72112 292
Town of Innisfil 91391 284
Source: McSweeney & Associates from Simcoe Economic Development http://bit.ly/2pNz9fn
| 26 innisfil.caTown of Innisfil
2018 Community Profile
Place of Work
Tables 18 and 19 provide information on persons reporting a
“usual place of work other than in their home or outside of
Canada”, and reveal the following regarding labour force
commuting:
More than half of the Innisfil labour force works outside of the community.
Most residents that work outside the community, commute to Barrie or
Toronto.
Most of the non-resident workers are from Barrie, Essa and New
Tecumseth.
Table 18: Where the Innisfil Resident Labour Force Works, 2018
Place of Residence / Place of Work Total Male Female
Innisfil, Town/ Barrie, City 3,480 1,310 2,170
Innisfil, Town/ Innisfil, Town 2,565 980 1,590
Innisfil, Town/ Toronto, City 1,940 1,205 730
Innisfil, Town/ Vaughan, City 1,130 765 365
Innisfil, Town/ Newmarket, Town 1,025 360 660
Innisfil, Town/ Bradford West Gwillimbury, Town 860 440 425
Innisfil, Town/ New Tecumseth, Township 610 375 235
Innisfil, Town/ Mississauga, City 460 305 160
Innisfil, Town/ Aurora, Town 345 135 210
Innisfil, Town/ Brampton, City 305 210 95
Innisfil, Town/ Markham, Town 250 145 110
Innisfil, Town/ Essa, Township 230 175 50
Innisfil, Town/ East Gwillimbury, Town 190 75 115
Innisfil, Town/ Springwater, Township 175 100 80
Innisfil, Town/ King, Township 165 95 70
Innisfil, Town/ Oro-Medonte, Township 155 85 70
Innisfil, Town/ Springwater, Township 145 45 100
Innisfil, Town/ Caledon, Town 115 75 35
Innisfil, Town/ Orillia, County 80 40 35
Innisfil, Town/ Whitchurch-Stouffville, Town 40 25 0
Innisfil, Town/ Georgina, Town 40 20 20
Innisfil, Town/ Uxbridge, Township 25 15 10
Total workforce residing in Innisfil 14,380 7,000 7,360
Total resident labour force with a usual place of
11,815 6,020 5,770
work outside Innisfil
Percent of residents declaring a place of work
82% 86% 78%
outside of Innisfil
Source: McSweeney & Associates, Statistic Canada, 2016 Commuting Flow; https://bit.ly/2xkKPc4
| 27 innisfil.caTown of Innisfil
2018 Community Profile
Table 19: Place of Residence for Persons Working in Innisfil, 2018
Place of Residence / Place of Work Total Male Female
Innisfil, Town/ Innisfil, Town 2,565 980 1,590
Barrie, City/ Innisfil, Town 1,795 850 945
Essa, Township/ Innisfil, Town 340 155 185
Springwater, Township/ Innisfil, Town 215 140 75
New Tecumseth, Township/ Innisfil, Town 185 45 145
Bradford West Gwillimbury, Town/ Innisfil, Town 170 65 100
Oro-Medonte, Township/ Innisfil, Town 145 90 50
Toronto, City/ Innisfil, Town 100 75 25
Vaughan, City/ Innisfil, Town 70 50 25
Newmarket, Town/ Innisfil, Town 70 35 35
Wasaga Beach, Town/ Innisfil, Town 45 30 20
King, Township/ Innisfil, Town 35 25 10
Adjala-Tosorontio, Township/ Innisfil, Town 35 15 20
Severn, Township/ Innisfil, Town 35 20 15
Orillia, City/ Innisfil, Town 35 30 10
Mississauga, City/ Innisfil, Town 30 20 10
East Gwillimbury, Town/ Innisfil, Town 25 25 10
Tiny, Township/ Innisfil, Town 20 10 10
Midland, Town/ Innisfil, Town 20 15 10
Total workforce residing in Innisfil 5,935 2,675 3,290
Total non-resident workforce commuting to work to 3,370 1,695 1,700
Innisfil
Percent of workers (non-residents) commuting to 57% 63% 52%
work in Innisfil
Source: McSweeney& Associates, Statistic Canada, Commuting Flow, http://bit.ly/2q6ezEx
| 28 innisfil.caTown of Innisfil
2018 Community Profile
TRANSPORTATION AND SHIPPING
Highways
Innisfil has direct access to Highway 400, which connects the
town with Toronto and Barrie. Highway 400 connects the Town
with the 400 series (401, 407, 404, 403) which provide access eastwards to
Ottawa and south the USA. Highway 400 also connects with Highway 11, which
provides access to northern Ontario.
Average Annual Daily Traffic (AADT) counts for key roads:
Highway 400: From Highway 89 north to Innisfil Beach Road
Distance (km): 9.7
Annual Average Daily Traffic (AADT): 90,000
Highway 89: From Hwy 400 west to Cookstown settlement boundary
Distance (km): 3.9
Annual Average Daily Traffic (AADT): 17,000
Table 20: Distance to Urban Centres
Distance to Major Urban Centres
Location Distance (km) Distance (miles) Driving Time
Barrie 14 9 20 min
Orillia 58 36 35 min
Collingwood 71 44 1h
Toronto 100 62 1h
Hamilton 142 88 1 h 35 min
Oshawa 128 80 1 h 30 min
Kitchener 158 98 1 h 45 min
Buffalo 233 145 2 h 20 min
Source: McSweeney & Associates from Google Maps
| 29 innisfil.caTown of Innisfil
2018 Community Profile
Table 21: Distance to Major US Border Crossings
Distance to Border Crossings
Border Crossing Distance (km) Distance (miles) Driving Time
Niagara Falls, ON/Niagara
182 113 2h
Falls, NY
Fort Erie, ON/Buffalo, NY 207 129 2 h 20 min
Lansdowne, ON/Wellesley
383 238 4h
Island, NY
Sarnia, ON/ Port Huron 324 202 3 h 30 min
Detroit, MI/ Windsor, ON 406 252 4h
Source: McSweeney & Associates from Google Maps.
| 30 innisfil.caTown of Innisfil
2018 Community Profile
Rail Services
Barrie Collingwood Railway
The Barrie Collingwood Railway (BCRY) provides rail car
transportation and switching service for customers of the City of
Barrie and area.
GO Transit
Operates commuter rail services from the Greater Toronto Area (GTA) to South
Simcoe. In South Simcoe, GO Stations are in Barrie as well as Bradford. Also, note
that a GO station has been approved by Metrolinx for 6th line Innisfil. For more on
this, please visit: (https://bit.ly/2MIvuXN)
Metrolinx
97 Front Street West
Toronto, ON M5J 1E6
Phone: 416-874-5900
Fax: 416-869-1755
CN Rail
CN is a leader in the North American rail industry. Following its acquisition of
Illinois Central in 1999, WC in 2001 and GLT in 2004, as well as its partnership
agreement with BC Rail in 2004, CN provides shippers with more options and
greater reach in the rapidly expanding market for north-south trade. More CN
services at:
Headquarters
935 de La Gauchetière Street West
Montreal, QC H3B 2M9
Phone: 1-888-888-5909
Web: http://www.cn.ca/en/index.htm
| 31 innisfil.caTown of Innisfil
2018 Community Profile
Canadian Pacific
CP has numerous routing options across Canada and through the U.S. as well as
excellent North American reach through gateways with all Class I railways. CP
has extensive Canadian and U.S. short line partners and serves leading Atlantic
and Pacific port facilities.
Canadian Head Office: Closest Transload Facility: Intermodal Facility:
Gulf Canada Square 6660 Financial Drive Vaughan Intermodal
401 9 Avenue SW, Suite 500 Mississauga, ON Terminal
Calgary, AB Phone: 905-821-0514 6830 Rutherford Road
T2P 4Z4 Fax: 905-821-9173 Kleinburg, ON
Web: www.cpr.ca/ Phone: 1-888-333-8111
Fax: 905-893-5027
Airports
Three main airports serve Innisfil, as listed below.
Table 22: Regional Airports
Name Location Web
Collingwood 1969 Concession Rd 6
Regional Stayner ON http://www.collingwood.ca/regional_airport
Airport L0M 1S0
Lake Simcoe 224 Line 7 North
Regional Oro-Medonte ON http://lakesimcoeairport.com/contact/
Airport L0L 2E0
Pearson 6301 Silver Dart Drive
International Mississauga ON https://www.torontopearson.com/#
Airport L5P 1B2
Source: McSweeney & Associates from Google Maps
| 32 innisfil.caTown of Innisfil
2018 Community Profile
Ports
Table 23: Regional Ports
Name Location Web
605 James St. North
Hamilton Port 6th Floor
www.hamiltonport.ca
Authority Hamilton, ON
L8L 1K1
60 Harbour Street
Port of Toronto
Toronto, ON http://www.torontoport.com/index.asp
(Ocean Port)
M5J 1B7
1621 Simcoe St S.
Port of Oshawa www.portofoshawa.ca
Oshawa ON, L1H 8J7
Source: McSweeney & Associates from Google Maps
| 33 innisfil.caTown of Innisfil
2018 Community Profile
TAXES AND UTILITIES
This section describes the taxes (local, provincial and federal),
cost of water and sewer connection, waste management sites,
and natural gas and electricity rates.
Local Property Tax Rates
Table 24: Local Property Tax Rates, 2016
Local Tax Rates 2016 Total
Combined Town, County and Education $
Commercial Excess/Vacant Land 1.644950
Commercial Occupied 2.349920
Farm 0.280591
Industrial Occupied 2.937521
Industrial Excess/Vacant Land 1.909372
Source: Town of Innisfil https://business.innisfil.ca/grow/taxescharges
Federal and Provincial Income Tax Rates
Table 25: Corporate Taxes – General Corporation (2018)
Corporate Tax Rates – Non-Canadian Controlled 2017 2018
Combined Federal and Provincial % %
General/Manufacturing and Processing/Investment 25.0 25.0
General; Active Business Income 26.5 26.5
Source: McSweeney & Associates
Table 26: Corporate Taxes – Canadian Controlled (2018)
Corporate Tax Rates - Canadian Controlled 2017 2018
Combined Federal and Provincial % %
General/Manufacturing and Processing/Investment 15.0 15.0
General; Active Business Income 26.5 26.5
Source: McSweeney & Associates and http://www.cra-arc.gc.ca/tx/bsnss/tpcs/crprtns/rts-eng.html
| 34 innisfil.caTown of Innisfil
2018 Community Profile
Table 27: Sales Tax
Sales Tax 2018
HST (harmonized sales tax) 13%
Source: https://www.taxtips.ca/salestaxes/sales-tax-rates-2018.htm
Table 28: Personal Income Tax, 2018
2018 Marginal Tax Rates
Canadian Dividends
Other Income Capital Gains
Eligible Non-Eligible
Dividends Dividends
first $46,605 15.00% 7.5% -0.03% 5.77%
over $46,605 20.5% 10.25% 7.56% 12.15%
up to $93,208
over $93,208 26.0% 13.00% 15.15% 18.53%
up to $144,489
over $144,489 29.0% 14.50% 19.29%
19.51%
up to $205,842
over $205,842 33.0% 16.50% 24.81% 26.65%
Marginal tax rate for dividends is a % of actual dividends received (not grossed-up amount).
Marginal tax rate for capital gains is a % of total capital gains (not taxable capital gains).
Federal Basic Personal Amount
2018 Tax Rate
$11,809 15.00%
Source: http://www.taxtips.ca/taxrates/canada.htm
| 35 innisfil.caTown of Innisfil
2018 Community Profile
Water/Wastewater and Waste Management
Table 29: Water and Sewer Charges, 2018
Commercial/Residential
Annual Wastewater Rates Rate
Residential Base $204.13
Residential Flat $509.00
Residential Mixed Use Base $408.46
Residential Mixed Use Flat $712.88
Commercial & Industrial Base $1,103.38
Commercial & Industrial Flat $1,731.31
Institutional Base $6,301.59
Institutional Flat $10,165.93
Per Cubic Meter $1.44
Water Rate
Residential Base $264.67
Commercial Base $472.44
Industrial Base $1,062.94
Institutional Base $2,754.38
Per Cubic Meter $2.16
Source: Town of Innisfil https://bit.ly/2MI32W8
| 36 innisfil.caTown of Innisfil
2018 Community Profile
Table 30: Landfill and Tipping Fees
Waste Management
Name of Site 16 Bradford West Gwillimbury
Site 13 Tosorontio Landfill
Site Transfer Station
2960 Line 12 6815 Concession Road 4
Location Bradford, Ontario Township of Adjala-Tosorontio, ON
L3Z 2M4 L0M 1J0
Monday to Friday: 8:30 am to 4:30 Monday to Friday: 8:30 am to 4:30
pm pm
Operation Saturday: 8:00 am to 4:00 pm Saturday: 8:00 am to 4:00 pm
Hours Check online for holiday hours: Check online for holiday hours:
http://www.simcoe.ca/SolidWasteM http://www.simcoe.ca/SolidWaste
anagement/Pages/notices.aspx Management/Pages/notices.aspx
Textiles - FREE Textiles - FREE
Household hazardous waste - FREE Leaf and yard waste - FREE
Leaf and yard - FREE Waste electronics - FREE
Waste electronics - FREE Concrete rubble - FREE (1Ft. x 1 Ft.
Concrete rubble - FREE (1Ft. x 1 Ft. Max. Size)
Max. Size) Blue box recyclables - FREE
Blue box recyclables - FREE Residential organics - FREE
Tipping Residential Organics - FREE Scrap metal - FREE
Fees Scrap Metal - FREE Tires – FREE
Tires - FREE Brush
Brush Asphalt shingles
Asphalt Shingles Drywall
Drywall Wood waste
Wood waste Mattresses and box springs
Mattresses and box springs Other charges apply
Other charges apply
Sources: http://www.simcoe.ca/SolidWasteManagement/Pages/site13.aspx
| 37 innisfil.caTown of Innisfil
2018 Community Profile
Electricity
Service Provider: InnPower Corporation
7251 Yonge Street
Innisfil, ON L9S 0J3
Email: customerservice@innpower.ca
Phone: 705-431-4321
Table 31: Electricity Rates
General Service 50 kW - Effective January 1, 2018
Distribution Charges Rate
Service Charge $212.38
Rate Rider for Recovery of Foregone Revenue - effective until $22.33
December 31, 2018
Distribution Volumetric Rate $4.3039 /kW
Low Voltage Service Rate $1.3285 /kW
Rate Rider for Disposition of Deferral/Variance Accounts (2017) - $0.5644 /kW
effective until April 30, 2020
Rate Rider for Disposition of Deferral/Variance Accounts (2017) - ($0.4027) /kW
effective until April 30, 2020 - Applicable only for Non-Wholesale
Market
Rate Participants
Rider for Disposition of Group 2 Deferral/Variance Accounts $0.0766 /kW
(2017) - effective until April 30, 2020
Rate Rider for Recovery of Foregone Revenue - effective until $0.4298 /kW
December 31, 2018
Source: https://www.innpower.ca/service.php?id=59 Note that rate order change has been submitted to OEB.
| 38 innisfil.caTown of Innisfil
2018 Community Profile
Natural Gas
Service Provider
Enbridge Gas
Phone: 1-866-763-5427
Web: www.enbridgegas.com
For commercial/industrial customers who purchase their natural gas supply from
Enbridge Gas Distribution:
Table 32: Natural Gas Rates, Commercial and Industrial, 2018
Commercial and Industrial Rates
Monthly Rates
Monthly Charges
October 1, 2018
Customer Charge $70
Gas Supply Charge 10.0713 ¢/m³
Delivery to You See breakdown below*
Cap and Trade (included in Delivery to You on the bill) 0.000 ¢/m³
Transportation to Enbridge 4.9407 ¢/m³
Delivery to You Breakdown: Amount of gas used per month Cost in cents per cubic
First 500 10.5235 ¢/m³
Next 1050 8.4081 ¢/m³
Next 4500 6.9268 ¢/m³
Next 7000 5.9751 ¢/m³
Next 15250 5.5522 ¢/m³
Over 28300 5.4460 ¢/m³
Cap and Trade Customer 0.0000 ¢/m³
Cap and Trade Clearance (0.3010) ¢/m³
Components of Cost Adjustment Cost in cents per cubic
Gas Supply 0.3811 ¢/m³
Transportation (0.0462) ¢/m³
Delivery 0.6417 ¢/m³
Site Restoration Clearance Cost in cents per cubic
Total Annual Change ($300.10)
Source: https://www.enbridgegas.com/Understanding-gas-rates
| 39 innisfil.caYou can also read