2018 COMMUNITY PROFILE - 2018 COMMUNITY PROFILE - Township of Ignace
←
→
Page content transcription
If your browser does not render page correctly, please read the page content below

2018 COMMUNITY PROFILE

               2018
COMMUNITY PROFILE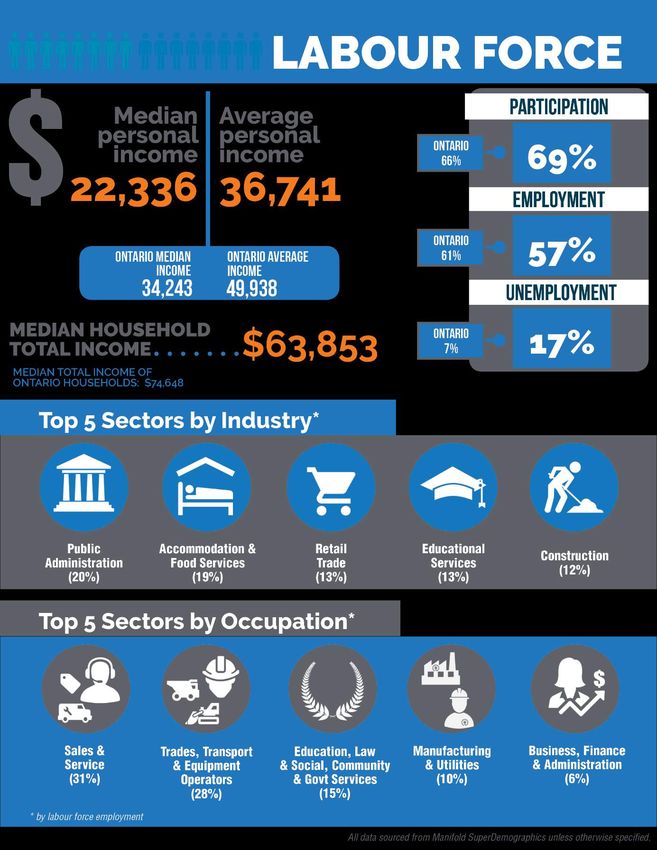
2018
                                             COMMUNITY PROFILE

This project was proudly funded by the Northern Communities Investment Readiness
(NCIR)

                                     V 1.0
                                 February 2018
                             © 2018 Town of Ignace

Information in this document is subject to change without notice. Although all
data is believed to be the most accurate and up-to-date, the reader is advised
to verify all data before making any decisions based upon the information
contained in this document.

For further information, please contact:

Jason Felix
Economic Development Manager (EDM)
The Corporation of the Township of Ignace
34 Main Street (Hwy 17), PO Box 248, Ignace, ON P0T 1T0
Telephone: 807-934-2202
Web: ignace.ca

ignace.ca
2018
                                                                                  COMMUNITY PROFILE

Table of Contents
    INTRODUCTION .........................................................................................................................1
             Economic History ........................................................................................................................ 1
             Location ....................................................................................................................................... 3
             Climate ........................................................................................................................................ 5
    ECONOMIC DEVELOPMENT STRATEGIES ................................................................................7
             Township’s Vision, Mission and Core Values ............................................................................ 7
             Economic Development Plans .................................................................................................. 7
             Key industries .............................................................................................................................. 7
             Investment Opportunities ........................................................................................................... 7
    DEMOGRAPHICS ......................................................................................................................8
             Population Size and Growth ...................................................................................................... 8
             Age Profile ................................................................................................................................... 9
             Language Characteristics ....................................................................................................... 11
             Mobility Characteristics ........................................................................................................... 12
             Level of Education .................................................................................................................... 13
             Income ...................................................................................................................................... 15
    LABOUR FORCE .......................................................................................................................17
             Key Indicators ........................................................................................................................... 17
             Labour Force by Industry ......................................................................................................... 18
             Labour Force by Occupation .................................................................................................. 19
             Place of Work ............................................................................................................................ 21
             General Wages by Occupation .............................................................................................. 22
             Largest Employers..................................................................................................................... 23
    TRANSPORTATION AND SHIPPING.........................................................................................26
             Highways ................................................................................................................................... 26
             Bus Services ............................................................................................................................... 27
             Rail Services .............................................................................................................................. 27
             Airports ....................................................................................................................................... 28
             Ports ............................................................................................................................................ 28
    TAXES AND UTILITIES ...............................................................................................................29
             Local Property Tax Rates .......................................................................................................... 29
             Federal and Provincial Tax Rates ............................................................................................ 29
             Waste Management ................................................................................................................. 31
             Electricity ................................................................................................................................... 32
             Natural Gas ............................................................................................................................... 34
             Water and Sewer ...................................................................................................................... 35
    BUILDING AND DEVELOPMENT RELATED FEES ......................................................................36
             Development and Planning Related Fees/Charges ............................................................. 36

ignace.ca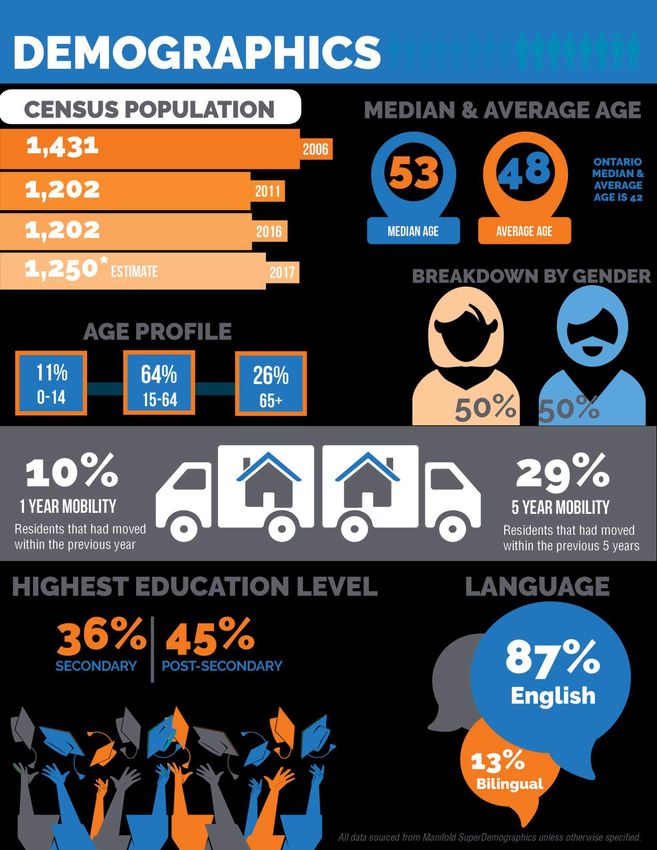
2018
COMMUNITY PROFILE
BUSINESS SUPPORT PROGRAMS AND SERVICES ..................................................................37
National and Provincial Support ............................................................................................. 37
Regional Organizations ............................................................................................................ 39
Education, Employment, and Training.................................................................................... 40
Workforce Training and Employment Services ...................................................................... 41
Real Estate ................................................................................................................................. 43
Financial Agencies ................................................................................................................... 43
QUALITY OF LIFE ......................................................................................................................44
Housing Characteristics ........................................................................................................... 44
Health, Social and Community Services ................................................................................ 45
Protective Services ................................................................................................................... 46
Education .................................................................................................................................. 47
Post Secondary Education ....................................................................................................... 47
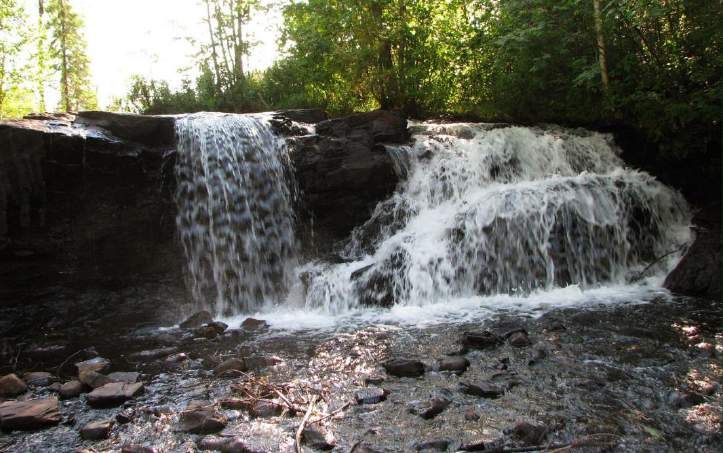
Recreation and Tourism ........................................................................................................... 49
Events ......................................................................................................................................... 51
Local Media .............................................................................................................................. 52
Communication Providers ....................................................................................................... 52
ignace.ca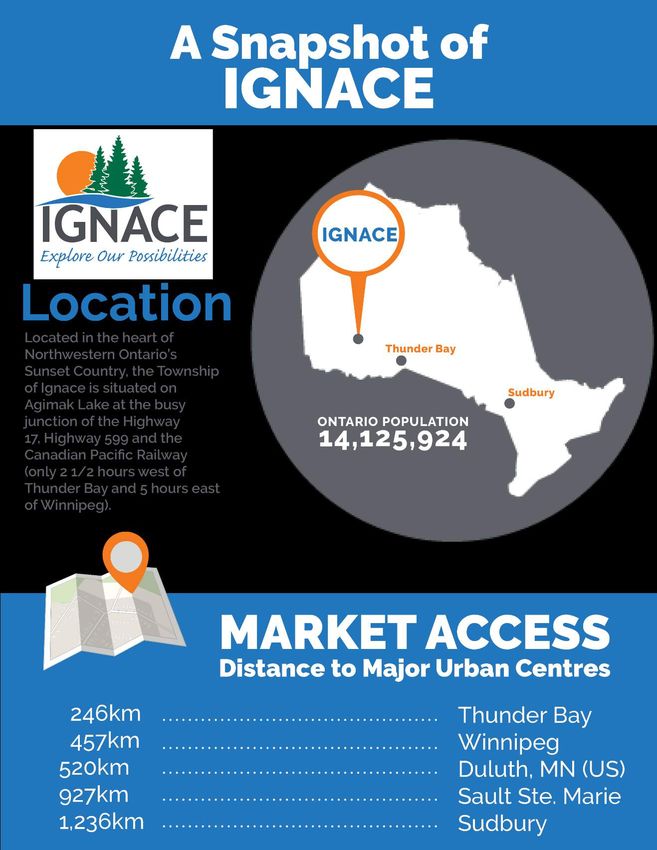
2018
                                                                                  COMMUNITY PROFILE

List of Tables
Table 1: Temperature Normals, Averages and Extremes (based on 1981-2010 data)........................... 5
Table 2: Precipitation Normals, Averages and Extremes (based on 1981-2010 data) ........................... 6
Table 3: Census Population Over Time ........................................................................................................ 8
Table 4: Age Profile of the Estimated Population, 2017 ............................................................................ 10

Table 5: Language Characteristics, 2017 .................................................................................................. 11
Table 6: Ignace Mobility Rates, 2017 ......................................................................................................... 12
Table 7: Educational Attainment, 2017 ...................................................................................................... 14
Table 8: Total Individual Income Levels, 2017........................................................................................... 15
Table 9: Economic Family and Household Income Levels, 2017 ............................................................ 16

Table 10: Labour Force Characteristics, 2017 ........................................................................................... 17
Table 11: NOCS-Labour Force by Occupation, 2017 ............................................................................... 20
Table 12: Where the Resident Labour Force Works, 2016 ........................................................................ 21
Table 13: Place of Residence for Persons Working in Ignace, 2016 ....................................................... 21

Table 14: General Wages (Northwestern Region, Ontario) by Occupation, 2017 ................................ 22
Table 15: Largest Public-Sector Employers ............................................................................................... 23
Table 16: Largest Private Sector Employers ............................................................................................... 25
Table 17: Distance to Major Urban Centres............................................................................................... 26

Table 18: Distance to Major US Border Crossings ..................................................................................... 26
Table 19: Local Property Tax Rates, 2017 .................................................................................................. 29
Table 20: Corporate Taxes – General Corporation (2017 – 2018) ........................................................... 29
Table 21: Corporate Taxes – Canadian Controlled (2017 – 2018) .......................................................... 29
Table 22: Sales Tax ....................................................................................................................................... 29

Table 23: Combined Federal and Provincial Personal Income Tax, 2018 ............................................. 30
Table 24: Waste Management Locations .................................................................................................. 31
Table 25: Hydro Rates, 2018 ........................................................................................................................ 32
Table 26: Water and Sewer Rates, 2017 ..................................................................................................... 35

ignace.ca
2018
                                                                                COMMUNITY PROFILE

Table 27: Planning Fees, 2017 ..................................................................................................................... 36
Table 28: Dwelling Characteristics, 2017 ................................................................................................... 44
Table 29: Protective Service Providers ....................................................................................................... 46
Table 30: Elementary and Secondary Schools ......................................................................................... 47
Table 31: Newspapers ................................................................................................................................. 52

Table 32: Radio Stations .............................................................................................................................. 52
Table 33: Service Providers ......................................................................................................................... 52

List of Figures
Figure 1: Ignace Location Map .................................................................................................................... 3

Figure 2: Ignace Local Map.......................................................................................................................... 4
Figure 3: Ignace Climate Norms, 1981 to 2010 ........................................................................................... 6
Figure 4: Age Profile, Census Population Over Time, 2006-2016 ............................................................... 9
Figure 5: Educational Attainment, Age Group 25-64, 2017 ..................................................................... 13
Figure 6: Distribution of Household Income Levels, 2017 ........................................................................ 16

Figure 7: NAICS-Labour Force by Industry, 2017 ...................................................................................... 18
Figure 8: Labour Force by Occupation, 2017 ........................................................................................... 19

ignace.ca
2018
COMMUNITY PROFILE
2018
COMMUNITY PROFILE

2018
COMMUNITY PROFILE

2018
                                           COMMUNITY PROFILE

        INTRODUCTION

        Economic History
      he Township of Ignace was established in 1879 when the Canadian Pacific

T     Railway was built through the area. Ignace was named by Sir Sandford
      Fleming after his Iroquois guide, Ignace Mentour. The Township became a
railway division point mid-way between Kenora and Fort William (Thunder Bay),
with marshaling and maintenance facilities, station, employee houses and
railroad YMCA.
The Township was incorporated in 1908 and continued as a railroad town for
another half-century. By the 1950’s, changes in rail transport forced the CPR to
begin cutting back operations in Ignace. The Trans-Canada Highway was built in
the late 1930’s, opening up the country for further development and new
opportunities including growth in the service sector and establishment of tourist
camps. The building of the Trans- Canada Pipeline through the Township in the
1950’s and the construction of Highway 599 in the 1960’s provided further stimulus
for growth within the community.
Persistent growth in Ignace occurred throughout the 1960’s as a result of
continued expansion of forestry operations and rapid development of mining
interests in the area. Along with the influx of miners and their families, the area
also became home for some 150 employees of Canadian Forest Products
Limited (the forerunner of Resolute Forest Products). This rapid increase in
population provided for substantial community development, including the
construction of over 100 new housing units, modern sewage and water
treatment facilities, a public elementary/secondary school, a French Catholic
elementary school, a recreation facility and numerous new businesses. Ignace
continued to flourish into the mid 1980’s until the downsizing and ultimate closure
of the mines in 1991, coupled with the downsizing of forestry jobs due to
mechanization.
Transportation plays a key role in the local economy given that the CP railway,
the Trans-Canada Highway and the Trans-Canada Pipeline runs through the
Township. Tourism is a staple of the area’s economy with a number of fishing and
hunting resorts in the vicinity. The community is now promoting Highway 599 as
the best route to the ‘Ring of Fire’ mineral wealth in the far north and is a prime
candidate in the site selection process for a deep geologic repository for used

ignace.ca                                                                   Page 1
2018
COMMUNITY PROFILE
nuclear fuel. The Township continues to explore this possibility with the Nuclear
Waste Management Organization (NWMO) which is responsible for used nuclear
fuel.
The Township of Ignace is now focused on strengthening its local economy
through strategic approaches aimed at building the right capacity to
accommodate the right type of investments as it positions itself for long term
sustainable growth and development.
For more, please visit: ignace.ca
ignace.ca Page 22018
COMMUNITY PROFILE
Location
The Township of Ignace is located within the Kenora District of
Northwestern Ontario. It is located on the Trans-Canada Highway,
two and a half hours west of Thunder Bay, five and a half hours east
of Winnipeg. Highway 599, Ontario’s most northerly paved highway,
starts in Ignace, leading north to Savant Lake, Pickle Lake and
winter roads further north to many First Nations communities.
Figure 1: Ignace Location Map
Source: Google Maps McSweeney & Associates, 2018
ignace.ca Page 32018
COMMUNITY PROFILE
Ignace is conveniently located at the intersection of Highway 17 (Trans-Canada
Highway) and Secondary Highway 599, and on the Canadian Pacific Railway.
Within this ideal location, Ignace benefits from extensive transportation networks
of rail and roads, alongside pristine wilderness. For example, the Township is
located 230 kilometres from U.S. Customs and Border Protection – Fort Frances.
Figure 2: Ignace Local Map
Source: Google Maps, 2018
ignace.ca Page 42018
COMMUNITY PROFILE
Climate
Ignace derives its climatic data from the Environment Canada staffed Dryden
Airport Weather Station.
Table 1: Temperature Normals, Averages and Extremes (based on 1981-2010 data)
(°C) Jan Feb Mar Apr May Jun Jul Aug Sep Oct Nov Dec
Daily
-16.8 -12.7 -5.8 3 10.8 16.2 18.9 17.8 11.7 4.2 -5.2 -13.5
Average
Daily
-11.6 -7.3 -0.1 8.8 16.9 21.7 24.3 23.1 16.5 8.2 -1.6 -9.1
Maximum
Daily
-21.9 -18.1 -11.5 -2.8 4.7 10.5 13.4 12.4 6.8 0.3 -8.8 -17.8
Minimum
Extreme
6.7 10.4 16.7 28.3 33.8 37.5 35.6 35.4 34.4 24.9 20.6 8
Maximum
Extreme
-43.3 -40.8 -34.6 -23 -10.9 -1.5 2 -0.4 -4.4 -12.4 -33 -38.3
Minimum
Source: Environment Canada, Dryden Airport, Ontario Weather Station. * This station meets WMO standards for
temperature.
http://climate.weather.gc.ca/climate_normals/results_1981_2010_e.html?searchType=stnName&txtStationNam
e=dryden&searchMethod=contains&txtCentralLatMin=0&txtCentralLatSec=0&txtCentralLongMin=0&txtCentralL
ongSec=0&stnID=3953&dispBack=0
ignace.ca Page 52018
COMMUNITY PROFILE
Figure 3: Ignace Climate Norms, 1981 to 2010
30 140
20 120
100
10
80
0
60
-10
40
-20 20
-30 0
Jan Feb Mar Apr May Jun Jul Aug Sep Oct Nov Dec
Precipitation (mm) Daily Average (°C) Daily Maximum (°C) Daily Minimum (°C)
Source: Environment Canada, Dryden Airport, Ontario Weather Station. * This station meets WMO standards for
temperature. http://bit.ly/2azQReO
Table 2: Precipitation Normals, Averages and Extremes (based on 1981-2010 data)
Jan Feb Mar Apr May Jun Jul Aug Sep Oct Nov Dec
Rainfall (mm) 0 2 7 25 69 115 103 84 88 49 13 1
Snowfall (cm) 30 20 25 14 3 0 0 0 1 15 35 31
Precipitation
27 20 30 40 73 115 103 84 89 64 47 29
(mm)
Average Snow
30 34 27 5 0 0 0 0 0 1 8 19
Depth (cm)
Median Snow
30 34 27 2 0 0 0 0 0 0 7 19
Depth (cm)
Extreme Daily
Precipitation 36 19 25 36 51 67 92 57 70 48 30 18
(mm)
Extreme Snow
56 60 64 57 10 0 0 0 1 21 49 80
Depth (cm)
Source: Environment Canada from Dryden Airport weather station.
ignace.ca Page 62018
COMMUNITY PROFILE
ECONOMIC DEVELOPMENT STRATEGIES
Township’s Vision, Mission and Core Values
Economic Development Plans
Key Industries
Investment Opportunities
ignace.ca Page 72018
COMMUNITY PROFILE
DEMOGRAPHICS
Population Size and Growth
The following table presents the past and current population size according to
the census, as well as the current and projected population estimates.
Table 3: Census Population Over Time
Region 2006 2011 2016 2017* 2022* 2027*
Town of 1,431 1,202 1,202 1,250 1,250 1,248
Ignace
% Change -16.3% -16.0% 0.0% / -0.02% -0.12%
Region 2006 2011 2016 2017* 2022* 2027*
Ontario 12,160,282 12,851,821 13,448,494 14,125,923 14,792,667 15,490,880
% Change 6.6% 5.7% 4.6% / 4.7% 4.7%
Source: Statistics Canada 2006, 2011, 2016. McSweeney & Associates from Manifold Data Mining Inc.
SuperDemographics 2017. * Census data only accounts for those who answered the census, while Manifold
data is an estimate of the entire population. Because of the difference in methodology, they are not directly
comparable.
ignace.ca Page 82018
COMMUNITY PROFILE
Age Profile
In 2017, the Township of Ignace had a
diverse population profile. Approximately
11% of the population was aged 14 years
or younger. Moreover, 64% of the
population in the Town of Ignace is within
the “normal working age”: 15 to 64 years
old.
Township of Ignace has a slightly older
population, relative to the province; the
median age in the Township is 53,
compared to 42 in Ontario, and the
average age was 48 compared to the
provincial figure of 42.
Over the last 10 years, the census population has seen the biggest decline in the
groups of persons aged 5 to 9 and persons aged 45-49. The largest growth in
population was in persons aged 60 to 69.
Figure 4: Age Profile, Census Population Over Time, 2006-2016
160
2006
140
120 2011
100 2016
80
60
40
20
0
Source: McSweeney & Associates from Manifold Data Mining Inc. SuperDemographics 2017.
ignace.ca Page 92018
COMMUNITY PROFILE
Table 4: Age Profile of the Estimated Population, 2017
Characteristics Ignace Ignace (%) Ontario (%)
Total Population 1,250 100.0% 100.0%
0 to 4 years 46 3.7 5.3
5 to 9 years 38 3.0 5.4
10 to 14 years 48 3.8 5.4
15 to 19 years 79 6.3 5.6
20 to 24 years 71 5.7 6.4
25 to 29 years 51 4.1 6.5
30 to 34 years 50 4.0 6.2 MEDIAN AGE:
35 to 39 years 55 4.4 6.2
40 to 44 years 72 5.8 6.4 53
45 to 49 years 60 4.8 6.9
50 to 54 years 109 8.7 7.7 AVERAGE AGE:
55 to 59 years 122 9.8 7.6
60 to 64 years 129 10.3 6.6
48
65 to 69 years 105 8.4 5.6
70 to 74 years 92 7.4 4.3
75 to 79 years 62 5.0 3.1
80 to 84 years 38 3.0 2.2
85 years and over 23 1.8 2.3
Source: McSweeney & Associates from Manifold Data Mining Inc. SuperDemographics 2017.
Residents in the working
age “15-64” represent
64% of the population in
Ignace.
ignace.ca Page 102018
COMMUNITY PROFILE
Language Characteristics
When it comes to knowledge of Canada’s official
languages, over 86% of the residents in the Township
of Ignace speak English only, which is the same as the
provincial figure.
Approximately 13% of the population in the Township
speaks both English and French.
Table 5: Language Characteristics, 2017
Township of Township of
Characteristics Ontario (%)
Ignace Ignace (%)
Total Population 1,250 100.0% 100.0%
English only 1,080 86.4% 86.4%
French only 5 0.4% 0.3%
English and French 165 13.2% 11.0%
Neither English nor French 0 0.0% 2.3%
Source: McSweeney & Associates from Manifold Data Mining Inc. SuperDemographics 2017.
ignace.ca Page 112018
COMMUNITY PROFILE
Mobility Characteristics
Residents in the Township of Ignace are less likely to change place of residence
within one or five years, compared to the province (Table 6). Those moving to
the Township of Ignace tend to relocate from within the province rather than
outside of Ontario or Canada.
Table 6: Ignace Mobility Rates, 2017
Town of Town of Ontario
Characteristics
Ignace Ignace (%) (%)
Mobility status – place of residence status 1 year ago1
Total population 1,250 100.0% 100.0%
Non-movers2 1,131 90.5 87.9
Movers 3 119 9.5 12.1 13% OF
Non-migrants4 51 4.1 7.1
68 5.4 5.0
RESIDENTS
Migrants 5
Internal migrants 68 5.4 4.0 MOVED TO
Intra-provincial migrants 68 5.4 3.6 THE TOWN
Interprovincial migrants 0 0.0 0.5
OF IGNACE
External migrants 0 0.0 1.0
IN THE LAST
Mobility status – place of residence status 5 years ago
Total population 1,250 100.0% 100.0% 5 YEARS!
Non-movers 894 71.5 61.1
Movers 356 28.5 38.9
Non-migrants 191 15.3 21.5
Migrants 165 13.2 17.4
Internal migrants 165 13.2 13.4
Intra-provincial migrants 118 9.4 11.8
Interprovincial migrants 47 3.8 1.5
External migrants 0 0.0 5.1
Source: McSweeney & Associates from Manifold Data Mining Inc. SuperDemographics 2017.
1 Refers to the relationship between a person's usual place of residence on Census Day and his or her usual place of residence
one year earlier. A person is classified as a non-mover if no difference exists. Otherwise, a person is classified as a mover and this
categorization is called Mobility status (1 year ago).
2 Non-movers are persons who, on Census Day, were living at the same address as the one at which they resided one year
earlier.
3 Movers are persons who, on Census Day, were living at a different address from the one at which they resided one year
earlier.
4 Non-migrants are movers who, on Census Day, were living at a different address, but in the same census subdivision (CSD) as
the one they lived in one year earlier.
5 Migrants are movers who, on Census Day, were residing in a different CSD one year earlier (internal migrants) or who were
living outside Canada one year earlier (external migrants).
ignace.ca Page 122018
COMMUNITY PROFILE
Level of Education
Figures 5 and 6, and Table 6 indicate the level of educational attainment in 2016:
Over 80% of residents in Township of Ignace have a certificate, diploma or
degree, compared to 88% of residents in Ontario.
Township of Ignace has more (24%) College, CEGEP or other non-
university certificates compared to Ontario (20%).
The Township of Ignace has more than double the percentage of
residents with apprenticeship or trades certificates/diplomas, compared
to the province.
Figure 5: Educational Attainment, Age Group 25-64, 2017
University certificate, diploma or 33.1%
degree 8.3%
College, CEGEP or other non- 23.7%
university certificate or diploma 19.6% 80% of
residents in the
Apprenticeship or trades certificate 7.5% Town of Ignace
or diploma 16.7% have a diploma,
certificate, or
24.1% degree.
High school certificate or equivalent
35.7%
11.5%
No certificate, diploma or degree
19.6%
0% 5% 10% 15% 20% 25% 30% 35% 40%
Ontario Ignace
Source: McSweeney & Associates from Manifold Data Mining Inc. SuperDemographics 2017.
ignace.ca Page 132018
COMMUNITY PROFILE
The most common level of post-secondary education
in the Township of Ignace is College or other non-
university diplomas, attained by approximately 127
residents.
Table 7: Educational Attainment, 2017
Town of Town of Ontario
Characteristics
Ignace Ignace (%) (%)
Total population 25 to 64 years 647 100.0% 100.0%
No certificate, diploma or degree 127 19.6 11.5
Certificate, diploma or degree 520 80.4 88.5
High school certificate or equivalent 231 35.7 24.1
Postsecondary certificate, diploma or
289 44.7 64.4
degree
Apprenticeship or trades certificate or
108 16.7 7.5
diploma
College, CEGEP or other non-university
127 19.6 23.7
certificate or diploma
University certificate, diploma or degree 54 8.3 33.1
University certificate or diploma below
0 0.0 4.4
bachelor level
University certificate or degree 54 8.3 28.7
Bachelor's degree 30 4.6 17.7
University certificate or diploma above
24 3.7 11.1
bachelor level
Source: McSweeney & Associates from Manifold Data Mining Inc. SuperDemographics 2017. Note that this
table has been broken up into 4 sections by a black line marker, which indicates a breakdown follows of one of
the categories from the previous section.
Bachelor’s Degree is the most common type of university education in
the Township of Ignace, same as in Ontario.
ignace.ca Page 142018
COMMUNITY PROFILE
Income
The most common individual income level in the Township of
Ignace was between $20,000-29,000, same as in the province.
Table 8: Total Individual Income Levels, 2017
Town of Town of Ontario
Characteristics
Ignace Ignace (%) (%)
Total population 15 years+ 1,118 100.0% 100.0%
Without income 75 7% 5.3 Approximately
With income 1,043 93% 94.7
39% of
Under $5,000 126 11% 9.5
residents in the
$5,000 to $9,999 109 10% 7.0
$10,000 to $14,999 163 15% 8.1
Town of Ignace
$15,000 to $19,999 97 9% 8.4 earned $30,000
$20,000 to $29,999 161 14% 12.4 or more in
$30,000 to $39,999 68 6% 10.9 2017
$40,000 to $49,999 102 9% 9.4
$50,000 to $59,999 55 5% 7.5
$60,000 to $79,999 90 8% 9.0
$80,000 to $99,999 23 2% 5.8
$100,000 and over 48 4% 6.5
$100,000 to $124,999 38 3% 3.2
$125,000 and over 10 1% 3.4
Town Ontario
Median total income $ $22,336 $34,243
Average total income $ $36,741 $49,938
Source: McSweeney & Associates from Manifold Data Mining Inc. SuperDemographics 2017 (2016 incomes).
ignace.ca Page 152018
COMMUNITY PROFILE
Figure 6 below shows Ignace’s household income distribution compared to that
of the province. There are more households living with incomes at the center of
the distribution, and less living at the extremes, compared to Ontario.
Figure 6: Distribution of Household Income Levels, 2017
25.0%
20.0%
15.0%
10.0%
5.0%
0.0%
Ignace % Ontario %
Source: McSweeney & Associates from Manifold Data Mining Inc. SuperDemographics 2017 (2016 incomes).
Table 9 indicates that families residing in the Township of Ignace earned a lower
median and average family income compared to the provincial figures.
Table 9: Economic Family6 and Household Income Levels, 2017
Family Income Ignace Ontario
Total number of economic families 333 4,167,857
Median family income $ $84,990 $97,218
Average family income $ $73,148 $121,508
Household Income Ignace Ontario
Total number of private households 593 5,441,110
Median household income $ $63,853 $34,243
Average household income $ $66,054 $49,938
Source: McSweeney & Associates from Manifold Data Mining Inc. SuperDemographics 2017 (2016 incomes)
6Economic family refers to a group of two or more persons who live in the same dwelling and are related to
each other by blood, marriage, common-law or adoption. A couple may be of opposite or same sex. Foster
children are included.
ignace.ca Page 162018
COMMUNITY PROFILE
LABOUR FORCE
Key Indicators
The Township of Ignace is home to a labour force that is 768 persons strong. As
illustrated in Table 10, the community participation rate is higher than in Ontario.
The unemployment rate is also higher than that of Ontario.
Table 10: Labour Force Characteristics, 2017
Characteristic Town of Ignace Ontario
Total population aged 15 years and older 1,118 11,839,798
In the labour force7 768 7,801,243
Employed 636 7,263,691
Unemployed 132 537,552
Not in the labour force 350 4,038,555
Participation rate8 % 68.7 65.9
Employment rate % 56.8 61.4
Unemployment rate % 17.2 6.9
Source: McSweeney & Associates from Manifold Data Mining Inc. SuperDemographics 2017. *Note that the
data for the Rural municipality are 2016 estimates.
7Labour force - Refers to persons who were either employed or unemployed. Unemployed - Refers to persons 15
years and over, excluding institutional residents, who, during the week (Sunday to Saturday) prior to Census Day
(May 16, 2006), were without paid work or without self-employment work and were available for work and either:
(a) had actively looked for paid work in the past four weeks;
(b) were on temporary lay-off and expected to return to their job;
(c) had definite arrangements to start a new job in four weeks or less.
8Participation rate - Refers to the labour force expressed as a percentage of the population 15 years and over
excluding institutional residents. Employment rate - Refers to the number of persons employed expressed as a
percentage of the total population 15 years and over excluding institutional residents. Unemployment rate -
Refers to the unemployed expressed as a percentage of the labour force.
ignace.ca Page 172018
COMMUNITY PROFILE
Labour Force by Industry
Based on Figure 7, the following can be said about Ignace resident’s
employment by Industry:
Public administration employs the largest percentage of Ignace’s
resident labour force (20%).
The following industries are of interest because Ignace residents are more
concentrated in these industries relative to Ontario:
Accommodation and food services;
Retail trade;
Educational services;
Construction; and
Transportation and Warehousing.
Figure 7: NAICS9-Labour Force by Industry, 2017
0.0% 5.0% 10.0% 15.0% 20.0% 25.0%
156 , 20.3%
91 Public administration
148 , 19.3%
72 Accommodation and food services
101 , 13.2%
44-45 Retail trade
101 , 13.2%
61 Educational services
94 , 12.2%
23 Construction
87 , 11.3%
48-49 Transportation and warehousing
81 Other services (except public 43 , 5.6%
administration)
11 Agriculture, forestry, fishing and 22 , 2.9%
hunting
Ignace % Ontario%
Source: McSweeney & Associates from Manifold Data Mining Inc. SuperDemographics 2017.
9 North American Industry Classification System 2002 - 20% sample data.
ignace.ca Page 182018
COMMUNITY PROFILE
Labour Force by Occupation
The largest percentage of labour force (by occupation) in the Township of
Ignace works in occupations related to Sales and Service. The second most
common occupational classification in Ignace is Trades, transport and
equipment operators and related occupations.
However, the following occupations are also of interest, as they are more
concentrated in Ignace relative to Ontario:
Occupations in education, law and social, community and government;
Occupations in manufacturing and utilities; and
Natural resources, agriculture and related production occupations.
Figure 8: Labour Force by Occupation, 2017
Source: McSweeney & Associates from Manifold Data Mining Inc. SuperDemographics 2017.
Business, Natural resources,
finance and Management agriculture and
administration occupations, related production
occupations, 4.7% occupations, 3.9%
5.6% Sales and
Occupations service
in manufacturing occupations,
and utilities, 30.7%
10.2%
Occupations
in education,
law and social, Trades, transport
community and and equipment
government operators and related
services, 15.1% occupations, 27.6%
ignace.ca Page 192018
COMMUNITY PROFILE
Table 11: NOCS10-Labour Force by Occupation, 2017
Labour Force by Occupation Ignace Ignace % Ontario %
Total labour force 15 years and over 768 100.0% 100.0%
Occupation - Not applicable 18 2.3 2.7
All occupations 750 97.7 97.3
6 Sales and service occupations 236 30.7 22.4
7 Trades, transport and equipment operators and
212 27.6 12.6
related occupations
4 Occupations in education, law and social,
116 15.1 11.7
community and government services
9 Occupations in manufacturing and utilities 78 10.2 5.1
1 Business, finance and administration occupations 43 5.6 16.7
0 Management occupations 36 4.7 11.3
8 Natural resources, agriculture and related
30 3.9 1.6
production occupations
2 Natural and applied sciences and related
0 0.0 7.3
occupations
3 Health occupations 0 0.0 5.7
5 Occupations in art, culture, recreation and sport 0 0.0 3.0
Source: McSweeney & Associates from Manifold Data Mining Inc. SuperDemographics 2017.
10National Occupational Classification for Statistics 2016:
http://noc.esdc.gc.ca/English/noc/welcome.aspx?ver=16.
ignace.ca Page 202018
COMMUNITY PROFILE
Place of Work11
Persons reporting a “usual place of work other than in their home or outside of
Canada”, reveal the following regarding labour force commuting:
There is not reliable data about Ignace residents commuting to a usual
place of work outside of Town.
11% of workers (non-residents) are commuting to work in the Town of
Ignace. Ignace attracts workers primarily from the City of Thunder Bay
and the City of Dryden.
Table 12: Where the Resident Labour Force Works, 2016
Place of Residence / Place of Work Total Male Female
Ignace TP/ Ignace TP 315 145 180
Total workforce residing in Ignace 315 145 180
Total resident labour force with a usual place of work
outside of the Town of Ignace 0 0 0
Percent of residents declaring a place of work outside of
the Town of Ignace 0% 0% 0%
Source: McSweeney& Associates, Statistics Canada, Commuting Flow 2016 Census
Table 13: Place of Residence for Persons Working in Ignace, 2016
Place of Residence / Place of Work Total Male Female
Ignace, TP/ Ignace, TP 315 145 180
Thunder Bay CY/ Ignace, TP 25 10 15
Dryden, CY/ Ignace, TP 20 10 10
Total workforce working in Ignace 355 165 205
Number of non-resident working in Town of Ignace 40 20 25
Percent of non-residents who work in the Town of Ignace 11% 12% 12%
11Please note that Statistics Canada uses estimates and therefore, not all numbers will add up to nor will all
percentages add to 100%.
*Commuting Flow - Census Subdivisions: Sex (3) for the Employed Labour Force Aged 15 Years and Over Having
a Usual Place of Work, for Census Subdivisions, Flows Greater than or Equal to 20, 2011 National Household
Survey.
ignace.ca Page 212018
COMMUNITY PROFILE
Source: McSweeney& Associates, Statistics Canada, 2011 Commuting Flow, 2016 Census
General Wages by Occupation
Below is a sampling of local wage rates.
Table 14: General Wages (Northwestern Region, Ontario) by Occupation12, 2017
Average High
Low Wage
Category Wage Wage
($/hour)
($/hour) ($/hour)
Senior managers - health, education, social and
community services and membership organizations 35.70 43.52 87.18
(NOC 0014-0)
Human resources managers (NOC 0112-0) 25.48 43.27 66.67
Advertising, marketing and public relations
24.00 40.38 71.79
managers (NOC 0124-0)
Managers in health care (NOC 0311-0) 26.22 45.74 62.05
Government managers - economic analysis, policy
development and program administration (NOC 35.00 58.01 71.79
0412-0)
Managers in social, community and correctional
20.00 37.76 52.88
services (NOC 0423-0)
Property administrators (NOC 1224-B) 14.00 21.63 37.98
Administrative officers (NOC 1221-B) 14.06 23.08 35.90
Forestry professionals (NOC 2122-A) 23.89 34.31 43.44
Electrical and electronics engineers (NOC 2133-A) 25.00 40.87 66.67
Geological and mineral technologists and
16.83 30.00 43.96
technicians (NOC 2212-B)
Agricultural and fish products inspectors (NOC
18.45 33.08 41.21
2222-B)
Inspectors in public and environmental health and
19.00 35.58 48.21
occupational health and safety (NOC 2263-B)
For more wage rates please visit:
12
www.jobbank.gc.ca/LMI_report_area.do?&area=29315&reportOption=wage
ignace.ca Page 222018
COMMUNITY PROFILE
Source: Produced by Human Resources and Skills Development Canada's Labour Market Information Service,
Last updated September 25, 2017
Largest Employers
The following two tables present the largest employers in the region for both the
public and private sectors.
Table 15: Largest Public-Sector Employers
Number of Employees
Name Sector
(approximate)
Keewatin-Patricia District School Board
Education 34
(Ignace)
Township of Ignace Government 18
8 (full time)
Mary Berglund Community Health Centre Health
18 (part time)
Ontario Provincial Police Government 14
CSDC des Aurores boréales (École
Education 7
Immaculée-Conception)
Ministry of Natural Resources Government 9
4 (full time)
Ignace Ambulance Health
1(part time)
Service Ontario Government 3
Source: Ignace Economic Development Office
ignace.ca Page 232018
COMMUNITY PROFILE
ignace.ca Page 242018
COMMUNITY PROFILE
Table 16: Largest Private Sector Employers
Number of Employees
Name Sector
(approximate)
Resolute Forest Products Forestry 65
Ricci Trucking Forestry/Transportation 24
Northwood’s Motor Inn Accommodation and 21
Food Services
Canadian Pacific Railways Transportation 19
Burger Scoop (seasonal) Food Services 12-15
Ignace Tavern and Taxi Food Services 9 (full time)
2 (part time)
Westwood Motel Accommodation and 5
Food Services
Source: McSweeney & Associates from the Town of Ignace
ignace.ca Page 252018
COMMUNITY PROFILE
TRANSPORTATION AND SHIPPING
Highways
The Township of Ignace is on the eastern gateway to Ontario's Sunset Country in
Northwestern Ontario. The Township of Ignace is situated on Highway 17 at the
intersection with Highway 599 north.
Ignace is well-connected to destinations in both Canada and the United States
via the Trans-Canada Highway and connecting highways. The community is the
terminus of Highway 599 which runs north beyond Pickle Lake, 300 km north of
Highway 17. Ignace's main connecting roads are:
Highway 17, running east-west through the province and linking it with
Winnipeg and Montreal.
Highway 599 is the best route to Northern Ontario's mineral wealth which is
known as the "Ring of Fire”.
Table 17: Distance to Major Urban Centres
Urban Center Kilometers Miles
Thunder Bay, ON 246 153
Winnipeg, MB 457 284
Duluth, MI (US) 520 323
Sault Ste. Marie, ON 927 576
Sudbury, ON 1,236 768
Source: McSweeney & Associates from Google Maps
Table 18: Distance to Major US Border Crossings
Border Crossing Kilometers Miles
Fort Frances 234 145
Grand Portage 287 179
Baudette 326 203
Sault Ste. Marie 927 576
Source: McSweeney & Associates from Google Maps
ignace.ca Page 262018
COMMUNITY PROFILE
Bus Services
Kasper Transportation comes to Ignace. Please click below to
access information on departure and arrival times.
https://gokasper.com/bus/scheduled-bus-routes/
Rail Services
The Canadian Pacific Railway (CPR) main line east-west passes
through Ignace. The switch yard/reload terminal provides quick and
easy access to the rail system. The CPR system provides direct
access to all major centres in Canada and the United States.
Canadian Pacific Rail
CP has numerous routing options across Canada and through the U.S. as well as
excellent North American reach through gateways with all Class I railways. CP
has extensive Canadian and U.S. short line partners and serves leading Atlantic
and Pacific port facilities.
Mailing Addresses:
Canadian Head Office: Closest Trans-load Facility: Closest intermodal terminal:
Gulf Canada Square CPR/Union Station Vaughan Intermodal
401 9 Avenue SW 440 Syndicate Ave S Terminal
Suite 500 Thunder Bay, Ontario 6830 Rutherford Road
Calgary, AB Kleinburg, ON
T2P 4Z4 L0J 1C0
Web: www.cpr.ca/ Phone: 1-888-333-8111
Facility hours: 7 days a week,
24 hours a day
ignace.ca Page 272018
COMMUNITY PROFILE
Airports
The table below has those airports that are serving the Ignace
population:
Name Web
Dryden Regional Airport
https://www.dryden.ca/en/explore/airport.aspx
Domestic Arrivals
Thunder Bay Airport
International and Domestic http://www.tbairport.on.ca/
Arrivals
Ignace Airways operates a float plane base on
Float Plane Base Agimak Lake at 166 Lakeshore Drive, PO Box 244.
Ignace, ON P0T 1T0.
Source: McSweeney & Associates from Google Maps and Town of Ignace
Ports
The Port of Thunder Bay, 250 km east of Ignace, is an international
seaport. Situated at the head of the Great Lakes/St. Lawrence
Seaway system, the Port of Thunder Bay has a natural protected
harbor on Lake Superior.
ignace.ca Page 282018
COMMUNITY PROFILE
TAXES AND UTILITIES
Local Property Tax Rates
Table 19: Local Property Tax Rates, 2017
Property Class Total Tax Rates
Residential/farm 2.423850
Multi-residential 4.081037
Commercial 3.574210
Commercial vacant/excess 2.501947
Industrial 2.592508
Industrial vacant/excess 1.68500
Pipelines 2.66418
Farmlands 0.605964
Managed forest 0.605964
Landfill 3.574210
New multi-residential 2.423850
Source: Town of Ignace: https://ignace.civicweb.net/filepro/documents/5948?preview=5962
Federal and Provincial Tax Rates
Table 20: Corporate Taxes – General Corporation (2017 – 2018)
Corporate Tax Rates – Non-Canadian Controlled 2017 2018
Combined Federal and Provincial % %
General/Manufacturing and Processing/Investment 25.0 25.0
General; Active Business Income 26.5 26.5
Source: http://bit.ly/1NqBLqU
Table 21: Corporate Taxes – Canadian Controlled (2017 – 2018)
Corporate Tax Rates - Canadian Controlled 2017 2018
Combined Federal and Provincial % %
Small Business Income up to $500,000 15.0 13.5
General; Active Business Income 26.5 26.5
Source: http://bit.ly/1XllQfA and http://www.cra-arc.gc.ca/tx/bsnss/tpcs/crprtns/rts-eng.html
Table 22: Sales Tax
ignace.ca Page 292018
COMMUNITY PROFILE
Sales Tax 2018
Harmonized Sales Tax (HST) 13%
Source: https://www.taxtips.ca/salestaxes/sales-tax-rates-2017.htm
Table 23: Combined Federal and Provincial Personal Income Tax, 2018
2018 Marginal Tax Rates
2018 Taxable Income
2018 2018
2018 Taxable Income Taxable Taxable
Eligible Non-Eligible
Income Income
Dividends Dividends
first $42,960 20.05% 10.03% -6.86% 8.00%
over $42,960 up to $46,605 24.15% 12.08% -1.20% 12.76%
over $46,605 up to $75,657 29.65% 14.83% 6.39% 19.14%
over $75,657 up to $85,923 31.48% 15.74% 8.92% 21.26%
over $85,923 up to $89,131 33.89% 16.95% 12.24% 24.06%
over $89,131 up to $93,208 37.91% 18.95% 17.79% 28.72%
over $93,208 up to $144,489 43.41% 21.70% 25.38% 35.10%
over $144,489 up to $150,000 46.41% 23.20% 29.52% 38.58%
over $150,000 up to $205,842 47.97% 23.98% 31.67% 40.39%
over $205,842 up to $220,000 51.97% 25.98% 37.19% 45.03%
over $220,000 53.53% 26.76% 39.34% 46.84%
Marginal tax rate for dividends is a % of actual dividends received (not grossed-up taxable amount).
Marginal tax rate for capital gains is a % of total capital gains (not taxable capital gains).
Gross-up rate for eligible dividends is 38%, and for non-eligible dividends is 17% in 2017, and 16% in 2018.
The surtax is calculated before deducting dividend tax credits.
For more information see Ontario dividend tax credits.
Marginal tax rates do not include the Ontario Health Premium, which increases the above rates by up to 1.2%
Federal Basic Personal Amount
2018
$11,809
Source: http://www.taxtips.ca/taxrates/canada.htm
ignace.ca Page 302018
COMMUNITY PROFILE
Waste Management
Table 24: Waste Management Locations
Waste Management 2017
Name of Site The Township of Ignace Landfill Site
Location Hwy 599, Ignace, Ontario
Hours of Operation Effective May 1, 2017
Monday 1:00 to 5:00 pm
Operation Wednesday 1:00 -5:00 pm
Hours Saturday 1:00 - 5:00 pm
The landfill is closed Mondays during the winter
season November 1 to April 30
Garbage Collection Fees:
Commercial generator – Bin: $1,200/annual
Commercial generator – Large: $2,400/annual
Tag Bag – Residential or commercial: $1.50
Household and General Garbage, Bulk waste and Construction:
Per Bag (residential): $1.5/residential. $2/commercial
Per trailer smaller than 4x8: $15/residential. $20/commercial
Per ½ ton or 4x8 trailer load: $20/residential. $30/commercial
Tipping Fees Per 1-ton truck or trailed load between 4x8 and 6x14: $30/residential.
$40/commercial
Per 3-ton truck or 6x14 trailer: $40/residential. $50/commercial
Per trailer larger than 14ft: $70/residential. $90/commercial
Per tandem load (14-16 yds): $110/residential. $130/commercial
Per tri-axle load (18-20 yds): $130/residential. $160/commercial
Per tractor trailer (24-26 yds): $160/residential. $180/commercial
Trailers exceeding the 26 yards will be charged the standard rate of a
tractor trailer plus an additional $6.25 per yard in excess.
Source: https://ignace.civicweb.net/filepro/documents/5948?preview=5959
ignace.ca Page 312018
COMMUNITY PROFILE
Electricity
Service Provider: Hydro Ontario
Hydro One Networks Inc.
P.O. Box 5700, Markham, Ontario L3R 1C8
Phone: 1-877-955-1155
Website: www.hydroone.com
Table 25: Hydro Rates, 2018
General Service Energy Billed (less than 50 kW) Urban Energy Energy
Electricity - Time-of-Use prices:
On-peak 13.2¢ 13.2¢
Mid-peak 9.5¢ 9.5¢
Off-peak 6.5¢ 6.5¢
Electricity - Tiered Prices (¢/kWh): First 750 kWh per month 7.7¢ 7.7¢
Additional kWh (¢/kWh) 9.0¢ 9.0¢
Delivery as of January 1, 2018
General Service Energy Billed (less than 50 kW) Urban Energy Energy
Distribution flat charge ($/month) $23.30 $27.87
Smart Metering Entity Charge($/month) $0.79 $0.79
Distribution volume charge (metered use - ¢/kWh) 2.62¢ 5.60¢
Transmission network charge (adjusted use - ¢/kWh) 0.64¢ $0.59¢
Transmission connection charge (adjusted use - ¢/kWh) 0.40¢ 0.38¢
Line loss adjustment factor 1 1.067 1.096
Regulatory charges as of July 1, 2017
General Service Energy Billed (less than 50 kW) Urban Energy Energy
Standard supply service administration charge $0.25 $0.25
($/month)
Rural rate 2protection charge (adjusted usage - ¢/kWh) 0.03¢ 0.03¢
Wholesale market service rate (adjusted usage - ¢/kWh) 0.36¢ 0.36¢
Ontario Electricity Support Program Charge 0.00¢ 0.00¢
(adjusted usage - ¢/kWh) 3
Debt retirement charge
General Service Energy Billed (less than 50 kW) Urban Energy Energy
Debt Retirement Charge 4 0.70¢ 0.70¢
Source: www.hydroone.com/rates-and-billing
Notes: Please see website for footnotes.
ignace.ca Page 322018
COMMUNITY PROFILE
General Service Energy Billed (50 kW and above) Urban Energy Energy
First 750 kWh per month (¢/kWh) 7.7¢ 7.7¢
Additional kWh (¢/kWh) 9.0¢ 9.0¢
Electricity - over 250,000 kWh/year with a conventional See See
meter (¢/kWh)1 Footnote Footnote
See See
Electricity - over 250,000 kWh/year with an interval meter
Footnote Footnote
(¢/kWh)2
Delivery as of January 1, 2018
General Service Energy Billed (50 kW and above) Urban Energy Energy
Distribution flat charge ($/month) $93.97 $89.48
Distribution volume charge (billed demand - $/kW) $9.18 $16.02
Transmission network charge (billed demand - $/kW)4 $2.01 $1.60
Transmission connection charge (billed demand - $/kW)4 $1.32 $1.07
Line loss adjustment factor 5 1.05 1.061
Regulatory charges as of July 1, 2017
General Service Energy Billed (50 kW and above) Urban Energy Energy
Standard supply service administration charge ($/month)6 $0.25 $0.25
Rural rate protection charge (adjusted usage - ¢/kWh) 0.03¢ 0.03¢
Wholesale market service rate (adjusted usage - ¢/kWh) 0.36¢ 0.36¢
Debt retirement charge
General Service Energy Billed (50 kW and above) Urban Energy Energy
Debt Retirement Charge 8 0.70¢ 0.70¢
Source: www.hydroone.com/rates-and-billing
Notes: Please see website for footnotes.
ignace.ca Page 332018
COMMUNITY PROFILE
Natural Gas
Service Provider: Union Gas
50 Keil Drive North
PO Box 2001 Chatham, Ontario N7M 5M1
Phone: (519) 352-3100 or (800)-265-5230
Web: https://www.uniongas.com/business
Business rates outlined below typically apply to medium - large commercial and
small industrial customers. These customers include small businesses, small
greenhouses, restaurants, hotels and retail stores and consume more than 50,000
m3 of natural gas each year.
Commercial and Industrial Rates: Rate 10 - North West
Charges RATES Annualized
at Jan. 1, 2018 Increase/Decrease
Gas Used 10.1887 ¢/m³ -$177.43
Gas Price Adjustment 0.2388 ¢/m³ -$858.40
Transportation to Union Gas 6.0028 ¢/m³ -$2.38
Transportation Price Adjustment 0.7845 ¢/m³ $47.91
Storage 1.5431 ¢/m³ -$0.56
Storage Price Adjustment 0.0000 ¢/m³ $0.00
Delivery Cost
Charges RATES Annualized
at Jan. 1, 2018 Increase/Decrease
First 1,000 m3 7.6284 ¢/m³
Next 9,000 m3 6.1959 ¢/m³
Next 20,000 m3 5.5243 ¢/m³ -$2.40
Next 70,000 m3 4.9875 ¢/m³
All Over 100,000 m3 2.9538 ¢/m³
Cost Adjustments
Charges RATES Annualized
at Jan. 1, 2018 Increase/Decrease
Cap-and-Trade (included in Delivery 3.3421 ¢/m³ -$12.83
on the bill)
Delivery Price Adjustment 1.0857 ¢/m³ $0.00
Monthly Charge $70.00 $0.00
Total Annual Impact -$1,006.09
Source: www.uniongas.com/business/account-services/myaccount/rates
ignace.ca Page 342018
COMMUNITY PROFILE
Water and Sewer
Ignace’s Water Treatment Plant was completed in 2009. Its water
source is Michel Lake, a headwater lake, located in the northern
part of the Township. The treatment system employs a membrane
filtration process that uses coagulation, ultrafiltration and
disinfection with sodium hypochlorite. The plant has the capacity to hold up to
two million litres of water in its reservoir, and it can produce up to 100 litres per
second of water to the municipality for residential and firefighting purposes. The
quality of the water is excellent.
The Ignace Water Pollution Control Plant is located adjacent to the Agimak
River. It is an extended aeration plant that uses aluminum sulphate for
phosphorous control and sodium hypochlorite for disinfection to protect the
environment.
Table 26: Water and Sewer Rates, 2017
Water and Sewer
Fee Description Rate or Charge
Flat rate residential water usage (C rate) $790.34
Flat rate residential sewer usage (A rate) $441.60
Flat rate commercial water usage $790.34
Commercial: Flat rate water Usage D $1,580.68
Commercial: Flat rate water Usage F $3,161.36
Commercial Sewer Usage Flat Rate $441.60
Commercial: Flat rate sewer Usage B $725.49
Commercial: Flat rate sewer Usage D $1,356.36
Commercial: Metered water (per 1000
$13.55
imperial gallons)
Commercial: Metered sewer (per 1000
$6.56
imperial gallons)
Source: For more on this, seasonal and rental rates see
https://ignace.civicweb.net/filepro/documents/5429?preview=7500
ignace.ca Page 352018
COMMUNITY PROFILE
BUILDING AND DEVELOPMENT RELATED FEES
Development and Planning Related Fees/Charges
The Township of Ignace currently has no charges associated with non-residential
or residential development. The table below lists planning charges and fees.
Table 27: Planning Fees, 2017
Development & Works 2017*
Service or Activity Fees ‐ 2017 ($)
Porches/Decks 50.00 minimum
Sign Permit
Solid Fuel Burning Appliances 50.00 minimum
Official Plan Amendment 3750.00
Zoning By-Law Amendment 1000.00
Minor Variance 250.00
Severance (not including retained 550.00
parcel)
Development Agreement 0
Hold Zone Removals 0
Site Plan – Minor
0
Site Plan ‐ Major
Subdivision Agreement 3650.00+100.00/lot over 40
Part Lot Control 0
Plan of Condominium 3650.00+100.00/lot over 40
Official Plan Text & Schedule 0
Zoning By‐law Text & Schedule 0
Zoning & Building Compliance Report 45.00
Subdivision Compliance Report 0
Lifting of One (1) Foot Reserves 0
Cash‐in‐Lieu for Parking 0
Encroachment Agreement 0
Pre‐Servicing Agreement 0
Temporary Use By‐Law 1000.00
Letter of Undertaking 0
Multiple Applications 0
Other Requests 0
Source: Ignace Economic Development Office
ignace.ca Page 36You can also read