Validation of Direct Natural Gas Use to Reduce CO2 Emissions
←
→
Page content transcription
If your browser does not render page correctly, please read the page content below
GTI-09/0007

FINAL REPORT

Validation of Direct Natural Gas
Use to Reduce CO2 Emissions
Report Issued:
June 26, 2009

Prepared by:
Gas Technology Institute
1700 S. Mount Prospect Rd.
Des Plaines, Illinois 60018

Subcontractor
Science Applications International Corporation
8301 Greensboro Drive
McLean, Virginia 22102

GTI Technical Contact:
Neil Leslie, P.E.
R&D Manager
End Use Solutions
847-768-0926
Fax: 847-768-0501
neil.leslie@gastechnology.org

Prepared for:
American Public Gas Association
American Public Gas Association Research Foundation
Interstate Natural Gas Association of America
The INGAA Foundation, Inc.
National Fuel Gas Distribution Corporation
National Grid
Nicor Gas
Piedmont Natural Gas Company
Sempra Energy Utilities
Southwest Gas Corporation
Validation of Direct Natural Gas Use to Reduce CO2 Emissions

Disclaimer
This report’s findings are general in nature, and readers are reminded to perform due diligence in
applying these findings to their specific needs, as it is not possible for the authors or sponsors to have
sufficient understanding of any specific situation to ensure applicability of the findings in all cases. The
authors and the sponsors assume no liability for how readers may use, interpret, or apply the
information, analysis, templates, and guidance herein or with respect to the use of, or damages resulting
from the use of, any information, apparatus, method, or process contained herein. In addition, the authors
and the sponsors make no warranty or representation that the use of these contents does not infringe on
privately held rights.

                                                     ii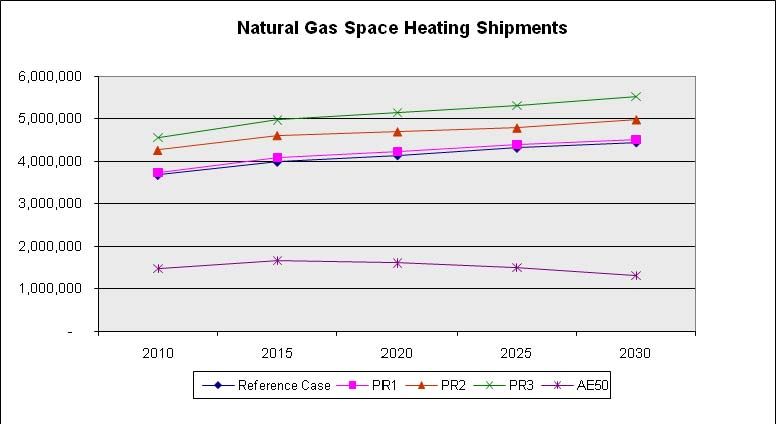
Validation of Direct Natural Gas Use to Reduce CO2 Emissions

                                                          TABLE OF CONTENTS

1.0         EXECUTIVE SUMMARY ......................................................................................................... 1
2.0         BACKGROUND ......................................................................................................................... 3
   2.1      Energy and Emissions Trends ..................................................................................................... 3
   2.2      Why is Full Fuel Cycle Analysis Needed? .................................................................................. 4
3.0         PROJECT OVERVIEW .............................................................................................................. 6
   3.1      Objectives .................................................................................................................................... 6
   3.2      Scope of Work ............................................................................................................................. 6
   3.3      Approach ..................................................................................................................................... 6
      3.3.1     Project Team and Modeling Approach ................................................................................. 6
      3.3.2     Scenario Descriptions ........................................................................................................... 7
4.0         RESULTS AND DISCUSSION ............................................................................................... 10
   4.1      Impact on Building Energy Consumption ................................................................................. 10
   4.2      Impact on National Energy Consumption ................................................................................. 11
   4.3      Impact on CO2 Emissions .......................................................................................................... 12
   4.4      Cumulative Consumer Savings ................................................................................................. 13
   4.5      Cost per Tonne of CO2 Emission Reduction ............................................................................. 14
   4.6      Impact on Natural Gas Production ............................................................................................ 19
   4.7      Impact on Natural Gas Prices .................................................................................................... 20
   4.8      Impact on Electric Generation ................................................................................................... 22
5.0         CONCLUSIONS AND RECOMMENDATIONS .................................................................... 23
APPENDIX A ............................................................................................................................................. 24
   A.1      Metrics for Energy Use and Emissions ..................................................................................... 24
   A.2      Project Description .................................................................................................................... 27
   A.3      Detailed Scenario Descriptions.................................................................................................. 29
      A.3.1     PR1: 40% Natural Gas Equipment Subsidy ....................................................................... 29
      A.3.2     PR2: Natural Gas Education .............................................................................................. 30
      A.3.3     PR3: Increased Natural Gas R&D...................................................................................... 31
      A.3.4     AE50: 50% Electric Equipment Subsidy ........................................................................... 31
   A.4      Cost of Retrofit for Gas Appliances and Insulation ................................................................... 32
   A.5      Summary of Prior Study Results ............................................................................................... 33
   A.6      Model Results ............................................................................................................................ 34
      A.6.1     Shipments ............................................................................................................................ 34
      A.6.2     Installed Stock ..................................................................................................................... 38
      A.6.3     Market Share ....................................................................................................................... 40
      A.6.4     Energy Demand................................................................................................................... 44
      A.6.5     Total Energy Expenditure ................................................................................................... 47
      A.6.6     Generation Impacts ............................................................................................................. 49
      A.6.7     Power Generation ................................................................................................................ 52
      A.6.8     Total Energy Production ..................................................................................................... 53
      A.6.9     Energy Prices ...................................................................................................................... 55
      A.6.10 Residential Natural Gas Consumption ................................................................................ 57
      A.6.11 Commercial Natural Gas Consumption .............................................................................. 59
      A.6.12 Scenario Impact by Census Region..................................................................................... 61
      A.6.13 Electric Space Heating by Region- Stock and Efficiency ................................................... 66

                                                                             iii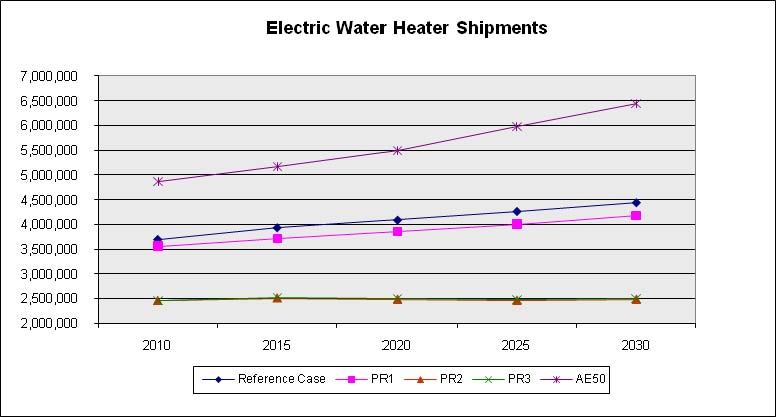
Validation of Direct Natural Gas Use to Reduce CO2 Emissions
LIST OF FIGURES
Figure 1 Gas and Electric CO2 Emission Trends in Residential and Commercial Buildings ...................... 3
Figure 2 Energy Use Trends 1950 – 2007 in Residential and Commercial Buildings ................................ 4
Figure 3 NEMS Model................................................................................................................................. 7
Figure 4 Residential and Commercial Consumption - PR3 Change from Reference Case ....................... 10
Figure 5 Residential Gas Use per Customer – Gas Subsidy Scenarios Change from Reference Case ...... 10
Figure 6 Total Delivered Energy: All Sectors .......................................................................................... 11
Figure 7 CO2 Emissions for all Scenarios .................................................................................................. 12
Figure 8 Residential and Commercial Energy Expenditures Change from Reference Case ..................... 13
Figure 9 Energy Expenditures Change from Reference ............................................................................ 14
Figure 10 CO2 Emission Reduction Relative to the Reference Case ......................................................... 15
Figure 11 Cost per Tonne of CO2 Reduction ............................................................................................. 16
Figure 12 Dry Natural Gas Production ...................................................................................................... 19
Figure 13 Residential Natural Gas Prices .................................................................................................. 20
Figure 14 Commercial Natural Gas Prices ................................................................................................ 21
Figure 15 Generation Capacity Impacts..................................................................................................... 22
Figure A-1 Primary Energy Consumption……………………………………………………………….. 25
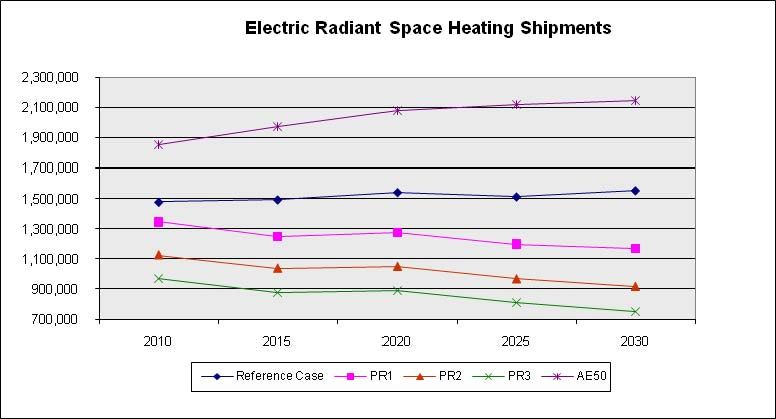
Figure A-2 Natural Gas Space Heating Shipments………………………………………………………. 35
Figure A-3 Electric Radiant Space Heating Shipments………………………………………………….. 35
Figure A-4 Natural Gas Heat Pump Shipments………………………………………………………….. 36
Figure A-5 Electric Heat Pump Space Heating Shipments……………………………………………….36
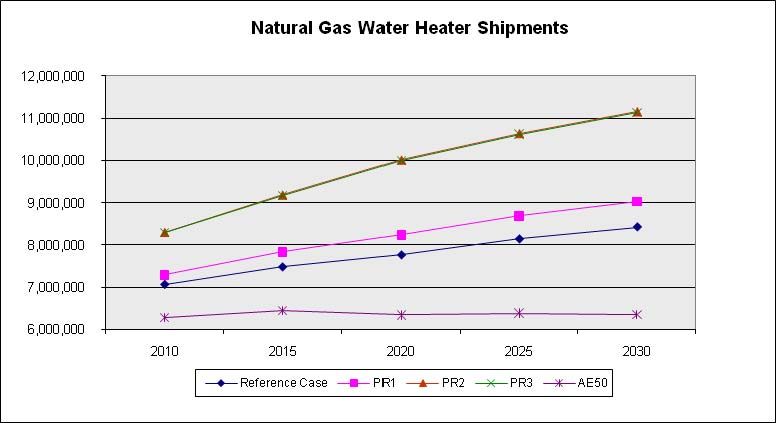
Figure A-6 Natural Gas Water Heater Shipments………………………………………………………...37
Figure A-7 Electric Water Heater Shipments……………………………………………………………. 37
Figure A-8 Natural Gas Furnaces Stock…………………………………………………………………. 38
Figure A-9 Electric Resistance Space Heating Stock……………………………………………………. 39
Figure A-10 Electric Heat Pump Stock………………………………………………………………….. 39
Figure A-11 Market Share of Natural Gas Space Heating………………………………………………. 41
Figure A-12 Market Share of Electric Space Heating…………………………………………………… 41
Figure A-13 Market Share of Electric Resistance Space Heating……………………………………….. 42
Figure A-14 Market Share of Electric Heat Pump Space Heating………………………………………. 42
Figure A-15 Market Share of Natural Gas Water Heaters……………………………………………….. 43
Figure A-16 Market Share of Electric Water Heaters…………………………………………………….43
Figure A-17 Total Energy Demand: Electricity vs. Natural Gas………………………………………... 44
Figure A-18 Residential Natural Gas Demand…………………………………………………………... 45
Figure A-19 Residential Purchased Electricity Demand………………………………………………… 45
Figure A-20 Commercial Natural Gas Demand…………………………………………………………. 46
Figure A-21 Commercial Purchased Electricity Demand………………………………………………...46
Figure A-22 Residential Total Energy Expenditure………………………………………………………48
Figure A-23 Commercial Total Energy Expenditure…………………………………………………….. 48
Figure A-24 Generation Impacts: PR1…………………………………………………………………...50
Figure A-25 Generation Impacts: PR2…………………………………………………………………...50
Figure A-26 Generation Impacts: PR3…………………………………………………………………...51
Figure A-27 Generation Impacts: AE50………………………………………………………………… 51
Figure A-28 Electricity Generation……………………………………………………………………….52
Figure A-29 Generating Capacity………………………………………………………………………... 52
Figure A-30 Total Energy Production…………………………………………………………………… 53
Figure A-31 Dry Natural Gas Production………………………………………………………………... 53
Figure A-32 Coal Production…………………………………………………………………………….. 54
Figure A-33 Biomass Production………………………………………………………………………… 54
iv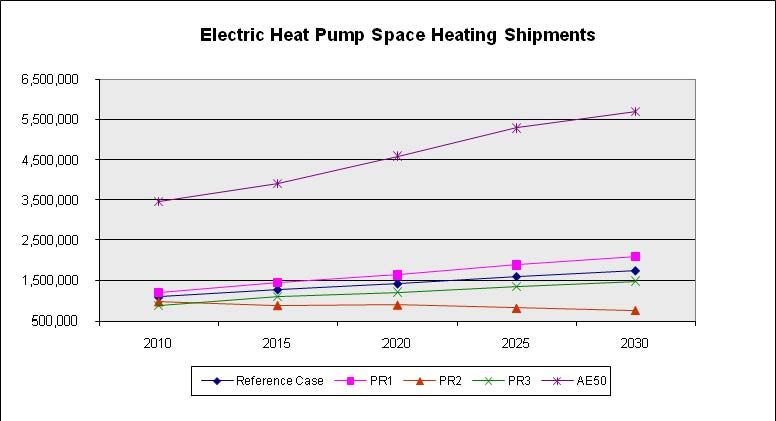
Validation of Direct Natural Gas Use to Reduce CO2 Emissions

Figure A-34     Residential Natural Gas Prices……………………………………………………………... 55
Figure A-35     Residential Electricity Prices………………………………………………………………. 56
Figure A-36     Commercial Natural Gas Prices……………………………………………………………. 56
Figure A-37     Commercial Electricity Prices……………………………………………………………… 57
Figure A-38     Residential Natural Gas Consumption 2030……………………………………………….. 58
Figure A-39     Residential Natural Gas Consumption 2030 - Change from Reference Case……………… 58
Figure A-40     Commercial Natural Gas Consumption 2030……………………………………………… 60
Figure A-41     Commercial Natural Gas Consumption 2030 - Change from Reference Case……………. 60
Figure A-42     Natural Gas Demand 2030 - New England………………………………………………… 61
Figure A-43     Natural Gas Demand 2030 - Mid Atlantic…………………………………………………. 62
Figure A-44     Natural Gas Demand 2030 – E. North Central…………………………………………….. 62
Figure A-45     Natural Gas Demand 2030 - W North Central……………………………………………... 63
Figure A-46     Natural Gas Demand 2030 - S Atlantic……………………………………………………. 63
Figure A-47     Natural Gas Demand 2030 - E South Central……………………………………………… 64
Figure A-48     Natural Gas Demand 2030 - W South Central……………………………………………... 64
Figure A-49     Natural Gas Demand 2030 – Mountain……………………………………………………. 65
Figure A-50     Natural Gas Demand 2030 – Pacific……………………………………………………….. 65
Figure A-51     Electric Resistance Furnace Stock 2005 by Census Division……………………………… 66
Figure A-52     Electric Resistance Furnace Average Yearly Electricity Use 2005 by Census Division….. 66
Figure A-53     Electric Heat Pump Stock 2005 by Census Division………………………………………. 67
Figure A-54     Electric Heat Pump Average Yearly Electricity Use 2005 by Census Division…………… 67

                                                     LIST OF TABLES

Table 1 NEMS-DGU Model Scenario Descriptions .................................................................................... 8
Table 2 Power Plant Capital Cost Savings from Reduction in GW ........................................................... 17
Table 3 Water Heater Fuel Switching and Thermal Envelope Upgrade Options for New Homes ............ 18
Table A-1 Cost of Gas Retrofits…………………………………………………………………………. 33

                                                                v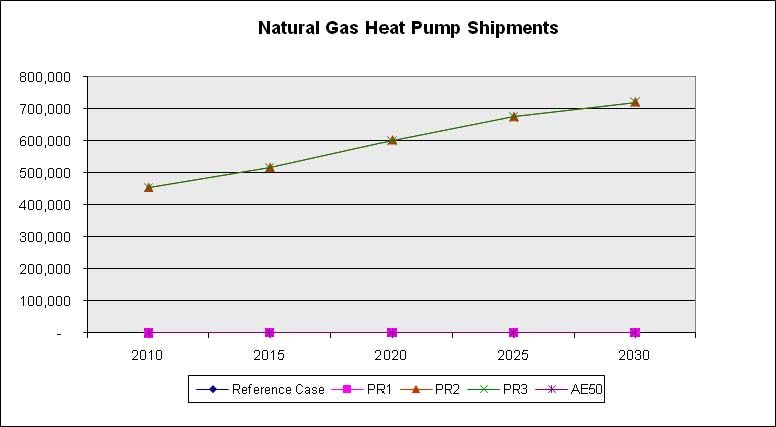
Validation of Direct Natural Gas Use to Reduce CO2 Emissions

1.0       Executive Summary

     This study analyzes the benefits of increased “direct use” of natural gas as a cost-effective
mechanism to assist the nation in achieving two key goals: (1) increase the nation’s full fuel cycle energy
efficiency; and (2) reduce national greenhouse gas (GHG) emissions. Objectives of this study were to:
      •    Assess end use efficiency, national CO2 emission reductions, primary energy savings, and
           consumer cost savings through encouraging direct use of natural gas to displace less efficient
           practices by creating economic incentives for equipment and educating consumers to gain
           immediate benefits, and providing new technologies through R&D investments for sustainable
           long term benefits.
      •    Compare the merits of increased direct gas use relative to other options to meet national energy
           efficiency and CO2 emission reduction goals. In particular, compare the relative merits of
           providing a comparable level of subsidies to direct use of natural gas for space and water heating
           versus electric end-use resistance heating and water heating technologies.
     The analysis used the National Energy Modeling System (NEMS), the model used by the Energy
Information Administration (EIA) to provide national energy forecasts in the Annual Energy Outlook
(AEO) and to analyze energy and environmental legislation upon request by Congress. The term
“NEMS-DGU” (Direct Gas Use) is used in this report to distinguish use of the model in this project from
uses by EIA. The NEMS-DGU analysis included three complementary and additive scenarios (PR1,
PR2, and PR3) that encouraged direct use of natural gas as a part of a national energy and CO2 emission
reduction strategy, and a fourth scenario (AE50) that investigated the impact of an aggressive (50%)
subsidy of electric end use technologies. The NEMS-DGU model calculated energy, cost, and CO2
emission changes from 2010 through 2030 under these scenarios compared to the EIA AEO 2008
Reference Case.
      Conclusions from this study include:
      •    The increased direct use of natural gas will reduce primary energy consumption, consumer energy
           costs, and national CO2 emissions compared to the AEO2008 Reference Case (“business-as-
           usual”)
      •    Subsidies provided to increase the direct use of natural gas will provide greater benefits than
           comparable subsidies to electric end-use technologies with respect to reducing primary energy
           consumption, consumer energy costs and national CO2 emissions.
      •    Subsidies provided to increase the direct use of natural gas, together with increased efforts in
           consumer education and R&D funding, in comparison to the AEO2008 Reference Case, will
           provide the following benefits by 2030:
           o   1.9 Quads energy savings per year
           o   96 million metric tons CO2 emission reduction per year
           o   $213 billion cumulative consumer savings
           o   200,000 GWh electricity savings per year
           o   50 GW cumulative power generation capacity additions avoided, with avoided capital
               expenditures of $110 billion at $2,200/kW.
      •    By 2030, the benefits derived from subsidies to increase the direct use of natural gas
           significantly exceed those with respect to comparable subsidies to electric end-use technologies

                                                      Page 1
Validation of Direct Natural Gas Use to Reduce CO2 Emissions
in four out of the five categories above (all except for cumulative consumer savings, due to the
assumption of the conversion from oil and distillate fuel to electricity in that scenario).
• The natural gas subsidy scenario PR3 shows a 3.7% increase in residential gas prices and little
increase in commercial gas prices compared to the Reference Case by 2030. Natural gas prices
fall in the electric subsidy scenario while electric prices are unchanged compared to the Reference
Case.
• A direct natural gas use subsidy has significantly lower gross cost to reduce a metric ton (tonne)
of CO2 than an electric end use equipment subsidy or a building insulation retrofit subsidy.
Avoided cost of new power plant construction as well as consumer savings from efficient natural
gas direct use can result in a substantial net societal savings from direct gas use, especially in new
construction markets.
• Retrofit markets pose unique challenges for direct gas use CO2 emission or primary energy
reduction strategies. The high installed cost of retrofit of gas technologies (especially for electric
homes and multifamily dwellings) compared to new construction as well as variability of retrofit
costs complicates economics and incentive strategies. It will be critical to focus on the most
attractive regions and market segments to minimize the net cost per tonne in retrofit markets.
• The natural gas end use equipment subsidy will increase the amount of natural gas used in the
commercial and residential end use market, but it will result in reduced fossil fuel production and
a net reduction in CO2 emissions. This is because of the better full cycle efficiency of natural gas
end use equipment coupled with the resultant power generation fuel mix.
• While the three natural gas end use equipment subsidy scenarios will result in a moderate
increase in natural gas consumption reporting by Local Distribution Companies (LDCs), the per
capita consumption declines. The reduction in natural gas usage per residential customer ranges
from 3 to 12% by 2020.
Page 2Validation of Direct Natural Gas Use to Reduce CO2 Emissions
2.0 Background
2.1 Energy and Emissions Trends
Buildings consume nearly 40 percent of the primary energy resources and 74 percent of the
electricity generated each year in the United States1. Homes and commercial businesses have been
growing contributors to CO2 emissions for the last 15 years – a trend that is projected to continue for the
next two decades. As shown in Figure 1and Figure 2, the increasing CO2 emissions from residential and
commercial buildings are being driven by growing consumption of electricity, including generation
losses. Much of the increased CO2 emissions from residential and commercial electricity use comes from
power plants and the relatively inefficient “full fuel cycle” of extraction, processing, transportation,
production, and delivery of electricity to the buildings. In contrast, CO2 emissions per residential natural
gas customer have fallen by 40% since 1970, and total CO2 emissions have been flat in spite of an
increase from 38 million customers in 1970 to 65 million customers in 2007. Aggregate CO2 emissions
from natural gas consumption in U.S. buildings are currently at 1990 levels. Due to continued efficiency
improvements, they are projected to remain nearly flat through 2030 despite continuing growth in the
number of gas customers.
Residential and Commercial CO2 Emission Trends
3000
Natural Gas Electricity
Million Metric Tons CO2
2500
2000
1500
1000
500
0
1990 1995 2000 2005 2010 2015 2020 2025 2030
Source: www.eia.doe.gov/oiaf/1605/ggrpt/excel/historical_co2.xls; EIA Annual Energy Outlook 2009
Figure 1 Gas and Electric CO2 Emission Trends in Residential and Commercial Buildings
1 DOE. 2008. Annual Energy Review 2007, (DOE/EIA-0384(2007)). Washington, D.C. Energy
Information Administration, U.S. Department of Energy.
Page 3Validation of Direct Natural Gas Use to Reduce CO2 Emissions
Residential & Commercial Energy Use
(1) Energy lost during generation, transmission, and distribution of electricity
Figure 2 Energy Use Trends 1950 – 2007 in Residential and Commercial Buildings2
2.2 Why is Full Fuel Cycle Analysis Needed?
Traditionally, residential and commercial energy use discussions have been focused on end use
equipment efficiency. With the advent of the discussions of Global Climate Change and more
sophisticated modeling that identifies full cycle energy use, there has been an awareness that the simple
end use efficiency metric that has been in place for over 30 years is insufficient as a tool to measure and
predict outcomes that society is facing. It is important to define and differentiate alternative metrics that
describe energy use and emissions.
The terminology for energy efficiency and emissions metrics used in this report reflect the language
used in current legislative initiatives and industry analysis. Those terms are summarized below and
presented in more detail in Appendix A.1.
• CO2 emission reduction is used to describe the reduction of airborne CO2 produced. It differs
from the term carbon output, which includes any other direct emissions of greenhouse gases
during normal use such as CH4, HFC’s, PFC’s, and SF6. CO2 represents approximately 85% of
total greenhouse gas emissions.
• Full fuel cycle (or source) energy efficiency accounts for the cumulative impact of extraction,
processing, transportation, generation, transmission, and distribution losses on overall energy
usage. Unlike site energy efficiency, full fuel cycle is useful for hybrid and multi-fuel
consumption calculations. Full fuel cycle means that for every Btu of primary energy usage in
the coal mine, only 26%-38% of the energy value gets delivered to the customer. In contrast for
every Btu of natural gas in the well, 91% of the energy value gets delivered to the customer.
Full fuel cycle energy efficiency shows the impact of a scenario on the nations primary energy
consumption. Primary energy consumption is defined by the EIA as the total consumption of
petroleum, cola, natural gas, biomass, hydro, and nuclear power. Source energy efficiency is
considered the same as full fuel cycle energy efficiency since both metrics consider extraction,
processing, and transportation energy requirements. These metrics show that the direct use of
2 DOE. 2008. Annual Energy Review 2007, (DOE/EIA-0384(2007)). Washington, D.C. Energy
Information Administration, U.S. Department of Energy.
Page 4Validation of Direct Natural Gas Use to Reduce CO2 Emissions
natural gas by residential, commercial, and industrial users is far more energy efficient than the
traditional use of coal or natural gas to produce electricity, which then must be delivered for use
by homes, businesses, and industries. Full fuel cycle efficiency metrics do have the drawback
that they are difficult to measure in the laboratory and are thus difficult to standardize.
• Site energy efficiency metrics, such as AFUE3, are useful for comparing equipment of the same
fuel type in an efficiency rating system. These metrics, however, give incomplete information
by omitting energy needed to produce and transport the appliance energy to the site. They do not
allow direct comparison of appliances using different fuels (e.g., gas versus electric water
heaters). Appliance efficiency and end-use efficiency metrics are also commonly used and have
the same drawbacks.
• Energy cost or site energy cost is based on site energy consumption by fuel type as well as peak
energy demand for electricity in many buildings. Energy cost is sometimes used as a proxy for
energy efficiency in hybrid and multi-fuel appliance consumption calculations.
• Energy security is a term in common use that describes the national security derived from
domestic production of energy with domestic fuel sources such as coal and natural gas to the
exclusion of imported fuels from U.S. trading partners. Energy security considerations drive
decision-making outside the realm of economics and infrastructure issues and into the political
arena. For this analysis, energy security impacts were not considered.
3 Annual Fuel Utilization Efficiency
Page 5Validation of Direct Natural Gas Use to Reduce CO2 Emissions
3.0 Project Overview
3.1 Objectives
This study analyzes the benefits of increased “direct use” of natural gas as a cost-effective
mechanism to assist the nation in achieving two key goals: (1) increase the nation’s full fuel cycle energy
efficiency; and (2) reduce national greenhouse gas (GHG) emissions. Objectives of this study were to:
• Assess end use efficiency, national CO2 emission reductions, primary energy savings, and
consumer cost savings through encouraging direct use of natural gas to displace less efficient
practices by creating economic incentives for equipment and educating consumers to gain
immediate benefits, and providing new technologies through R&D investments for sustainable
long term benefits.
• Compare the merits of increased direct gas use relative to other options to meet national energy
efficiency and CO2 emission reduction goals. In particular, compare the relative merits of
providing a comparable level of subsidies to direct use of natural gas for space and water heating
versus electric end-use resistance heating and water heating technologies.
3.2 Scope of Work
The scope of this project was to use the NEMS-DGU model to determine the impact of three
investment options that support the direct use of natural gas to reduce production of CO2 chiefly produced
by electric power generation and consumption. The project provides the core modeling and other
analyses needed to provide a firm analytical underpinning for the benefits of increased direct use of
natural gas described above, and form the basis for use of the information for educational purposes
intended to provide scientific data for the development of local, state, or U.S. climate change policy and
associated incentives. This analysis can also expand the base of support for this proposition to others
beyond the natural gas industry.
3.3 Approach
3.3.1 Project Team and Modeling Approach
GTI teamed with Science Applications International Corporation (SAIC) for this project. SAIC
executed all NEMS-DGU model runs, performed analysis of results, and contributed key input to
meetings and reports.4 GTI provided input on scenarios, modeling assumptions, and analysis, prepared
presentations and reports, and provided overall program management. The steering team provided
guidance on program needs, external stakeholder involvement, and publication.
Figure 3 shows the NEMS model. NEMS is a national, economy-wide, integrated energy model that
analyzes energy supply, conversion, and demand. EIA uses NEMS to provide U.S. energy market
forecasts through 2030 in the EIA Annual Energy Outlook. The residential and commercial modules
4 SAIC is a FORTUNE 500® scientific, engineering and technology applications company that uses its deep domain knowledge
to solve problems of vital importance to the nation and the world, in national security, energy and the environment, critical
infrastructure, and health.
SAIC is a policy-neutral organization. SAIC executed the NEMS model in this project using input assumptions provided by the
project sponsor organizations and companies. Analysis provided in this report is based on the output from the NEMS model as a
result of the project sponsors’ input assumptions. The input assumptions, opinions and recommendations in this report are those
of the project sponsors, and do not necessarily represent the views of SAIC.
Page 6Validation of Direct Natural Gas Use to Reduce CO2 Emissions
were the focus of this study and inputs were modified as necessary to meet the objectives of each
scenario. The other 10 modules used Reference Case values for all scenarios. Impact to the environment,
consumers, and the natural gas industry was considered and is provided in the tables below and in
Appendix A.5 of this report.
3.3.2 Scenario Descriptions
The project base case is the AEO2008 Reference Case with modifications to the residential and
commercial data input files depending on the scenario to be examined. Table 1 shows the three scenarios
that subsidize natural gas direct use and an alternate scenario that subsidizes electric equipment. Each
scenario builds on the prior scenario, encompassing the assumptions of its predecessor. The following
discussion provides more details on each scenario.
Figure 3 NEMS Model
Page 7Validation of Direct Natural Gas Use to Reduce CO2 Emissions
Table 1 NEMS-DGU Model Scenario Descriptions
Scenario Description
PR1 40% Natural Gas Subsidy
PR2 Natural Gas Education
PR3 Natural Gas R&D
AE50 50% Electric Equipment Subsidy
PR1: 40% Natural Gas Subsidy
This scenario encourages the acquisition and use of natural gas appliances and discourages purchase
of their electric counterparts. The methodology specifically imposed in the modeling was to:
• Reduce capital costs of the most-efficient NG appliances & equipment by 40% through a societal
subsidy such as a rebate or tax credit;
• Eliminate incremental costs of fuel switching (e.g. the cost of connecting to natural gas); and,
• Impose an economic disincentive as a reflection of a policy decision to discourage the use of
electric resistance space & water heating systems.
PR2: Natural Gas Education
This scenario, which includes the changes made in PR1, attempts to reflect the impact of education
and promotion programs intended to improve the perception of natural gas. This is more difficult to
quantify than the changes made in the other scenarios in that there is no cost/impact lever in NEMS that
would motivate such a change. However, there are behavioral parameters in the model that can be
changed to reflect behavior modification efforts. Accordingly, changes to the behavioral input files are
made with the understanding that consumer response may be both unpredictable and transitory.
• Increases percentage of new and existing residential and commercial facilities capable of using or
switching to NG
• Modifies bias parameters related to users’ favorable perception of natural gas
PR3: Natural Gas R&D
This scenario, which includes scenarios PR1 and PR2, adds the estimated impact of future cost
reduction and increased efficiency through R&D on natural gas heat pumps and combined heat and power
(CHP) systems. Increased R&D reduces the cost and increases the efficiency of the specified systems.
• Reduced cost, increased efficiencies and tax incentives for CHP systems (commercial users only)
• Reduced cost and increased efficiencies for natural gas heat pumps
AE50: 50% Electric Equipment Subsidy
For the purpose of comparison, this study also included a scenario with the aggressive promotion of
electricity at the expense of other fuels, particularly natural gas. This scenario was designed to mirror for
electricity, to the extent possible, the conditions in the PR1 and PR2 natural gas scenarios.
• Reduces capital cost of electric appliances and equipment by 50%
Page 8Validation of Direct Natural Gas Use to Reduce CO2 Emissions
• Encourages electricity in the fuel-choice decision for all appliances
• Other electric incentives that mirror PR1 and PR2 natural gas incentives
Page 9Validation of Direct Natural Gas Use to Reduce CO2 Emissions
4.0 Results and Discussion
Key findings by topic area are provided below. More detailed charts and comparisons are provided
in Appendix A.
4.1 Impact on Building Energy Consumption
Figure 4 shows that direct use causes an increase in natural gas residential and commercial
consumption. The impact on the residential sector is triple the impact on the commercial sector because
residential has greater flexibility in fuel choice. Reduction in electric consumption is less as a percentage
because of the higher baseline usage. While the three natural gas end use equipment subsidy scenarios
will result in increased natural gas consumption reporting by LDCs, the per capita natural gas usage will
go down. Figure 5 shows that the per capita reduction from residential customers ranges from 3 to 12%
by 2020 for the gas subsidy scenarios.
Residential and Commercial Natural Gas and Electricity Consumption
PR3 Scenario: % Change from Reference Case
20%
15%
10%
5%
0%
-5%
-10%
-15%
2005 2010 2015 2020 2025 2030
NG: Residential NG: Commercial
Electricity: Residential Electricity: Commercial
Figure 4 Residential and Commercial Consumption - PR3 Change from Reference Case
Figure 5 Residential Gas Use per Customer – Gas Subsidy Scenarios Change from Reference Case
Page 10Validation of Direct Natural Gas Use to Reduce CO2 Emissions
4.2 Impact on National Energy Consumption
Figure 6 shows that expanded direct gas use decreases total primary energy demand by up to 1.9
Quadrillion Btu’s by 2030 due to reduction in electricity consumption with lower full fuel cycle
efficiency. All natural gas scenarios decrease demand more than the electric subsidy scenario, AE50, due
to the differences in full fuel cycle efficiency between gas and electric resistance space heating and water
heating.
Figure 6 Total Delivered Energy: All Sectors
Page 11Validation of Direct Natural Gas Use to Reduce CO2 Emissions
4.3 Impact on CO2 Emissions
Figure 7 shows a key result of this study: National CO2 emissions are reduced significantly by
implementing a strategy of rational fuel switching to natural gas end use in buildings. The net CO2
emission reduction is due to lower electricity consumption in the buildings sector and associated full fuel
cycle emission reductions. Emissions are reduced for each of the three scenarios in this model, with the
largest reduction provided by PR3 – the cumulative effect of gas incentives, consumer education, and
R&D investments. The aggregate effect of the incentives is a reduction of 96 million metric tons (MMT)
of CO2 per year in 2030, which represents a 3.3% emission reduction from the buildings sector. The net
annual benefit of the incentives grows with time, from 53 MMT per year in 2015 to 96 MMT in 2030, as
national demand for energy increases.
CO2 Emissions (MMT Equivalent)
7,000
6,800
6,600
6,400
6,200
6,000 Reference PR1 PR2
PR3 AE50
5,800
2005 2010 2015 2020 2025 2030
Figure 7 CO2 Emissions for all Scenarios
Page 12Validation of Direct Natural Gas Use to Reduce CO2 Emissions
4.4 Cumulative Consumer Savings
Figure 8 and Figure 9 show cumulative consumer savings compared to the Reference Case through
2030. Direct natural gas use provides residential and commercial consumers $120 - $150 billion
cumulative savings, $30 - $60 billion more savings than the electric subsidy scenario, while total national
energy expenditures show a more significant reduction for all scenarios, with the electric subsidy scenario
having more national energy savings than the natural gas subsidy scenarios due to the conversion of 78%
of the “Distillate Fuel Oil and LP Gases” consumption to electricity in the residential sector in this
scenario. .
Figure 8 Residential and Commercial Energy Expenditures Change from Reference Case
Page 13Validation of Direct Natural Gas Use to Reduce CO2 Emissions
Figure 9 Energy Expenditures Change from Reference
4.5 Cost per Tonne of CO2 Emission Reduction
Figure 10 shows the CO2 emission reductions for each scenario relative to the Reference Case. As
expected, the greatest incremental impact of the three natural gas subsidy scenarios is produced by
Scenario PR1 (incentives). In 2030, more than 50% of the net benefit is provided by that scenario – a
reduction of approximately 50 MMT per year. Scenario PR2 (incentives and education) provides the rest
of the net benefit until 2025 when the incremental impact of education is reduced and Scenario PR3
(incentives, education, and advanced technology due to R&D) has a higher net benefit. The impact of the
three scenarios grows steadily until 2025 and then stays slightly below 100 MMT per year through 2030.
Scenario AE50, the electric incentives and education equivalent to PR2, provides initial CO2
emission reduction as less efficient electric appliances are replaced with more efficient electric
technologies, but the net benefit is reduced to near zero in 2030 for reasons that cannot be explained by
the aggregate value provided by the NEMS model. Possible factors include fuel mix changes for
electricity generation, or replacement of oil and LP equipment by electric equipment. Policies that
include natural gas incentives and education are much more effective in providing sustainable CO2
emissions reductions than similar electric incentives and education – a difference of approximately 65
MMT per year in 2030.
Page 14Validation of Direct Natural Gas Use to Reduce CO2 Emissions
CO2 Emissions
Reductions from Reference Case
120
100
MMT CO2 Equivalent
80
60
40
20
0
2010 2015 2020 2025 2030
PR1 PR2 PR3 AE50
Figure 10 CO2 Emission Reduction Relative to the Reference Case
Page 15Validation of Direct Natural Gas Use to Reduce CO2 Emissions
Figure 11 compares the gross subsidy cost per tonne of CO2 emission reduction over time of the
three gas subsidy scenarios and the electric subsidy scenario. The gross cost per tonne of the electric
subsidy scenario for the five years ending in 2030 is more than an order of magnitude higher than the cost
of any of the three gas subsidy scenarios. Figure 11 also shows that the gross gas subsidy cost per tonne
of CO2 emission reduction declines over time as the impact of behavior, incentives, and technology
development spreads in the marketplace. The gross cost per tonne of the AE50 scenario falls for a period
of time as efficient electric technology market penetration increases, but rises as the generation fuel mix
changes and market saturation reduces the incremental reduction opportunities. These costs do not
represent the total societal cost or savings of the scenarios, but do provide a relative indicator of which
options are likely to be more cost-effective when other societal savings, such as avoided power plant
construction, are included in the analysis.
Figure 11 Cost per Tonne of CO2 Reduction
Page 16Validation of Direct Natural Gas Use to Reduce CO2 Emissions
Societal benefits of direct gas use in scenario PR3 include eliminated or deferred cost of electricity
generation that would have been needed otherwise. As summarized in Table 2, approximately 50 GW of
electric power generation is eliminated in scenario PR3, for a total cumulative capital cost savings of
$111 billion (an average cost of $2,200/kW). The 1,496 MMT cumulative CO2 emission reduction
compared to the Reference Case results in a societal savings of approximately $74/tonne of CO2. This
societal savings offsets the gross societal cost of the subsidy to obtain the benefits of direct gas use.
Cumulative consumer energy cost savings through 2030 associated with the PR3 scenario are $213
billion. This represents an additional societal savings of $142/tonne of CO2. Inclusion of these societal
savings more than offsets the gross cumulative subsidy cost per tonne of the PR3 scenario, creating a
significant net societal benefit.
Table 2 Power Plant Capital Cost Savings from Reduction in GW
Cumulative Total Capital
Reduction Capital Costs Cumulative CO2 $/Tonne
Power Plant in GW Built Cost Avoided Reduced, PR3 CO2
Description Fuel Source (2030) ($/kW) ($ M) Case (MMT) Savings
Steam Turbine Coal 11.0 700 7,700
Steam Turbine Natural Gas 6.5 500 3,250
Combined Cycle Natural Gas 2.7 650 1,755
Turbines
Combustion Turbines Diesel 10.9 1,500 16,350
Nuclear Power Plants Nuclear 11.0 3,500 38,500
Renewables Central Renewables 3.5 10,000 35,000
Station
Distributed Natural gas 4.3 2,000 8,600
Generation
Totals 49.9 N/A 111,155 1,496 74
Page 17Validation of Direct Natural Gas Use to Reduce CO2 Emissions
Another option available in the residential market to reduce CO2 emissions is improved performance
of the thermal envelope. The NEMS-DGU model was not suitable for evaluating installed costs for this
option. An alternative simulation analysis was conducted using GTI’s Residential Energy Efficiency
Wizard, an hourly simulation tool that evaluates the installed cost and energy savings of energy efficiency
improvement options. The analysis compared installed cost and energy savings for envelope
improvements and substituting gas for electric water heater in representative cities in each of the nine
U.S. census regions. The incremental cost of envelope upgrades in new construction was compared to the
incremental cost of installing a gas water heater rather than an electric water heater to determine which
option is likely to be more cost-effective.
Table 3 provides a snapshot of the cost per tonne of CO2 emission reduction for a water heater
upgrade from electric to natural gas and an insulation upgrade for the attic and wall in a major city in each
census region. On a national average basis, the incremental cost of a gas water heater over electric water
heating as an upgrade in new construction produces a gross cost per tonne of CO2 emission reduction of
$84. Upgrading insulation as a new construction choice produces a gross cost per tonne of CO2 emission
reduction over $1,200 on a national average basis. This suggests that rational fuel switching to natural
gas water heating in new construction would likely be an order of magnitude more cost-effective than an
envelope upgrade as a national CO2 emission reduction strategy.
For a retrofit of gas appliances or insulation into an existing building there are many possible
scenarios to be considered that likely would increase installed cost significantly. Appendix A.3 provides
further information on the retrofit costs of gas furnaces and water heaters as well as insulation. This
analysis shows the importance of making good decisions on fuel choice and level of insulation when the
home is first built.
Table 3 Water Heater Fuel Switching and Thermal Envelope Upgrade Options for New Homes
Water Heater Upgrade Thermal Envelope
Cost/Tonne of CO2 Upgrade Cost/Tonne of
City Census Region Reduced ($) CO2 Reduced ($)
Boston New England 57 1,124
New York Mid Atlantic 98 1,256
Indianapolis E. N. Central 29 1,061
Omaha W. N. Central 38 987
Atlanta S. Atlantic 46 1,610
Nashville E. S. Central 51 1,354
Dallas W. S. Central 48 1,642
Denver Mountain 32 1,132
Seattle Pacific ‐‐‐‐ 1,304
Page 18Validation of Direct Natural Gas Use to Reduce CO2 Emissions
4.6 Impact on Natural Gas Production
Figure 12 shows the impact of each scenario on natural gas production compared to the Reference
Case. When direct use of natural gas is encouraged through subsidies, natural gas production increases by
up to 0.2 Quadrillion Btu’s. This is a relatively small change of about 1% in total natural gas production.
The electric subsidy scenario, however, reduces natural gas production 1.1 Quadrillion Btu’s, about 5% of
total natural gas production.
Dry Natural Gas Production
Change from Reference Case
600
400
200
0
Trill Btu's
-200
-400
-600
-800
-1,000
-1,200
2005 2010 2015 2020 2025 2030
PR1 PR2 PR3 AE50
Figure 12 Dry Natural Gas Production
Page 19Validation of Direct Natural Gas Use to Reduce CO2 Emissions
4.7 Impact on Natural Gas Prices
Figure 13 and Figure 14 show the impact of each scenario on natural gas prices. Residential
customers will see a slight price increase of 3.7% for the PR3 scenario relative to the Reference Case by
2030 as a result of increased gas demand, while commercial customers will see essentially no price
increase.
Residential Natural Gas Prices
13.5
13.0
12.5
2006$ / MMBtu
12.0
11.5
11.0
10.5
2010 2015 2020 2025 2030
Reference PR1 PR2 PR3 AE50
Figure 13 Residential Natural Gas Prices
Page 20Validation of Direct Natural Gas Use to Reduce CO2 Emissions
Commercial Natural Gas Prices
12.0
11.5
11.0
2006$ / MMBtu
10.5
10.0
9.5
9.0
2010 2015 2020 2025 2030
Reference PR1 PR2 PR3 AE50
Figure 14 Commercial Natural Gas Prices
Page 21Validation of Direct Natural Gas Use to Reduce CO2 Emissions
4.8 Impact on Electric Generation
Figure 15 shows generating capacity impacts from the Reference Case for all 4 scenarios in 2030.
PR1 through PR3 show reductions across all fuels whereas AE50 shows increases in required generation
capacity for all fuels with the combustion turbine/diesel category increasing most – all of which is due to
increased gas turbine generation. For generation impacts across generating sources for each scenario, see
Appendix A.5.6.
Figure 15 Generation Capacity Impacts
Page 22Validation of Direct Natural Gas Use to Reduce CO2 Emissions
5.0 Conclusions and Recommendations
The NEMS-DGU analysis supports prior CO2 emission reduction study results showing the benefit
of policies that encourage efficient direct natural gas use in certain residential and commercial market
applications. Strategies are ready for immediate implementation, and have low or negative net societal
cost per tonne.
As the cornerstone principle of any U.S. policy to reduce CO2 emissions, the country should first
ensure that it uses its existing energy sources in the most efficient way possible. Optimizing the use of
the nation’s current energy sources will increase energy efficiency by converting 26-38% full fuel cycle
efficiency for converting coal in the mine to electricity vs. 91% full fuel cycle efficiency for natural gas
from the wellhead to the appliance. Optimizing the use of the nation’s current energy sources will also
reduce primary energy demand by up to 1.9 Quadrillion Btu’s by 2030, avoid the need for over 40 GW of
electric generating capacity, and help to reduce the potential high cost of implementing legislation to
reduce GHG emissions.
GHG legislative initiatives will need to include appropriate stakeholder incentives for overall
emission reduction strategies that selectively reduce electricity consumption while increasing natural gas
use.
Further research is needed into cost-effective gas options with optimal CO2 reduction targeted to
building performance improvements, combined heat and power at the micro or macro level, and appliance
usage by market segment and region of the country. This information will provide further evidence of the
benefits of gas options to reduce national CO2 emissions.
Page 23You can also read


