A VISION FOR CLIMATE LEADERSHIP IN WASHINGTON, DC - Seizing the Economic, Climate, and Public Health Benefits of Electrifying WMATA's Transit Bus ...
←
→
Page content transcription
If your browser does not render page correctly, please read the page content below
A VISION FOR CLIMATE LEADERSHIP
IN WASHINGTON, DC
Seizing the Economic, Climate, and Public Health Benefits of
Electrifying WMATA’s Transit Bus Fleet

OCTOBER 2020
PARTNERS

 ACRONYMS
CNG            Compressed natural gas
CO2            Carbon dioxide
EPA            Environmental Protection Agency
GHG            Greenhouse gas emissions
IPCC           Intergovernmental Panel on Climate Change
PM             Particulate matter
WMATA          Washington Metropolitan Area Transit Authority

COVER PHOTO: ISTOCK/OLEKSANDR FILON

                                                                i
TABLE OF CONTENTS
ACRONYMS.  .  .  .  .  .  .  .  .  .  .  .  .  .  .  .  .  .  .  .  .  .  .  .  .  .  .  .  .  .  .  .  .  .  .  .  .  .  .  .  .  .  .  .  .  .  .  .  .  .  .  .  .  .  .  .  .  .  .  .  .  .  .  .  .  .  .  .  . i
EXECUTIVE SUMMARY .  .  .  .  .  .  .  .  .  .  .  .  .  .  .  .  .  .  .  .  .  .  .  .  .  .  .  .  .  .  .  .  .  .  .  .  .  .  .  .  .  .  .  .  .  .  .  .  .  .  .  .  .  .  .  . 1
1. Introduction .  .  .  .  .  .  .  .  .  .  .  .  .  .  .  .  .  .  .  .  .  .  .  .  .  .  .  .  .  .  .  .  .  .  .  .  .  .  .  .  .  .  .  .  .  .  .  .  .  .  .  .  .  .  .  .  .  .  .  .  .  .  .  .  . 5
        A.	 WMATA’s Fleet.  .  .  .  .  .  .  .  .  .  .  .  .  .  .  .  .  .  .  .  .  .  .  .  .  .  .  .  .  .  .  .  .  .  .  .  .  .  .  .  .  .  .  .  .  .  .  .  .  .  .  .  .  .  .  .  .  .  .  .  .  .  .  .  .  .  . 5
        B.	 Clean Energy DC Act Timelines and WMATA Bus Purchasing.  .  .  .  .  .  .  .  .  .  .  .  .  .  .  .  .  .  .  .  .  .  . 6
        C.	 Report Findings.  .  .  .  .  .  .  .  .  .  .  .  .  .  .  .  .  .  .  .  .  .  .  .  .  .  .  .  .  .  .  .  .  .  .  .  .  .  .  .  .  .  .  .  .  .  .  .  .  .  .  .  .  .  .  .  .  .  .  .  .  .  .  .  .  .  . 6
2. Cost Savings From WMATA Bus Fleet Electrification .  .  .  .  .  .  .  .  .  .  .  .  .  .  .  .  .  .  .  .  .  .  .  .  .  . 7
        A.	 Per-bus cost savings.  .  .  .  .  .  .  .  .  .  .  .  .  .  .  .  .  .  .  .  .  .  .  .  .  .  .  .  .  .  .  .  .  .  .  .  .  .  .  .  .  .  .  .  .  .  .  .  .  .  .  .  .  .  .  .  .  .  .  .  .  . 7
        B.	 Fleet-wide cost savings .  .  .  .  .  .  .  .  .  .  .  .  .  .  .  .  .  .  .  .  .  .  .  .  .  .  .  .  .  .  .  .  .  .  .  .  .  .  .  .  .  .  .  .  .  .  .  .  .  .  .  .  .  .  .  .  .  .  . 8
3. GHG Reductions From WMATA Bus Fleet Electrification.  .  .  .  .  .  .  .  .  .  .  .  .  .  .  .  .  .  .  .  .  .  . 9
        A.	 The climate crisis and summary of GHG reductions achievable .  .  .  .  .  .  .  .  .  .  .  .  .  .  .  .  .  .  .  .  . 9
        B.	 GHG emissions reductions per bus. .  .  .  .  .  .  .  .  .  .  .  .  .  .  .  .  .  .  .  .  .  .  .  .  .  .  .  .  .  .  .  .  .  .  .  .  .  .  .  .  .  .  .  .  .  .  .  . 9
        C.	 Fleet-wide GHG emissions reductions. . . . . . . . . . . . . . . . . . . . . . . . . . . . . . . . . . . . . . . . . . . . . 9
        D.	 Avoided social costs .  .  .  .  .  .  .  .  .  .  .  .  .  .  .  .  .  .  .  .  .  .  .  .  .  .  .  .  .  .  .  .  .  .  .  .  .  .  .  .  .  .  .  .  .  .  .  .  .  .  .  .  .  .  .  .  .  .  .  . 10
4. Public Health Savings of WMATA Bus Fleet Electrification .  .  .  .  .  .  .  .  .  .  .  .  .  .  .  .  .  .  .  . 11
        E.	 Public Health Impacts .  .  .  .  .  .  .  .  .  .  .  .  .  .  .  .  .  .  .  .  .  .  .  .  .  .  .  .  .  .  .  .  .  .  .  .  .  .  .  .  .  .  .  .  .  .  .  .  .  .  .  .  .  .  .  .  .  . 11
        F.	 Healthcare Cost Savings From WMATA Electrification. .  .  .  .  .  .  .  .  .  .  .  .  .  .  .  .  .  .  .  .  .  .  .  .  .  .  . 12
5. Summary and Recommendations. .  .  .  .  .  .  .  .  .  .  .  .  .  .  .  .  .  .  .  .  .  .  .  .  .  .  .  .  .  .  .  .  .  .  .  .  .  .  .  .  .  .  . 12
Endnotes.  .  .  .  .  .  .  .  .  .  .  .  .  .  .  .  .  .  .  .  .  .  .  .  .  .  .  .  .  .  .  .  .  .  .  .  .  .  .  .  .  .  .  .  .  .  .  .  .  .  .  .  .  .  .  .  .  .  .  .  .  .  .  .  .  .  .  .  .  . 16

  LIST OF FIGURES
Figure 2: Transit Electrification Commitments Across US. .  .  .  .  .  .  .  .  .  .  .  .  .  .  .  .  .  .  .  .  .  .  .  . 1
Figure 1: WMATA Metrobus Service Territory.  .  .  .  .  .  .  .  .  .  .  .  .  .  .  .  .  .  .  .  .  .  .  .  .  .  .  .  .  .  .  .  .  .  .  . 1
Figure 3: Total Cost of Ownership by Bus Type.  .  .  .  .  .  .  .  .  .  .  .  .  .  .  .  .  .  .  .  .  .  .  .  .  .  .  .  .  .  .  .  .  .  . 2
Figure 4: T
           otal Cost of Ownership and CO2 Emissions
          by WMATA Fleet Composition. .  .  .  .  .  .  .  .  .  .  .  .  .  .  .  .  .  .  .  .  .  .  .  .  .  .  .  .  .  .  .  .  .  .  .  .  .  .  .  .  . 2
Figure 6: Breakdown of Lifetime Cost of Ownership Per Bus by Fuel Type .  .  .  .  .  .  .  .  . 7
Figure 5: Composition of Current and Potential WMATA Fleets, by Fuel Type.  .  .  .  .  . 7
Figure 7: Lifetime Cost of Ownership Per Bus by Fuel Type and
          Cost Savings from Electrification.  .  .  .  .  .  .  .  .  .  .  .  .  .  .  .  .  .  .  .  .  .  .  .  .  .  .  .  .  .  .  .  .  .  .  .  .  .  . 8
Figure 8: AFLEET Total Cost of Ownership Across Fleet Scenarios. .  .  .  .  .  .  .  .  .  .  .  .  .  .  . 8
Figure 9: WMATA Annual CO2 Emissions per Bus by Type .  .  .  .  .  .  .  .  .  .  .  .  .  .  .  .  .  .  .  .  .  .  .  . 9
Figure 10: Annual WMATA Estimated Fleet-wide CO2 Emissions .  .  .  .  .  .  .  .  .  .  .  .  .  .  .  . 10
Figure 11: A
            nnual Fleet-wide CO2 Emissions and Percentage Savings
           Compared With Current WMATA Fleet. .  .  .  .  .  .  .  .  .  .  .  .  .  .  .  .  .  .  .  .  .  .  .  .  .  .  .  .  .  . 10
Figure 12: Annual Avoided Healthcare Costs by County.  .  .  .  .  .  .  .  .  .  .  .  .  .  .  .  .  .  .  .  .  .  .  .  . 12

                                                                                                                                                                                                                                       ii
EXECUTIVE SUMMARY
The Washington Metropolitan Area Transit Authority (WMATA) operates the
sixth-largest bus fleet in the United States, providing service to residents in
Washington, Maryland, and Virginia,1 with more than 130 million passenger
trips per year.2 By the fall of 2019, there were 528 fully electric buses in
service in the US — a 29 percent increase from 2018.3 WMATA currently has
one electric bus and a plan to test up to 14 more starting in 2021.
In this rapidly evolving landscape, WMATA has not            through 2030.4 But that fleet plan calls for WMATA to
kept pace with other major US cities such as New York,       purchase 100 new diesel or compressed natural gas
Chicago, and Seattle, all of which have committed to         (CNG) buses per year through 20255 and is now badly
fully electrify their public transit bus fleets by 2040 or   out-of-step with the 2018 Climate and Energy Action
before. Moreover, the 2018 Washington DC Climate and         Plan and the 2019 Clean Energy DC Act.
Energy Action Plan and the Clean Energy DC Omnibus
                                                             Figure 2: Transit Electrification Commitments Across US
Amendments Act (Clean Energy DC Act), signed in
January of 2019, call for drastic reductions in climate      CITY                         ELECTRIFICATION COMMITMENT6

pollution across numerous Washington, DC, sectors            Los Angeles                   2030
including public transit fleets. WMATA, however, is still    Santa Barbara                 2030
operating under a 2017 Fleet Management Plan that            Santa Monica                  2030
provides a 10-year roadmap for WMATA’s bus fleet             San Francisco                 2035
                                                             Chicago                       2040
Figure 1: WMATA Metrobus Service Territory
                                                             New York City                 2040
                                                             Portland                      2040
                                                             Seattle                       2040
                                                             Thankfully, WMATA finally appears poised to begin work
                                                             on fleet electrification by updating its fleet management
                                                             plan in 2020 and initiating an electric bus pilot program
                                                             in 2021, which will include a two-year pilot study, with
                                                             up to 14 electric buses, housed in up to three garages,
                                                             with bus delivery expected in 2021.7 Earlier this year, the
                                                             Federal Transit Administration awarded WMATA $4.1
                                                             million to purchase electric buses and related charging
                                                             infrastructure.8
                                                             While these are important first steps, bold action is
                                                             needed. Our organizations call on WMATA and its board
Source: WMATA, Fleet Management Plan at 1.                   of directors to publicly commit, as part of its updated
                                                             fleet management plan, to electrify 100 percent of the

A VISION FOR CLIMATE LEADERSHIP IN WASHINGTON, DC                                                                          1
Metrobus fleet on a clearly defined timeline and to put Figure 3: Total Cost of Ownership by Bus Type
sideboards on the electric bus pilot in order to ensure 1,800,000
that the agency moves forward in an efficient manner 1,600,000
without unnecessary delays. This report examines
1,400,000
WMATA’s opportunity for climate and public health
1,200,000
leadership given the size of its fleet, the clear call to
US DOLLARS
action from the Washington DC Council, and the visibility 1,000,000
afforded by its location in the nation’s capital and 800,000
surrounding areas.
600,000
As shown in Figures 3 and 4, below, and discussed more 400,000
fully in Sections II and III, electrification of WMATA’s bus
200,000
fleet will lead to substantial cost savings for WMATA
and corresponding reductions in climate pollution that 0
EV Diesel CNG Hybrid Diesel
benefit the public. As detailed in Section IV, electric Purcase Price Fueling Costs Maintenance and Operations
buses dramatically reduce particulate matter and NOx
Source: Argonne National Laboratory’s Model.
emissions, and thus reduce healthcare costs to DC area
residents. For each category of benefits — economic, Figure 4: Total Cost of Ownership and CO2 Emissions by
climate, public health — the faster and more robust WMATA Fleet Composition
2.5 160,000
the electrification, the greater the benefits to WMATA,
ESTIMATED TOTAL US DOLLARS (in billions)
Washington DC area residents, and the planet.
ESTIMATED TONS OF CO2 EMISSIONS
140,000
2
Electrifying WMATA’s bus fleet in line with Clean Energy 120,000
DC Act timelines would:
100,000
•
1.5
Save WMATA at least $350 million over the lifetime
80,000
of the fleet at 50 percent electric buses, with those
1
savings increasing with increasing electrification; 60,000
• Reduce greenhouse gas (GHG) emissions by more .5
40,000
than 58,000 tons of carbon dioxide (CO2) per year
20,000
by 2030 when 50 percent of the fleet is electrified
under the Clean Energy DC Act, with reductions 0
DC Clean Energy DC Clean Energy WMATA Plan Current
0
increasing as the fleet electrifies and the electric grid Act 2040
(90% Electricity)
Act 2030
(50% Electricity)
2030 WMATA Fleet
incorporates more clean energy;9 and AFLEET Calculated Total Cost CO2 emitted per year total
(billions of dollars) (short tons)
• Improve air quality and public health for Washington Source: Argonne National Laboratory’s Model.
DC area residents served by WMATA’s fleet, saving
In Figure 4, above, note that WMATA’s 2017 Fleet
those residents more than $8 million per year in
Management Plan, which, until it is updated later this
healthcare costs once the fleet is fully electrified.
year, provides the most recent publicly-available WMATA
• Provide opportunities for current bus drivers and fleet roadmap for the future of WMATA’s fleet composition,
maintenance staff to update their skills to operate would actually increase CO2 emissions compared with
and maintain the growing electric bus fleet, while its existing fleet by replacing diesel hybrid buses until
providing new training opportunities and greener the fleet is composed primarily of diesel and CNG buses.
jobs for workers from disadvantaged communities, (See Figure 5, below.)
thereby adding to the region’s economic base. Through
Our organizations call on WMATA to publicly commit to
electrification, WMATA has the opportunity to help
electrify its 1,500-plus fleet of transit buses at least as
protect the health and economic interests of the
quickly as the timeline set out in the Clean Energy DC
people in the communities it serves while promoting
Act — and ideally sooner. To achieve this timeline, our
the long-term economic viability of the WMATA bus
organizations call on WMATA to take the following steps
system.
to implement the requirements of the Washington DC
Climate and Energy Action Plan and the Clean Energy DC
Act:
A VISION FOR CLIMATE LEADERSHIP IN WASHINGTON, DC 2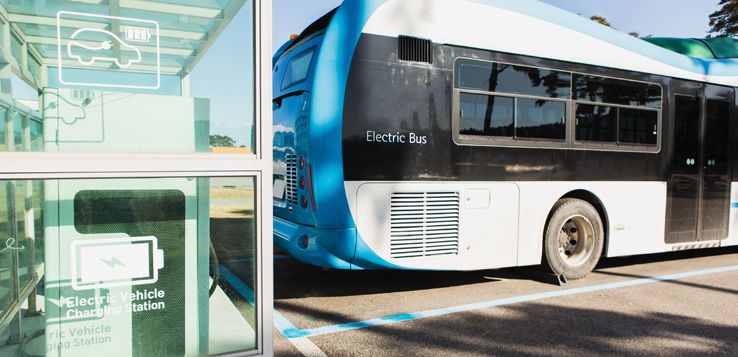
a. Publicly commit to electrifying its fleet along the          buses to electric buses. In some instances, this may
   lines of the Clean Energy DC Act’s timeline for public       require additional service to extend the useful life of
   buses:                                                       buses before retirement, but doing so would minimize
                                                                the risk of stranded assets should WMATA purchase
2030:        2035:             2040:        2045:
                                                                diesel buses now, only to have to retire those buses
50% electric 75% electric      90% electric 100% electric
                                                                earlier than planned to meet electrification goals.
Transit agencies in large cities and smaller municipalities     WMATA’s current fleet is composed overwhelmingly of
across the country are committing to fully electrify            buses from New Flyer, which is also one of the nation’s
their buses. With the recent commitments to 100%                leading manufacturers of electric buses.
electrification in public transit buses by California,        d. Immediately accelerate electric bus purchases as
Seattle, and New York, 33% of all transit buses in the US        soon as feasible, but not later than 2021. WMATA’s
are committed to go electric by 2045.10                          Zero Emissions Bus Update (Feb. 2020) indicates
b. Publicly release a transit bus electrification plan           its upcoming pilot likely won’t take delivery of the
   by the end Q1 2021. As WMATA begins its work on               first of its 14 buses until 2021. If WMATA has any
   electrification, it must replace the outdated 2017 fleet      realistic hope of achieving a 50 percent electric
   management plan. WMATA’s revised fleet plan should            fleet (approximately 750 buses) by 2030, it must
   identify a pathway to meet the Clean Energy DC                immediately ramp up purchases of electric buses.
   Act’s electrification timeline, including interim steps,   e. Prioritize the deployment of electric buses in
   necessary interjurisdictional coordination, timeframes        low- and moderate-income neighborhoods and
   for increasing electric bus purchases, and facilities         environmental justice communities to ensure
   upgrades. As part of that plan, WMATA should commit           the benefits of electrification quickly reach those
   to releasing an annual progress report identifying            most impacted by soot and other transportation-
   milestones, challenges, and ongoing actions that              related air pollution. WMATA should engage these
   facilitate rapid electrification.                             communities in the electric bus planning effort now in
c. Immediately begin phasing out the purchase of                 order to address residents’ concerns, communicate
   internal combustion buses and commit to purchase              the benefits of electrification, and ensure a smooth
   only electric buses beginning no later than January           transition to electric bus service.
   1, 2025. WMATA’s buses have a 15-year lifespan, and          WMATA's plans for an equitable and sustainable
   WMATA should take immediate steps to cancel or               electric bus future can and should be accomplished
   amend any existing purchase agreements in order to           without raising fares for the riders who depend on
   convert prospective purchases of new diesel or CNG           WMATA every day.

                                                                                                 PHOTO: ISTOCK/ SCHARFSINN86

A VISION FOR CLIMATE LEADERSHIP IN WASHINGTON, DC                                                                         3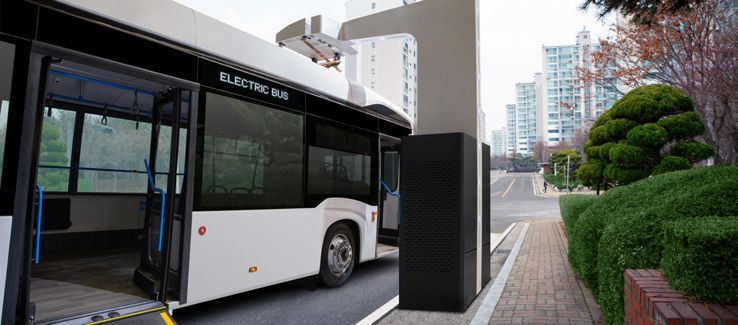
f. Create an internal team that reports directly to exec-       h. Collaborate with transit agencies that are
   utive leadership, is empowered to oversee the electri-          electrifying their bus fleets, such as those in large
   fication of the WMATA fleet, and will be accountable            cities like New York City, Los Angeles, Chicago, San
   for meeting electrification benchmarks along specified          Francisco, Seattle, and Miami-Dade, as well as smaller
   timelines, for convening task forces or other stake-            transit agencies in the Metro Area that are already
   holder groups, and for updating electrification plans as        operating electric buses or have had success procuring
   needed. It is critical that WMATA dedicate a team that          electric buses, such as those in Alexandria (DASH),
   is both empowered to act on a wide range of matters             Montgomery County (RideOn), Prince George’s
   and accountable for achieving defined goals. Among              County (TheBus), and DDOT in DC (DC Circulator), to
   other things, at the outset of the electrification plan-        share lessons learned and best practices.
   ning process WMATA must identify available funding           i. Ensure that any significant upgrades to bus garages
   streams (both from WMATA jurisdictions and at the               or fueling infrastructure include “EV ready” designs
   federal level) to fund, and help offset, the up-front pur-      beginning immediately. Planning for appropriate
   chase price premium on electric buses.                          facilities upgrades will be a critical part of the planning
g. Create a multi-agency task force to engage in                   process, as WMATA will need to invest in both bus
   regional and utility planning across jurisdictions.             garage and on-road charging infrastructure. Any
   Effective planning across three jurisdictions will              major upgrades to bus garages going forward should
   require collaboration with utilities, utility commissions,      be completed with an eye toward full electrification
   elected officials, state agencies, and community                of WMATA’s fleet. WMATA has already planned to
   organizations in DC, Virginia, and Maryland. WMATA              rebuild the 14th Street and Bladensburg bus garages
   should create a multiagency task force to coordinate            as electric-bus ready, with charging stations for 288
   its planning throughout its service territories. It will        buses at Bladensburg alone.11 WMATA should also
   be important to engage utilities early in this process          build on its July 2020 announcement that it would
   to ensure adequate charging capacity and that rate              partner with SunCommon to install solar canopies at
   structures are in place to facilitate the introduction of       four Metro train depots at no cost to the agency.12
   electric buses without the burden of demand charges          Scientists have made it clear that we must dramatically
   or other avoidable economic barriers. The task force         reduce GHG emissions over the next decade if we hope
   can help ensure WMATA prioritizes use of electricity         to avoid the direst effects of climate disruption, and
   from clean, renewable resources and incorporates             the public health impacts of diesel emissions are well-
   technologies and rate designs that effectively manage        documented. Now is the time for WMATA to truly live
   increased electric load from electric bus charging in        up to the promise of its “Back to Good” campaign and
   ways that maximize grid and economic benefits.               deliver Washington DC area residents the benefits of
                                                                electrification.

                                                                                                     PHOTO: ISTOCK/ SCHARFSINN86

A VISION FOR CLIMATE LEADERSHIP IN WASHINGTON, DC                                                                             4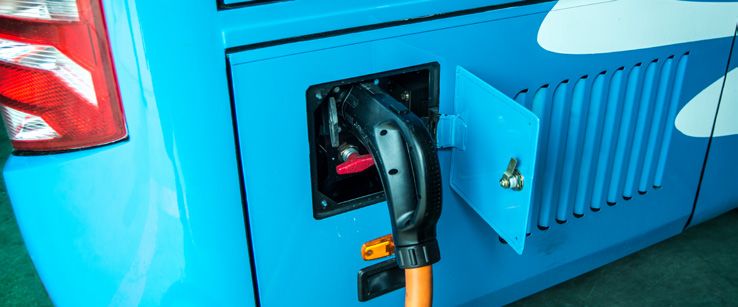
1. INTRODUCTION
A. WMATA’S FLEET                                             efficiency standards for new buildings, and fully electrify
With a fleet of more than 1,500 buses, WMATA
                                         13                  public transit and private fleets by 2045.16
operates the sixth-largest transit bus fleet in the United   WMATA’s current fleet is composed of 1,571 buses,
States,14 and it now has the opportunity to lead the         predominantly hybrid diesel and CNG buses, which
nation in mass transit electrification at a scale and on a   make up 52 percent and 29 percent of the total
timeline that match Washington DC’s ambitious Clean          fleet, respectively. However, WMATA’s 2017 Fleet
Energy DC Plan and the 2019 Clean Energy DC Act.             Management Plan actually lays out a path backwards
Finalized in 2018, the plan calls for steep reductions       and entails purchasing approximately 100 internal
in GHG emissions from the transportation and electric        combustion buses per year between 2020 and 2025.17
sectors and explicitly recognizes the importance of          The passage of the Clean Energy DC Act has shifted
local action in meeting the Paris Agreement’s climate        the landscape since WMATA released its 2017 Fleet
goals.15 In January 2019, Washington DC mayor Muriel         Management Plan. And although WMATA’s December
Browser signed the Clean Energy DC Act — establishing        2019 Bus Transformation Action Plan mentioned electric
an ambitious suite of climate policies that require          buses, and its February 2020 Zero-Emission Bus
Washington DC to get 100 percent of its electricity          Update announced a two-year pilot for electric buses
from renewable resources by 2032, strengthen energy          with delivery expected in 2021, WMATA has not made
                                                             any public commitment to fully electrify WMATA’s fleet.

                                                                                                   PHOTO: ISTOCK/ JOE_POTATO

A VISION FOR CLIMATE LEADERSHIP IN WASHINGTON, DC                                                                          5
B. CLEAN ENERGY DC ACT TIMELINES                                C. REPORT FINDINGS
   AND WMATA BUS PURCHASING                                     Incorporating WMATA-specific data on the types of
WMATA’s revised fleet-planning process offers WMATA             buses in its fleet, vehicle miles traveled, and electricity
the ideal opportunity to publicly commit to meeting             and fuel costs, and then using that data in national
or exceeding the Clean Energy DC Act’s timelines                modeling tools, this report arrives at three principal
by electrifying its fleet to at least 50 percent by             conclusions:
2030, 75 percent in 2035, 90 percent in 2040, and
                                                                First, converting to electric buses would result in
100 percent in 2045.18 As part of that planning process,
                                                                substantial cost savings through reduced fuel and
WMATA should define concrete next steps to ensure
                                                                maintenance costs, which would more than make up for
effective and efficient implementation of lessons learned
                                                                the current up-front premium on the purchase price of
through the upcoming two-year pilot.
                                                                electric buses compared with diesel and other types of
The Clean Energy DC Act’s timeline presents an aggres-          transit buses. Utilizing the AFLEET model created by
sive, but achievable, 25-year path toward full fleet elec-      Argonne National Lab in 2017, and conservative cost
trification. And while those targets are certainly realistic,   assumptions, this report compares the total cost of
WMATA must immediately begin increasing EV pur-                 ownership of different bus types, factoring in purchase
chases now to have any realistic hope of meeting those          price, fuel, and operation and maintenance costs.
targets. The average lifespan of WMATA’s buses is ap-
                                                                Second, converting to electric buses would lead to signif-
proximately 15 years.19 At the current rate of 100 new bus
                                                                icant annual GHG emissions reductions across the fleet
purchases per year, and with a fleet of more than 1,500
                                                                scenarios, and these reductions grow larger over time as
buses, WMATA could, in theory, meet the 2045 timeline
                                                                more of the fleet shifts to electric buses. To estimate net
for full electrification by purchasing only electric buses
                                                                emissions reductions, this report’s analysis of GHG emis-
beginning in 2030. However, to meet the 2030 target
                                                                sions incorporates both on-road emissions from the bus-
of a 50 percent electric fleet, or the 2035 target of 75
                                                                es themselves as well as emissions from the electric grid
percent electric, WMATA would need to begin purchas-
                                                                based on the necessary charging of electric buses in the
ing 100 electric buses per year in approximately 2023.
                                                                future. This analysis incorporates applicable renewable
Achieving such a steep curve appears unlikely, given that
                                                                portfolio standards for Washington DC and Maryland;
WMATA does not plan to start its two-year, 14-bus pilot
                                                                and, for remaining grid emissions in all three WMATA
until 2021 at the earliest. However, the near-term steps
                                                                service areas, utilizes conservative assumptions based
outlined in this report, if adopted, would set WMATA on
                                                                on emissions from an average combined cycle gas plant.
a path to meet both the long-term goals and most of the
interim benchmarks in the Clean Energy DC Act.                  Third, converting from diesel and CNG to electric bus-
                                                                es would lead to tremendous public health benefits for
As part of its short-term planning, WMATA needs to
                                                                Washington DC area residents in WMATA’s service ter-
amend any purchase contracts for diesel or CNG buses
                                                                ritory based on reduced air pollution. To quantify these
and convert those to electric bus orders. Doing so will
                                                                benefits, this report utilizes the US EPA’s Diesel Emis-
help avoid stranded assets caused by having to retire
                                                                sions Quantifier model, which uses specified indicators,
diesel or CNG buses before the end of their useful life
                                                                such as reductions in emergency room visits, hospitaliza-
in future years in order to meet electrification goals.
                                                                tions, and days off work, to estimate avoided healthcare
Although delaying purchases may require extending
                                                                costs as a result of reduced particulate matter and NO X
maintenance and service plans for some buses, it would
                                                                emissions.Our organizations recognize that the global
avoid locking in emissions from upwards of 500 new
                                                                pandemic has put a strain on the health and financial
diesel or CNG buses between now and 2025, each of
                                                                well-being of people and communities across the coun-
which would run for approximately 15 years. Moreover,
                                                                try, and that transit agencies have seen dramatically
the vast majority of WMATA’s buses are made by New
                                                                reduced ridership as a result. WMATA should use any
Flyer, 20 which also offers electric buses in 30-, 40-,
                                                                financial assistance that becomes available as part of a
and 60-foot models. New Flyer estimates that its
                                                                federal economic stimulus plan to invest in a clean and
gas-powered buses start around a purchase price of
                                                                sustainable transit bus system for the future rather than
$450,000, while their electric versions start at around
                                                                further tying WMATA to fossil-fueled buses. This report
$700,000, and that over the lifetime of the buses each
                                                                provides a vision for the future of WMATA’s transit bus
electric bus saves approximately $400,000 in fuel costs
                                                                system that is fully electric and also provides a net pos-
and $125,000 on maintenance. 21
                                                                itive financial return to the agency. These aims can be

A VISION FOR CLIMATE LEADERSHIP IN WASHINGTON, DC                                                                             6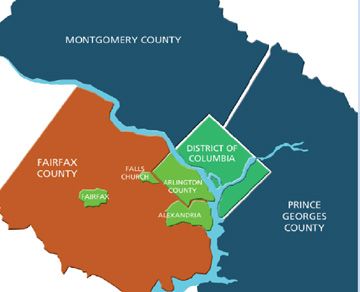
accomplished without sacrificing core principles of eco-                                  Transportation accounts for the largest portion of
nomic equity and environmental justice. Were WMATA                                        US GHG emissions (29 percent) of any sector of our
to follow these recommendations, it would reduce local                                    economy nationally, 23 and for approximately 41 percent
and global pollution while investing in the people and                                    of GHG emissions in the DC metro area. 24 Seated in the
communities it serves by prioritizing the electrification of                              nation’s capital, with a massive bus fleet and supportive
bus routes through disadvantaged communities and by                                       local government, WMATA is ideally situated to lead the
creating job retraining and employment opportunities for                                  transformation of mass transit bus fleets toward full
current WMATA drivers and maintenance workers and                                         electrification on an aggressive timeline.
people in disadvantaged communities.                                                      Our organizations call on WMATA to show real economic,
Figure 5: Composition of Current and Potential WMATA Fleets,                              climate, and public health leadership by committing to
by Fuel Type                                                                              electrify its fleet at least at least as quickly as mandated
100%                                                                                      by the DC Clean Energy DC Act — and ideally sooner.
 90%                                                                                      Doing so would save WMATA hundreds of millions of
 80%                                                                                      dollars in operating expenses, reduce GHG emissions and
 70%                                                                                      associated climate harms felt across the globe, and make
 60%
                                                                                          the air cleaner to breathe for DC area residents.
 50%

 40%

 30%

 20%

 10%

  0%
       Current WMATA        WMATA 2030         DC Clean Energy         DC Clean Energy
                                                  Act 2030                Act 2040
                                                 (50% Electric)          (90% Electric)

                       EV      Hybrid Diesel      CNG         Diesel

Source: WMATA Fleet Management Plan (2017)22

 2. COST SAVINGS FROM WMATA BUS FLEET
    ELECTRIFICATION
A. PER-BUS COST SAVINGS                                                                   as well as projected per-bus savings when switching to
To study the economic effects of transit bus                                              electric buses as modeled by AFLEET.
electrification, this report uses the Argonne National                                    Figure 6: Breakdown of Lifetime Cost of Ownership Per Bus by
Laboratory’s Alternative Fuel Life-Cycle Environmental                                    Fuel Type
and Economic Transportation (AFLEET) tool, which                                                          Electric       Diesel        CNG            Hybrid
utilizes purchase price and annual operating costs, along                                  Purchase       $789,000       $485,155      $509,756       $673,693
with other data, to compare costs from electric buses                                      Price
with conventional-fuel counterparts. 25 Where possible,                                    Fueling Costs $154,799        $359,876      $373,909       $261,077
we utilized WMATA-specific data based on its fleet,
                                                                                           Maintenance $181,090          $522,894      $387,761       $603,909
vehicle miles traveled, and other inputs. The results of                                   & Operations
this AFLEET analysis demonstrate that electrification                                      Total         $1,124,899      $1,365,925    $1,271,426     $1,538,679
of WMATA’s bus fleet would bring substantial economic                                      Lifetime Cost
                                                                                           of Ownership
savings due to the lower total cost of ownership per
bus when compared with diesel, hybrid diesel, and CNG                                     Source: Argonne National Laboratory’s AFLEET Model (2017)

buses. 26
Figures 6 and 7, below, display the total lifetime cost of
ownership for electric, diesel, CNG, and hybrid buses,

A VISION FOR CLIMATE LEADERSHIP IN WASHINGTON, DC                                                                                                                  7
Figure 7: Lifetime Cost of Ownership Per Bus by Fuel Type do not incorporate the proven track record of plummeting
and Cost Savings from Electrification
battery costs over time.
Electric Diesel CNG Hybrid
Figure 8: AFLEET Total Cost of Ownership Across Fleet
Total Lifetime Cost $1,124,899 $1,365,925 $1,271,426 $1,538,679 Scenarios
of Ownership
Fleet Plan AFLEET Percent Savings Dollars Saved
Lifetime savings – $241,026 $146,527 $413,780 Calculated Total Compared With Compared With
of an electric bus Cost (dollars) Current WMATA Current WMATA
over diesel, CNG Fleet Fleet
bus and hybrid
Current $2,234,365,885 – –
Percentage – 21% 13% 37% WMATA Fleet
savings of electric
bus over diesel, WMATA Plan $2,104,441,407 6% $129,924,478
CNG and hybrid 2030
Source: Argonne National Laboratory’s AFLEET Model (2017) CEDC Act $1,882,240,024 16% $352,125,861
2030
(50% electric)
B. FLEET-WIDE COST SAVINGS
CEDC Act $1,790,221,068 20% $444,144,817
The per-unit savings on electric buses compared with 2040
(90% electric)
all other fuel types has the potential to save WMATA
hundreds of millions of dollars when translated to Source: Argonne National Laboratory’s AFLEET Model (2017)
electrification across WMATA’s entire fleet of 1,571 As depicted in Figure 8, above, our AFLEET modeling
buses. 27 The faster WMATA transitions to electric buses, shows that electrifying 50 percent of WMATA’s fleet
the greater the fleet-wide economic benefit that WMATA by 2030, as directed by the Clean Energy DC Act,
would realize as annual savings on fuel, operation and would save WMATA more than $350 million on lifetime
maintenance grow year over year. costs compared with the total cost of ownership of
As showed in Figure 8, below, electrification of WMATA’s WMATA’s current fleet. 29 By 2040, with 90 percent
fleet along Clean Energy DC Act timelines for 2030 of the fleet electric under the Clean Energy DC Act’s
and 2040 would result in significant fleet-wide cost framework, those fleet-wide savings increase to more
savings for WMATA, which would increase as further than $440 million. WMATA’s 2017 Fleet Management
electrification yields greater annual savings on fuel, Plan, by contrast, which calls for replacing hybrid diesel
operation, and maintenance costs. 28 Again, these buses with diesel buses by 2030,30 would generate far
calculations are highly conservative — for example, they smaller cost savings compared with the current fleet
composition.
PHOTO: ISTOCK/ SEMEN SALIVANCHUK
A VISION FOR CLIMATE LEADERSHIP IN WASHINGTON, DC 83. GHG REDUCTIONS FROM WMATA BUS FLEET
ELECTRIFICATION
A. THE CLIMATE CRISIS AND SUMMARY As explained in detail below, the analysis in this report
OF GHG REDUCTIONS ACHIEVABLE demonstrates that electrifying WMATA’s bus fleet along
We are in a global climate crisis. In 2018, the the timelines set out by the Clean Energy DC Act would
Intergovernmental Panel on Climate Change (IPCC) reduce fleet-wide CO2 emissions from WMTA’s buses by
concluded that anthropogenic CO2 emissions must approximately 44 percent in 2030 and approximately 78
substantially decline by 2030 in order to keep average percent in 2040.
global temperatures within 1.5°C of pre-industrial
times.31 The IPCC also found that the global economy B. GHG EMISSIONS REDUCTIONS
must reach net-zero emissions around 2050 to avoid the PER BUS
most dire effects of climate change.32 Similar to the economic analysis, electrification of
WMATA’s transit bus fleet also offers substantial
Despite scientific consensus and stark real-world
reductions in GHG emissions. This report incorporates
reminders, our policies do not yet match the urgency
projections for both on-road and electric grid emissions
of the climate crisis. July 2019 was the hottest month
for electric bus charging, with grid emissions decreasing
ever recorded.33 In September 2019, devastating floods
over time as Maryland and Washington DC incorporate
in Houston marked the third 500-year rain event in
more clean energy into their electricity mix.45
Texas in the past three years.34 In the summer and fall of
2020, catastrophic wildfires burned more than 5 million Compared with every other bus fuel type, electric buses
acres across the western U.S., forcing mass evacuations
Figure 9: WMATA Annual CO2 Emissions per Bus by Type
across California and Oregon.35 And in November 2019,
100
the United Nations released a report on the global GHG
“emissions gap”— essentially a comparison of “where we 90
ANNUAL CO2 EMISSIONS (short tons)
are” versus ”where we need to be” — concluding that by 80
2030 global GHG emissions must be 55 percent lower 70
than 2018 in order to limit warming to 1.5°C.36 60
To meet these climate objectives, immediate action must 50
be taken at every level of government and in all sectors of 40
our economy. Cities and transit agencies across the US, 30
including in New York,37 Los Angeles,38 San Francisco,39 20
and Chicago,40 have already made commitments to
10
go fully electric and have taken concrete steps toward
0
purchasing electric buses and electrifying their public Diesel CNG Hybrid Diesel EV (2030) EV (2040)
transit bus fleets. For example, in April 2019 Chicago
committed to convert its transit fleet to 100 percent are significantly cleaner in terms of CO2 emissions, even
electric buses by 2040.41 In November 2019, Los Angeles factoring grid emissions from charging electric batteries.
announced the purchase of 130 electric buses as part of While hybrid diesel and CNG buses emit marginally
its plan to fully electrify its transit fleet by 2030.42 And less CO2 than diesel, they emit far more CO2 than
in December 2019, New York City deployed the first 15 of electric buses. (See Figure 9, above.) Per-bus emissions
the 500 electric buses it plans to put into service over the displayed above for electric buses differ in 2030 and
next five years.43 Locally, in Alexandria, Virginia, DASH has 2040 primarily due to improving renewable portfolio
already taken concrete steps toward electrifying its fleet standards in DC and Maryland.
and expects to have the necessary charging infrastructure
in place this year for the first of its electric fleet.44 C. FLEET-WIDE GHG EMISSIONS
Initiating purchases at scale as quickly as possible would REDUCTIONS
best serve WMATA and DC area residents, providing real-
To compare fleet-wide GHG emissions scenarios, we
time experience with the buses for WMATA, as well as
took the per-bus calculations from above, and multiplied
immediate benefits for transit riders and allowing for a
those figures across fleet compositions. The significant
smoother transition to an electrified fleet.
A VISION FOR CLIMATE LEADERSHIP IN WASHINGTON, DC 9differences in per-bus emissions rates based on fuel Figure 11: Annual Fleet-wide CO2 Emissions and Percentage
Savings Compared With Current WMATA Fleet
type, combined with WMATA’s fleet size, present WMA-
CO2 Emitted per Percentage of CO2
TA with the opportunity to substantially reduce CO2 Year (Short Tons) Emissions Reductions
emissions across its transit bus fleet. Figure 10 shows Compared With Current
WMATA Fleet
the estimated annual fleet-wide CO2 emissions across
fleet scenarios, while Figure 11 additionally displays per- Current WMATA Fleet 133,549 0%
centage of CO2 saved compared with WMATA’s current WMATA Plan 2030 135,799 -2%
fleet. Remarkably, WMATA’s 2017 Plan would lead to CEDC Act 2030 74,982 44%
an increase in CO2 emissions compared with its current (50% electric)
fleet. In contrast, the Clean Energy DC Act 2030 scenar- CEDC Act 2040 29,788 78%
io, which would entail half of the bus fleet being electric (90% electric)
in 2030, would generate a 44 percent reduction in annu-
al CO2 emissions compared with the current fleet. climate leadership while saving hundreds of millions of
dollars in the process.
The Clean Energy DC Act’s 2030 and 2040
electrification scenarios yield drastic reductions in D. AVOIDED SOCIAL COSTS
CO2 emissions compared with WMATA’s current fleet,
The social cost of carbon, developed by an Interagency
resulting in annual emissions savings of 44 percent and
Working Group composed of experts from more than
78 percent, respectively. These potential savings thus
a dozen federal agencies and offices, provides an esti-
offer WMATA the opportunity to demonstrate strong
mate of the global economic damage, in dollars, caused
Figure 10: Annual WMATA Estimated Fleet-wide CO2 Emissions by each incremental ton of CO2 emitted into the atmo-
160,000 sphere.46 The tool estimates impacts such as drought,
140,000
wildfires, decreased agricultural productivity, and sea
level rise, among others. Although there is significant
120,000
variation in the social cost figures depending on the dis-
100,000 count rate used, using a discount rate of 3 percent, the
TONS OF CO2
social cost of each incremental ton of CO2 emitted into
80,000
the atmosphere in 2030 is $50. Electrifying WMATA’s
60,000 fleet along the Clean Energy DC Act’s timeline would
40,000
save more than 58,000 tons of CO2 per year by 2030
(see Figure 11 above) and avoid at least $2.9 million
20,000
annually in global economic damages — annual savings
0 that would increase as the social cost of each ton of CO2
Current WMATA WMATA Plan DC Clean Energy DC Clean Energy
Fleet 2030 Act 2030 Act 2040 emitted into the atmosphere rises in successive years
(50% Electric) (90% Electric)
and WMATA electrifies more of its fleet.
PHOTO: ISTOCK/ ZSSP
A VISION FOR CLIMATE LEADERSHIP IN WASHINGTON, DC 104. PUBLIC HEALTH SAVINGS OF WMATA
BUS FLEET ELECTRIFICATION
The electrification of WMATA’s bus fleet would also Particulate matter can harm the respiratory system,
significantly improve the air quality for people who live and those exposed may experience symptoms ranging
and work in WMATA’s service territory, which spans from trouble breathing and cough to critical, life-
Washington DC and parts of Maryland and Virginia. threatening developments such as decreased lung
Reducing emissions of particulate matter, NO X , and other function and cardiovascular disease.49 Even relatively
pollutants from transit buses would not only improve low levels of exposure can harm vulnerable populations
air quality — particularly important for public health such as children, people aged 65 years or older, outdoor
given that the Washington DC area is in nonattainment workers, and those with existing respiratory problems or
for the health-based National Ambient Air Quality cardiovascular disease.50
Standards (often referred to as NAAQS) for ground Children are especially affected by asthma: One in twelve
level ozone — but also would have quantifiable benefits children in the US has asthma, which was responsible
in healthcare cost savings by reducing the incidence of for approximately 13.8 million missed days of school
asthma and other respiratory ailments, emergency room in 2013.51 Children of color, specifically African Ameri-
visits, hospital stays, and days off work.47 Using the US can children, bear a double burden. The negative health
EPA’s publicly available Diesel Emissions Quantifier tool, effects of particulate matter disproportionately affect
which estimates reduced healthcare costs associated low-income populations, people of color, and vulnerable
with changes in particulate matter emissions, we populations like children and the elderly.52 In 2015, the US
calculate that electrifying WMATA’s bus fleet would save Department of Health and Human Services found that Af-
area residents more than $8 million per year in reduced rican American children were four times more likely to be
healthcare costs. hospitalized for asthma compared with white children.53
E. PUBLIC HEALTH IMPACTS In Washington DC, over ten percent of children have
asthma,54 well above the national average of 8.4
Motor vehicles contribute significantly to air pollution;
percent.55 Childhood asthma in DC disproportionately
for example, the EPA estimates that the transportation
affects poor and urban minority children.56 Wards
sector was responsible for over 163 million tons of
7 and 8, which compose the bulk of Southeast DC, are
particulate matter (PM2.5) emissions in 2014.48
particularly affected. According to data from Children’s
National Hospital, children who live in Ward 8 have
PHOTO: ISTOCK/ TRAMINO
A VISION FOR CLIMATE LEADERSHIP IN WASHINGTON, DC 1120 to 25 times the number of emergency room visits its residents would save $55,000 on avoided healthcare
compared with children in Northwest neighborhoods, due costs per year per electric bus; New York’s Metropolitan
in large part to asthma and other respiratory issues.57 Transportation Authority estimated savings of $150,000
per bus per year based on a reduction of approximately
A comprehensive electrification implementation plan
97.5 percent in per bus particulate matter emissions.61
for WMATA should prioritize electrifying bus routes
that serve low- and moderate-income areas and Were WMATA to electrify its bus fleet, the D.C. metro
environmental justice communities. This would help area would see a considerable drop in particulate
ensure that the benefits of transportation electrification matter and NOx emissions and, consequently, a drop
are more equitably distributed to all Washington DC in the negative health effects brought about by these
area residents by improving access to clean, electric emissions. Using the EPA’s model, we estimate the area
transportation options for particularly vulnerable served by WMATA would see $8,210,000 in annual
populations. health cost savings as a result of converting WMATA’s
fleet to 100 percent electric buses. The District would
F. HEALTHCARE COST SAVINGS FROM reap the greatest benefits in avoided health costs
WMATA ELECTRIFICATION (over $6 million each year) and the four Virginia and
Cities with poor air quality carry a heavy economic Maryland counties that WMATA also serves would each
burden. This burden can be quantified using indicators of see hundreds of thousands of dollars in avoided health
public health, such as bronchitis, increased incidence of costs annually. While these projections are conservative
asthma, upper and lower respiratory symptoms, hospital and based on EPA’s publicly available model, regardless
admissions, emergency room visits, and days lost from of which tool WMATA uses, we urge it to take avoided
work. healthcare costs to area residents into consideration
when undertaking any economic analysis of its fleet-
The EPA’s Diesel Emissions Quantifier model, which
management decisions.
is one available tool for such an analysis, uses these
indicators, among others, to estimate an area’s annual Figure 12: Annual Avoided Healthcare Costs by County
avoided health costs as a result of reduced emissions.58 County Annual Savings
The model, updated in July 2019,59 calculates emissions District of Columbia $6,740,000.00
for both baseline and replacement vehicles; in this case,
Prince George’s, MD $601,000.00
WMATA’s baseline of hybrid, diesel, and CNG buses, and
a hypothetical replacement fleet of all electric buses. Montgomery, MD $250,000.00
The model has been used to make similar projections Arlington, VA $277,000.00
regarding the public health benefits of electrifying transit Fairfax, VA $351,000.00
fleets in other cities, including Chicago and New York.60 $8,210,000.00
Total
Chicago Transit Authority, for example, estimated that
Source: EPA Diesel Emissions Quantifier
5. SUMMARY AND RECOMMENDATIONS
WMATA should demonstrate strong climate leadership more in later years) and would reduce the heavy toll that
at the local level by committing to electrify its 1,500-plus air pollution has on the area’s most vulnerable residents.
bus fleet at least as quickly as set out in the Clean Energy WMATA must take immediate steps toward
DC Act signed into law in 2019. Electrifying WMATA’s electrification. This should start with a public
fleet is a critical step toward meeting Washington DC’s commitment to convert its transit bus fleet to 100
climate goals and will help reduce the transportation percent electric buses as directed by the Clean Energy
sector’s GHG emissions, which is essential if we hope to DC Act and include a public and transparent process to
keep global temperatures within a 1.5 degree-increase as develop and release a plan for the long-term conversion
called for by the international and scientific communities of the fleet. In that plan, WMATA should examine how
in the Paris Climate Accord. Electrifying the fleet along other transit agencies have minimized the up-front
Clean Energy DC Act timelines would save WMATA cost burden of purchasing electric buses instead of
hundreds of millions of dollars, reduce climate pollution fossil-fueled alternatives. For example, Pay As You
by more than 58,000 tons of CO2 per year by 2030 (and Save programs, utilizing on-bill tariffs for electric buses,
A VISION FOR CLIMATE LEADERSHIP IN WASHINGTON, DC 12would allow municipalities and transit agencies to fleets by dates ranging from 2030 to 2040. Examples
purchase more electric buses with the same amount of include, among others, Santa Monica (2030),64
funding they would otherwise dedicate for transit bus Santa Barbara (2030),65 Los Angeles (2030),66 San
purchases.62 Additionally, the federal Lo-No Emission Francisco (2035),67 Seattle (2040),68 New York City
Vehicle Program provides funding to state and local (2040),69 Portland (2040),70 and Chicago (2040).71
governmental authorities for the purchase or lease of 2. WMATA should develop and publicly release a
zero-emission and low-emission transit buses, including transit bus electrification plan by the end of the
acquisition, construction, and leasing of required first quarter in 2021 and commit to preparing an
charging infrastructure.63 Other options, including the annual progress report each year thereafter until full
use of municipal bonds, could also be considered. electrification is secured.
Our organizations therefore call on WMATA to take Developing and releasing a comprehensive
the following steps to meet the mandate of the 2019 electrification plan in a public and transparent process
Clean Energy DC Act and electrify its fleet to provide will help WMATA engage the public as a partner in
a healthier, cleaner transportation system for all this long-term transition to an electric fleet over the
Washington DC area residents: next 25 years. Other cities have incorporated similar
1. WMATA should publicly commit to electrifying its plans into their fleet electrification processes. For
bus fleet along or faster than the timelines provided example, Chicago is currently developing its plan,
in the Clean Energy DC Act, with at least 50 percent scheduled for release in December 2020, to help it
electric by 2030, 75 percent by 2035, 90 percent identify key strategies, milestones, and timelines for an
by 2040, and 100 percent by 2045. equitable transition to an all electric fleet by 2040.72
Similarly, New York City’s transit authority developed
Numerous transit agencies in cities across the country
a 2020-2024 capital plan allocating $1.1 billion
have committed to fully electrify their public transit
PHOTO: ISTOCK/ TRAMINO
A VISION FOR CLIMATE LEADERSHIP IN WASHINGTON, DC 13toward the purchase of 500 electric buses during that 5. WMATA should prioritize deployment of electric
timeframe.73 buses in low- and moderate-income neighborhoods
and environmental justice communities, and ensure
As part of that plan, WMATA should also review
hiring and job retraining opportunities for those from
current, ongoing actions, including the modernization
disadvantaged areas.
of its bus barns and the purchase of buses, and
transparently explain how those actions are preparing WMATA should engage low- and moderate-income
for imminent electrification and the implementation of communities in the planning process and prioritize
its bus electrification plan. electrifying routes through those neighborhoods in
order to reduce transportation-related pollution in
3. WMATA should end the purchase of internal
areas most impacted, improve public health, and
combustion buses no later than January 1, 2025,
ensure that the benefits of electrification are most
and ideally sooner in order to maximize cost savings
equitably distributed throughout WMATA’s service
to WMATA and avoid locking in unnecessary carbon
territory. As part of the transition to an electric
dioxide and diesel emissions that harm the planet
bus fleet, WMATA should also ensure that current
and health of DC area residents. In the meantime,
drivers and maintenance specialists have adequate
WMATA should take all available steps to cease the
job-retraining opportunities to work on the newly
purchase of internal combustion engine buses that
electrified fleet, and that those opportunities also
are not necessary to continue operations.
reach people from nearby disadvantaged areas to
Given the 12-15 year lifespan of WMATA buses, 2025 ensure that the communities served by WMATA share
must be the last date for fossil fuel bus purchases in some of the economic benefits of bus electrification.
if WMATA is to efficiently meet a 2040 target of a
6. WMATA should create an internal task force that
minimum 90 percent electric bus fleet. Postponing
reports directly to executive leadership and that
a phaseout of fossil fuel bus purchases beyond 2025
is empowered to oversee the electrification of the
would unnecessarily delay the economic, climate,
WMATA fleet.
and public health benefits of electrification. Indeed,
states and cities across the country have pledged WMATA needs a team that is empowered to overcome
to phase out such purchases well ahead of full bureaucratic obstacles, drive forward electrification,
transit electrification. Examples of pledges to stop and be accountable directly to WMATA’s leadership. It
purchasing fossil fuel buses include commitments is also important to establish clear accountability for
from cities such as Seattle (by 2020),74 San Francisco meeting both near-term benchmarks and long-term
(by 2025),75 and Los Angeles (by 2025), and less targets that extend 25 years into the future.
aggressive commitments by New Jersey (2032),76 and 7. WMATA should create jurisdiction-specific,
California’s state-wide commitment (2029).77 multiagency and utility task forces to draw upon
4. WMATA should immediately accelerate electric the authorities needed to electrify rapidly, including
bus purchases as soon as feasible, but no later than utilities that operate in each jurisdiction, and the
2021. Public Service Commissions in DC and Maryland and
the State Corporation Commission in Virginia.
Numerous transit agencies are already taking delivery
of significant numbers of electric buses in 2020 and WMATA should begin outreach to external
2021. For example, New York City’s recently acquired stakeholders to ensure its electrification plans are
bus fleet includes fifteen 60-foot articulated electric implemented as smoothly as possible and that
buses, which began deploying on one of the city’s WMATA has the benefit of insights on best strategies
busiest routes along 14th Street in December 2019.78 and practices from the relevant Public Service
In 2018, Chicago ordered 20 electric buses for its Commissions, electric utilities, as well as the DC
fleet,79 and in November 2019, Miami announced Council, the DC Mayor’s Office, and public officials in
the purchase of 33 electric buses.80 Los Angeles, Maryland and Virginia.84 Such outreach would help
which purchased an additional 130 electric buses in WMATA assess available funding mechanisms, electric
November 2019,81 announced it will have 40 sixty-foot rate structures for charging, charging infrastructure
articulated buses operating by the fall of 2020 and will needs, and the necessary regulatory approvals.
completely electrify its silver bus line in 2021.82 Even
Washington DC’s own Circulator has had 14 electric
buses in service since 2018.83
A VISION FOR CLIMATE LEADERSHIP IN WASHINGTON, DC 148. WMATA should establish an ongoing collaboration County, and Montgomery County. WMATA should
with transit agencies in nearby areas and large engage these agencies to evaluate potential funding
public transit agencies across the country that streams and effectively coordinate with utilities, bus
already have electric buses in service. and charging equipment providers, and community
organizations.
As noted throughout this report, states, cities, and
transit agencies across the country are already moving 9. Ensure that any significant upgrades to bus garages
forward on transit bus electrification, including those or fueling infrastructure include “EV ready” designs.
with large urban populations in northern climates. Once WMATA commits to full electrification, it
WMATA should gather data and endeavor to apply should commence an immediate review of charging
lessons learned from other cities at the outset of infrastructure needs and the feasibility and cost of
this process. Transit agencies in places with a similar upgrades at existing facilities, as it has already done
climate and multijurisdictional territories may be for the 14th Street and Bladensburg garages. This
particularly useful for WMATA to connect with in should include analysis of both garage structures and
order to overcome hurdles experienced elsewhere. any electrical infrastructure needs to accommodate
Additionally, at least four other transit agencies in large-scale bus charging in the future. As that review
nearby areas already have experience procuring and takes place, at a minimum, WMATA should ensure any
operating electric buses, including the DDOT Circulator new garages or renovations account for the transition
in DC and agencies in Alexandria, Prince George’s to electric buses.
Investing in electrifying WMATA’s transit bus fleet should entail more than
a financial calculus. Moving away from diesel and CNG buses over the next
quarter century means investing in more than buses and related charging
infrastructure.
It means investing in the people of Washington DC, will benefit from cleaner air and reduced GHG emissions
Maryland, and Virginia who rely on WMATA’s buses to from transportation. Even using conservative estimates,
get to work and school, and just to go about their daily electrification of WMATA’s fleet presents a win-win-win
lives, and, more broadly, residents in these areas who scenario: WMATA saves hundreds of millions of dollars in
PHOTO: ISTOCK/ TRAMINO
A VISION FOR CLIMATE LEADERSHIP IN WASHINGTON, DC 15lifetime operating costs across the fleet; climate pollution communities that disproportionately suffer the effects
from the fleet dramatically declines, helping Washington of smog and other pollution from cars, trucks, and buses.
DC meet its climate goals while benefiting everyone; and The climate crisis demands immediate action at the
DC area residents breathe cleaner air and save millions of national and local level, and WMATA must develop a
dollars in avoided healthcare costs. strong electrification plan that fully electrifies its fleet
on clear timelines as transit agencies in other cities such
By prioritizing the deployment of electric buses
as Chicago, New York, Seattle, and Los Angeles have
and providing access to associated new green job
already done. Our organizations stand ready to work
opportunities in low- and moderate-income and
alongside WMATA, and other stakeholders, as we move
environmental justice neighborhoods, WMATA can
toward a clean transportation future for all DC area
ensure the benefits of electrification are equitably
residents.
distributed across its service territory. Prioritizing
electrification of these routes would help disadvantaged
ENDNOTES
1 WMATA’s board of directors is comprised of composed of eight voting and eight 21 US Public Interest Research Group, Electric Buses in America: Lessons from
alternate directors. The District of Columbia, Maryland, Virginia and the federal Cities Pioneering Clean Transportation, 11 (2019). Accord Quarles, N., Costs and
government each appoint two voting directors and two alternates. https://www. Benefits of Electrifying and Automating Bus Transit Fleets (2020), https://www.
wmata.com/about/board/. caee.utexas.edu/prof/kockelman/public_html/TRB18AeBus.pdf.
2 Washington Metropolitan Area Transit Authority, Metrobus Fleet Management 22 The “WMATA 2030” scenario in this report’s figures reflects a fleet composition
Plan at 20 (2017) (hereafter “WMATA, Fleet Management Plan”). Links to cited in 2030 as set out in WMATA’s 2017 Fleet Management Plan. Note that WMATA
materials are included in the Cited Literature section of the Appendix. does not currently have a public fleet management plan that extends to 2040.
3 US Public Interest Research Group, Electric Buses in America: Lessons from 23 U.S. Environmental Protection Agency, “Fast Facts: U.S. Transportation Sector
Cities Pioneering Clean Transportation, 14 (Oct. 2019). Greenhouse Gas Emissions, 1990-2017,” at 1 (June 2019).
4 For modelling comparisons made throughout this paper, “WMATA Plan 2030,” 24 https://www.mwcog.org/newsroom/2020/02/20/cog-board-supports-multi-
reflects the business-as-usual approach as set out in WMATA’s 2017 fleet plan. state-effort-to-reduce-greenhouse-gas-emissions-from-transportation-/.
5 WMATA Fleet Management Plan at 5, 15. 25 This analysis does not attempt to quantify fueling and charging infrastructure
6 See infra Part V.1., for citation and additional information for each city’s transit costs for any bus type, whether electric, CNG, or diesel, nor estimate how much
electrification commitment. infrastructure is necessary per bus. Even adding, conservatively, $100,00 per
electric bus for charging infrastructure, while assigning a $0 value for CNG and
7 WMATA, Zero Emission Bus Update, 2, 4. diesel fueling, electric buses would still compare favorably over the lifetime of
8 https://www.transit.dot.gov/funding/grants/fiscal-year-2020-low-or-no- the bus.
emission-low-no-bus-program-projects. 26 AFLEET’s total cost of ownership figures correspond very closely (and are
9 This conclusion is in line with WMATA’s own estimate that transitioning to a fully slightly less than) WMATA’s total cost of ownership estimates based on a
electric bus fleet would reduce Metrobus emissions by nearly 128,000 metric medium fuel price assumption. See WMATA, Fleet Management Plan at 59.
tons of CO 2 e per year by 2040. WMATA, Bus Transformation Project Action 27 To calculate fleet-wide cost savings, we took the per-bus cost analysis from
Plan, ES at 13 (Dec. 2019). section A., above, and extrapolated across bus type and various WMATA fleet
10 US PIRG, Lessons Learned at 14. See infra Part V.1. compositions.
11 WMATA, Zero Emissions Bus Update at 2 (Feb. 2020); https://www.wmata. 28 To estimate total cost of ownership in 2030 and 2040, this analysis factors in
com/initiatives/plans/upload/Bladensburg-General-Plans-Set.pdf purchase price, fuel, and maintenance costs for a 15-year lifespan of each bus
in the fleet. The numbers presented here provide a representative snapshot
12 https://www.wmata.com/about/news/Metro-solar-contract-announcement.
of future economic savings to WMATA without assigning which bus types are
cfm.
converted to electric in a given year. The lifetime cost savings from electrification
13 WMATA, Fleet Management Plan at 52. presented here are conservative, using current purchase price for all bus types to
14 Washington Metropolitan Area Transit Authority, FY18 Metro Performance guard against a critique of reliance on optimistic future price projections. Given
Report - Financial Responsibility (2018). market trends, purchase prices for electric buses will very likely continue to
decrease significantly through 2030 and 2040 compared to any price shift for
15 Government of the District of Columbia, Clean Energy DC: the District of
diesel, CNG, and hybrid buses, meaning that WMATA’s cost savings will likely be
Columbia Climate and Energy Action Plan, v (2018).
higher than projected here.
16 Government of the District of Columbia, Press Release, “Mayor Browser Signs
29 This report uses WMATA’s existing fleet size for both 2030 and 2040
Historic Clean Energy Bill, Calling for 100% Renewable Electricity by 2032,”
comparisons.
(Jan. 18, 2019).
30 WMATA Fleet Management Plan at 21, 25.
17 WMATA, Fleet Management Plan at 110.
31 IPCC, Global Warming of 1.5°C: An IPCC Special Report on the Impacts of Global
18 See sec. 502 of the Act, DC Code sec. 50-741. The Act also calls on DDOT to
Warming of 1.5°C Above Pre-Industrial Levels and Related Global Greenhouse
release a plan by July 1, 2021 to include recommendations on policies that would
Gas Emission Pathways, at Summary for Policymakers, p. 15 (2018).
help achieve the transportation electrification timelines in the Act, increase
vehicle registrations in Washington D.C. to at least 25 percent zero-emissions 32 Id.
vehicles by 2030, and meet the goal of 100 percent replacement of public transit 33 National Oceanic and Atmospheric Administration, “July was hottest month on
and school buses with electric buses upon the end of their useful life, by 2021. record for planet” (Aug. 15, 2019).
19 WMATA, Fleet Management Plan at 13. 34 Maggie Gordon, “Repeat flooding has residents asking: Is Houston worth it?”
20 See Fleet Management Plan at 91 (breaking down WMATA’s existing fleet by Houston Chronicle (Sept. 20, 2019).
manufacturer and bus type). 35 https://www.nytimes.com/2020/09/14/us/wildfires-live-updates.
html?action=click&module=Spotlight&pgtype=Homepage
A VISION FOR CLIMATE LEADERSHIP IN WASHINGTON, DC 16You can also read