Characterizing Online Media on COVID-19 during the Early Months of the Pandemic
←
→
Page content transcription
If your browser does not render page correctly, please read the page content below
Journal of Quantitative Description: Digital Media 1(2021), 1–31 10.51685/jqd.2021.014

 Characterizing Online Media on COVID-19 during the Early Months of
 the Pandemic

 HENRY K. DAMBANEMUYA
 Northwestern University, USA

 HAOMIN LIN
 Georgia Institute of Technology, USA

 EMŐKE-ÁGNES HORVÁT
 Northwestern University, USA

 The 2019 coronavirus disease had wide-ranging effects on public health throughout
 the world. Vital in managing its spread was effective communication about public
 health guidelines such as social distancing and sheltering in place. Our study
 provides a descriptive analysis of online information sharing about coronavirus-
 related topics in 5.2 million English-language news articles, blog posts, and
 discussion forum entries shared in 197 countries during the early months of the
 pandemic. We illustrate potential approaches to analyze the data while emphasizing
 how often-overlooked dimensions of the online media environment play a crucial
 role in the observed information-sharing patterns. In particular, we show how the
 following three dimensions matter: (1) online media posts’ geographic location in
 relation to local exposure to the virus; (2) the platforms and types of media chosen
 for discussing various topics; and (3) temporal variations in information-sharing
 patterns. Our descriptive analyses of the multimedia data suggest that studies that
 overlook these crucial aspects of online media may arrive at misleading conclusions
 about the observed information-sharing patterns. This could impact the success of

Dambanemuya: henrydambanemuya2023@u.northwestern.edu
Date submitted: 2021-01-02

Copyright © 2021 (Dambanemuya, Lin & Horvát). Licensed under the Creative Commons Attribution-
NonCommercial-NoDerivatives 4.0 International Public License. Available at: http://journalqd.org
Dambanemuya, Lin & Horvát Journal of Quantitative Description: Digital Media 1(2021) 2

 potential communication strategies devised based on data from online media. Our
 work has broad implications for the study and design of computational approaches
 for characterizing large-scale information dissemination during pandemics and
 beyond.

 Keywords: COVID-19, online media, information-sharing, quantitative analysis,
 text analysis

 Introduction

 In the aftermath of the 2009 H1N1 pandemic, John Barry predicted that apart from
vaccines, the most important weapon to fight a future pandemic would be communication (Barry
2009). In light of the novel coronavirus disease (COVID-19) that started in late December 2019
and quickly spread all around the world, Barry’s prediction is more salient now than ever before.
While it remains unclear how numerous interventions affected the global spread of the disease,
effective communication in the early days of the pandemic about measures for promoting public
health such as travel restrictions and social distancing guidelines was crucial to stemming its tide
(Kraemer et al. 2020). In the early days of the pandemic, without clear guidance on how to
adequately mitigate both the disease itself and the widespread uncertainty, COVID-19 quickly
became a global public health crisis marred by contradictions. These contradictions ranged from
conflicting information regarding the nature of the virus (e.g., “It’s just the flu”, “The flu is worse”
or “It’s worse than any flu”) to inconsistencies in public health guidelines designed to prevent
further spread of the disease. While measures like wearing face masks in public and staying at
home when one becomes ill have now been shown to temper the spread of COVID-19 (Kraemer
et al. 2020), the benefits of wearing face masks in public in the U.S., for example, were at first
heavily contested and later became subject to intense debates and controversy over individual
freedom in American society.1

 The coronavirus pandemic was accompanied by a heightened interest in quantitative
studies aiming to characterize or monitor public concerns and responses to the outbreak using
digital trace data obtained predominantly from social media like Twitter and Weibo (Depoux et al.

1 How the split over masks sums up America’s chaotic coronavirus response. June 25, 2020. The Washington Post.
Journal of Quantitative Description: Digital Media 1(2021) Characterizing COVID-19 Media 3

2020; Han et al. 2020; Li et al. 2020a; Xue et al. 2020; Mourad et al. 2020; Ferrara 2020; Alshaabi
et al. 2021; Chun et al. 2020; Park, Park, and Chong 2020). These example studies indicate that
collective discourse around COVID-19 has been investigated most extensively on social media
platforms,2 but that there is a lack of understanding about how the disease has been discussed in
other media such as discussion forums, blogs, and comments posted on news sites. An additional
shortcoming of these studies is that they rely on single media sources and geographic populations
that are not well-defined. Hence, these studies fail to provide observations that generalize to the
broader media environment. Furthermore, they risk missing temporal and spatial variations in
digital traces that indicate surges and plateaus in different online media’s attention to various
events that may correspond to key developmental stages of a pandemic (Paul and Dredze 2011;
Han et al. 2020). As a result, little is known yet about how public health information is
disseminated and discussed over time across different online media and geographies.

 To fill this research gap, our study integrates 5.2 million news articles, blog posts, and
discussion forum entries in English shared in 197 countries between December 2019 and March
2020 to describe patterns in mentions of coronavirus-related information during the early months
of the pandemic. We focus on this time frame because initial periods are crucial to outbreaks of
infectious diseases. This is when interventions can make the biggest difference in avoiding large-
scale transmission (Li et al. 2020b). Yet, in the early period of an epidemic when information about
cases, symptoms, and disease-related practices is most needed, there is typically a severe lack of
such information (Chen and Yu 2020). Thus, collecting knowledge from a large number of people
(i.e., crowdsourcing) can be a valuable way to fill the information gap (Desai et al. 2020).

 From these data, we observed temporal variations in information-sharing patterns that
correspond to key developmental stages of the pandemic and demonstrate the selectivity and reach
of different online media. We show that, notwithstanding variations in selectivity and reach,
different online media in this data set play a potentially crucial role due to their temporal variations
in sentiment and cognitive processes with respect to different coronavirus-related topics of interest.

 Furthermore, we illustrate how the data may be analyzed to elucidate theories of global
media (Lievrouw and Livingstone 2002; Couldry and Hepp 2012; Flew 2018) by highlighting the

2
 For access to separate large-scale data sets containing coronavirus-related content from Twitter, see for example
(Chen, Lerman, and Ferrara 2020; Dimitrov et al. 2020).
Dambanemuya, Lin & Horvát Journal of Quantitative Description: Digital Media 1(2021) 4

importance of the spatial, temporal, and socio-technical dimensions of digital media that are often
overlooked in the study and design of existing computational approaches for characterizing large-
scale online behavior. Consequently, we show the importance of integrating different online media
sources for public health information access, dissemination, and monitoring by demonstrating that
whatever may be observed in any one medium may not generalize to the broader media
environment at any given time. Finally, we utilize a computational approach for detecting dynamic
cross-media leader–follower relationships, which can provide public health officials new insights
on how to detect inconsistencies and information delays in multimedia information streams in
order to combat communication problems in future pandemics.

 Studies of Online Media During Pandemics

 The increasing availability of unstructured text data and computing power has led to
advances in information extraction, natural language processing, and knowledge representation
with important applications such as characterizing scientific production (Murdock, Allen, and
DeDeo 2017), conversations about climate change (Roxburgh et al. 2019), and civil discourse in
peace processes (Nigam et al. 2017). In the recent past, studies of online media during pandemics
have grown in popularity because the ability to detect, monitor, and predict disease trends can
allow governments and health organizations to plan and allocate resources for treatment and
prevention more effectively. These studies demonstrate that news articles, web blogs, social media,
and discussion forums are effective indicators of influenza activity including in the H5N1 (2004),
H1N1 (2009), and H7N9 (2013) pandemics. Text and structural data mining of these media has
been applied in monitoring disease trends and behavioral risk factors (Paul and Dredze 2011),
evaluating public responses to health crises (Choi et al. 2016; Chew and Eysenbach 2010), and
identifying online communities for targeted public health communication (Corley et al. 2010).

 Historically, most studies have relied on a single online media source e.g., Twitter (Chew
and Eysenbach 2010; Paul and Dredze 2011; Kostkova, Szomszor, and St. Louis 2014; Lee,
Agrawal, and Choudhary 2017), blog posts (Corley et al. 2010), online newspapers (Choi et al.
2016), or web-based search (Ginsberg et al. 2009; Goel et al. 2010). Twitter is the most commonly
studied because it allows for relatively straightforward data access, is public, is used worldwide,
and is believed to be suitable for tracking disease trends due to its high frequency of posts and
availability of text for natural language processing (Alessa and Faezipour 2018). Despite their
proclaimed effectiveness in monitoring infectious disease trends, there are real-world instances
Journal of Quantitative Description: Digital Media 1(2021) Characterizing COVID-19 Media 5

when online sources have failed to provide reliable predictions e.g., in Google Flu Trends’ inability
to accurately detect seasonal and pandemic influenza at different temporal and geographic scales
(Olson et al. 2013; Butler 2013; Lazer et al. 2014). Recognizing the need for more reliable public
health monitoring tools, other studies have demonstrated the need for and effectiveness of
complementing real-time social media data streams with influenza-like illness (ILI) data from the
Center for Disease Control’s (CDC) sentinel practices for more timely and accurate disease
monitoring and predictions (Olson et al. 2013; Lee, Agrawal, and Choudhary 2017).

 Beyond detecting and predicting infectious disease trends, quantitative analysis of online
media to characterize how people are responding to and coping with emerging health crises can be
problematic. As this study illustrates, the main issue here is that the use of such media is not
uniform across time and geography. Hence, the choice of which online media to use for data
collection may result in misleading conclusions about which behaviors are representative at scale.
We further illustrate that information-sharing behaviors in online media are often characterized by
cross-media interaction and diffusion processes (Kostkova, Szomszor, and St. Louis 2014; Park,
Park, and Chong 2020). As a result, these intricate sharing patterns require special attention to how
crucial information circulates through different media so as to help design and implement effective
communication strategies during pandemics. Finally, compared to studies that aim to monitor and
predict disease trends with online media, there are far fewer efforts aimed at characterizing online
media to understand the evolving situation in order to develop efficient emergency response
strategies (Chew and Eysenbach 2010; Choi et al. 2016). To complement these and early
coronavirus-related studies that make similar attempts (Han et al. 2020; Chun et al. 2020; Li et al.
2020a), we rely on descriptive quantitative analyses to show that this non-trivial endeavor requires
careful consideration of the spatial, temporal, and socio-technical dimensions of different online
media.

 Materials and Methods

 We rely on free and publicly available third-party data obtained through the WebHose.io 3
Application Programming Interface (API).4 The WebHose API has gained popularity in a variety

3 https://webhose.io/
4In this context, an API is a software that allows the large-scale collection and storage of content from specific web
pages.
Dambanemuya, Lin & Horvát Journal of Quantitative Description: Digital Media 1(2021) 6

of recent Web studies ranging from assessing population awareness about scientific innovations
(Monsores et al. 2020) to investigating news virality in social media (Manoharan and Senthilkumar
2020). The API collects regularly updated unstructured content from the Web including blogs,
news articles, and associated online discussions such as comments, reviews, and message boards.
Specifically, the API starts with domain names like BBC.com and Reddit.com, then collects all
the content found on web pages containing the keywords “COVID”, “coronavirus” or “corona
virus” in the content’s title or text. This data collection occurs multiple times a day throughout the
timeframe covered in the data set. To avoid duplicate entries, the content is filtered based on URLs.
Two posts with unique URL information, but identical content are indexed as two separate records.
This way of tracking posts captures the organic nature of digital distribution while eliminating
duplicate entries. For example, a coronavirus-related article on CNN.com with multiple versions
that are all associated with a single URL is recorded as a single post. However, every unique URL
that quotes or even reproduces a CDC press release word-for-word is indexed as a different post.

 Although it is technically feasible to collect virtually any web source, the WebHose API
does not gather content whose access requires providing personal information as part of a
verification process, such as social media posts, or other content that is not public. Additionally,
paywalled news content like the New York Times is not included in the data. Strict compliance
with this policy ensures user privacy and respects requirements for paid subscriptions. The fact
that our data set excludes social media posts and subscription-based news sites might bias them,
for instance, against certain age groups that are most active on social media and people with a
higher socioeconomic status who are more likely to pay for news subscriptions.

 The entire collection of Webhose sources includes, but is not limited to, the top 500 Alexa 5
sites listed in each country and for each medium. The Alexa top 500 list is based on a global traffic
rank that measures a website’s performance relative to all other sites over the past 3 months. The
rank is calculated using a proprietary methodology that combines a site’s estimated average of
daily unique visitors and its approximate number of page views. While the Alexa rankings change
from time to time and the Webhose API continually adds new sources to their data feeds, we
selected the set of sources that are constant from the beginning to the end of the study period in
order to ensure consistency.

5 https://www.alexa.com/
Journal of Quantitative Description: Digital Media 1(2021) Characterizing COVID-19 Media 7

 With this process, the API collected 5.2 million English-language news articles, blog posts,
and discussion forum entries that mention coronavirus-related terms. The gathered content was
posted in 197 countries6 between December 2019 and March 2020. For each entry in the data set,
we have the posting date and time, the title and text, the number of unique individuals that
commented on the entry, the total number comments (including comment replies), and the platform
name and country in which the entry was posted. The news corpus consists of 2,711,460 documents
from 46,867 news agencies such as CNN, U.S. News and World Report, Fox News, and The
Guardian. A political alignment analysis of the news sources based on an established list of the
top 500 most shared websites on Facebook (Bakshy, Messing, and Adamic 2015) indicates that
the news media capture diverse political viewpoints. The blogs corpus consists of 1,270,925
documents from 53,629 individual bloggers and large blogging services such as Blogspot,
WordPress, and Yahoo!. The discussions corpus consists of 1,272,150 posts from 3,360 message
boards, commenting widgets, and review sites. We consider each discussion forum entry to be a
unique document, hence the shorter document size (mean = 119 words per document) compared
to news and blog documents (512 and 499 words per document, respectively). While Reddit
comprises 20.3% of the discussion posts, the rest of the posts are from a diverse set of lesser-
studied discussion forums such as the US Message Board (a US-based political forum), Mumsnet
(the UK’s most popular discussion board for parents), and Nairaland (the second most visited local
website in Nigeria). It is important to highlight that these discussion forum entries are different
from the previously heavily studied social media posts. Consequently, these data provide a
complementary view to extensive research relying exclusively on social media. Collectively, the
data characterize the high-choice media environment that people navigate and integrate into their
daily lives. Table 1 provides summary statistics of the data for each media. In the following section,
we describe our data pre-processing technique for obtaining common topics across the online
media covered in the data set, then we describe three analysis techniques to illustrate potential
approaches that one may use to analyze these data.

 Table 1: Summary statistics of news articles, blog posts and discussion forum entries in all
 three media.
 Variable Number of Number of Number of Words per
 Document

6The country associated with each post is inferred by the API based on several signals including domain name and
IP address.
Dambanemuya, Lin & Horvát Journal of Quantitative Description: Digital Media 1(2021) 8

 Documents Countries Sources (μ, )

 News 2,711,460 197 46,867 512 (608)
 Articles

 Blog 1,270,925 147 53,692 499 (797)
 Posts

 Discussion 1,272,150 81 3,360 119 (225)
 Forum Entries

 Data Pre-processing

 We used the same data pre-processing techniques on all three types of online media. We
only considered posts with at least 100 words to allow for reliable topic extraction and text-based
measures of sentiment, cognitive processes, and time orientation. This preserves 70.8% of the
initial data, i.e., in total 3,721,642 posts (2,323,528 news articles, 985,949 blog posts, and 412,165
discussion comments). Using a combination of bi-gram frequency and qualitative evaluations, we
further identified five commonly discussed topics that reflect some of the major concerns during
the early months of the pandemic. These topics include medical supplies (in general and test kits);
Personal Protective Equipment (PPE) e.g., face masks and hand sanitizer; public health guidelines
on social distancing and to shelter in place; school closures and travel ban restrictions; and the
seasonal flu and common cold (see Table 2 for the full list of selected topics and sub-topics). Due
to the alignment of trends at the level of topics and sub-topics, henceforth we will use the more
comprehensive and robust topics to investigate details of coronavirus-related information
spreading. The highlighted topics represent 30% of the total volume. The remaining 70% of the
data set comprises a variety of topics that were not common across all three media and hence do
not allow comparative analysis of the same issues across different platforms. These excluded
topics dealing with prominent people (e.g., Donald Trump, Joe Biden, Bernie Sanders, Boris
Johnson, etc.), events (e.g., the postponement of sporting events such as the English Premier
League and the Tokyo Olympics), places (e.g., China, Hong Kong, South Africa, South Korea,
etc.), and organizations (e.g., the White House, World Health Organization, and Center for Disease
Control). As an illustration of potential analyses that one may conduct to examine the topics, we
Journal of Quantitative Description: Digital Media 1(2021) Characterizing COVID-19 Media 9

present three approaches for investigating patterns of information sharing, linguistic measures of
sentiment and cognitive processes, and information delays in topic coverage across the different
online media.

 Descriptive Statistics

 Data collected by the Webhose API allows us to describe basic information sharing patterns
and obtain a fundamental understanding of user interaction with coronavirus-related content. We
rely on the set of measures described below to investigate systematically patterns of information
sharing on different media environments in (1) a broad corpus-level analysis comprising all
COVID-19 related content; and (2) a smaller topic-level corpus comprising the five common topics
discussed at different geographic and temporal scales.

 Corpus-Level Measures: For the entire COVID-19 data set, we rely on the number of
posts each day as a proxy for daily volume. We also use the number of unique individuals that
comment on a post as a proxy for the post’s popularity. Similarly, we use the total number of
comments and replies to quantify users’ engagement with a post.

 Topic-Level Measures: We measure a given topic’s daily volume by counting the number
of posts that belong to the topic each day. Since the daily volume of data collected by the
Webhose.io API varies over time and hence can add noise or bias to temporal patterns in topic
frequencies, we normalize the daily topic volume in each media by computing the topic share as
the ratio of a topic’s volume to the total number of posts on the same media. We further compute
the ratio of the standard deviation to the mean of each topic’s daily volume as a proxy for topic
variability. This measure quantifies the extent to which a topic’s volume fluctuates or remains
consistent over time. Related to topic variability, we use the number of distinct days that a topic
was covered or mentioned at least once in online media as a measure of the topic’s prominence.
Thus, prominent topics will sustain prolonged media coverage, whereas less prominent topics will
be short-lived. Additionally, we use the popularity of and engagement around posts to compute a
topic’s popularity as the sum of unique individuals that comment on all the posts that belong to
the topic and a topic’s engagement as the total number of comments and replies on all the posts
that belong to the topic. Table 2 provides summary statistics for the topic-level measures in the
selected topics.
Dambanemuya, Lin & Horvát Journal of Quantitative Description: Digital Media 1(2021) 10

 Content Analysis

 In addition to investigating patterns of information sharing with various coronavirus-
related topics, we evaluated the content of the disseminated information. To perform sentiment
analysis, we used a Valence Aware Dictionary and sEntiment Reasoner (VADER) rule-based
model constructed from a generalizable, valence-based, human-curated gold standard sentiment
lexicon (Hutto and Gilbert 2014). We then used Linguistic Inquiry Word Count (LIWC, 2015)
(Pennebaker, Francis, and Booth 2001) text analysis to evaluate cognitive process measures of
certainty and discrepancy about coronavirus-related information. Certainty refers to the extent to
which a post’s language does not signal doubt, whereas discrepancy reflects the degree of
disagreement or inconsistency in a post’s language. Given the widespread uncertainty about the
nature of the virus and contradictions about public health guidelines at the beginning of the
pandemic, these cognitive processes are vital and relevant to characterizing coronavirus-related
topics.

 Information Delay in Online Media

 We rely on windowed Time Lagged Cross Correlations (TLCC) to detect dynamic cross-
media information delays in topic coverage between the different media. To quantify cross-media
information delay for any pair of media signals, f and g, where each signal represents the media’s
daily topic volume, we begin by splitting the signals into 7-day time windows to account for the
major source of periodical change in the data. We then calculate the cross-correlation function

 0 +
 ( ∗ )( ) ≜ ∫ ̅̅̅̅̅̅
 ( ) ( + )
 0

 for each time window of the duration of the two media signals while shifting the time
windows by the lag , i.e., the point in which a feature in at time occurs in at time + .
occurs in increments smaller than the duration of time window, T = 7. The cross-correlation
function therefore quantifies the extent to which the two signals co-vary over time. Finally, to
determine the time delay between each pair of signals, we compute the peak correlation point in
time where the signals are best aligned such that
 = argmax(( ∗ )( )).
 ∈
Journal of Quantitative Description: Digital Media 1(2021) Characterizing COVID-19 Media 11

 We then rely on the time delay measure to detect cross-media “leader–follower”
relationships in topic coverage. Specifically, we uncover which leader medium had priority in
discussing a topic and potentially resulted in information diffusion to a follower medium.
Furthermore, we investigate how these relationships between media vary over time and give rise
to dynamic leader–follower rapports.
Dambanemuya, Lin & Horvát Journal of Quantitative Description: Digital Media 1(2021) 12

 Table 2: Descriptive statistics for all the posts belonging to the most commonly discussed topics (italics) and sub-topics during
 the early months of the COVID-19 pandemic.
 Topics and Volume Variability Prominence Popularity Engagement

 sub-topics (# of posts) (variation in (# of days (# of unique (# of comments
 volume) mentioned) users) and replies)
 Medical Supplies 120,265 (3.231%) 1.159 (0.212) 74.333 (8.083) 88,365 (56,012) 212,745 (195,492)
 Medical Supplies 74,370 (1.998%) 1.245 (0.213) 70.000 (6.928) 38,191 (21,874) 80,306 (85,211)
 Test Kits 51,382 (1.381%) 1.090 (0.122) 72.333 (5.508) 52,572 (40,493) 136,678 (118,867)
 PPE 225,659 (6.06%) 1.016 (0.111) 83.667 (6.506) 133,254 (76,798) 149,350 (163,657)
 Face Mask 129,617 (3.483%) 0.813 (0.064) 82.667 (6.028) 67,746 (36,081) 69,013 (70,593)
 Hand Sanitizer 115,500 (3.103%) 1.174 (0.124) 73.663 (3.512) 74,343 (46,595) 85,837 (100,845)
 Guidelines 459,323 (12.341%) 1.719 (0.140) 73.000 (4.359) 254,951 (129,960) 331,278 (290,913)
 Shelter in Place 125,693 (3.377%) 1.587 (0.151) 72.667 (4.619) 67,582 (36,797) 86,369 (76,920)
 Social Distancing 372,115 (9.999%) 1.695 (0.126) 66.667 (2.517) 201,899 (97,664) 252,711 (222,214)
 Restrictions 126,591 (3.401%) 1.353 (0.062) 77.333 (6.658) 71,745 (38,535) 156,441 (157,031)
 School Closure 58,309 (1.567%) 1.311 (0.225) 62.333 (11.930) 27,560 (13,501) 41,398 (36,044)
 Travel Ban 70,818 (1.903%) 1.322 (0.077) 77.000 (6.928) 45,284 (25,777) 115,860 (123,412)
Note. The values are aggregated over news, blogs, and discussion forums. The table shows the total volume (% topic share) of each topic,
as well as the means and standard deviations of the variability (variation in volume), prominence (number of days mentioned), popularity
(number of unique individuals that posted comments), and engagement (total number of comments and replies) measures for the
considered topics and sub-topics. The summary statistics show that public health guidelines such as sheltering in place and social
distancing had the highest mean daily volumes and variability while the seasonal flu had the highest mean prominence, popularity and
social engagement.
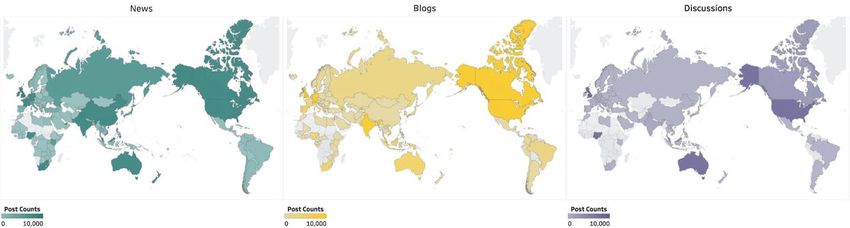
Journal of Quantitative Description: Digital Media 1(2021) Characterizing COVID-19 Media 13

 Results

 We evaluated and characterized the spatial, temporal, and socio-technical dimensions of
coronavirus-related information in different online media during the first few months of the
COVID-19 pandemic. The following results provide empirical evidence to support communication
theories that underscore the importance of geography, platforms, and temporal aspects in global
online media (Flew 2018; Lievrouw and Livingstone 2002; Couldry and Hepp 2012).

 Geography Matters

 We observe variations in the geographic coverage of each media and in the extent to which
coronavirus-related information is disseminated in different locations within each media (Figure
1). Specifically, countries such as the U.S., Britain, and Australia have high coverage in all three
media, while other countries like Russia, Canada, and South Africa show varying levels of
coverage.7 We observe the highest information concentration in discussion forums whereby the
US accounts for 77.3% of the total discussion forum entries. While on the one hand these
observations may reflect differences in global media cultures (Couldry and Hepp 2012), we
anticipate that these observations may also indicate an uneven global distribution of new media
technologies (i.e., blogs and discussion forums) as well as people’s access to and ability to use
them (Bagdikian 2007; Flew 2018). Whereas these possibilities are worth investigating, we also
acknowledge that these observations may be due to the limitations of our data which only contain
English language media.

7 The authors acknowledge the distorted shapes and sizes of the continents in the Mercator map projection.
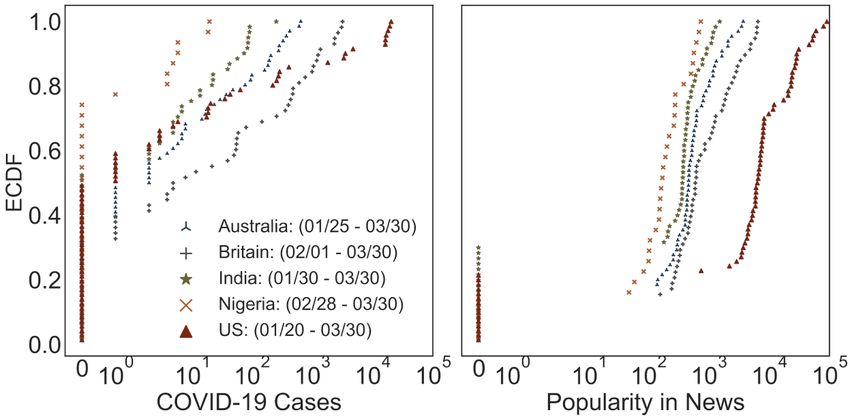
Dambanemuya, Lin & Horvát Journal of Quantitative Description: Digital Media 1(2021) 14

 Figure 1: Geographic coverage of the news, blogs, and discussion forum posts shows
 country-level variations in volume in different media.

 Similar to previous studies that demonstrate the effectiveness of online media activity in
predicting disease spread (Corley et al. 2010; Paul and Dredze 2011; Kostkova, Szomszor, and St.
Louis 2014; Lee, Agrawal, and Choudhary 2017), we further investigated the extent to which
geographic variations in information spreading reflect the spatial patterns in the prevalence of the
coronavirus disease. We collected data on daily coronavirus cases from the World Health
Organization’s COVID-19 database8 and compared the Empirical Cumulative Distribution
Functions (ECDF)9 of the coronavirus disease’s initial progression to those of the unique number
of users commenting on posts in a smaller but geographically diverse sample of the countries with
the highest media volume. For each of the 5 selected countries (Australia, Britain, India, Nigeria,
US) on five continents, we filtered the online media data to correspond to the time period where
data on COVID-19 cases is available for each country. Essentially, to create the ECDF, we
arranged the individual data points for each measure on the x-axis in ascending order. Then, for

8 COVID-19 cases data obtained from: https://covid19.who.int/
9 The figure is empirical in the sense that it shows real-world data as opposed to theoretically-derived functions. It
displays a distribution function because instead of showing the temporal progression of the disease (Left) or
popularity of content on news media (Right), it shows the normalized frequency of specific case numbers (Left) or
comments in news media (Right) such that they add up to 1 in each sub-figure. Since the observed frequencies are
normalized for each country, we can make systematic comparisons between them. The comparison is also aided by
the fact that the data are displayed cumulatively meaning that the y-axis shows the fraction of data points that have a
value smaller than or equal to the corresponding value shown on the x-axis. For example, daily COVID-19 cases at
or below 100 are observed for a fraction of 0.67 of the cases (i.e., roughly 67% of the data points) in Britain and for
about 83.3% of the data points in Australia. Similarly, up to 1,000 comments are observed in 22.8% of news articles
in the US, while in 70% of the news articles in Britain.
Journal of Quantitative Description: Digital Media 1(2021) Characterizing COVID-19 Media 15

each value on the x-axis, we computed the value’s probability of occurrence. Finally, on the y-
axis, we plotted the sum of the assigned probabilities up to and including each x-axis value.

 The results of the ECDF comparison (Figure 2) show that the popularity of news media
among online users reflects the real-world prevalence of COVID-19. For example, in our top 5
country data sample, we observe that the United States has both the most COVID-19 cases and
highest number of users that comment on news articles (Figure 2, Left). Given that different
countries have been disparately affected by the pandemic, it is interesting to further observe that
the number of unique users commenting in news reflects the development of the disease in all the
top 5 countries with the highest media volume (Figure 2, Right). Consistent with previous studies
demonstrating that signals deduced from patterns of information sharing are strongly correlated
with events happening on the ground (Chew and Eysenbach 2010; Han et al. 2020), we observe
that the cumulative number of COVID-19 cases is strongly correlated with total news media
volume (r = 0:761; p < 0:001), maximum popularity (r = 0:618; p < 0:001), and maximum
engagement (r = 0:608; p < 0:001) in the overlapping periods between each country’s COVID-19
incidence and news media posts. Importantly, these trends hold for each of the 55 countries where
we have both COVID-19 case data and online media data. Moreover, they are consistent for blogs
and discussion forums as well.10

 Geography therefore matters because it reflects local conditions as public health actions
are taken locally (Olson et al. 2013). Additionally, geography matters because it influences the
underlying dynamics through which people in different places at particular times use different
media available to them to make sense of their social environment (Flew 2018). The implication
of such descriptive analyses is that for population monitoring systems to better reflect the situation
on the ground, they need to consider the spatial dimension of their media sources to account for
the ways in which people in different locations interact with media given their existing
circumstances (e.g., prevalence of a pandemic) while also taking into account the particularities of
the different media.

 We have made our data and supplementary analyses available at: https://github.com/LINK-NU/JQD-DM-
10

COVID-19.
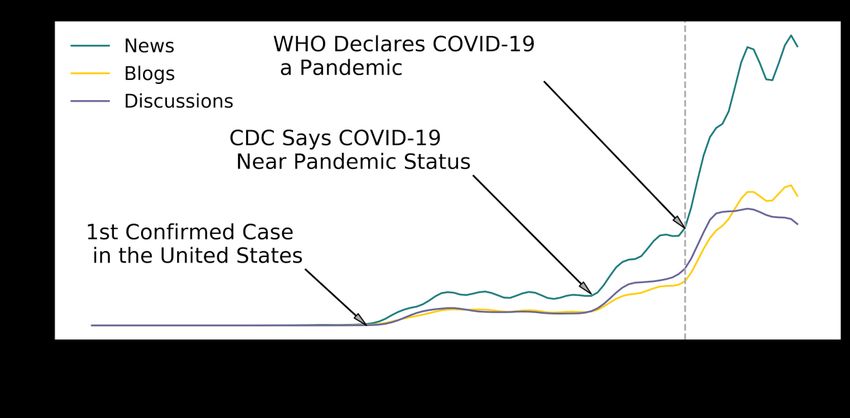
Dambanemuya, Lin & Horvát Journal of Quantitative Description: Digital Media 1(2021) 16

 Figure 2: Empirical Cumulative Distribution Functions (ECDF) of initial COVID-19
 progression (left) and daily popularity in news (right) in the top five countries by volume.
Note. The figure shows that the number of unique users commenting on coronavirus-related news
(i.e., popularity in news) at the beginning of the pandemic reflects the development of the disease
across geographically diverse locations. See note 9 for details about ECDFs and their
interpretation.

 Platforms Matter

 We further consider the news, blogs, and discussions media as platforms (i.e., the
technological means of communication) and investigate patterns of information sharing across the
different media. Due to the observed variations in the geographic coverage of each media, we
performed the rest of our analysis on data from 55 countries that are common between all the
media to minimize potential geographic confounding effects. In all media, changes in the
prevalence of coronavirus-related topics correspond to key developmental stages of the pandemic
(Figure 3). For example, the highest change in daily media volume occurs around the 11th of
March, which is the day that the World Health Organization made the assessment that COVID-19
could be characterized as a pandemic.
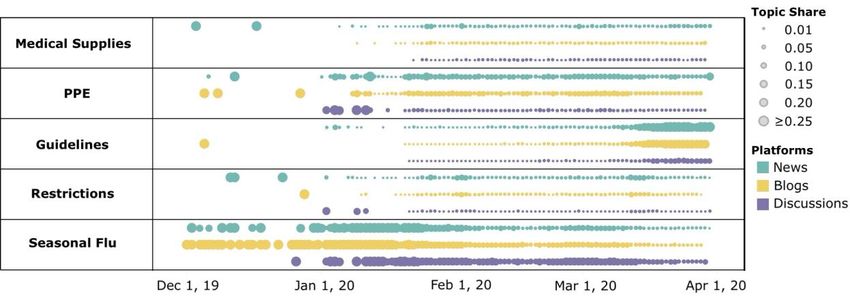
Journal of Quantitative Description: Digital Media 1(2021) Characterizing COVID-19 Media 17

 Figure 3: Daily 7-day rolling volume (i.e., total number) of coronavirus-related posts.

 We proceeded by investigating how the different online media disseminated information
about common coronavirus-related topics at the beginning of the pandemic and observed non-
trivial differences in temporal patterns of information sharing between the media (Figure 4). The
media vary in terms of when they began to consistently disseminate information about these topics,
the topic’s volume as a proportion of the total post volume over time, and the prominence of each
topic across the different media. Most notably and unsurprisingly, news media have the highest
prominence across all the topics and were the first to consistently and widely disseminate
coronavirus-related information. While news media were the first to publicize information on
restrictions and guidelines, we observe that all media were delayed in propagating public health
guidelines on social distancing and strict measures to shelter in place that were essential to slowing
down the spread of the disease (Kraemer et al. 2020).
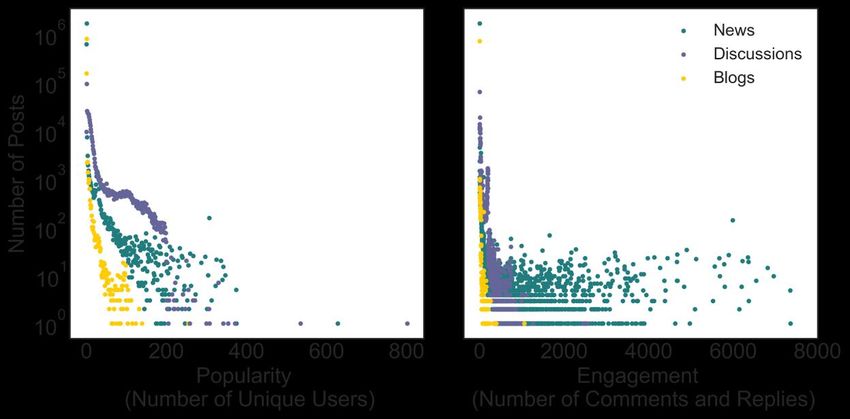
Dambanemuya, Lin & Horvát Journal of Quantitative Description: Digital Media 1(2021) 18

Figure 4: Temporal patterns of information sharing in news, blogs, and discussion forums.
Note. Circle size represents the daily topic share.

 We further investigated how users interact with information that is shared in the different
online media and observe differences in popularity and engagement (Figure 5). The highest
engagement based on the number of comments and replies is observed in news articles while blog
posts have the least user interaction both in terms of user popularity and engagement. Although
discussion forum posts have on average the highest popularity, we observe a few news articles that
were shared by the highest number of unique users overall. A further manual content analysis of
these outlier news articles shows that they relate to the nature of the coronavirus disease, how it
spreads, and medical conditions that are thought to be associated with COVID-19 complications
and mortality.
Journal of Quantitative Description: Digital Media 1(2021) Characterizing COVID-19 Media 19

 Figure 5: Popularity and engagement with coronavirus-related information in different
 online media.
Note. The x-axis contains the quantity being measured (i.e., popularity or engagement) and on the
y-axis, we show the number of posts that have the corresponding x value. For example, there is
only 1 discussion forum post with a popularity of 800 and there are 1 million blog entries with no
engagement. The plot shows that discussion forum posts have the highest popularity while news
articles have the highest engagement.

 The observation that the online media with the greatest number of people that post
comments (i.e., popularity) is not the same as the media with the greatest number of comments
(i.e., engagement) suggests a mixing in online media use. This non-random mixing highlights the
choices that people make about which online media to use in different contexts and hence
demonstrates that these media are not technologically deterministic but constitutive of society
(Lievrouw and Livingstone 2002). These findings further support previous studies, both
empirically and at scale, that demonstrate the selectivity and reach that online media afford users
from different demographics in their choice of and interaction with different media (Hargittai
2015; Blank and Lutz 2017). While the specific socio-demographics that matter may differ, the
overwhelming consensus is that people do not select into the use of such sites randomly; rather,
factors such as age, gender, race/ethnicity, and socioeconomic status relate to who ends up on such
sites. Even during the COVID-19 pandemic, over 46% of a representative sample of 10139 U.S.
Dambanemuya, Lin & Horvát Journal of Quantitative Description: Digital Media 1(2021) 20

adults surveyed in April, 2020, said national and local news outlets are their major source for news
about the coronavirus outbreak, while 10% mostly relied on online forums and discussion groups.11
 In addition to investigating how people interact with information in different online media,
we further examined the nature of the content that they interact with and observed variations in the
sentiment and cognitive processes of the language used across the different online media. The
results of our sentiment analysis show that sentiment towards common coronavirus-related topics
is sometimes inconsistent across the different online media (Figure 6). For example, discussion
forum posts have negative sentiment towards medical supplies and restrictions while the sentiment
towards these topics is positive in news and blog posts. Even for topics where the sentiment aligns
in all three media (e.g., PPE and seasonal flu) we observe that discussion forum posts are the most
negative and blog posts the most positive. These findings are consistent with previous studies that
show, for example, that health organizations frame the same issues differently in different online
media to maximize public attention and meet different emotional needs (Liu and Kim 2011). These
analyses further highlight that the choice of online media determines what one might conclude
about how people and organizations are responding to emerging events. As a result, relying on one
media source to understand such dynamics may fail to accurately reflect how people respond to
the situation on the ground.

11Local news is playing an important role for Americans during COVID-19 outbreak. July 2, 2020. Pew Research
Center, Washington, D.C.
Journal of Quantitative Description: Digital Media 1(2021) Characterizing COVID-19 Media 21

 Figure 6: Mean sentiment towards common COVID-19 topics in the early months of the
 pandemic.
Note. The sentiment shows media-based differences in public perceptions towards medical
supplies and restrictions.

 These findings compelled us to investigate variations in other linguistic measures across
the different online media. Considering the widespread uncertainty in information about various
unknown aspects about the coronavirus disease during the early months of the pandemic, we used
the dictionary-based text analysis framework, LIWC, to evaluate cognitive process measures of
certainty and discrepancy in coronavirus-related posts. We computed the daily certainty and
discrepancy measures for all the posts in each media and compared the difference in means using
one-way analysis of variance (ANOVA). We observed significant differences in the certainty and
discrepancy measures between all three media. To further investigate which media are
significantly different from each other, we performed multiple post-hoc pairwise comparisons
using Tukey’s Honest Significant Difference (HSD) test and observed significant differences
between news articles and discussion forum posts (t = 2:938; p = 0:009; t = 3:300; p = 0:003) and
between news articles and blog posts (t = 2:737; p = 0:017; t = 2:705; p = 0:019) in both the
certainty and discrepancy means (Table 3). We found no significant difference in means between
blog posts and discussion forum posts in either measures. Additionally, we observed that
discussion forum posts have the highest mean certainty compared to blog posts and news articles,
which indicates frequent usage of absolute words such as “never” and “always” in the discussion
Dambanemuya, Lin & Horvát Journal of Quantitative Description: Digital Media 1(2021) 22

forum posts despite them also having the highest mean discrepancy measure compared to blog
posts and news articles (Table 3).

 Table 3: Post-hoc Tukey Honestly Significant Difference (HSD) test results for one-way
 ANOVA on certainty and discrepancy measures obtained from Linguistic Inquiry Word
 Count (LIWC) text analysis.
 Mean Mean Difference Standard T p-value
 (Media 1) (Media 2) Error

Certainty
 Blogs - Discussions 0.876 0.888 -0.011 0.056 -0.201 0.900
 Blogs - News 0.876 0.722 0.154 0.056 2.737 0.013
 Discussions - News 0.888 0.722 0.166 0.056 2.938 0.009
Discrepancies
 Blogs - Discussions 0.913 0.950 -0.037 0.062 -0.595 0.837
 Blogs - News 0.913 0.744 0.169 0.062 2.705 0.019
 Discussions - News 0.950 0.744 0.206 0.062 3.300 0.003

 These trends align with our expectation that the lack of gatekeeping as well as the social
and educational diversity of people that interact with blogs and discussion forums compared to the
professionally-edited nature of news media result in high discrepancy, yet also high certainty.
These media differences have implications for how both the level of certainty and the veracity of
claims about important public health-related information in different online media may influence
people’s perceptions of risk and their behavior. This is a particularly important implication in light
of previous studies that demonstrate how people’s reliance on different types of media (e.g., TV,
newspaper, or internet sources) is a strong predictor of their health risk perceptions, including in
the COVID-19 pandemic (Lin and Lagoe 2013; Bridgman et al. 2020).

 The above findings demonstrate that platforms matter because they exhibit different
patterns of information sharing and social engagement, convey information that relates to different
temporal frames of reference, and indicate how people respond to emerging situations and what
Journal of Quantitative Description: Digital Media 1(2021) Characterizing COVID-19 Media 23

information they receive about those situations. In contrast to previous studies which only address
the outcomes or impacts of single online media sources in public health monitoring, our findings
demonstrate that platforms matter because the media content does not exist independently from
the technical infrastructures and social practices through which it is produced and disseminated
(Lievrouw and Livingstone 2002), hence different online media platforms play a varied and crucial
role in characterizing public responses to crises.

 Time Matters

 Realizing that variations in topic sentiment and cognitive processes are not coherent across
the different media, we further investigated topic sentiment at a more granular temporal level
(Figure 7). We observe interesting temporal variations both within and across the different online
media. Within each medium, we observe that the temporal unit of analysis and observation window
that one may decide upon has a pronounced impact on the resulting findings and may lead to
misleading conclusions about what one is observing. For example, when examining public
sentiment towards public health guidelines and personal protective equipment, it would be
misleading to conclude that, on average, all three media reflected positive sentiment towards these
topics (c.f. Figure 6). In reality the sentiment towards both topics was negative for the most part
during the first 12 weeks, and later became positive at a time when the topic volume was much
higher than it had previously been. These findings therefore demonstrate that time matters and
with these data one can monitor how peoples’ experiences, perceptions, and attitudes change over
time (Chew and Eysenbach 2010).
 Across the different media, we further observe that while public sentiment towards the
different topics is mostly coherent during the first 12 weeks, the media begin to reflect different
sentiments towards the same topics in the last 4 weeks of our observation period. These findings
demonstrate that even when the overall topic sentiment is aligned in the different media (c.f. Figure
6), there may be dynamic sentiment variations and misalignment at different temporal scales that
indicate the ephemeral way in which different online media reflect public perceptions about
emerging events (Figure 7). These findings are also consistent across language-based indicators of
cognitive processes and have important implications for the robustness of results and conclusions
that one may arrive at if they fail to take into account temporal considerations. This is also
important for big data endeavors aiming to advance our understanding of large-scale behavior from
digital trace data. It is essential that the research community is able to replicate findings with data
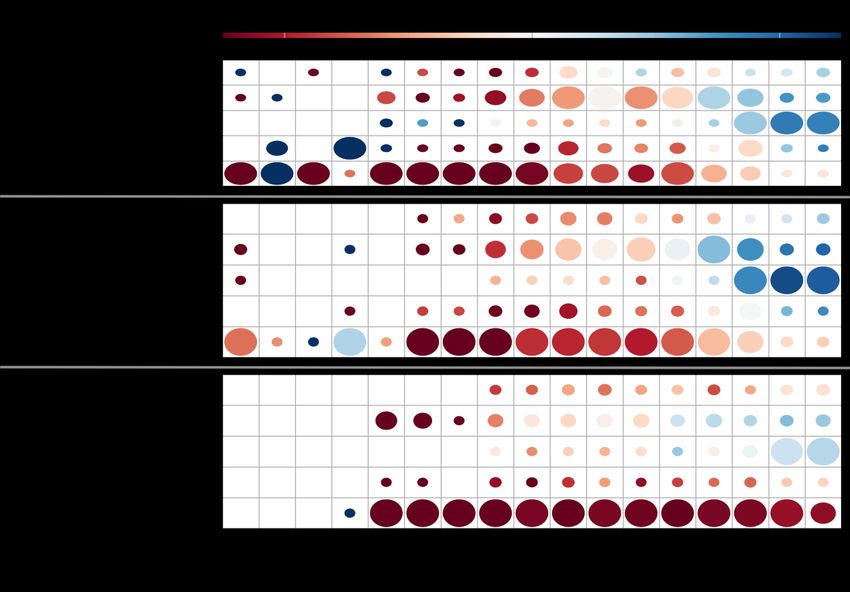
Dambanemuya, Lin & Horvát Journal of Quantitative Description: Digital Media 1(2021) 24

across different time scales and using different sources in a way that identifies robust and
meaningful patterns.

 Figure 7: Dynamic sentiment trends for common coronavirus-related topics.
Note. The circle radius represents the normalized weekly topic volume.

 In our final analysis, we investigated dynamic cross-media leader–follower relationships
between the different online media and observed temporal variations in which medium includes
information about a certain topic first (leader) as opposed to which other medium catches up later
with information on the same topic (follower) (Figure 8). Similar to our previous findings, the
granular temporal picture shows that one might also arrive at misleading conclusions about leader–
follower media sequences depending on their choice of observational window or temporal scale.
For instance, we observe that at the monthly scale, news leads in discussing the seasonal flu only
25% of the time across the span of 15 weeks, while at the weekly scale, news leads 60% of the
time. These media leader–follower relationships are important with respect to several studies
demonstrating that online media do not exist in isolation and that information resources (e.g., web
links to different health-related content) from one medium can diffuse and propagate to other
Journal of Quantitative Description: Digital Media 1(2021) Characterizing COVID-19 Media 25

media (Chew and Eysenbach 2010; Kostkova, Szomszor, and St. Louis 2014; Park, Park, and
Chong 2020). Additionally, while breaking news often propagates to other online media (e.g.,
blogs and discussion forums), sometimes events of local importance are first reported in discussion
forums, including many that never reach the news (Agarwal et al. 2012). As our results show (see
Figure 8), these dynamic leader–follower relationships fluctuate and characterize potential
information delays whereby one might miss crucial information or social signals that are
observable in other online media than the one being observed.

 Figure 8: Time delay in topic coverage between news and discussions.
Note. The heatmap shows the time delay (lag) at which news and discussions have the maximum
correlation. When the lag is zero, the two media are synchronized (i.e., the correlation between
them is highest on the same day). When the lag is positive, discussions are leading news and vice
versa.
Dambanemuya, Lin & Horvát Journal of Quantitative Description: Digital Media 1(2021) 26

 Discussion

 Online media are central to the way modern society obtains and communicates pertinent
information, especially during times of crisis such as the coronavirus 2019 pandemic. In any public
health emergency, communicating effective guidelines is a complex task for governments and
healthcare agencies. The coronavirus pandemic required rapid internationally-coordinated
responses based on swiftly changing science to protect populations. This task was complicated
further by the wide existing media repertoire and the striking differences in people’s consumption
of online media sources.

 To shed light on these challenges and provide insights to tackle the fundamental
communication problem in future pandemics, our study introduced and examined large-scale data
comprised of online media posts related to COVID-19 during the early months of the pandemic
when interventions are most effective in curbing widespread transmission. We demonstrated how
to use the data to characterize patterns of information sharing, linguistic measures of sentiment
and cognitive processes, and information delays in the coverage of commonly discussed topics
during this essential period. Across different media environments, the results of our comparative
analysis revealed differences in the frequency of key topics. Our findings underscore the need for
more holistic health-information monitoring systems that reflect better how people are coping with
emerging conditions during pandemics. Such systems can build upon the methods described above
to uncover knowledge (e.g., public perceptions, sentiment, certainty, etc.) about quickly evolving
situations and related concerns from diverse online media so as to provide more reliable situational
awareness.

 A major implication of our findings towards health-information dissemination campaigns
is that determining the most appropriate media for spreading crucial information and maximizing
engagement in target audiences is critical to the effectiveness of communicating through online
media, especially when distributing potentially life-saving guidelines (Corley et al. 2010). This
entails understanding the diverse and constantly evolving ways in which people seek out
information and interact with different online media (Lievrouw and Livingstone 2002). Therefore,
to reach as many people as possible with important facts (e.g., about viruses) quickly, health
organizations may need to diversify their communication strategy. As demonstrated in our findings
Journal of Quantitative Description: Digital Media 1(2021) Characterizing COVID-19 Media 27

on cross-platform information delays (e.g., in Figure 8), to maximize the speed at which vital
information reaches people, it may not be effective to rely only on one medium. We found that it
is not always the same medium that leads others in disseminating new information. Instead, leader-
follower relationships in the media’s coverage of important topics are in constant flux.

 Our findings also lend empirical evidence to support communication theories that highlight
the importance of the spatial, temporal, and socio-technical dimensions of these media in both
scholarship and practice (Flew 2018; Lievrouw and Livingstone 2002). A key lesson of our
descriptive analyses for researchers and designers of health-information monitoring approaches is
that the choice of online media and its spatial and temporal dimensions determines the extent to
which we can draw conclusions about social conditions. It is therefore important to consider the
diversity of online media and the different ways in which people engage with these media.
Additionally, it is necessary to consider how the socio-technical dimensions of the different online
media are changing over time due to both the actions of the engineers that design the media
platforms and the behavior of the people that interact with them (Lazer et al. 2014). Our findings
thus provide new insights towards the descriptive study of large-scale information sharing through
the computational analysis of digital trace data.

 A significant limitation of our study is that our data only contain English-language media
and do not contain social media posts for comparison with prior research or demographic data to
enable further investigations on media use across specific groups. In addition to building upon the
insights above, further research could investigate time-based experiences e.g., whether the
expressed sentiment, certainty, or discrepancies about public concerns relate to past, present, or
anticipated events. In turn, these lines of inquiry could potentially lend empirical evidence to social
cognitive theories (Bandura, Freeman, and Lightsey 1999) that explain how perceptions about past
events and reflections on future options may influence people’s behavior, especially in times of
crisis. Our findings have broad implications for both empirical and qualitative studies that rely on
these or other online media data to characterize information sharing about coronavirus-related
topics. We hope that this work will help inform the study and design of effective approaches to
characterize large-scale information diffusion patterns more accurately, better convey essential
information to various populations, and further help to confront the crucial communication
problem during pandemics and other crisis situations.
Dambanemuya, Lin & Horvát Journal of Quantitative Description: Digital Media 1(2021) 28

 References

Agarwal, P.; Vaithiyanathan, R.; Sharma, S.; and Shroff, G. 2012. Catching the long-tail:
 Extracting local news events from Twitter. In International AAAI Conference on Weblogs
 and Social Media.
Alessa, A., and Faezipour, M. 2018. A review of influenza detection and prediction through
 social networking sites. Theoretical Biology and Medical Modelling 15(1):2.
Alshaabi, T.; Arnold, M. V.; Minot, J. R.; Adams, J. L.; Dewhurst, D. R.; Reagan, A. J.;
 Muhamad, R.; Danforth, C. M.; and Dodds, P. S. 2021. How the world’s collective
 attention is being paid to a pandemic: Covid-19 related n-gram time series for 24
 languages on twitter. Plos One 16(1):e0244476.
Bagdikian, B. H. 2007. Media monopoly. The Blackwell Encyclopedia of Sociology.
Bakshy, E.; Messing, S.; and Adamic, L. A. 2015. Exposure to ideologically diverse news and
 opinion on Facebook. Science 348(6239):1130–1132.
Bandura, A.; Freeman, W.; and Lightsey, R. 1999. Self-efficacy: The exercise of control.
 Springer.
Barry, J. M. 2009. Pandemics: Avoiding the mistakes of 1918. Nature 459(7245):324–325.
Blank, G., and Lutz, C. 2017. Representativeness of social media in Great Britain: investigating
 Facebook, Linkedin, Twitter, Pinterest, Google+, and Instagram. American Behavioral
 Scientist 61(7):741–756.
Bridgman, A.; Merkley, E.; Loewen, P. J.; Owen, T.; Ruths, D.; Teichmann, L.; and Zhilin, O.
 2020. The causes and consequences of COVID-19 misperceptions: Understanding the
 role of news and social media. Harvard Misinformation Review.
Butler, D. 2013. When Google got flu wrong: US outbreak foxes a leading web-based method
 for tracking seasonal flu. Nature 494(7436):155–157.
Chen, X., and Yu, B. 2020. First two months of the 2019 coronavirus disease (covid-19)
 epidemic in China: real-time surveillance and evaluation with a second derivative model.
 Global Health Research and Policy 5(1):1–9.
Chen, E.; Lerman, K.; and Ferrara, E. 2020. Tracking social media discourse about the covid-19
 pandemic: Development of a public coronavirus twitter data set. JMIR Public Health and
 Surveillance 6(2):e19273.
Chew, C., and Eysenbach, G. 2010. Pandemics in the age of twitter: Content analysis of tweets
 during the 2009 H1N1 outbreak. PloS One 5(11):e14118.
Choi, S.; Lee, J.; Pack, S.; Chang, Y.-S.; and Yoon, S. 2016. Mining internet media for
 monitoring changes of public emotions about infectious diseases. In 2016 IEEE 32nd
 International Conference on Data Engineering Workshops, 68–70. IEEE.
You can also read