Assessment of emission scenarios for 2030 and impacts of black carbon emission reduction measures on air quality and radiative forcing in ...
←
→
Page content transcription
If your browser does not render page correctly, please read the page content below
Atmos. Chem. Phys., 18, 3321–3334, 2018
https://doi.org/10.5194/acp-18-3321-2018
© Author(s) 2018. This work is distributed under
the Creative Commons Attribution 3.0 License.

Assessment of emission scenarios for 2030 and impacts of black
carbon emission reduction measures on air quality and radiative
forcing in Southeast Asia
Didin Agustian Permadi1 , Nguyen Thi Kim Oanh1 , and Robert Vautard2
1 Environmental  Engineering and Management, School of Environment, Resources and Development,
Asian Institute of Technology, Klong Luang, Pathumthani 12120, Thailand
2 Laboratoire des Sciences du Climate de l’Environment (LSCE), Institut Pierre Simon Laplace (IPSL), Gif-sur-Yvette, France

Correspondence: Nguyen Thi Kim Oanh (kimoanh@ait.ac.th)

Received: 5 April 2017 – Discussion started: 2 May 2017
Revised: 7 January 2018 – Accepted: 18 January 2018 – Published: 7 March 2018

Abstract. Our previously published paper (Permadi et al.         the SEA countries was 0.98 W m−2 , which would increase to
2018) focused on the preparation of emission input data and      2.0 W m−2 under BAU2030 and 1.4 W m−2 under RED2030.
evaluation of WRF–CHIMERE performance in 2007. This              Substantial impacts on human health and BC DRF reduction
paper details the impact assessment of the future (2030)         in SEA could result from the emission measures incorporated
black carbon (BC) emission reduction measures for South-         in RED2030. Future works should consider other impacts,
east Asia (SEA) countries on air quality, health and BC direct   such as for agricultural crop production, and the cost–benefit
radiative forcing (DRF). The business as usual (BAU2030)         analysis of the measures’ implementation to provide relevant
projected emissions from the base year of 2007 (BY2007),         information for policy making.
assuming “no intervention” with the linear projection of
the emissions based on the past activity data for Indonesia
and Thailand and the sectoral GDP growth for other coun-
tries. The RED2030 featured measures to cut down emis-           1   Introduction
sions in major four source sectors in Indonesia and Thailand
(road transport, residential cooking, industry, biomass open     The interaction between aerosol (fine particles suspended
burning) while for other countries the Representative Con-       in the atmosphere) and climate has gained an increasing
centration Pathway 8.5 (RCP8.5) emissions were assumed.          attention from the scientific community, especially to as-
WRF–CHIMERE simulated levels of aerosol species under            sess various emission control measures for near-term cli-
BAU2030 and RED2030 for the modeling domain using the            mate change mitigation. Being black in color, black car-
base year meteorology and 2030 boundary conditions from          bon (BC) particles in the atmosphere strongly absorb so-
LMDZ-INCA. The extended aerosol optical depth module             lar radiation, thus exerting a positive direct radiative forc-
(AODEM) calculated the total columnar AOD and BC AOD             ing (DRF). BC is known as a short-lived climate forcing pol-
for all scenarios with an assumption on the internal mixing      lutant (SLCP) because of its short atmospheric lifetime of
state. Under RED2030, the health benefits were analyzed in       a few days to weeks as compared to the long-lived carbon
terms of the number of avoided premature deaths associated       dioxide, for example. BC interacts with the cloud formation
with ambient PM2.5 reduction along with BC DRF reduc-            processes and once depositing on snow it reduces the sur-
tion. Under BAU2030, the average number of the prema-            face albedo and consequently affects Earth’s radiation en-
ture deaths per 100 000 people in the SEA domain would           ergy balance (Myhre et al., 2001). Several global modeling
increase by 30 from BY2007 while under RED2030 the pre-          studies estimated present-day BC radiative forcing of +0.2–
mature deaths would be cut down (avoided) by 63 from             +1.1 W m−2 ; hence BC has been recognized as the second-
RED2030. In 2007, the maximum annual average BC DRF in           most important global warming agent after CO2 (Bond et al.,

Published by Copernicus Publications on behalf of the European Geosciences Union.
3322          D. A. Permadi et al.: Assessment of impacts of black carbon emission scenarios in Southeast Asia in 2030

2013; Ramanathan and Carmichael, 2008). Globally, mea-           tial impacts. The results of this study would provide infor-
sures aiming to reduce emissions of BC (and co-emitting pol-     mation to policy makers on the efficacy of different emission
lutants) have been shown to reduce the number of premature       reduction measures and associated benefits for improving air
deaths and slow down the temperature increase rate in the        quality, reducing health effects and mitigating BC DRF in
near future, i.e., bring in co-benefits, and there is more to    SEA. To the best of our knowledge, this is the first study
be gained in Asia, where current emissions are high (UNEP-       addressing air quality and BC DRF impacts for the SEA re-
WMO, 2011; Shindell et al., 2012).                               gion, and so the results would contribute scientific evidences
   Southeast Asia (SEA) has high emissions from anthro-          to promote the co-control approach that is currently not in-
pogenic sources that contribute significantly to Asian and       corporated in the policy in any country in the region.
global emissions (Permadi et al., 2018). Overall, Asian emis-
sions have been reported to have increased rapidly over the
last few decades (Streets et al., 2003; Zhang et al., 2009;      2     Methodology
Ohara et al., 2007; EC/JRC-PBL, 2010). High levels of air
pollution, especially fine particles or PM2.5 (particles with    2.1    Model simulation
aerodynamic diameter ≤ 2.5 µm), that cause severe health
effects (WHO, 2012) have been measured in Asian cities           Details of the models used and their configurations have been
(Kim Oanh et al., 2006; Hopke et al., 2008). Global stud-        presented in the accompanying paper (Permadi et al., 2018).
ies reported that efforts to reduce SLCP emissions (BC and       The emission inputs were prepared based on two developed
ozone precursors) would help to reduce global warming im-        emission scenarios (BAU2030 and RED2030). The meteoro-
mediately (UNEP-WMO, 2011; Shindell et al., 2012), which         logical fields produced by WRF for 2007 were used for the
should complement those efforts addressing the long-lived        simulation of scenarios in 2030. The base year of 2007 was
greenhouse gases (GHGs) that require more time to realize.       selected because it was not affected by the strong El Niño and
Developing Asia is also vulnerable to climate change, and        La Niña events (http://www.cpc.noaa.gov/products/analysis_
hence reducing emissions of the SLCPs would bring in co-         monitoring/ensostuff/ensoyears.shtml). We also took advan-
benefits in terms of avoiding excessive premature deaths, re-    tage of the satisfactorily evaluated WRF performance for
ducing the crop yield loss and slowing down the temperature      2007 to examine the effects of the emission reductions alone
increase rate (UNEP-WMO, 2011).                                  under the scenarios. However, to account for the changes in
   The co-benefit approach is being more and more recog-         the boundary conditions in the simulations of future emis-
nized as an important concept to simultaneously address the      sion scenarios, we used the chemistry boundary conditions
problems of air pollution and climate change. However, so        obtained from the global chemistry–aerosol–climate model
far it has not been adequately considered in policy mak-         that couples online the LMDZ (Laboratoire de Météorolo-
ing in many developing countries. A number of studies re-        gie Dynamique, version 4) general circulation model (Hour-
ported applications of the modeling tool to investigate im-      din et al., 2006) and the INCA (INteraction with Chemistry
pacts of emission reduction measures on the premature mor-       and Aerosols, version 3) model (Hauglustaine et al., 2014)
tality and radiative forcing in East and South Asia (Saikawa     using the global Representative Concentration Pathway 8.5
et al., 2009; Aunan et al., 2006; Akimoto et al., 2015). There   (RCP8.5) emissions (Didier Hauglustaine, personal commu-
are no such detailed studies conducted for the SEA region        nication, 2013). Specifically, the concentrations of 27 pollu-
where local/domestic and transboundary problems, e.g., re-       tants, including aerosol and trace gases as the SEA domain
gional haze, are important (Heil and Goldammer, 2001).           boundary conditions (monthly average), were extracted from
   In this paper we focus on simulations of aerosol con-         the global LMDZ-INCA simulation for the base year 2007
centrations in SEA under two emission scenarios, projected       (BY2007) and 2030 (BAU2030 and RED2030) for 19 hy-
for 2030, using the chemistry transport model (CTM) of           brid vertical pressure levels. The horizontal resolution is 1.9◦
CHIMERE (Vautard et al., 2001; Bessagnet et al., 2004).          in latitude and 3.75◦ in longitude of LMDZ-INCA output.
Our accompanying paper (Permadi et al., 2018) has de-            Boundary conditions from the LMDZ-INCA were processed
tailed the SEA emissions and the evaluation of WRF–              using the available routine in CHIMERE to read the monthly
CHIMERE performance for PM10 , PM2.5 and BC in SEA               concentrations and get the information of the lateral (lat_con)
in the base year of 2007 (BY2007). The emission reduc-           and top boundary (top_con) concentrations. We used the ratio
tion scenario (RED2030) considered reduction measures to         of simulated levels between 2030 and 2007 for each species
be implemented in four major anthropogenic source sec-           to estimate the boundary conditions in 2030 and modified the
tors (road transportation, residential cooking, industry and     model inputs. Accordingly, using the output levels of LMDZ-
biomass open burning) in two large emitting SEA countries,       INCA for BC and organic carbon (OC) for the year of 2007
Thailand and Indonesia. The changes in the BC DRF and in         and 2030 we estimated the ratios of each BC and OC species
the number of avoided premature deaths between BY2007            between these 2 years (2030 / 2007 ratios) and presented in
and RED2030 were compared to those between BY2007 and            Fig. S1 in the Supplement. Note that the biogenic emissions
the business as usual scenario (BAU2030) to highlight poten-     in 2030 were assumed to be the same as in 2007.

Atmos. Chem. Phys., 18, 3321–3334, 2018                                           www.atmos-chem-phys.net/18/3321/2018/
D. A. Permadi et al.: Assessment of impacts of black carbon emission scenarios in Southeast Asia in 2030                     3323

   In the discussion of modeling results throughout the pa-         poral emission distribution patterns of 2007 were used in the
per, two domains are defined as follows: (1) the modeling           BAU2030 emissions for the whole modeling domain.
domain, covering the SEA countries and the southern part               The RED2030 scenario considers the PM emission cut for
of China, and (2) the SEA domain, covering only the nine            major emission sources in 2030. For Indonesia and Thailand,
SEA countries in the domain. Note that base year emissions          RED2030 emissions were calculated using the available offi-
of East Timor were not provided by the Center for Global            cial policy documents that mainstreamed both air quality and
and Regional Environmental Research (CGRER) and hence               climate change mitigations in four major emission sectors
it was not included in the SEA domain.                              (road transport, residential, industry and biomass open burn-
                                                                    ing) as detailed in Table S1. These involved cleaner trans-
                                                                    portation fleets with at least Euro2 in Indonesia and Euro4 in
2.2   Emission scenarios
                                                                    Thailand for personal cars, while natural gas should be used
                                                                    in all public buses in Indonesia and all public buses and taxis
BAU2030 is a reference future scenario, named business as           in Thailand. The measures considered for residential cooking
usual (BAU), representing the emissions in 2030. BAU was            for Indonesia included the national program of conversion of
developed based on the assumption that the emissions would          kerosene to liquefied petroleum gas (LPG) for cooking (Per-
grow following the current trend of the activity data. For In-      madi et al., 2017) and introduction of cleaner biomass fuel
donesia and Thailand, two large emitting countries in SEA,          (for gasifier cookstove) to replace the traditional wood-fuel
the historical activity data available prior to 2007 were col-      cookstoves. In Thailand, cleaner fuel, such as LPG, was in-
lected and the trends were examined over the period of the          troduced to replace wood fuel and charcoal, and rural elec-
available data of 4–19 years (varying with emission source          trification was implemented to enable application of electric
sector). Further, a simple regression analysis was conducted        cookstoves. In the industrial sector in Indonesia, fuel switch-
to analyze the linear relationship between the emissions and        ing and process modernization were assumed for key indus-
a selected proxy which was used to project the activity data        tries such as cement, iron steel, pulp and paper and textile
to 2030 for the respective country. In principle, it is desirable   (ICCSR, 2009). In Thailand, measures focused on energy
to have long historical data periods for the emission projec-       saving and maximum feasible reduction in key industries,
tion (for Thailand and Indonesia). However, in 1997–1998            such as the cement and iron steel industries, were considered
the region went through a drastic economic recession and so         following the policy action proposed by Chotichanathawe-
inclusion of the data before 1999 may induce a large bias.          wong and Thongplew (2012). For biomass open burning, In-
Therefore, even when a longer data period was available for         donesia focused on the reduction of forest burning area tar-
a sector we still relied on the trend obtained for the period of    get and zero burning of solid waste following the National
1999–2007. Note that only a short period of historical data         Strategic Plan document (MoF, 2010). A clear target was
(4 years) was available for the petroleum refinery and mining       set in Thailand to follow the National Master Plan of Open
production sectors in Thailand, which may contribute more           Burning Control (PCD, 2010), which mandated burning of
uncertainty to the BAU scenario emission results. Neverthe-         no more than 48 000 ha yr−1 of forest area by 2030 and zero
less, these sectors did not contribute significantly to the total   burning for crop residue implemented throughout the coun-
emissions. The same emission factors (EFs) of 2007 were             try.
used for the emission estimation from the sources in 2030              For other countries in the modeling domain, due to the
and this may contribute a certain uncertainty to the projected      lack of relevant information, this study assumed that their
emissions. In general, we should expect the EFs to be re-           emissions followed the RCP8.5 pathways (taken from http:
duced in the future with the progressive technology intrusion.      //tntcat.iiasa.ac.at:8787/RcpDb/) for the Asian region. Ac-
Nevertheless, if the vehicle age limit is not strictly enforced,    cordingly, under RCP8.5, in 2030 the SEA emissions of CH4
more aged engines will have higher EFs in the future. For           and NH3 would increase by 1.7 and 1.3 times, respectively,
other countries and territories in the modeling domain, due to      as compared to 2007, while non-methane volatile organic
the limitation of historical activity data, the BAU emissions       compounds (NMVOC) remained nearly the same during the
were projected using their GDP growth trends over the period        period. For other pollutants (SO2 , CO, NOx , BC and OC),
2000–2007. The BY2007 emission data for those countries             some emission reductions were expected, i.e., 2030 emis-
were taken from the international databases that were pro-          sions were 60–90 % of the respective 2007 emissions. Note
vided at a different resolution (i.e., 0.5◦ × 0.5◦ ). Therefore,    that the same temporal and spatial emission distribution pat-
the spatial analysis of “grid conversion” in geographic infor-      terns of BY2007 were used also in RED2030 emissions.
mation system (GIS) was used to convert the emission data
in to the same grid resolution 30 × 30 km2 for the whole do-        2.3   Assessment of impacts on air quality and BC DRF
main. The land mask map that was generated from the WRF
model with a resolution of 30 × 30 km2 was used to regrid           The potential impacts of the emission reduction scenarios on
the emissions on the border between land and sea (assigning         improvement of air quality (and hence health benefits) and
zero emissions to the sea area). The same spatial and tem-          mitigation of climate forcing were assessed and quantified.

www.atmos-chem-phys.net/18/3321/2018/                                                Atmos. Chem. Phys., 18, 3321–3334, 2018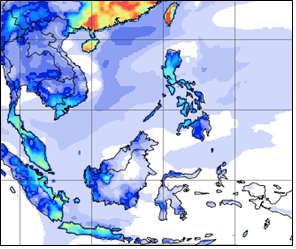
3324           D. A. Permadi et al.: Assessment of impacts of black carbon emission scenarios in Southeast Asia in 2030

Impacts of emission reduction measures under RED2030 as           2.3.2    Black carbon aerosol optical depth (AOD)
compared to the reference scenario (BAU2030) were ana-
lyzed based on the number of premature deaths and BC DRF          The BC AOD values were calculated using the extended
in SEA.                                                           aerosol optical depth module (AODEM) with the 3-D
                                                                  aerosol concentration field generated by WRF–CHIMERE
2.3.1   Premature death                                           for BAU2030 and RED2030. The application detail of AO-
                                                                  DEM software and parameterization has been presented in
The number of avoidable premature deaths resulting from           our companion paper (Permadi et al., 2018).
the emission reduction measures was quantified based on the
changes in the ambient PM2.5 levels and was calculated using      2.3.3    BC DRF
Eq. (1) (Wang and Mauzeral, 2006; Saikawa et al., 2009):
                                                                  To estimate the change in radiative forcing (1F ), Eq. (2)
1cases = Iref · POP · CR · 1C,                             (1)    was used following the approach presented in Chýlek and
                                                                  Wong (1995) and Kim et al. (2012).
where 1cases is the change in number of cases of mortality
per year due to change in the annual ambient PM2.5 con-                 1                n                      o
centration; Iref is the baseline mortality rate (%); POP is the   1F = − F0 T 2 (1 − Ac ) 4Rτab − 2(1 − R)2 βτsc ,           (2)
                                                                        4
number of exposed population (person); CR is the concentra-
tion response coefficient for mortality rate (unit is % change    where F0 is the solar irradiance constant (1370 W m−2 ) and
in mortality and morbidity as a result of a 1 µg m−3 change in    T is the atmospheric transmission coefficient (0.79). The val-
annual average PM2.5 concentration); and 1C is the change         ues of Ac (the total cloud fraction) and R (surface albedo)
in annual ambient PM2.5 concentration under a given differ-       were taken from the WRF simulation results. The expres-
ent emission scenario.                                            sion of (1 − Ac ) represents the clear-sky conditions; i.e., we
   We considered only the premature deaths because of the         consider only clear-sky BC DRF. The expression of (1 − R)2
less comprehensive information available on the associa-          in the equation accounts for the multiple reflection of the
tion between the morbidity and air pollution exposure as          aerosol layer. The surface τab is the absorption (BC AOD)
compared to that of the mortality (Saikawa et al., 2009).         and τsc is the scattering optical depths calculated by AODEM
The PM2.5 annual concentration was used rather than BC            based on the BC burden; β is the back-scattering fraction,
alone following the recommendations of the WHO Task               which was assumed to be 0.17 based on the measurements
Force (WHO, 2012) that PM2.5 should continue to be used           of Schnaiter et al. (2003). Note that, in the current vertical
as the primary metric in quantifying the human exposure           model setup, the top of the model domain was 500 hPa and
to PM and resulting health effects. Concentration response        thus the simulation results may not be able to capture the
(CR) data were obtained from Smith et al. (2009) who in-          long-range transport (LRT) that took place above the domain
dicated that every increase in PM2.5 by 1 µg m−3 is ap-           top in the free-tropospheric layer and may subsequently un-
proximately associated with a 1.006 % increase in the risk        derestimate BC AOD and BC DRF. However, above the do-
of all-cause adult mortality for individuals of 20 years and      main top (> 5 km) the biomass open burning emissions of im-
older. The Iref data representing the adult mortality rate        portance in the region may not have significant effects on
for all causes and both sexes (per 1000 people) for every         the aerosol extinction coefficient, as shown by the Cloud-
nation included in the study domain were obtained from            Aerosol Lidar with Orthogonal Polarization (CALIOP) ob-
the United Nations database (http://data.un.org/Data.aspx?        servations (Campbell et al., 2013). Therefore, the uncertainty
d=WHO&f=MEASURE_CODE:WHOSIS_000004) for the                       caused by the vertical model setup on the simulation results
base year of 2007. The 0.5◦ resolution gridded population         may not be significant considering the biomass open burning
(POP) data were obtained from the Potsdam Institute for           emissions in particular.
Climate Impact Research (PICIR) (http://clima-dods.ictp.it/
Users/fcolon_g/ISI-MIP/UNWPP/) for both 2007 and 2030,
and the data were further gridded to a finer resolution of        3     Results and discussion
0.25◦ of the modeling domain. The proportions of adult pop-
ulation (age ≥ 20 years) for the countries were taken from the    3.1     Emission scenarios
World Bank database (http://data.worldbank.org/indicator/
SP.POP.0014.TO.ZS). This study assumed that the baseline          A summary of the annual emissions of key species in the
mortality and age structure were distributed following the        base year of 2007 and in 2030 under two emission scenar-
population density and were not changed between 2007 and          ios (BAU2030 and RED2030) from the modeling domain is
2030.                                                             given in Table 1. The annual emission changes under the sce-
                                                                  narios are indicated by the respective ratios for each species.
                                                                  This section discussed in depth the emissions for two coun-
                                                                  tries, Indonesia and Thailand, for which the specific activity

Atmos. Chem. Phys., 18, 3321–3334, 2018                                            www.atmos-chem-phys.net/18/3321/2018/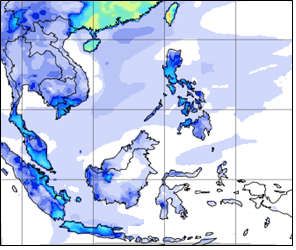
D. A. Permadi et al.: Assessment of impacts of black carbon emission scenarios in Southeast Asia in 2030                                                                 3325

Table 1. Emissions of BY2007, BAU2030 and RED2030 for Indonesia, Thailand and other countries in the modeling domain.

 Emissions (Gg yr−1 )                   SO2        NOx      NH3       PM10       PM2.5        BC       OC      NMVOC              CO            CO2        CH4      N2 O
 Indonesia
 BY2007a                                 997       3282     1258       2046       1644        226      674          3840       24 169       508 022        3950       180
 BAU2030                               1944        5251     2214       2844       2252        305     903           5760       29 003       810 413        5530      324
 RED2030                               1785        4923     2151        859        904        167     506           4608       17 885       378 193        3792      157
 Ratio BAU2030 / BY2007                 1.95         1.6    1.76       1.39        1.37      1.35     1.34            1.5          1.2           1.5         1.4      1.8
 Ratio RED2030 / BY2007                 1.79         1.5    1.71       0.42        0.55      0.74     0.75            1.2        0.74            0.7        0.96     0.87
 Ratio RED2030 / BAU2030                0.92        0.94    0.97        0.3         0.4      0.55     0.56            0.8        0.62          0.47         0.69     0.48
 Thailand
 BY2007                                 827        701        469       782        607         47     240           1120        9095        260 988        1053        84
 BAU2030                               1613        995        727      1298        953         77     341           1725        9186        287 087        1685      151
 RED2030                               1340        925        661       712        498         38     127           1366        6730        219 230         853        80
 Ratio BAU2030 / BY2007                 1.95       1.42      1.55      1.66        1.57      1.63     1.42           1.54        1.01            1.1         1.6      1.8
 Ratio RED2030 / BY2007                 1.62       1.32      1.41      0.91        0.82       0.8     0.53           1.22        0.74          0.84         0.81     0.95
 Ratio RED2030 / BAU2030                0.83       0.93      0.91      0.55        0.52      0.49     0.37           0.79        0.73          0.76         0.51     0.53
 Other countries in the modeling domain
 BY2007                               8940        6886      3900      5522        4184       528     1287         10 416      55 308      2 291 381      29 186      677
 BAU2030b                            19 668      15 149     8580     12 148       9205      1162     2831         22 915     121 678      5 041 038      64 209     1489
 RED2030c                             6169        7781      5070      4915        3640       444     1133         10 937      54 202      2 749 657      34 439      785
 Ratio BAU2030 / BY2007                 2.2         2.2      2.2        2.2         2.2      2.2       2.2            2.2         2.2            2.2         2.2      2.2
 Ratio RED2030 / BY2007                0.69        1.13      1.3       0.89        0.87     0.84      0.88          1.05        0.98             1.2       1.18     1.16
 Ratio RED2030 / BAU2030               0.31        0.51     0.59       0.41         0.4     0.38       0.4          0.48        0.45           0.55        0.54     0.53
a Permadi et al. (2017). b GDP average growth rates from 2000 to 2007 for other countries were obtained from http://data.worldbank.org/indicator/NY.GDP.PCAP.KD.ZG.
Population-weighted average GDP for other SEA countries and southern part of China was calculated to construct the BAU2030 / BY2007 ratio. c The 2030 / 2007 ratio was
extracted from RCP8.5 pathways taken from http://tntcat.iiasa.ac.at:8787/RcpDb/.

data trends were considered for the emission scenarios de-                                the increasing trends of the oil and gas industry as well as
velopment. Table S2 showed the increases in all activity data                             traffic activities. Because of the dominant contributions from
of the key anthropogenic sources in the countries except for                              the residential combustion to their emissions, the population
forest fire emissions, which were actually expected to reduce                             growth in the country during the period of 2007–2030 would
due to a lower GDP from the forestry sector and less for-                                 increase emissions of CO, NMVOC and PM (PM10 , PM2.5 ,
est biomass/area available in the future. The most significant                            BC, OC) by 1.2, 1.5 and 1.35–1.39 times, respectively. NH3
increase was for the number of registered vehicles in Indone-                             emissions were projected to increase by 1.6 times due to the
sia, which in 2030 would be 3.1 times above that in 2007. In                              livestock growth in the country. Among GHGs, CO2 would
Thailand, the petroleum refinery product was also projected                               increase by 1.5 times while CH4 would increase by 1.4 times
to increase by 3.3 times from the 2007 level and the num-                                 from the base year emissions.
ber of vehicles by 2.2 times. The sectoral emissions of key                                  For Thailand, the BAU2030 / BY2007 ratios showing the
species from these two countries under different scenarios                                increases of all species in Table 1 were highest for SO2
are provided in Fig. S2.                                                                  (1.95 times) and lowest for CO (1.01 times). The increases
   For Indonesia, under BAU2030, the emissions of ev-                                     in SO2 and NOx emissions reflected the increasing rates of
ery species would increase with a ratio of 1.2–1.95 be-                                   the coal consumption in particular and that is related to the
tween BAU2030 and BY2007 (Table 1). The highest increase                                  ratio of projected energy consumption 2030 / 2007 of 2.1 for
(1.95 times) would be expected for SO2 and this mainly re-                                industry (EPPO, 2008), as seen in Table S2. The intensi-
flects the increase in coal usage for the power generation and                            fication of agricultural production would increase the crop
industry. Note that the use of the same SO2 EFs for BY2007                                residue open burning that caused the increased emissions of
and BAU2030 emission calculation, as well as the assump-                                  PM species of PM10 , PM2.5 , BC and OC by 1.42–1.66, vary-
tion of no further emission control devices applied in the                                ing with species. Forest fire emissions were projected to re-
power and industry, may be the cause of this high increase                                duce with estimated 2030 / 2007 ratios of 0.7 (Indonesia) and
rate for SO2 . This may not represent the actual trend because                            0.9 (Thailand), which were based on the trend of GDP in
the regulation on emission control will be more stringent in                              forestry (Indonesia) and the trend of forest area (Thailand).
the future and thus less SO2 increase should be expected.                                 The emission increases for NH3 (1.55) and NMVOC (1.54)
The NOx emissions increase by 1.6 times was mainly due to                                 were mainly due to the livestock and industrial growth rates,

www.atmos-chem-phys.net/18/3321/2018/                                                                           Atmos. Chem. Phys., 18, 3321–3334, 2018
3326          D. A. Permadi et al.: Assessment of impacts of black carbon emission scenarios in Southeast Asia in 2030

respectively. GHGs emissions were also projected to increase     emission ratios of RED2030 / BAU2030 for biomass open
by 1.10 (CO2 ), 1.61 (CH4 ) and 1.81 (N2 O). The substan-        burning were 0.09–0.6, while for the residential sector the
tial increases of activity data levels under BAU2030 for both    corresponding ratios were 0.14–0.99 for different species
countries have brought about the increase in emissions for all   (Fig. S2). We observed some increasing trends of SO2 emis-
species in both countries from the BY2007 levels.                sions from the residential sector when LPG was used to
   The emission projection under BAU2030 for other coun-         replace wood as cooking fuel because of its higher sul-
tries in the modeling domain was made based on the GDP           fur content. As for BC species, the emission ratios of
growth rate that was, for example, as high as 10.5–11.5 %        RED2030 / BAU2030 for biomass open burning and resi-
for Cambodia, China and Myanmar (World Bank, 2012)               dential sector in Indonesia were 0.48 and 0.49, respectively,
over the period of 2000–2007. The BAU2030 emissions              and in Thailand were 0.37 and 0.41, respectively. For the in-
from other countries (than Indonesia and Thailand) in the        dustry and transport sectors, the corresponding emission ra-
modeling domain were assumed to grow following their             tios for BC were 0.87 (Indonesia) and 0.6 (Thailand). Under
population-weighted average GDP growth rates, averaged at        BAU2030, the emissions of BC was rising steadily with a
2.2 times. As compared to BY2007, the regional BC and            high rate from the BY2007 (Fig. S2).
CO2 emissions under BAU2030 in 2030 increased by about              For other countries in the modeling domain, the IPCC
1.89 and 1.41 times, respectively, and were well above the in-   RCP8.5 was used to project the emissions under RED2030
crease rate specified by the Intergovernmental Panel on Cli-     and this was done using the regional (Asia) emission ratios
mate Change (IPCC) RCP6.0 for BC and CO2 of 1.03 and             between 2030 and 2007 emissions (using the IPCC emis-
1.23 times for SEA.                                              sion database) for every species. As discussed above, the
   For Indonesia, the measures to be implemented in the          RED2030 featured the emission reductions from BY2007
RED2030 scenario would result in lower emissions as com-         for several species presented in Table 1, i.e., with the
pared to BAU2030, with the ratios RED2030 / BAU2030              RED2030 / BY2007 ratios of 0.84–0.88 for PM species, 0.69
being 0.3–0.92. The most significant emission reductions         for SO2 and 0.98 for CO. The emissions of NOx , NH3 and
would be realized for aerosol species (PM10 , PM2.5 , BC         NMVOC in these countries did, however, increase by 1.05–
and OC) with the RED2030 / BAU2030 of 0.30–0.56 fol-             1.3 times (Table 1).
lowed by CO (0.62) as seen in Fig. S2. The significant re-          Due to the insufficient information on air quality and cli-
ductions for these species were expected because the in-         mate policies of other countries in the modeling domain, this
cluded measures (Table S1) in all sectors aimed at reduc-        study focused primarily on the emission reduction measures
ing PM (BC) emissions which also would reduce CO, an             for the countries of Indonesia and Thailand. Nevertheless,
accompanying gas emitted from these combustion sources.          as highlighted in our accompanying paper (Permadi et al.,
Among GHGs, the highest reduction was for CO2 with               2018), collectively these two countries had the largest contri-
RED2030 / BAU2030 ratio of 0.7 while lower reductions            butions in the domain, i.e., sharing 25–66 % of the total emis-
were shown for CH4 (0.96) and N2 O (0.87). As compared           sions from the SEA domain and 17–44 % of the total mod-
to the base year, RED2030 would also feature more emission       eling domain (SEA plus southern part of China) for most of
reductions for major aerosol species with the corresponding      the species in 2007. This justified the importance of the emis-
ratios of RED2030 / BY2007 of 0.4–0.75 for PM species and        sion reduction measures of these two countries for the SEA
0.74 for CO. The RED2030 emissions were lower than the           region. Note that the reductions of NH3 , CH4 and N2 O were
base year of 2007 for most species except for SO2 , NH3 ,        relatively small in both countries because the major sources
NMVOC and NOx , which were increased by 1.2–1.8 times.           of these species were not addressed in the four source sec-
   For Thailand, RED2030 also featured the lower emissions       tors considered for mitigation in this study. In contrast, the
than BAU2030, as expected. The reductions were about in          reductions PM species and CO were relatively more signifi-
the same ranges as for Indonesia. The emission ratios of         cant for both countries because the mitigation measures ad-
RED2030 / BAU2030 for different species were 0.37–0.93.          dressed the key sources of the species. It is interesting to note
More significant reductions were obtained for PM species,        that our results for the national BC emission ratios between
i.e., ratios of 0.37–0.55, followed by CO, a ratio of 0.73.      RED2030 and BY2007 for Indonesia (0.74) and Thailand
Among the GHGs, the highest reduction would be for CH4           (0.81) were close to the ratios between 2030 and 2007 BC
with the ratio of 0.81 followed by CO2 (0.84) and N2 O           emissions under the IPCC RCP2.6 scenario for the two coun-
(0.95). Similarly to the case of Indonesia, the emissions        tries of 0.82 and 0.81, respectively. For CO2 , our emission
under RED2030 as compared to BY2007 were lower for               ratios were 0.7 and 0.84, which were lower than the ratios
PM species and CO, but higher for other species with the         estimated based on the IPCC RCP2.6 of 0.92 and 0.86, re-
RED2030 / BY2007 ratios of 1.2–1.6 (Table 1).                    spectively. It therefore shows that the RED2030 does align
   Sector-wise emissions in both countries showed that un-       with the IPCC RCP2.6 for the countries and therefore sug-
der RED2030 there would be a substantial reduction, as           gests that the current master plans in the two countries could
compared to BAU2030, resulting from the mitigation mea-          lead to achieving the 2.0◦ target.
sures (Table S1) in the two countries for all sectors. The

Atmos. Chem. Phys., 18, 3321–3334, 2018                                           www.atmos-chem-phys.net/18/3321/2018/
D. A. Permadi et al.: Assessment of impacts of black carbon emission scenarios in Southeast Asia in 2030 3327
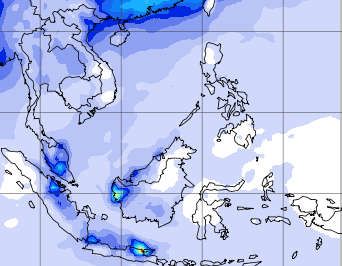
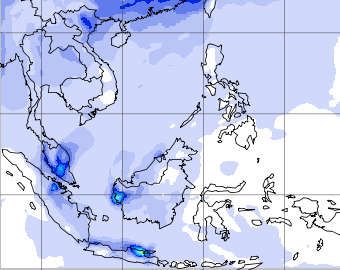
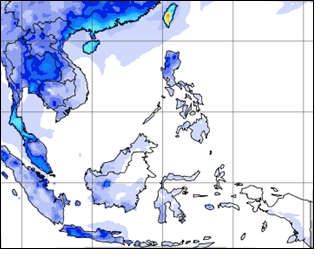
(a) BC DRF Jan 2007 (b) BC DRF Feb 2007
(c) BC DRF Aug 2007 (d) BC DRF Dec 2007
W m-2
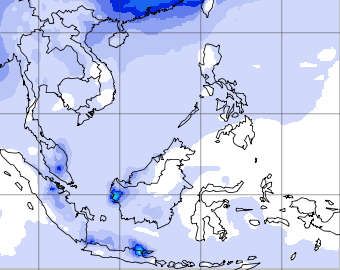
Figure 1. Spatial distribution of monthly average BC direct radiative forcing for the selected months, BY2007.
3.2 Impact assessment of emission reduction measures BC and PM2.5 were shown over the eastern part of Java (In-
in 2030 donesia) in all scenarios. The maximum BC values simulated
for BAU2030 of 7.2 µg m−3 appeared over the eastern part
Our impact assessment of emission reduction measures in of Java, which featured an increase by 1.2 µg m−3 from the
2030 covered the health impact in terms of the number of BY2007. Under RED2030, the maximum BC in the SEA do-
avoided premature deaths associated with reduced PM2.5 main was 4.3 µg m−3 , which is 2.9 µg m−3 lower than that
pollution and the reduction in BC DRF. The results of under BAU2030.
RED2030 were compared to those of BAU2030 to quantify For PM2.5 , under BAU2030 there was an increase of
the impacts of the emission reduction measures. the maximum level over the SEA domain, from 32 µg m−3
in BY2007 to 36 µg m−3 . The emission reduction mea-
3.2.1 Air quality and premature deaths sures under RED2030 would reduce the SEA domain max-
imum PM2.5 to 21 µg m−3 (Table 2). The simulated maxi-
PM and BC mum hourly concentrations of PM2.5 , PM10 and BC under
BY2007 were 189, 327 and 39 µg m−3 , respectively, which
A summary of the maximum PM2.5 , PM10 and BC along increased to 296, 472 and 59 µg m−3 , respectively, under the
with BC DRF and premature deaths under the scenarios is BAU2030. Measures implemented under RED2030 would
given in Table 2 for the SEA domain only, i.e., excluding the reduce the hourly maximum concentrations of PM2.5 , PM10
southern China part of the modeling domain. Annual aver- and BC to 146, 247 and 32 µg m−3 (Table 2). The hourly
age concentrations of BC and PM2.5 for BY2007 and two maximum concentrations of PM2.5 and PM10 occurred on the
different scenarios of BAU2030 and RED2030 are presented island of Borneo during the intensive period of biomass open
in Fig. 2, which shows similar patterns of BC and PM2.5 for burning, while that of BC occurred over the eastern part of
all scenarios but their maximum values were much higher Java. A sharp increase in the maximum hourly concentrations
under BAU2030 than other scenarios. Over SEA, maximum under BAU2030 (e.g., 1 h PM10 reached 472 µg m−3 ) also
www.atmos-chem-phys.net/18/3321/2018/ Atmos. Chem. Phys., 18, 3321–3334, 2018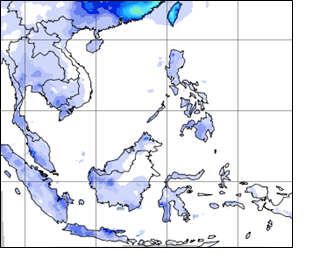
3328 D. A. Permadi et al.: Assessment of impacts of black carbon emission scenarios in Southeast Asia in 2030
Table 2. Summary of emission reduction scenarios for the SEA domain.
Emission scenario Remarks BY2007 BAU2030 RED2030
Emissions of PM2.5 (Gg yr−1 ) SEA domain 3171 5230 2203
Emissions of PM10 (Gg yr−1 ) SEA domain 5036 9001 3537
Emissions of BC (Gg yr−1 ) SEA domain 373 603 289
PM2.5 in SEA (µg m−3 ) Hourly maximum 189 296 146
Highest annual averagea 32.0 36.4 21.1
Highest monthly averageb 82 97 58
PM10 in SEA (µg m−3 ) Hourly maximum 327 472 247
Highest annual averagea 50 58 34
Highest monthly averageb 127 150 88
BC in SEA (µg m−3 ) Hourly maximum 39 59 32
Highest annual averagea 6.0 7.2 4.3
Highest monthly averageb 21 22 11
BC AOD in SEA Highest monthly averageb 0.08 0.24 0.11
BC DRF in SEA (W m−2 ) Highest annual averagea 0.98 2 1.4
Mortality cases per every Total number of additional mortality cases in the SEA (+)30d (−)63e
100 000 peoplec domain compared to BY2007
Total number of additional mortality cases in Indonesia (+)26d (−)49e
Total number of additional mortality cases in Thailand (+)23d (−)36e
Note: this table does not include the values simulated for southern China part of the modeling domain total. a Highest annual average value observed in
the SEA domain. b Highest monthly average value observed in the SEA domain. c Sum of all value in the SEA/country, (+) addition, and (−) reduction
(avoided). d Compared to BY2007. e Compared to BAU2030.
occurred in Borneo, where the emissions from crop residue Number of premature death
open burning were assumed to be intensified.
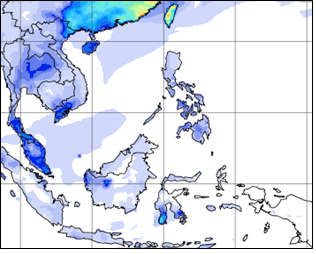
The changes in the total BC and PM2.5 emissions in the do-
The impacts of the two emission scenarios on the number
main were consistent with the emission changes under differ-
of premature deaths in 2030, i.e., BAU2030 vs. BY2007 and
ent scenarios. As discussed above, BAU2030 featured a total
RED2030 vs. BAU2030, were quantified based on the am-
emission increase in the PM2.5 emissions (primary particles)
bient PM2.5 and the results (the difference) are presented in
in the SEA domain by 1.6 times as compared to BY2007
Fig. 3. The increase in annual PM2.5 levels under BAU2030
and in the BC emissions. In 2030, RED2030 would reduce
compared to BY2007 would bring the total number of addi-
the emissions of PM2.5 (primary) by 2.4 times and BC emis-
tional premature deaths in SEA countries to around 201 000
sions by 2.1 times as compared to BAU2030. The ambient
(average of 30 per 100 000 people). In Indonesia, the to-
PM2.5 should also be composed of secondary particles and
tal number of premature deaths under BAU2030 would be
hence would be also affected by the changes in the precur-
52 628 cases (26 per 100 000 people) while in Thailand it
sors’ emissions. The magnitude of changes in PM2.5 and
would be 13 420 cases (23 per 100 000 people). Spatially, the
BC emissions was not similar to the changes in their sim-
maximum value of 7 cases per 100 000 people per grid was
ulated ambient concentrations, suggesting influences of at-
seen in the populated areas over the eastern part of Java, In-
mospheric processes of dispersion, removal, wet scavenging
donesia.
and the boundary conditions used for 2007 and 2030. Over-
RED2030 would avoid a total number of premature deaths
all, the emission reduction measures implemented in four an-
in SEA countries of 401 000 (63 per 100 000 people) from
thropogenic source sectors under RED2030 could maintain
that estimated for BAU2030. In Indonesia, the number
the PM2.5 and BC levels in 2030 quite close to or even lower
of avoided premature deaths would be 103 448 (49 per
than those in 2007 while under BAU2030 their levels would
100 000 people) while in Thailand it would be around 21 235
substantially increase.
(36 per 100 000 people). More than 50 % the total number
of avoided premature deaths in the SEA countries would
be in Indonesia and Thailand, where the mitigation mea-
sures were considered. The values estimated in this study
Atmos. Chem. Phys., 18, 3321–3334, 2018 www.atmos-chem-phys.net/18/3321/2018/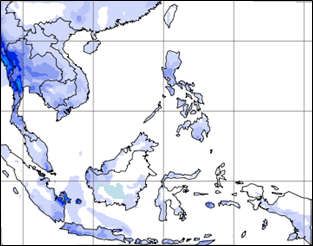
D. A. Permadi et al.: Assessment of impacts of black carbon emission scenarios in Southeast Asia in 2030                 3329

                                             Annual BC BY2007                                Annual PM2.5 BY2007

                                             Annual BC BAU2030                              Annual PM2.5 BAU2030

                                             Annual BC RED2030                               Annual PM2.5 RED2030

Figure 2. Simulated annual average concentrations of BC and PM2.5 for BY2007, BAU2030 and RED2030 in µg m−3 .

were lower than those by Shindell et al. (2012) for both          al. (2012) included effects of ground-level ozone as well as
Indonesia (74 per 100 000 people) and Thailand (68 per            other co-emitting species of BC.
100 000 people) (data extracted from http://www.giss.nasa.           The uncertainty of modeled PM2.5 and BC was caused by
gov/staff/dshindell/Sci2012/FS5/). This is because our study      several factors such as missing sources and other uncertainty
considered a smaller set of emission reduction measures as        in the emission inventory data, incorporation of LRT, grid
compared to Shindell et al. (2012), who considered seven          average to point-based observation and so on. In addition,
BC reduction measures and seven methane reduction mea-            the limited observation data available have prevented a more
sures in different sectors. In addition, the health effects in    comprehensive model performance evaluation. These would
this study were quantified only for PM2.5 while Shindell et       be translated into the uncertainty of the health and BC DRF

www.atmos-chem-phys.net/18/3321/2018/                                              Atmos. Chem. Phys., 18, 3321–3334, 2018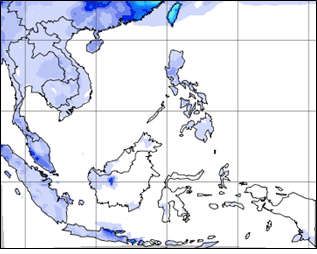
3330           D. A. Permadi et al.: Assessment of impacts of black carbon emission scenarios in Southeast Asia in 2030

                                                                   were used for the model evaluation without evaluation of BC.
                                    (a) BAU2030 - BY2007
                                                                   The monthly averages of BC DRF for the base year 2007 are
                                                                   presented in Fig. 1 for selected months of August (wet season
                                                                   in the northern part of the modeling domain but dry season
                                                                   in the southern part of the domain) and January, February
                                                                   and December (dry season in the northern but wet season in
                                                                   the southern part of the modeling domain). Note that the BC
                                                                   DRF values represent the forcing at the top of the model layer
                                                                   and not that at Earth’s surface. In most of the cases, higher
                                                                   BC DRF was seen in the southern part of China, but in the
                                                                   following discussion we only focused on the results for the
                                                                   SEA countries, i.e., the SEA domain.
                                                                      December had a vast area of high BC DRF in the
                                                                   SEA domain with the maximum monthly average value of
                                                                   1.4 W m−2 (seen over peninsular Malaysia and western part
                                                                   of Java, Indonesia). The second highest monthly BC DRF
                                    (b) BAU2030 - RED2030          was shown in February with a relative wide area of high val-
                                                                   ues over the western part of peninsular Malaysia and western
                                                                   part of Kalimantan, Indonesia. In August, the BC DRF values
                                                                   were lower over the SEA domain with the maximum monthly
                                                                   average seen over the border between Thailand and Myanmar
                                                                   and in the province of Riau of Sumatra, Indonesia. January
                                                                   had the lowest BC DRF in all the presented months with the
                                                                   monthly maximum in the SEA domain of 0.9 W m−2 , seen
                                                                   over the western part of peninsular Malaysia and eastern part
                                                                   of Java, Indonesia. The influence of the emissions from the
                                                                   up-wind part of the SEA domain was more pronounced in the
                                                                   months when the northeast monsoon was predominant (Jan-
                                                                   uary, February and December). In these months, the highest
                                                                   monthly values were simulated outside the SEA domain, i.e.,
                                                                   above the southern part of China and Taipei (maximum of
                                                       Cases per
                                                       100 000     1.4–1.9 W m−2 ).
                                                                      The monthly distributions of BC DRF were consistent to
Figure 3. The difference in the number of mortality cases          the simulated monthly BC AOD. In this study we assumed
(cases per 100 000 people) between BAU2030 and BY2007              the internally mixed state for BC when calculating AOD by
(BAU2030 − BY2007) and between BAU2030 and RED2030                 AODEM and this may overestimate the light absorption of
(BAU2030 − By2007).
                                                                   BC (Jacobson, 2001). Our estimated BC DRF values are
                                                                   comparable to a previous study by Kim et al. (2012) who
effect results. Even though we used the change in the annual       estimated the monthly BC DRF values for the Korean Penin-
ambient PM2.5 concentration (1C) in the calculation of the         sula of 1.2–1.5 W m−2 , but our results were higher than the
health risk, the resulting impact of the intervention (emission    global average BC DRF suggested by Jacobson (2000) of
reduction) may still contain a high uncertainty. Further, the      0.55 W m−2 .
regional and/or country-specific CR data for PM2.5 should             Note that there are several factors contributing to the un-
be developed to improve the impact assessment of emission          certainty in estimating the BC DRF, such as underestima-
reduction scenarios on the premature mortality.                    tion of the LRT contribution due to the current model vertical
                                                                   setup, missing sources and other uncertainty in the emission
3.2.2   BC DRF                                                     inventory data. Further, BC DRF was calculated for clear-
                                                                   sky conditions, and therefore the effect of BC on the cloud
Black carbon DRF in SEA is of interest to understand the           microphysics (Chýlek et al., 1996) was not incorporated.
impacts of BC emissions on climate warming. Therefore, BC             The spatial distributions of the simulated annual average
AOD (τab ) was calculated as the difference between the to-        BC DRF of BY2007, BAU2030 and RED2030 scenarios are
tal AOD (scattering + absorbing) and scattering AOD, i.e.,         presented in Fig. 4. In this section, we discussed only the val-
following the same method presented in the literature (Landi       ues estimated for the SEA countries, i.e., excluding the high
and Curci, 2011). In our accompanying paper (Permadi et al.,       values occurred in the southern part of China. The maximum
2018), the results of BC AOD (using Eq. 2) for the BY2007          simulated BC DRF for the SEA countries under BAU2030

Atmos. Chem. Phys., 18, 3321–3334, 2018                                             www.atmos-chem-phys.net/18/3321/2018/
D. A. Permadi et al.: Assessment of impacts of black carbon emission scenarios in Southeast Asia in 2030 3331 (2.0 W m−2 ) appeared over Riau province, Sumatra, Indone- sia, and this is about 1 W m−2 higher than that in BY2007 (a) BY2007 (0.98 W m−2 ). Under RED2030, the highest BC DRF would be 1.4 W m−2 (appeared over Riau province, Indonesia), i.e., about 0.6 W m−2 lower than that of BAU2030. In Thailand, the maximum BC DRF in 2007 was 0.40 W m−2 , appear- ing in Chonburi, which it increased by two times under BAU2030. Under RED2030, the maximum BC DRF in Thai- land would be 0.48 W m−2 , appearing at the same place, i.e., only a slight increase as compared to BY2007. Apart from Indonesia and Thailand, for which the mitiga- tion measures were simulated, other countries in the mod- eling domain following the RCP8.5 emission pathway also gained benefits because the pollutants (i.e., SLCPs) were also mitigated in this IPCC scenario (Riahi et al., 2001) but not the major GHGs (Table 1). Other parts of the modeling domain, i.e., the southern part of China and other SEA countries, also (b) BAU2030 gained quite similar ranges of the BC DRF reduction and the health benefits as Indonesia and Thailand under RED2030. It is worth mentioning, as seen in Table 1, that the BC emis- sions in the SEA domain were lower in RED2030 as com- pared to BY2007 but the AOD and BC DRF were higher than the respective BY2007 levels and these could be related to the emissions in other part of the domain and outside the modeling domain. Our study thus demonstrated that the measures imple- mented to reduce BC (and PM) under RED2030 may bring in substantial benefits in avoiding the premature mortality and reduction in the BC DRF. Future studies should focus on the improvement of emission inventory data, modeling setup and the inclusion of the cloud microphysics in the radiative forc- (c) RED2030 ing calculation. The climate feedback should be expressed as the temperature changes in future studies. The impacts on crop production and materials should also be considered and the monetary values of the benefits should be presented to better inform policy makers and to promote mitigation mea- sures for the SLCPs. 4 Conclusions This study is a continuation of our previous paper (Permadi et al., 2018, focusing on the model performance evaluation for the BY2007) and presents the development of two emis- sion scenarios for SEA in 2030 (BAU2030 and RED2030) W m-2 to assess the associated impacts on the premature mortal- ity and BC DRF in the region. BAU2030 assumed a linear Figure 4. Spatial distribution of annual average BC DRF under increase of activity levels of the key anthropogenic sectors BY2007, BAU2030 and RED2030 scenarios. in Thailand and Indonesia and featured a BC emission in- crease by 1.6 times in Thailand and 1.3 times in Indone- sia as compared to BY2007. For other countries in the do- main the projection was done using the average GDP growth and Thailand (road transport, residential combustion, indus- rate, and the emission growth rate was 2.2 times BY2007 try, open burning), the two largest contributors to the SEA for all species. RED2030 considered the emission reduction emissions, and featured a cut in BC emissions by 45 % in measures in four major anthropogenic sources for Indonesia Indonesia and 51 % in Thailand as compared to BAU2030. www.atmos-chem-phys.net/18/3321/2018/ Atmos. Chem. Phys., 18, 3321–3334, 2018
3332           D. A. Permadi et al.: Assessment of impacts of black carbon emission scenarios in Southeast Asia in 2030

The emission reductions for Thailand and Indonesia under             Competing interests. The authors declare that they have no conflict
RED2030, calculated based on their national master plans,            of interest.
were quite close to those specified for these countries under
IPCC RCP2.6; thus, by implementing the current policies,
the countries can contribute to the 2.0◦ target achievement.         Acknowledgements. We acknowledged Didier Hauglustaine for
   With other countries in the modeling domain following             sharing the simulation results of the LMDZ-INCA used for the
the IPCC RCP8.5 pathway, the collective BC emissions from            boundary conditions in this work. This research was financially
                                                                     supported by the French government under the Asian Institute
the domain under RED2030 would reduce by 16 % from the
                                                                     of Technology (AIT)/Sustainable Development in the Context of
BY2007 amount. For the SEA domain, the BAU2030 fea-
                                                                     Climate Change (SDCC) – France Network cooperation and by
tured a total emission increase in the BC and PM2.5 emis-            the United States Agency for International Development (USAID)
sions by 1.6 times each as compared to BY2007. Under                 under the PEER-SEA (Partnerships for Enhanced Engagement in
RED2030, the emissions of PM2.5 would reduce by 2.4 times            Research for Southeast Asia) research project.
and BC emissions would reduce by 2.1 times from the re-
spective BAU2030 levels.                                             Edited by: Toshihiko Takemura
   WRF–CHIMERE–AODEM modeling system simulation                      Reviewed by: two anonymous referees
results provided the PM ambient concentrations (i.e., PM2.5 ,
PM10 , BC), AOD and BC DRF under different scenarios,
which showed the substantial benefits of the emission reduc-
tion under RED2030 in improving regional air quality and             References
BC DRF reduction. Under BAU2030, assuming “no inter-
vention”, the increase in annual PM2.5 levels would induce           Akimoto, H., Kurokawa, J., Sudo, K., Nagashima, T., Takemura,
an additional number of premature deaths of 30/100 000 peo-            T., Klimont, Z., Amann, M., and Suzuki, K.: SLCP co-control
ple above the BY2007 in the SEA domain. The reduction                  approach in East Asia: Tropospheric ozone reduction strategy by
measures implemented under RED2030 would help to cut                   simultaneous reduction of NOx /NMVOC and methane, Atmos.
                                                                       Environ., 122, 588–595, 2015.
down (avoid) the total number of the premature deaths by
                                                                     Aunan, K., Fang, J., Hu, T., and Vennemo, H.: Climate Change and
63 per every 100 000 people as compared to BAU2030. For
                                                                       Air Quality – Measures with Co-Benefits in China, Environ. Sci.
the two countries where specific measures were to be im-               Technol., 40, 4822–4829, 2006.
plemented, RED2030 would help to avoid 49 premature                  Bessagnet, B., Hodzic, A., Vautard, R., Beekmann, M., Cheinet, S.,
deaths in Indonesia and 36 in Thailand per 100 000 peo-                Honoré, C., Liousse, C., and Rouil, L.: Aerosol modeling with
ple. RED2030 would also slow down the increase in the BC               CHIMERE – Preliminary evaluation at the continental scale, At-
DRF over the SEA domain, i.e., lowering the maximum an-                mos. Environ., 38, 2803–2817. 2004.
nual average BC DRF from 2.0 W m−2 under BAU2030 to                  Bond, T. C., Doherty, S. J., Fahey, D. W., Forster, P. M., Berntsen,
1.4 W m−2 under RED2030.                                               T., DeAngelo, B. J., Flanner, F. G., Ghan, S., Kärcher, B., Koch,
   Future studies should assess the potential impacts of the           D., Kinne, S., Kondo, Y., Quinn, P. K., Sarofim, M., Schultz,
emission reduction on agricultural crops (mainly via ozone             M. G., Schulz, M., Venkataraman, M., Zhang, H., Zhang, S.,
                                                                       Bellouin, N., Guttikunda, S. K., Hopke, P. K., Jacobson, M.
formation) and this is important because agriculture is the
                                                                       Z., Kaiser, J. W., Klimont, Z, Lohmann, U., Schwarz, J. P.,
major economic sector in SEA. Other pollutants (beside PM
                                                                       Shindell, D., Storelvmo, T., Warren, S. G., and Zender, C. S.:
and BC) should be included in the assessment of health im-             Bounding the role of black carbon in the climate system: A sci-
pacts. Likewise, for the long-term climate effects, the in-            entific assessment, J. Geophys. Res.-Atmos., 118, 5380–5552,
duced emission reduction of major GHGs by the measures                 https://doi.org/10.1002/jgrd.50171, 2013.
should also be included. Multiyear simulations using an on-          Campbell, J. R., Reid, J. S., Westphal, D. L., Zhang, J., Tack-
line coupled climate–chemistry modeling system should be               ett, J. L., Chew, B. N., Welton, E. J., Shimizu, A., Sugimoto,
conducted to provide a more realistic impact, resulting from           N., Aoki, K., and Winker, D. M.: Characterizing the verti-
emission reduction scenarios on air quality and climate in             cal profile of aerosol particle extinction and linear depolar-
SEA.                                                                   ization over Southeast Asia and the Maritime Continent: the
                                                                       2007-2009 view from CALIOP, Atmos. Res., 122, 520–543,
                                                                       https://doi.org/10.1016/j.atmosres.2012.05.007, 2013.
                                                                     Chotichanathawewong, Q. and Thongplew, N.: Development Tra-
Data availability. All involved data including emissions and model
                                                                       jectory, Emission Profile, and Policy Actions: Thailand, ADBI
results are available upon request to the corresponding author.
                                                                       Working Paper Series, Asian Development Bank Institute,
                                                                       Tokyo, Japan, 2012.
                                                                     Chýlek, P. and Wong, J.: Effect of absorbing aerosols on global ra-
                                                                       diation budget, Geophys. Res. Lett., 22, 929–931, 1995.
The Supplement related to this article is available online
                                                                     Chýlek, P., Lesins, G., Videen, G., Wong, J., Pinnick, R., Ngo, D.,
at https://doi.org/10.5194/acp-18-3321-2018-supplement.                and Klett, J.: Black carbon and absorption of solar radiation by
                                                                       clouds. J. Geophys. Res., 101, 365–371, 1996.

Atmos. Chem. Phys., 18, 3321–3334, 2018                                                www.atmos-chem-phys.net/18/3321/2018/
D. A. Permadi et al.: Assessment of impacts of black carbon emission scenarios in Southeast Asia in 2030 3333 EC-JRC/PBL: European Commission, Joint Research Cen- pogenic emission sources for the period 1980–2020, Atmos. tre/Netherlands Environmental Assessment Agency. Emission Chem. Phys., 7, 4419–4444, https://doi.org/10.5194/acp-7-4419- Database for Global Atmospheric Research (EDGAR), release 2007, 2007. version 4.1, available at: http://edgar.jrc.ec.europa.eu (last ac- PCD: National Master Plan for Open Burning Control, Thailand cess: 30 October 2017), 2010. Pollution Control Department, Bangkok, Thailand, 2010. Energy Policy and Planning Office (EPPO): Energy statistics of Permadi, D. A., Sofyan, A., and Kim Oanh, N. T.: Assessment of Thailand, Bangkok, Thailand, available at: http://www2.eppo. emissions of greenhouse gases and air pollutants in Indonesia go.th/info/YearBook/index.html (last access: 30 October 2017), and impacts of national policy for elimination of kerosene use in 2008. cooking, Atmos. Environ., 154, 82–94, 2017. Hauglustaine, D. A., Balkanski, Y., and Schulz, M.: A global model Permadi, D. A., Kim Oanh, N. T., and Vautard, R.: Integrated emis- simulation of present and future nitrate aerosols and their direct sion inventory and modeling to assess distribution of particulate radiative forcing of climate, Atmos. Chem. Phys., 14, 11031– matter mass and black carbon composition in Southeast Asia, At- 11063, https://doi.org/10.5194/acp-14-11031-2014, 2014. mos. Chem. Phys., 18, 2725–2747, https://doi.org/10.5194/acp- Heil, A. and Goldammer, J. G.: Smoke-haze pollution: A review 18-2725-2018, 2018. of the 1997 episode in Southeast Asia, Reg. Environ. Change, 2, Ramanathan, V. and Carmichael, G.: Global and regional cli- 24–37, 2001. mate changes due to black carbon, Nat. Geosci., 1, 221–227, Hopke, P. K., Cohen, D. D., Begum, B. A., Biswas, S. K., Ni, B., https://doi.org/10.1038/ngeo156, 2008. Pandit, G. G., Santoso, M., Chung, Y. S., Davy, P., Markwitz, A., Riahi, K., Rao, S., Krey, V., Cho, C., Chirkov, V., Fischer, G., Kin- Waheed, S., Siddique, N., Santos, F. L., Pabroa, P. C. B., Senevi- dermann, G., Nakicenovic, N., and Rafaj, P.: RCP8.5 – A sce- ratne, M. C. S., Wimolwattanapun, W., Bunprapob, S., Vuong, nario of comparatively high greenhouse gas emissions, Climatic T. B., and Markowicz, A.: Urban air quality in the Asian region, Change, 109, 33–57, https://doi.org/10.1007/s10584-011-0149- Sci. Total Environ., 404, 103–112, 2008. y, 2001. Hourdin, F., Musat, I., Bony, S., Braconnot, P., Codron, F., Saikawa, E., Naik, V., Horowitz, L. W., Liu, J., and Mauzerall, D. Dufresne, J.-L., Fairhead, L., Filiberti, M.-A., Friedlingstein, P., L.: Present and potential future contributions of sulfate, black and Grandpeix, J.-Y., Krinner, G., Levan, P., Li, Z.-X., and Lott, F.: organic carbon aerosols from China to global air quality, prema- The LMDZ4 general circulation model: climate performance and ture mortality and radiative forcing, Atmos. Environ., 44, 2814– sensitivity to parametrized physics with emphasis on tropical 2822, 2009. convection, Clim. Dynam., 27, 787–813, 2006. Schnaiter, M., Horvath, H., Mohler, O., Naumann, K.-H., Saatho, ICCSR: Indonesia climate change sectoral roadmap: synthesis re- H., and Schock, O. W.: UV-VIS-NIR spectral optical properties port, Minister of National Development Planning, Jakarta, In- of soot and soot-containing aerosols, J. Aerosol Sci., 34, 1421– donesia, 2009. 1444, 2003. Jacobson, M. Z.: A physically-based treatment of elemental carbon Shindell, D., Kuylenstierna, J., Vignatti, E., Van Dingenen, optics: Implications for global direct forcing of aerosols, Geo- R., Amann, M., Klimont, Z., Anenberg, S. C., Muller, N., phys. Res. Lett., 27, 217–220, 2000. Janssens-Maenhout, G., Raes, F., Schwartz, J., Faluvegi, G., Jacobson, M. Z.: Strong radiative heating due to the mixing state Pozzoli, L., Kupiainen, K., Höglund-Emberson, L., Streets, of black carbon in atmospheric aerosols, Nature, 409, 695–697, D., Ramanathan, V., Hicks, K., Kim Oanh, N. T., Milly, https://doi.org/10.1038/35055518, 2001. G., Williams, M., Demkine, V., and Fowler, D.: Simulta- Kim, Y. M., Lee, S. B., Bae, G. N., Park, S. S., Han, K. M., Park, R. neously mitigating near-term climate change and improv- S., Song, C. H., and Park, H. S.: Distribution and direct radiative ing human health and food security, Science, 335, 183–189, forcing of BC aerosols over Korean peninsula, Atmos. Environ., https://doi.org/10.1126/science.1210026, 2012. 58, 45–55, 2012. Smith, K. R., Jerrett, M., Anderson, H. R., Burnett, R. T., Stone, Kim Oanh, N. T., Upadhyay, N., Zhuang, Y. H, Hao, Z. P., Murthy, V., and Derwent, R.: Public health benefits of strategies to re- D. V. S, Lestari, P., Villarine, J. T., Chengchua, K., Co, H. X., duce greenhouse-gas emissions: health implications of short- Dung, N. T., and Lindgren, E. S.: Particulate air pollution in six lived greenhouse pollutants, Lancet, 374, 2091–2103, 2009. Asian cities: Spatial and temporal distributions, and associated Streets, D. G., Bond, T. C., Carmichael, G. R., Fernandes, S. D., Fu, sources, Atmos. Environ., 40, 3367–3380, 2006. Q., He, D., Klimont, Z., Nelson, S. M., Tsai, N. Y., Wang, M. Landi, T. C. and Curci, G.: Modeling aerosol optical prop- Q, Woo, J. H., and Yarber, K. F.: An inventory of gaseous and erties with AODEM: accounting for non-sphericity of dust primary aerosol emissions in Asia in the year 2000, J. Geophys. particles, Geophys Research Abstracts, 13, EGU2011-3958, Res., 108, 8809, https://doi.org/10.1029/2002JD003093, 2003. available at: http://meetingorganizer.copernicus.org/EGU2011/ UNEP-WMO: Integrated assessment of black carbon and tropo- EGU2011-3958.pdf (last access: 30 October 2017), 2011. spheric ozone, United Nations Environment Programme and Ministry of Forestry (MoF): Strategic Plan 2010–2014 of Ministry World Meteorological Organization, Nairobi, Kenya, 2011. of Forestry, Government Decree of Ministry of Forestry number Vautard, R., Beekmann, M., Roux, J., and Gombert, D.: Validation P.08/Menhut-II/2010, Jakarta, Indonesia, 2010. of a hybrid forecasting system for the ozone concentrations over Myhre, G., Myhre, A., and Stordal, F.: Historical evolution of the Paris area, Atmos. Environ., 35, 2449–2461, 2001. radiative forcing of climate, Atmos. Environ., 35, 2361–2373, Wang, X. and Mauzerall, D. L.: Evaluating impacts of air pollution https://doi.org/10.1016/S1352-2310(00)00531-8, 2001. in China on public health: Implications for future air pollution Ohara, T., Akimoto, H., Kurokawa, J., Horii, N., Yamaji, K., Yan, and energy policies, Atmos. Environ., 40, 1706–1721, 2006. X., and Hayasaka, T.: An Asian emission inventory of anthro- www.atmos-chem-phys.net/18/3321/2018/ Atmos. Chem. Phys., 18, 3321–3334, 2018
You can also read