Phylogeography in an "oyster" shell provides first insights into the genetic structure of an extinct Ostrea edulis population - Nature
←
→
Page content transcription
If your browser does not render page correctly, please read the page content below
www.nature.com/scientificreports
OPEN Phylogeography in an “oyster”
shell provides first insights
into the genetic structure
of an extinct Ostrea edulis
population
Sarah Hayer1*, Dirk Brandis1, Alexander Immel2, Julian Susat2, Montserrat Torres‑Oliva2,
Christine Ewers‑Saucedo1 & Ben Krause‑Kyora2
The historical phylogeography of Ostrea edulis was successfully depicted in its native range for the first
time using ancient DNA methods on dry shells from museum collections. This research reconstructed
the historical population structure of the European flat oyster across Europe in the 1870s—including
the now extinct population in the Wadden Sea. In total, four haplogroups were identified with one
haplogroup having a patchy distribution from the North Sea to the Atlantic coast of France. This
irregular distribution could be the result of translocations. The other three haplogroups are restricted
to narrow geographic ranges, which may indicate adaptation to local environmental conditions or
geographical barriers to gene flow. The phylogenetic reconstruction of the four haplogroups suggests
the signatures of glacial refugia and postglacial expansion. The comparison with present-day O. edulis
populations revealed a temporally stable population genetic pattern over the past 150 years despite
large-scale translocations. This historical phylogeographic reconstruction was able to discover an
autochthonous population in the German and Danish Wadden Sea in the late nineteenth century,
where O. edulis is extinct today. The genetic distinctiveness of a now-extinct population hints at a
connection between the genetic background of O. edulis in the Wadden Sea and for its absence until
today.
Today, many plant and animal species are threatened or endangered by extinction, mainly due to human influ-
ences. The anthropogenically driven species decline exceeds the natural r ate1. Oysters are prominent examples of
endangered species as a result of overexploitation and d isease2,3. The European flat oyster Ostrea edulis Linnaeus,
1758 is native to the shallow regions of the Atlantic coasts from Norway to North East Africa as well as from
the Mediterranean Sea to the Black Sea4–6. The oyster was very common until the nineteenth century, but the
oyster beds eventually declined, at least in part due to o verfishing3. Subsequently, large translocation efforts were
undertaken to sustain the local oyster b eds6,7. These translocation efforts were unsuccessful in the Wadden Sea,
where O. edulis went locally extinct in the 1 930s3,7,8. The decline in the remaining range was further accelerated
by introduced pathogens, which led to disease outbreaks in the late 1970s and early 1 980s3,8–11.
Human activities and their consequences have certainly played a role in the massive decline in wild O.
edulis populations, but the reasons for the complete extinction of the Wadden Sea population remain poorly
understood8,11. Present-day phylogeographic studies aimed to create effective resettlement strategies and to
support suitable conservation management plans for many species12–14. The currently inferred phylogeography
of the European flat oyster suggests that populations from the North Sea, the Atlantic and the Mediterranean
Sea together with the Black Sea are genetically distinct12,14. This pattern matches the general phylogeography
of marine species in Europe, which appears to be strongly influenced by the Last Glacial Maximum about
10,000 years ago15,16. In many marine species several periglacial refugia have been reconstructed, from where
the European coasts were r ecolonized16. The now extinct Wadden Sea population of the European flat oyster
1
Zoologisches Museum, Christian-Albrechts-Universität zu Kiel, Hegewischstraße 3, 24105 Kiel, Germany. 2Institut
für klinische Molekularbiologie (IKMB), Christian-Albrechts-Universität zu Kiel, 24118 Kiel, Germany. *email:
shayer@zoolmuseum.uni‑kiel.de
Scientific Reports | (2021) 11:2307 | https://doi.org/10.1038/s41598-021-82020-x 1
Vol.:(0123456789)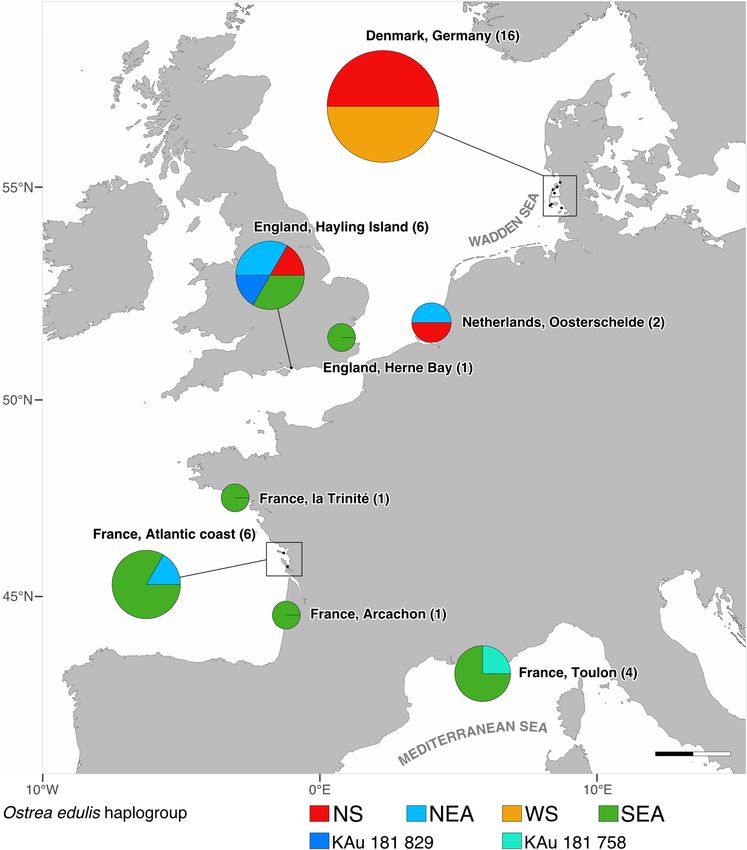
www.nature.com/scientificreports/
could not be included into the phylogeographical studies of present day genetic diversity, which may provide
vital clues for the survival of oysters at large.
This highlights a general problem in conservation biology: as soon as a species or population goes extinct,
it becomes difficult to reconstruct the reasons for their demise. To remodel the historical phylogeography of
extinct populations of O. edulis, sequencing historical specimens from museum collections with ancient DNA
(aDNA) techniques offers the only possibility to analyse an extinct species or population genetically17–19. Only in
the last two decades, DNA of mollusc shells has been successfully extracted and sequenced, which encouraged
us to analyse a unique museum collection of European oyster shells collected in the 1870s from across Europe
with aDNA methods20–22.
This study aims to reconstruct the actual state of O. edulis’ historical phylogeography in its native range
between the years 1868 to 1885 by using complete mitochondrial genomes. At this time, the natural oyster beds
were still widespread—including the now extinct Wadden Sea. By using the historical shells in combination with
the entire genomes, we intend to achieve a higher resolution of the historical phylogeography of O. edulis and the
reconstruction of the genetic population structure within areas in which O. edulis is extinct today.
Material and methods
Mitochondrial genome assembly of a present‑day oyster. To map historical DNA sequences accu-
rately, we generated a reference mitochondrial genome from a freshly collected individual of O. edulis, which was
purchased at the Limfjord (Denmark) in October 2018. Modern DNA extraction was performed in the IKMB
in Kiel (Germany). 25 mg of soft tissue were extracted with the MagAttract HMW DNAKit (Qiagen) follow-
ing manufacturers protocol and fragment length was measured using Agilent TapeStation 4200. A Chromium
library (10× Genomics)23 was prepared and sequenced on one Illumina HiSeq4000 lane. After sequencing, 10×
barcodes were removed from reads using Trimmomatic v0.33, specifying HEADCROP:23 for forward reads
and HEADCROP:1 for reverse r eads24. Trimmed reads were used as input for MitoZ with the option “–genetic_
code 5” to generate the mitochondrial assembly25. The assembly was compared with the existing mitochondrial
genome (GenBank acc. no. JF274008) in Geneious v. 2020.0.426. The new mitochondrial genome was uploaded
to GenBank with the accession number MT663266.
Preparation of historical oyster shells. We used museum collection material to generate the historical
DNA sequences (see Supplementary Table S1). Shell material stems from the historical oyster collection of the
Zoological Museum in Kiel, Germany, which is composed of O. edulis shells sampled alive along all coasts of
Northern Europe between 1868 and 1885, prior to their decline27.
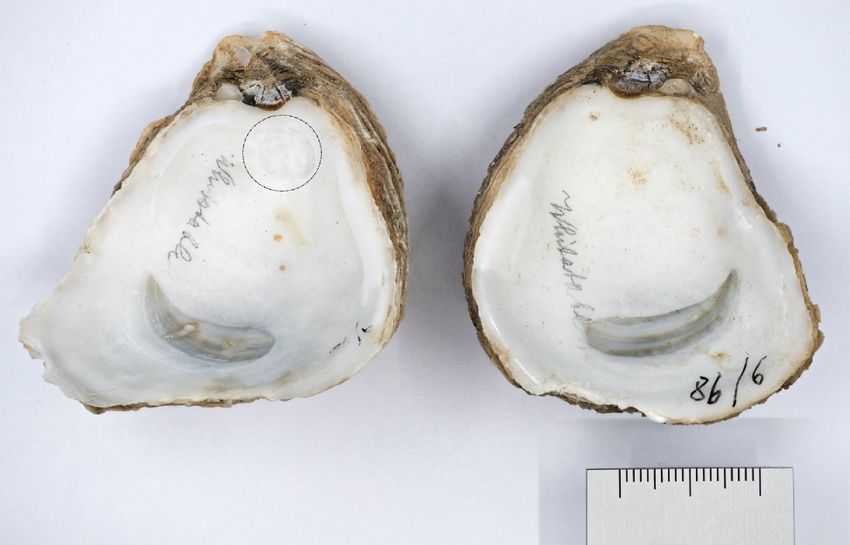
Shells of historical O. edulis were bleached, rinsed with distilled water and dried overnight. Using a Dremel
hand drill with a round dental drill attachment, the uppermost layer was first removed to exclude any epibiota
before a hole was drilled into the inner surface of the shell (see Fig. 1). Generally, the inner side of the shells was
used for drilling. Drillings were collected on a weighing paper and transferred into a 2 ml tube. To avoid cross-
contamination a new drill bit was used for each sample and the weighing paper was also changed.
Ancient DNA extraction and sequencing. DNA extraction and pre-PCR steps were performed in clean
room facilities dedicated to aDNA research, which were never used for fresh oyster material. DNA extraction
of a total of 164 O. edulis individuals was performed with approximately 150 mg of shell material following a
silica-based protocol with 0.5% SDS added to the extraction buffer to bind the calcium of the shells20,28,29. Nega-
tive controls for all experimental steps were included to rule out contamination. From each sample, double-
stranded DNA sequencing libraries that were partially treated with uracil DNA glycosylase (UDGhalf) were pre-
pared according to an established protocol for multiplex high-throughput s equencing30. Sample-specific indices
were added to both library adapters via amplification with two index primers. Extraction and library blanks
were treated in the same manner. After an initial check for DNA content above 2 ng/µl, only 94 libraries were
sequenced on 1/50 of a lane on the Illumina HiSeq 4000 platform (2*75 cycles) in the same Sequencing Centre
following the manufacturer’s protocol.
Bioinformatics. De-multiplexing was performed by sorting reads corresponding to their p7 and p5 combi-
nations using the Bcl2fastq software (Illumina, Inc.). All generated sequences were processed according to pub-
lished protocols specific for aDNA using the EAGER p ipeline31. We mapped all reads against the newly assembled
mitochondrial reference genome of O. edulis (GenBank acc. no. MT663266) using the Circular mapper module
of the EAGER pipeline with the default setting for aDNA reads 31,32. All duplicate reads were removed applying
DeDup version 0.12.2, part of the EAGER pipeline, with the default options 31. To verify aDNA data sets, we
evaluated the presence of postmortem DNA damage signatures from read alignments using mapDamage version
2.0.833. To generate the consensus sequences and a SNP-based multiple alignment, the vcf2genome script was
applied. Consensus sequences were built with a coverage of at least 3× against the reference genome, resulting
in 65 samples with sequence data. The remaining 29 sequences had a read coverage below three throughout the
mitochondrial genome. The read coverage describes the number of reads over a position in the genome.
Phylogenetic reconstruction. For the phylogenetic reconstruction, we aligned all 65 sequences to our
new complete mitochondrial genome sequence of O. edulis (see first section). We rooted the phylogenies with
two outgroups, Ostrea lurida and Ostrea denselamellosa (acc. nos. KC768038, NC_015231)34 from NCBI Gen-
Bank. In order to keep as many sequences as possible, while building a robust phylogeny, we extracted the single
nucleotide polymorphisms (SNPs) of each sequence based on its VCF file and calculated the percentage of uni-
dentified SNPs per sequence. Based on this calculation, we reconstructed phylogenies with all sequences that fell
Scientific Reports | (2021) 11:2307 | https://doi.org/10.1038/s41598-021-82020-x 2
Vol:.(1234567890)www.nature.com/scientificreports/
Figure 1. Macroscopic photography of both shells of one individual of Ostrea edulis, belonging to the collection
of the Zoological museum Kiel. The left shell has a drill hole of approximately 8 mm in diameter underneath the
ligament (circled). The right shell is undamaged.
below a certain percentage of missing SNPs. We compared phylogenies with more than 95% to more than 60%
of missing SNPs in all sequences in 5% steps. This was tested by calculating Neighbour-Joining trees applying
the Tamura-Nei Genetic Distance Model and 100 bootstrap replicates in Geneious. The tests resulted in a robust
phylogeny based on 37 sequences that had no more than 90% unidentified SNPs. Thus, 28 sequences with more
than 90% unidentified SNPs were removed. Detailed information about the bioinformatics of each sequence
is given in Supplementary Table S2. The 37 aligned sequences are available through the European Nucleotide
Archive (ENA) under the accession number PRJEB40678.
After the initial assessment of the effect of missing data on the phylogenetic reconstruction, we reconstructed
a maximum likelihood phylogeny using the General Time Reversible model of complete mitochondrial genomes
in MEGA version X 35,36. We used all sites and estimated the transition/transversion ratio. Branch support was
calculated from 500 bootstrap replicates. The branches of all phylogenies were collapsed when the bootstrap
support was under 35% using TreeGraph2 version 2.15.0.88737. The haplogroups were primarily selected by a
number of diagnostic SNPs that are shared by sequences and are specific for a haplogroup. The primarily selec-
tion was supported by bootstrap support.
To compare historical and current sequences, we downloaded a total of 16 haplotypes of the 12S rRNA frag-
ment from NCBI GenBank (acc. nos. AY157516 to AY157529, HQ259072, JQ611471)12,38. Combining these
present-day with our historical 12S rRNA sequences from the mitochondrial genomes, we built a second maxi-
mum likelihood phylogeny with the same settings using the shortest 12S rRNA fragment of 280 basepairs as
reference. All historical sequences without identified nucleotides within the 12S rRNA encoding gene fragment
were automatically removed.
Population genetic analyses. All population genetic analyses were conducted in R version 3.6.239. Many
of the historical sequences contained a high frequency of unmapped nucleotides (“N”s), which prohibit some
population genetic analyses. In particular, any site with missing data may be removed from analyses, which
would mean the exclusion of most of the variable sites from analyses. To be able to nonetheless conduct popula-
tion genetic analyses based on sequence similarity, we restricted our analyses to the comparison of haplogroups,
not individual haplotypes. For every haplogroup, we extracted the sequence with the highest quality and few-
est number of missing nucleotides and multiplied it with the number of individuals present in the respective
haplogroup. We are aware that any nucleotide diversity within the haplogroups is lost by this treatment, but
since diversity or population size analyses were not the goal of this study, we decided to restrict our analyses to
comparisons based on haplogroups.
Scientific Reports | (2021) 11:2307 | https://doi.org/10.1038/s41598-021-82020-x 3
Vol.:(0123456789)www.nature.com/scientificreports/
The genetic differentiation between all population pairs was calculated as Nei’s G
ST and Jost’s D with the func-
tions ‘pairwise_GST_Nei’ and ‘pairwise_D’ of the ‘mmod’ p ackage40. GST is a derivative of the classical fixation
index FST, developed for data with more than two alleles at a locus41. We estimated significant deviations from
zero (no differentiation between population pairs) by comparison with an empirical distribution of GST values
based on 1000 permutations (Jost’s D calculation in Supplementary Table S4).
Results
We assembled a new complete mitochondrial genome of O. edulis (GenBank acc. no. MT663266) that differs
from the existing mitochondrial genome of O. edulis in GenBank (acc. no. JF274008) in the COI region (see
Supplementary Table S3). It is with 16 356 nucleotides 36 bp longer than the existing mitochondrial genome
(JF274008) and encodes 38 genes, including 12 protein-coding genes (PCGs), 3 rRNAs and 23 tRNAs on the
same strand (see Supplementary Fig. S1).
The reference genome (JF274008) misses 36 bp in the COI gene, but none of the ancient mitochondrial
genomes reveals a deletion in the COI region. We sampled 164 O. edulis shells, but only 94 samples contained
DNA and were sequenced using Illumina HiSeq. The remaining 57 sequences could not be used for the phylogeny
due to low read coverage (minimal coverage for base call ≥ 3). The final alignment is composed of 37 ancient
mitochondrial sequences of O. edulis, plus both reference genomes and two outgroups (see Supplementary
Table S1–S2).
Phylogenetic reconstruction and population genetic analyses. Based on the phylogenetic recon-
struction of the complete mitochondrial genome we identified four monophyletic haplogroups, labelled accord-
ing to their geographic range as Wadden Sea (WS), North Sea (NS), North-East Atlantic (NEA) and South-East
Atlantic (SEA) (see Figs. 2, 3). They are defined by a number of diagnostic SNPs that are in this composition
unique for a haplogroup (see Supplementary Table S5). Haplogroup WS is based on eight sequences collected
only along the Wadden Sea of Germany and Denmark, which is the most restrict distribution range of all hap-
logroups (Figs. 2, 3). Haplogroup NS is a separate basal clade of eleven sequences that can only be found at the
North Sea coasts. It is composed of two branches: One branch is composed of more local sequences that were
collected at the North Frisian and Danish Wadden Sea islands and circumjacent oyster beds. The second branch
includes sequences from all coasts of the North Sea like the Netherlands, England and Germany. Our new refer-
ence also falls into that branch (Figs. 2, 3). Haplogroup SEA is composed of 13 individuals collected at the Atlan-
tic and Mediterranean coasts of France and the South coast of England in 1869 (Figs. 2, 3). The mitochondrial
genome from GenBank, which originates from an oyster collected at the French Atlantic coast, also belongs to
this haplogroup. Haplogroup NEA holds four aDNA sequences from the coasts of France, the Netherlands and
England between 1869 and 1878 (Figs. 2, 3). This haplogroup is composed of sequences that have many variable
SNPs, and given more data, we might have split this haplogroup up in two haplogroups. Two sequences from
Hayling Island, England and Toulon, France were not assigned to any haplogroup.
In comparison to the phylogeny based on the complete mitochondrial genome (Fig. 2), the haplogroups could
not be resolved in the 12S rRNA phylogeny (see Supplementary Fig. S2). The phylogeny is also poorly supported
by bootstrap values, which makes it difficult to draw conclusions about a relationship between aDNA samples
and formerly defined haplotypes12,38.
In order to identify the genetic differentiation between populations, calculations of Nei’s G
ST were conducted
between populations with four or more individuals and ranged from 0 to 0.343 (Table 1). Since the number of
individuals per sampling site was sometimes only one or two, we combined several of the sampling locations: all
specimens from England were summarized, as were the individuals collected along the French Atlantic coast, and
German and Danish individuals were condensed to one population called “Wadden Sea”. The Netherlands were
excluded from the statistical calculations, since the number of individuals was very small. The model revealed
partly a significant population structure across Europe (Table 1). The Wadden Sea is most distinct from the rest
of Europe (Table 1). The populations from England are similar to those of the Mediterranean and the Atlantic
coast of France, but distinct from the Wadden Sea (Table 1). The Atlantic and Mediterranean coasts of France
are similar to each other, given that most samples can be assigned to haplogroup SEA (see Table 1).
Discussion
In the course of this study, we reconstructed 37 complete historical mitochondrial genomes extracted from dry
shells of O. edulis and based on this aDNA data, we successfully reconstructed the phylogeography of O. edulis
throughout the native range from the 1870s. The phylogeographic reconstruction revealed the presence of an
autochthonous population in the German and Danish Wadden Sea, where the European oyster is extinct today.
This finding provides a possible reason for the extinction of the European oyster in the Wadden Sea and for its
continuous absence until today.
The most astonishing result is the autochthonous haplogroup WS, which is based on eight individuals that
were without exception collected from the near shore of the Danish and German Wadden Sea, where the Euro-
pean oyster went extinct in the 1930s8. Its restriction to the Wadden Sea may indicate local adaptation to the
distinct environmental conditions of the Wadden Sea. The oyster beds in the Wadden Sea were situated in deeper
trenches between the mudflats, so that they were still covered with water during low t ide27. But due to the tidal
change, currents and salinity in the deeper trenches are more extreme than in the central North Sea or the
Atlantic coast. While haplogroup WS may have been well-adapted to the extreme environmental conditions of
the Wadden Sea, it may not have been able to react to broader ecological changes or might have been particularly
vulnerable to diseases, high temperatures, pollution or other global change threats. This possible vulnerability
Scientific Reports | (2021) 11:2307 | https://doi.org/10.1038/s41598-021-82020-x 4
Vol:.(1234567890)www.nature.com/scientificreports/
Figure 2. Phylogeny of ancient mitochondrial genomes mapped against MT663266 (complete mitochondrial
genome generated in this study) and controlled with JF274008.1 (complete mitochondrial genome in GenBank)
using the maximum likelihood method and General time Reversible model using all sites. Bootstrap node
support (in percent, from 500 replicates) is shown next to the branches. All branches with less than 35 bootstrap
support are collapsed. Colour shading highlights different haplogroups. Phylogeny is rooted with O. lurida and
O. denselamellosa. This analysis involved 41 nucleotide sequences with a total of 16,653 positions in the final
dataset. Legend: NS = North Sea, NEA = North East Atlantic, WS = Wadden Sea, SEA = South East Atlantic.
Scientific Reports | (2021) 11:2307 | https://doi.org/10.1038/s41598-021-82020-x 5
Vol.:(0123456789)www.nature.com/scientificreports/
Figure 3. Geographic distribution of mitochondrial haplogroup frequencies of Ostrea edulis in Europe between
1869 and 1879. The smallest pie chart represents a single individual. All sample sizes are given in brackets
on each location. Scale bar = 100 km. legend: NS = North Sea, NEA = North East Atlantic, WS = Wadden Sea,
SEA = South East Atlantic. Map was created using R Studio version 1.1.453 (https://rstudio.com)39.
to ecological changes in combination with overfishing could have led to the extinction event of haplogroup
WS in the early twentieth century. This would also explain why O. edulis has not recovered in the Wadden Sea.
However, this does not explain why the second haplogroup NS, which was also present in the Wadden Sea
in the late nineteenth century, has not re-occupied this region. Especially since this haplogroup survived in the
adjacent Limfjord. One explanation could be the different environmental conditions between the Wadden Sea
and the Limfjord: The Limfjord is a shallow water body of 7 m in average and opens through the Thyborøn canal
into the North Sea, which is a canal of 1 km in width. This narrow connection to the North Sea leads to a low
Scientific Reports | (2021) 11:2307 | https://doi.org/10.1038/s41598-021-82020-x 6
Vol:.(1234567890)www.nature.com/scientificreports/
Wadden Sea England Atlantic Mediterranean
Sample size 20 7 8 4
Haplogroups NS, WS NS, NEA, Kau181829, SEA NEA, SEA Kau181758, SEA
Nei’s GST
Wadden Sea – 0.043 0.004 0.021
England 0.1367843s0 – 0.163 0.473
Atlantic 0.34252229 0.06331849 – 0.472
Mediterranean 0.31563499 0.04836342 0.02782109 –
Table 1. Results of Nei’s GST pairwise analyses of O. edulis populations from sampling sites with more than
four sampled individuals. Pairwise p-values are shown in the top triangle (italics background). Values with
significance are bolded (p-value < 0.05).
volume inflow of salt water into the Limfjord, which results in a lower salinity towards the East and modified
tidal ranges and currents. Due to these environmental conditions, the Limfjord is less disturbed and thus a safer
location for oysters to grow. Because of the remote location combined with reduced water inflow and currents,
pathogens and competitors like Bonamia ostreae and Magallana gigas appeared in the Limfjord later than at other
urope42,43. Another hypothesis is based on the results of Ronza et al.44: they showed that O. edulis
locations in E
has not developed any resistance to bonamiosis in the Limfjord yet. The presence of B. ostreae in the North Sea
may therefore be a reason why the native oyster has not recolonized the Wadden Sea a gain44. In the past, it has
been observed that B. ostreae was eliminated during cold winters, while O. edulis was able to s urvive45. However,
such strong winters have become scarce in the course of the global warming, which may make it difficult for O.
edulis to re-occupy the Wadden Sea, when climatic conditions favour the survival of bonamiosis. Hence, the
environmental difference between the remote Limfjord and the Wadden Sea, altered climate conditions and
parasites could explain why O. edulis has not resettled the Wadden Sea again.
Moreover, the Limfjordian oyster beds are a special case concerning the survival of natural beds of the Euro-
pean flat oyster, since it is the only surviving natural oyster bed in the North Sea. The Limfjord oyster beds are
young in comparison to the oyster beds along the North Sea coast. Initially a brackish water body, the Limfjord
became marine when a heavy storm connected it to the North Sea in 18256. Soon after, the first oyster beds
were discovered in the L imfjord6. The Limfjordian oyster beds were, however, also supported by translocations
of 18 million adult oysters originating from the N etherlands7. Our genetic results only verify the survival of
haplogroup NS in the Limfjord, but cannot differentiate if this haplogroup came into the Limfjord via natural
dispersal or translocation.
Another conspicuous result concerns our phylogenetic reconstruction revealing a split between the most
basal haplogroup NS and the remaining lineages. This relatively old split could have evolved when oysters were
constrained in their distribution to two different glacial refugia. The basal haplogroup NS is widely spread in the
central North Sea with the most western record in the English Channel, but no individuals with this haplotype
were retrieved further south (see Fig. 3). It represents therefore a private haplogroup to the North Sea, which
is indicative of a northern glacial r efugium16. The Hurd Deep, a deeper trench in the western English Channel,
and some ice free coasts along the North Sea could have been glacial refugia to different seaweed species46–49,
molluscs50,51 and decapods52. Curiously, this northern lineage has not expanded further south after the glaciers
retracted. Larval dispersal may be constrained by the internal counter clockwise circulation currents in the
North Sea53. It would also be conceivable that this northern lineage is not well-adapted to southern environ-
mental conditions such as high temperatures. Of course, it is not possible to draw conclusions about adaptation
processes based on the results of the mitochondrial genome, but other phylogeographic studies also show that
the distribution of genetic lineages correlates with environmental c onditions54.
Nevertheless, this study could prove the presence of haplogroup NS in the Wadden Sea at the end of the
nineteenth century and assuming that this haplogroup is specially adapted to this environment, this provides
a valuable result for conservation management and resettlement strategies of the European flat oyster in the
Wadden Sea.
The southern clade presents with three haplogroups (WS, SEA & NEA) a higher phylogenetic diversity than
the northern clade. It is distributed along the East Atlantic coast and the Mediterranean Sea. We propose that
this clade had one or more southern glacial refugia, and expanded northwards as the climate warmed. The pres-
ence of several monophyletic groupings within this clade could be due to differentiation processes during its
northward spread. The northwards expansion could have led to a series of founder effects presenting the different
haplogroups restricted to a geographic range such as haplogroup WS. This recolonization of Northern Europe
from southern glacial refugia is common in both marine and terrestrial s pecies47,55–60.
Based on our data, the Atlantic and Mediterranean populations are not significantly different from each
other, as might have been expected given the biogeographic break between them (see haplogroup SEA, Fig. 3).
Phylogeographic studies consistently separate the Atlantic from the Mediterranean Sea not only in the European
oyster12, but also in a diverse array of marine organisms such as marine algae and seagrasses46,48,61, different
invertebrates62–65, bony fishes66–69 and cartilaginous fishes70. Due to the low sample size of O. edulis in the Medi-
terranean Sea—we were only able to sequence four individuals successfully, the missing genetic differentiation
between the historical Atlantic and Mediterranean populations of O. edulis is likely an artefact. Moreover, all
sequenced individuals were collected from a single location in the Mediterranean Sea.
Scientific Reports | (2021) 11:2307 | https://doi.org/10.1038/s41598-021-82020-x 7
Vol.:(0123456789)www.nature.com/scientificreports/
At the end of the nineteenth century, the anthropogenic influence on the oyster beds by exchanging oys-
ter spat all over Europe was already common to sustain the oyster b eds3,6,7. However, the haplogroups in our
study do not reflect these massive translocations and are restricted to geographical ranges with the exception of
haplogroup NEA. The patchy distribution of this haplogroup (see Fig. 3) could be the result of translocations.
Fullarton stated that by the 1800s “most of the English natives are born in France or Holland, and are fattened at
Whitstable or other beds in the South of England”71. Bromley and colleagues pictured that imports to England
originated from France, Scotland, the Netherlands, Ireland and other unknown source c ountries7. However, we
could not include any oysters from the French coast of the English Channel or other locations of Great Britain
or Ireland to further confirm these hypotheses. Another explanation would be that this haplogroup does not
actually represent a cluster of highly similarly sequences. Haplogroup NEA has the lowest bootstrap support
(39%, see Fig. 2) and contains somewhat disparate sequences. Again, the inclusion of more sequences could
resolve this potential artefact.
Present-day phylogeographical studies identified both significant differentiation between the Atlantic and
Mediterranean and a differentiated clade in the North S ea12,14,72. This study on the complete mitochondrial
genome confirms the phylogeographical pattern of O. edulis, however, the resolution is much higher and finer
due to more SNPs and more sampling sites, which still existed in the late nineteenth century in comparison
to today. Since all four studies found the same phylogeographic pattern, we conclude that this seems to be a
temporally stable pattern over the past 150 years despite large-scale translocations. Additionally, our reference
mitochondrial genome originating from the Limfjord (Denmark) in 2018 confirms that haplogroup NS still
exists today (see Fig. 2).
Danic-Tchaleu et al.32 also assembled a mitochondrial genome of O. edulis, which originates from Quiberon
(France). They used long range PCR and Sanger sequencing32. Since we used high-throughput sequencing for
the Limfjordian oyster, these methodological differences could explain the additional 36 bp in our genome. How-
ever, it is significant that not only the new modern mitochondrial genome has 36 bp more, but the 37 historical
mitochondrial genomes as well. Therefore, a sequencing error is unlikely.
Conclusion
This study’s goal was to reconstruct the actual state of the locally extinct O. edulis’ historical phylogeography at
the end of the nineteenth century, at a time when natural oyster beds were still widespread – including the now
extinct Wadden Sea population. The reconstruction of the phylogeography of the European flat oyster has reached
an important milestone because of two factors: Firstly, the application of complete mitochondrial genomes can
resolve the phylogeographic pattern in a more detailed manner than single DNA markers. Secondly, the extrac-
tion of DNA from historical individuals housed in natural history collections allows the representation of the
exact phylogeography at a specific point in time in the past. As a result, an autochthonous haplogroup could
be detected in the Wadden Sea. This finding underlines the importance of interdisciplinary approaches. Both
museum collection documentation, which has been proven to be valuable in earlier works on O. edulis (Hayer
et al. 2019), as well as innovative aDNA methods enable us to gain new results from historical material.
Received: 10 July 2020; Accepted: 14 January 2021
References
1. Rosser, A. M. & Mainka, S. A. Overexploitation and species extinctions. Conserv. Biol. 16, 584–586 (2002).
2. Beck, M. W. et al. Oyster reefs at risk and recommendations for conservation, restoration, and management. Bioscience 61, 107–116
(2011).
3. Gercken, J. & Schmidt, A. Aktueller Status der Europäischen Auster (Ostrea edulis) und Möglichkeiten einer Wiederansiedlung in
der deutschen Nordsee. (2014).
4. Lapegue, S., Beaumont, A., Boudry, P. & Goulletquer, P. European flat oyster - Ostrea edulis. Genimpact 68–73 (2006).
5. Strauch, F. & Thüry, G. E. Austernfunde aus römischen Gebäuderesten in Tittmoning, Ldkr. Traunstein. Bayer. Vor. 50, 341–354
(1985).
6. Yonge, C. M. Oysters. J. Mar. Biol. Assoc. UK https://doi.org/10.1017/s0025315400016350 (1960).
7. Bromley, C., McGonigle, C., Ashton, E. C. & Roberts, D. Bad moves: pros and cons of moving oysters: a case study of global
translocations of Ostrea edulis Linnaeus, 1758 (Mollusca: Bivalvia). Ocean Coast. Manag. 122, 103–115 (2016).
8. Hayer, S. et al. Coming and going: historical distributions of the European oyster Ostrea edulis Linnaeus, 1758 and the introduced
slipper limpet Crepidula fornicata Linnaeus, 1758 in the. PLoS ONE 14, 1–15 (2019).
9. Friedman, C. S. & Perkins, F. O. Range extension of Bonamia ostreae to Maine, USA. J. Invertebr. Pathol. 64, 179–181 (1994).
10. Abollo, E. et al. First detection of the protozoan parasite Bonamia exitiosa (Haplosporidia) infecting flat oyster Ostrea edulis grown
in European waters. Aquaculture https://doi.org/10.1016/j.aquaculture.2007.11.037 (2008).
11. Laing, I., Walker, P. & Areal, F. Return of the native: is European oyster (Ostrea edulis) stock restoration in the UK feasible?. Aquat.
Living Resour. https://doi.org/10.1051/Alr:2006029 (2006).
12. Diaz-Almela, E., Boudry, P., Launey, S., Bonhomme, F. & Lapègue, S. Reduced female gene flow in the European flat oyster Ostrea
edulis. J. Hered. 95, 510–516 (2004).
13. McCracken, K. G., Johnson, W. P. & Sheldon, F. H. Molecular population genetics, phylogeography, and conservation biology of
the mottled duck (Anas fulvigula). Conserv. Genet. 2, 87–102 (2001).
14. Lallias, D., Boudry, P., Lapègue, S., King, J. W. & Beaumont, A. R. Strategies for the retention of high genetic variability in European
flat oyster (Ostrea edulis) restoration programmes. Conserv. Genet. 11, 1899–1910 (2010).
15. Fratini, S. et al. Phylogeography of the threatened crayfish (genus Austropotamobius) in Italy: Implications for its taxonomy and
conservation. Heredity (Edinb.) 94, 108–118 (2005).
16. Maggs, C. A. et al. Evaluating signatures of glacial refugia for north atlantic benthic marine taxa. Ecology 89, 108–122 (2008).
17. Hung, C. M. et al. The de novo assembly of mitochondrial genomes of the extinct passenger pigeon (Ectopistes migratorius) with
next generation sequencing. PLoS ONE 8, e56301 (2013).
Scientific Reports | (2021) 11:2307 | https://doi.org/10.1038/s41598-021-82020-x 8
Vol:.(1234567890)www.nature.com/scientificreports/
18. Oswald, J. A. et al. Ancient DNA from a 2,500-year-old Caribbean fossil places an extinct bird (Caracara creightoni) in a phyloge-
netic context. Mol. Phylogenet. Evol. 140, 106576 (2019).
19. Suarez, A. V. & Tsutsui, N. D. The value of museum collections for research and society. Bioscience 54, 66 (2006).
20. Der Sarkissian, C. et al. Ancient DNA analysis identifies marine mollusc shells as new metagenomic archives of the past. Mol. Ecol.
Resour. https://doi.org/10.1111/1755-0998.12679 (2017).
21. Doherty, S., Gosling, E. & Was, A. Bivalve ligament: a new source of DNA for historical studies. Aquat. Biol. 1, 161–165 (2007).
22. Geist, J., Wunderlich, H. & Kuehn, R. Use of mollusc shells for DNA-based molecular analyses. J. Molluscan Stud. 74, 337–343
(2008).
23. Zheng, G. X. Y. et al. Haplotyping germline and cancer genomes with high-throughput linked-read sequencing. Nat. Biotechnol.
34, 303–311 (2016).
24. Bolger, A. M., Lohse, M. & Usadel, B. Trimmomatic: a flexible trimmer for Illumina sequence data. Bioinformatics 30, 2114–2120
(2014).
25. Meng, G., Li, Y., Yang, C. & Liu, S. MitoZ: a toolkit for animal mitochondrial genome assembly, annotation and visualization.
Nucleic Acids Res. 47, e63 (2019).
26. Kearse, M. et al. Geneious basic: an integrated and extendable desktop software platform for the organization and analysis of
sequence data. Bioinformatics 28, 1647–1649 (2012).
27. Möbius, K. A. Die Auster und die Austernwirthschaft (1877).
28. Dabney, J. et al. Complete mitochondrial genome sequence of a Middle Pleistocene cave bear reconstructed from ultrashort DNA
fragments. Proc. Natl. Acad. Sci. USA 110, 15758–15763 (2013).
29. Krause-Kyora, B. et al. Ancient DNA study reveals HLA susceptibility locus for leprosy in medieval Europeans. Nat. Commun. 9,
1–11 (2018).
30. Rohland, N., Harney, E., Mallick, S., Nordenfelt, S. & Reich, D. Partial uracil—DNA—glycosylase treatment for screening of ancient
DNA. Philos. Trans. R. Soc. B Biol. Sci. 370, 20130624 (2015).
31. Peltzer, A. et al. EAGER: efficient ancient genome reconstruction. Genome Biol. 17, 60 (2016).
32. Danic-Tchaleu, G., Heurtebise, S., Morga, B. & Lapègue, S. Complete mitochondrial DNA sequence of the European flat oyster
Ostrea edulis confirms Ostreidae classification. BMC Res. Notes 4, 400 (2011).
33. Jónsson, H., Ginolhac, A., Schubert, M., Johnson, P. L. F. & Orlando, L. MapDamage2.0: fast approximate Bayesian estimates of
ancient DNA damage parameters. Bioinformatics 29, 1682–1684 (2013).
34. Xiao, S., Wu, X., Li, L. & Yu, Z. Complete mitochondrial genome of the Olympia oyster Ostrea lurida (Bivalvia, Ostreidae). Mito-
chondrial. DNA 26, 471–472 (2015).
35. Kumar, S., Stecher, G., Li, M., Knyaz, C. & Tamura, K. MEGA X: molecular evolutionary genetics analysis across computing
platforms. Mol. Biol. Evol. 35, 1547–1549 (2018).
36. Stecher, G., Tamura, K. & Kumar, S. Molecular evolutionary genetics analysis (MEGA) for macOS. Mol. Biol. Evol. 37, 1237–1239
(2020).
37. Stöver, B. C. & Müller, K. F. TreeGraph 2: combining and visualizing evidence from different phylogenetic analyses. BMC Bioinform.
11, 7 (2010).
38. Malkowsky, Y. & Klussmann-Kolb, A. Phylogeny and spatio-temporal distribution of European Pectinidae (Mollusca: Bivalvia).
Syst. Biodivers. 10, 233–242 (2012).
39. Team, R. C. R: A Language and Environment for Statistical Computing. Available in https://www.r-project.org (2019).
40. Winter, D. J. MMOD: an R library for the calculation of population differentiation statistics. Mol. Ecol. Resour. 12, 1158–1160
(2012).
41. Hahn, M. W. Molecular Population Genetics (Sinauer Associates, New York, 2019).
42. Freitas, P. S. et al. The recent expansion of the Pacific oyster, Cassostrea gigas, in Denmark: Limfjorden. In Shellfish Symp. (2019).
43. Madsen, L. & Thomassen, H. E. H. First detection of bonamia ostreae in native flat oysters from the Limfjord in Denmark. In17th
Int. Conf. Dis. Fish Shellfish Abstr. B. 92–92 (2015).
44. Ronza, P. et al. Long-term affected flat oyster (Ostrea edulis) haemocytes show differential gene expression profiles from naïve
oysters in response to Bonamia ostreae. Genomics 110, 390–398 (2018).
45. Madsen, L., Kamp, J. & Mellergaard, S. What can the Limfjord tell us about limiting factors for Bonamia ostreae in northern Europe?.
Bull. Eur. Ass. Fish Pathol. 33, 165 (2013).
46. Coyer, J. A., Peters, A. F., Stam, W. T. & Olsen, J. L. Post-ice age recolonization and differentiation of Fucus serratus L. (Phaeophy-
ceae; Fucaceae) populations in Northern Europe. Mol. Ecol. 12, 1817–1829 (2003).
47. Hoarau, G., Coyer, J. A., Veldsink, J. H., Stam, W. T. & Olsen, J. L. Glacial refugia and recolonization pathways in the brown seaweed
Fucus serratus. Mol. Ecol. 16, 3606–3616 (2007).
48. Provan, J., Wattier, R. A. & Maggs, C. A. Phylogeographic analysis of the red seaweed Palmaria palmata reveals a Pleistocene
marine glacial refugium in the English Channel. Mol. Ecol. 14, 793–803 (2005).
49. Stam, W., Olsen, J. & Coyer, J. Post-glacial recolonization and biogeographic patterns in the North Atlantic. Phycologia 40, 46
(2001).
50. Luttikhuizen, P. C., Drent, J. & Baker, A. J. Disjunct distribution of highly diverged mitochondrial lineage clade and population
subdivision in a marine bivalve with pelagic larval dispersal. Mol. Ecol. 12, 2215–2229 (2003).
51. Tarnowska, K. et al. Comparative phylogeography of two sister (congeneric) species of cardiid bivalve: strong influence of habitat,
life history and post-glacial history. Estuar. Coast. Shelf Sci. 107, 150–158 (2012).
52. Roman, J. & Palumbi, S. R. A global invader at home: population structure of the green crab, Carcinus maenas, Europe. Mol. Ecol.
13, 2891–2898 (2004).
53. Brown, J., Hill, A. E., Fernand, L. & Horsburgh, K. J. Observations of a seasonal jet-like circulation at the central North Sea cold
pool margin. Estuar. Coast. Shelf Sci. 48, 343–355 (1999).
54. Williams, J. E. et al. Climate change adaptation and restoration of western trout streams: opportunities and strategies. Fisheries
40, 304–317 (2015).
55. Demesure, B., Comps, B. & Petit, R. J. Chloroplast DNA phylogeography of the common beech (Fagus sylvatica L.) in Europe.
Evolution 50, 2515 (1996).
56. Hewitt, G. M. Genetic consequences of climatic oscillations in the Quaternary. Philos. Trans. R. Soc. B Biol. Sci. 359, 183–195
(2004).
57. Hewitt, G. M. Post-glacial re-colonization of European biota. Biol. J. Linn. Soc. 68, 87–112 (1999).
58. King, R. A. & Ferris, C. Chloroplast DNA phylogeography of Alnus glutinosa (L.) Gaertn. Mol. Ecol. 7, 1151–1161 (1998).
59. Provan, J. & Bennett, K. D. Phylogeographic insights into cryptic glacial refugia. Trends Ecol. Evol. 23, 564–571 (2008).
60. Wallis, G. P. & Arntzen, J. W. Mitochondrial-DNA variation in the crested newt superspecies: limited cytoplasmic gene flow among
species. Evolution 43, 88 (1989).
61. Olsen, J. L. et al. North Atlantic phylogeography and large-scale population differentiation of the seagrass Zostera marina L. Mol.
Ecol. 13, 1923–1941 (2004).
62. Baus, E., Darrock, D. J. & Bruford, M. W. Gene-flow patterns in Atlantic and Mediterranean populations of the Lusitanian sea star
Asterina gibbosa. Mol. Ecol. 14, 3373–3382 (2005).
Scientific Reports | (2021) 11:2307 | https://doi.org/10.1038/s41598-021-82020-x 9
Vol.:(0123456789)www.nature.com/scientificreports/
63. Duran, S., Giribet, G. & Turon, X. Phylogeographical history of the sponge Crambe crambe (Porifera, Poecilosclerida): range
expansion and recent invasion of the Macaronesian islands from the Mediterranean Sea. Mol. Ecol. 13, 109–122 (2004).
64. Wilke, T. & Pfenninger, M. Separating historic events from recurrent processes in cryptic species: phylogeography of mud snails
(Hydrobia spp.). Mol. Ecol. 11, 1439–1451 (2002).
65. Zane, L. et al. Genetic differentiation in a pelagic crustacean (Meganyctiphanes norvegica: Euphausiacea) from the North East
Atlantic and the Mediterranean Sea. Mar. Biol. 136, 191–199 (2000).
66. Borsa, P., Blanquer, A. & Berrebi, P. Genetic structure of the flounders Platichthys flesus and P. stellatus at different geographic
scales. Mar. Biol. 129, 233–246 (1997).
67. Cimmaruta, R., Bondanelli, P. & Nascetti, G. Genetic structure and environmental heterogeneity in the European hake (Merluccius
merluccius). Mol. Ecol. 14, 2577–2591 (2005).
68. Gysels, E. S., Hellemans, B., Pampoulie, C. & Volckaert, F. A. M. Phylogeography of the common goby, Pomatoschistus microps,
with particular emphasis on the colonization of the Mediterranean and the North Sea. Mol. Ecol. 13, 403–417 (2004).
69. Nakadate, M. et al. Genetic isolation between Atlantic and Mediterranean albacore populations inferred from mitochondrial and
nuclear DNA markers. J. Fish Biol. 66, 1545–1557 (2005).
70. Chevolot, M., Hoarau, G., Rijnsdorp, A. D., Stam, W. T. & Olsen, J. L. Phylogeography and population structure of thornback rays
(Raja clavata L., Rajidae). Mol. Ecol. 15, 3693–3705 (2006).
71. Fullarton, J. H. The oyster fishery of Scotland (1891).
72. Vera, M. et al. Current genetic status, temporal stability and structure of the remnant wild European flat oyster populations:
conservation and restoring implications. Mar. Biol. 163, 1–17 (2016).
Acknowledgements
The authors are indebted to Alexander Flache, Johanna Kanwisch, Rexford Dumevi and Magdalena Haller, who
supported us with processing the oyster samples in the lab. Thanks to Fabian Haas for kindly photographing the
collection material. This study was financially supported by a grant from the the German Federal Ministry of
Education and Research (Bundesministerium für Bildung und Forschung, project number 01UQ1711) and by the
Deutsche Forschungsgemeinschaft (DFG, German Research Foundation) through the project number 390870439
(EXC 2150—ROOTS) to B.K.-K. We would like to thank two anonymous reviewers for their helpful comments.
Author contributions
C.E.-S., D.B. and B.K.-K. designed the study. D.B. acquired funds of the BMBF. S.H. performed the experiment.
A.I. and J.S. analyzed the data. M.T.-O. assembled the mitochondrial reference genome. C.E.-S. and S.H. inter-
preted the data. B.K.-K. provided the research infrastructure. S.H. wrote the main manuscript text and prepared
all figures and tables. B.K.-K., D.B., C.E.-S. and M.T.-O. revised the manuscript.
Funding
Open Access funding enabled and organized by Projekt DEAL.
Competing interests
The authors declare no competing interests.
Additional information
Supplementary Information The online version contains supplementary material available at https://doi.
org/10.1038/s41598-021-82020-x.
Correspondence and requests for materials should be addressed to S.H.
Reprints and permissions information is available at www.nature.com/reprints.
Publisher’s note Springer Nature remains neutral with regard to jurisdictional claims in published maps and
institutional affiliations.
Open Access This article is licensed under a Creative Commons Attribution 4.0 International
License, which permits use, sharing, adaptation, distribution and reproduction in any medium or
format, as long as you give appropriate credit to the original author(s) and the source, provide a link to the
Creative Commons licence, and indicate if changes were made. The images or other third party material in this
article are included in the article’s Creative Commons licence, unless indicated otherwise in a credit line to the
material. If material is not included in the article’s Creative Commons licence and your intended use is not
permitted by statutory regulation or exceeds the permitted use, you will need to obtain permission directly from
the copyright holder. To view a copy of this licence, visit http://creativecommons.org/licenses/by/4.0/.
© The Author(s) 2021
Scientific Reports | (2021) 11:2307 | https://doi.org/10.1038/s41598-021-82020-x 10
Vol:.(1234567890)You can also read