Research trends in U.S. national parks, the world's "living laboratories" - NPS History
←
→
Page content transcription
If your browser does not render page correctly, please read the page content below
Received: 20 November 2020       Revised: 11 February 2021      Accepted: 13 March 2021
DOI: 10.1111/csp2.414

CONTRIBUTED PAPER

Research trends in U.S. national parks, the world's
“living laboratories”

Jelena Vukomanovic1,2                            |    Joshua Randall1,2

1
 Department of Parks, Recreation and
Tourism Management, North Carolina
                                                      Abstract
State University, Raleigh, North Carolina             U.S. national parks are essential public assets for preserving natural and cul-
2
 Center for Geospatial Analytics, North               tural resources and for decades have provided natural laboratories for scholarly
Carolina State University, Raleigh, North
                                                      research. However, park research, and how it may be biased, has not been
Carolina
                                                      inventoried at a national scale. Such a synthesis is crucial for assessing
Correspondence                                        research needs and planning for the future. Here, we present the first compre-
Jelena Vukomanovic, College of Natural
Resources, Campus Box 8004, 2800
                                                      hensive summary of national park research using nearly 7,000 peer-reviewed
Faucette Dr., Raleigh, NC 27695, USA.                 research articles published since 1970. We report when and where these stud-
Email: jvukoma@ncsu.edu                               ies occurred, what academic disciplines were most represented, and who
Funding information                                   funded the research. Our findings show that publication rates increased rap-
National Park Service, Grant/Award                    idly during the 1990s and 2000s, but since about 2013 have declined. Over half
Number: P17AC01439
                                                      of the studies occurred in five parks, with Yellowstone representing over a
                                                      third of all studies, followed by Everglades, Great Smoky Mountains, Glacier,
                                                      and Yosemite. Nearly half of the studies occurred in the Northwestern For-
                                                      ested Mountains ecoregion. The life sciences, particularly ecological studies,
                                                      contributed the majority of park research, although the earth sciences domi-
                                                      nated several arid ecoregions of the West. Federal agencies funded the largest
                                                      proportion of research, followed by U.S. universities, non-profit organizations,
                                                      federal programs (mainly the National Science Foundation), state agencies,
                                                      and private industry. Over a quarter of the research was supported by interna-
                                                      tional sources. Recent declines in scholarly output suggest that national park
                                                      research directions and funding opportunities should be examined.

                                                      KEYWORDS
                                                      land management, natural and cultural resources, parks and protected areas, public land,
                                                      research funding

1 | INTRODUCTION                                                                      continues to be a core mission of many parks around
                                                                                      the world (Watson, Dudley, Segan, & Hockings, 2014).
Parks and protected areas are unique public resources                                 Parks also serve as reservoirs of ecosystem services
that serve a multitude of societal needs. Historically,                               (Palomo, Martín-López, Potschin, Haines-Young, &
parks and protected areas were created primarily to con-                              Montes, 2013; Postel & Thompson Jr., 2005; Soares-
serve valued species and landscapes, and conservation                                 Filho et al., 2010), as test sites for developing climate

This is an open access article under the terms of the Creative Commons Attribution License, which permits use, distribution and reproduction in any medium, provided
the original work is properly cited.
© 2021 The Authors. Conservation Science and Practice published by Wiley Periodicals LLC. on behalf of Society for Conservation Biology

Conservation Science and Practice. 2021;e414.                                                                       wileyonlinelibrary.com/journal/csp2        1 of 15
https://doi.org/10.1111/csp2.414
2 of 15                                                                                          VUKOMANOVIC AND RANDALL

change mitigation and adaptation plans (Gonzalez,             reviews of research in national parks have been publi-
Neilson, Lenihan, & Drapek, 2010; Rehfeldt, Ferguson, &       shed periodically since the 1960s but have often focused
Crookston, 2009; Westerling, Turner, Smithwick,               on single issues of concern, such as wildlife management
Romme, & Ryan, 2011), as sources of aesthetic and artis-      (e.g., Leopold, 1963; Mech & Barber, 2002). Much that
tic inspiration (e.g., Nancarrow, 2006; Vaughn &              has been written about NPS research has been limited in
Lovett, 2019), and as vital connection points between         scope to compilations and case studies, as exemplified by
people and nature (Floyd, 2001; Leaman, 2013). For            the title of the 1989 review, National Parks: from vignettes
these reasons, among many others, parks have been             to a global view (Bishop et al., 1989). NPS has a broad
valuable sites for both basic and applied scholarly           mission of conserving national parks for future genera-
research, ranging from long-term studies of environ-          tions and has traditionally valued national park research
mental change (e.g., Roland, Stehn, Schmidt, &                in several broad categories: inventories of resources for
Houseman, 2016) to archeological and paleontological          protection, management, and monitoring; studies that
discoveries (e.g., Thomas et al., 2020) to advances in eco-   can guide understanding of natural dynamics and pro-
nomic valuation of non-market goods (e.g., Haefele,           cesses from individuals to ecosystems; assessments of
Loomis, & Bilmes, 2016).                                      threats; and evaluations of management responses
    Research in national parks has a long history. In         (NRC, 1992). More recent efforts have broadened this
the 1890s, for example, Henry Cowles conducted the            scope to consider the relationships between people and
first field studies of plant succession—one of the cen-       parks, the use of community science for research, and the
tral concepts in ecology—at what is now Indiana               special needs and potential of “blue” (ocean) parks
Dunes National Park (Cowles, 1899). Experiments con-          (Beissinger & Ackerly, 2017). Historic support for and
ducted by Dan Simberloff at Everglades National Park          interest in scientific research within NPS has ranged from
in the 1960s tested MacArthur and Wilson's island bio-        encouraging to hostile (reviewed in Parsons, 2004). The
geography models and remain widely influential in             establishment of Research Learning Centers starting in
ecology and conservation biology (Simberloff, 1969;           2001 publicly signaled that the agency welcomed park-
Simberloff & Wilson, 1969). In the 1970s, Rowland             based research by non-NPS scholars, recognized that NPS
Tabor and Wallace Cady showed the relationship                relies on science to inform management and outreach
between topography, rock distribution, and subduction         activities, and stated a new vision of “parks for science
zones in Olympic Mountains National Park at a time            and science for parks” (NPS, 2016). Presidential adminis-
when the idea of plate tectonics was relatively new           trations and Congressional mandates may affect access to
(Tabor & Cady, 1978). Monica Turner's research on             parks and support for research, yet U.S. national parks
wildfire in Yellowstone National Park in the 1990s was        contain unparalleled natural, cultural, and historic
among the first to examine ecosystems over large              resources and therefore remain extraordinary places to
extents and is seminal to the field of landscape ecology      conduct research.
(Turner, Hargrove, Gardner, & Romme, 1994). Also at               Over a century ago, Grinnell and Storer (1916)
Yellowstone in the 1990s, Robert Smith and Lawrence           warned that the national parks would “probably be the
Braile proposed that the Snake River Plain is part of a       only areas remaining unspoiled for scientific study”. As
continuum related to the North American plate mov-            land use intensifies and climate change continues,
ing over a fixed mantle hotspot, and that volcanism at        U.S. national parks may be more important than ever for
Yellowstone is related to the passage of the continent        both basic and applied research. However, a nationwide
over a conduit of ascending magma (Smith &                    synthesis of trends in national park research, and poten-
Braile, 1994). This hypothesis has many derivative con-       tial biases in that research, has never existed, despite the
sequences for the topography, geologic hazards, min-          need for such a synthesis to assess needs and guide future
eral resource distribution, and even the flora and fauna      decisions. In this study, we asked three questions to
of the Yellowstone region. In the 2000s, community            understand recent research trends in U.S. national parks,
science BioBlitz events in national parks, wherein fam-       using nearly 7,000 peer-reviewed research articles publi-
ilies, students, and the public join National Park Ser-       shed since 1970: (a) When and where has scholarly
vice (NPS) staff to conduct intensive field studies, have     research taken place in national parks? (b) Which aca-
informed and inspired engagement, outreach, and               demic disciplines and sub-fields are most and least repre-
inventory methods worldwide (Francis, Easterday,              sented? and (c) Who is funding the research? This first
Scheckeland, & Beissinger, 2017).                             nationwide synthesis of scholarly trends and biases in
    Despite these important discoveries and scientific        U.S. national park research can inform the scope and
advances, there has not been a systematic review of           direction of the second century of park science and
research conducted in national parks. Independent             management.
VUKOMANOVIC AND RANDALL                                                                                              3 of 15

2 | METHODS                                                    number of publications in each park by the number and
                                                               area of parks in each ecoregion: that is, for each park, we
We used the Web of Science database to collect peer-           divided its number of publications by the number of
reviewed journal articles regarding 59 national parks          parks in the ecoregion, then multiplied that value by the
published between 1970 and 2018. There are very few            total park area within the ecoregion. The ecoregion rep-
indexed publications pre-1970 and about half of the            resentativeness (Ecoregion Rep) index normalized publi-
national parks were established after 1970, which pro-         cations by ecoregion area: that is, for each ecoregion, we
vides a suitable cutoff to examine recent trends. We           divided its number of publications by ecoregion area.
excluded three very recently established parks—Gateway
Arch National Park (2018), Indiana Dunes National Park
(2019), and White Sands National Park (2019)—because           3 | RESULTS
any research conducted at these locations is unlikely to
be linked to the name of the national park. In addition to     Our Web of Science search for research conducted in
the national parks, the NPS manages another 360 units          U.S. national parks found 6,965 peer-reviewed, published
across 18 other designations, including national historical    articles between 1970 and 2018. The rate of publication
parks and battlefields, national seashores, and national       increased slowly between 1970 and 1990, when there was
recreation areas. Here we turn our attention to desig-         a marked increase in the output of scholarly work. The
nated national parks and the “park research” discussed         highest number of publications (418) occurred in 2013,
herein refers explicitly to research conducted at national     followed by a steady decline through 2018 (296 publica-
parks rather than the national parks system overall.           tions; Figure 1). Five of the 59 national parks accounted
    We used the name of each park as the search term           for 60% of the 6,965 studies. Yellowstone accounted for
and restricted the search to journal articles published in     36.2% of studies (Figure 1), followed by Everglades
English as of December 2018. We manually evaluated             (6.8%), Great Smoky Mountains (6.2%), Glacier (5.6%),
each article found and excluded articles that did not          and Yosemite (5.3%; Figure 1, Table A2). The “big five”
explicitly study a national park (e.g., park name only         parks were all established prior to 1950 and in general,
appeared in references cited). To assess disciplinary          more peer-reviewed research has been conducted at older
trends, we noted the academic sub-field associated with        parks (Table A2). However, some parks established
each article in the Web of Science database. We aggre-         >100 years ago, such as Crater Lake, Mesa Verde, and
gated the sub-field of each article to its broader academic    Wind Cave have relatively few publications, while others
field and discipline, as defined by the National Acade-        established within the past 50 years, such as Can-
mies of Sciences, Engineering, and Medicine                    yonlands, have amassed a higher number of publications
(NASEM, 2006; Table A1). Next, we manually sorted into         (Table A2).
categories the sources of funding identified by Web of             Across academic disciplines, the life sciences domi-
Science for each article. We first noted whether the origin    nated national parks research (60% of total publications;
was U.S. domestic or international, and we categorized         Figure 1), followed by the physical sciences and mathe-
the source of domestic funding as one of seven types: fed-     matics (25%), social and behavioral sciences (8%), engi-
eral agency (e.g., United States Geological Survey), fed-      neering (3%), arts and humanities (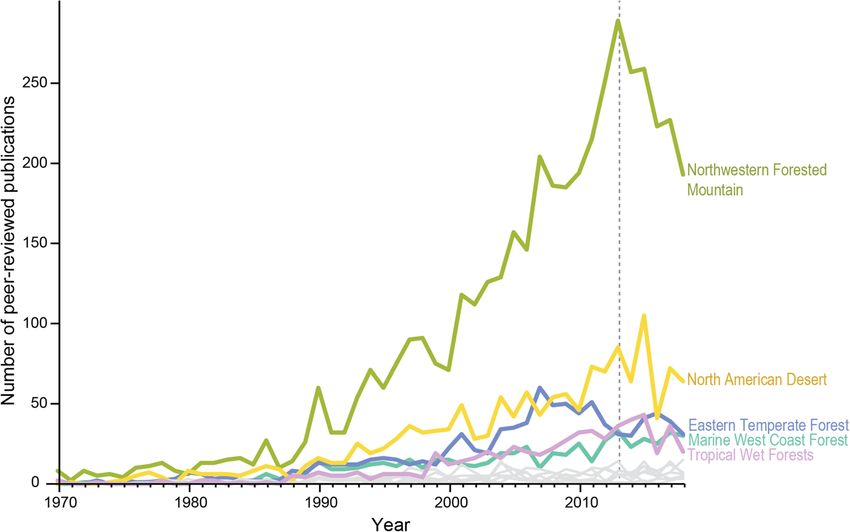
4 of 15                                                                                        VUKOMANOVIC AND RANDALL

                                                                                           F I G U R E 1 Annual
                                                                                           publications reporting research
                                                                                           conducted in U.S. national parks
                                                                                           (1970–2018). Filled areas in the
                                                                                           graph indicate the number of
                                                                                           publications for the five most
                                                                                           researched national parks
                                                                                           (Yellowstone, Everglades, Great
                                                                                           Smoky Mountains, Glacier, and
                                                                                           Yosemite) and all other parks.
                                                                                           Stacked areas sum to the total
                                                                                           number of publications per year
                                                                                           (max = 418 in 2013). Starting in
                                                                                           1990 (denoted by *), there was a
                                                                                           marked increase in the output of
                                                                                           scholarly work. The pie chart
                                                                                           indicates the representation of
                                                                                           academic sub-fields and
                                                                                           disciplines across all 6,965
                                                                                           studies

    Over half of the studies (51%) were conducted in        are very well represented in the literature, followed by
Northwestern Forested Mountains parks, followed by          Northwestern Forested Mountains, and Marine West
North American Deserts (17%), Eastern Temperate Forest      Coast Forest. The Great Plains, Tundra, Eastern Temper-
(10%), Tropical Wet Forest (7%), and Marine West Coast      ate Forests, and Taiga have very few publications relative
Forest (6%). Two ecoregions accounted for less than 1%      to their area (Table 1).
of the studies (Southern Semi-Arid Highlands and Great          Our Web of Science search for research funding in
Plains; Figure 2; Table 1). Publication rates in the most   U.S. national parks found 6,236 unique instances of
studied ecoregions generally increased through time, but    funding; where a study listed more than one source of
started to decline or experienced no growth since approx-   funding, each was counted as a funding instance. In total,
imately 2013 (Figure A1).                                   44% (3,040) of papers listed at least one funder through
    Our measure of park representativeness, which nor-      Web of Science; 31% listed multiple funders (71% of
malizes each park's publications by the number and area     papers that reported funders). Of the 6,236 unique
of parks in each ecoregion, shows that some parks have      funding instances identified, 75% came from domestic
been studied disproportionately more than others            funders and 25% came from international organizations,
(Table A2). For example, Everglades (Tropical Wet For-      institutions, or government agencies (Figure 3). Among
ests) is extremely well represented in the literature,      domestic funders, federal agencies (e.g., US Forest Ser-
followed by Channel Islands (Mediterranean California),     vice, US Fish and Wildlife, NPS) accounted for 26% of
Great Smoky Mountains (Eastern Temperate Forests),          funding instances, while federal grants (e.g., National Sci-
and Guadalupe Mountains (Temperate Sierras). Parks          ence Foundation) accounted for 8.4%. Universities and
with the lowest number of publications relative to the      research institutions associated with universities repre-
number and area of parks in their ecoregion include         sented 17.5% of funding instances. Combined, non-profit
Black Canyon of the Gunison (North American Desert),        organizations contributed to 22% of domestic funding
North Cascades (Northwestern Forested Mountains), and       instances, and of those instances, 21% came from park-
Lake Clark (Marine West Coast Forest). Our measure of       associated non-profits (e.g., Friends of Saguaro National
regional representativeness, which normalizes publica-      Park). We were unable to categorize 93 (1.5%) funding
tions by ecoregion area, shows that Tropical Wet Forests    instances with the information provided.
VUKOMANOVIC AND RANDALL 5 of 15
F I G U R E 2 Research disciplinary focus by ecoregion (EPA Level 1). Pie charts indicate the four most commonly studied academic fields
(five if there was a tie) plus all others (gray). Numbers in parentheses indicate the (1) total number of studies in the ecoregion and (2) the
ecoregion representativeness value. Map shading indicates ecoregion representativeness (Ecoregion Rep), an index that normalizes
publications by ecoregion area. NB: U.S. EPA ecoregions cover the continental U.S., excluding Hawaii, American Samoa, and the U.S. Virgin
Islands
4 | DISCUSSION most of the science capacity within NPS (Beissinger &
Ackerly, 2017).
We found that research in national parks increased rap- Our analysis also revealed that studies in ecology and
idly during the 1990s and 2000s, a trend that broadly mir- evolutionary biology contribute the most scholarly
rors some research policy changes and priorities within research related to national parks. Given NPS objectives
NPS. In 1992, for example, the National Research Coun- and programs (such as I&M) and the fact that national
cil called for an explicit research mission within NPS and parks are large, relatively intact natural areas, this find-
recommended the appointment of a chief scientist ing is not surprising. The possibility exists, however, that
(NRC, 1992). Cooperative Ecosystem Studies Units research in the social sciences and humanities at national
(CESUs) began forming in 1999 to expand science in parks may expand. The NPS Social Science Division and
national parks by leveraging a large network of university the Climate Change Response Program were both
collaborators, and in 2000 NPS established the Inventory established in 2010, signaling new agency recognition of
and Monitoring (I&M) Program for long-term ecological the importance of human dimensions. Among
monitoring within national park sites. With programs at researchers, there is also growing interest in studying
280 parks (NPS I&M, 2020), the I&M Program represents ecosystem services, the relationships between people and6 of 15 VUKOMANOVIC AND RANDALL
TABLE 1 Bioregional characteristics of publications reporting research in U.S. national parks 1970–2018
Number of Number of Park Total Ecoregion
papersa parks area (km2) area (km2) Repb
Eastern Temperate Forests 866 8 3,552.8 2,521,769.2 0.34
Great Plains 80 3 1,273.7 2,239,327.8 0.04
Marine West Coast Forest 534 10 60,943.4 383,771.7 1.39
Mediterranean California 158 2 517.2 159,962.2 0.99
North American Deserts 1,431 22 30,021.1 1,411,982.5 1.01
Northern Forests 130 2 1,486.9 365,637.2 0.36
Northwestern Forested 4,413 21 83,601.8 1,109,527.4 3.98
Mountains
Southern Semi-Arid Highlands 22 1 171.4 39,649.7 0.55
Taiga 143 4 10,288.3 416,238.4 0.34
Temperate Sierras 212 3 706.8 110,909.7 1.91
Tropical Wet Forests 575 3 3,821.2 22,533.4 25.52
Tundra 108 5 41,497.5 521,324.4 0.21
a
Where park boundaries overlapped two ecoregions, publications were attributed to both.
b
Ecoregion Representativeness (Ecoregion Rep) is calculated as the number of papers per ecoregion divided by total ecoregion area. Ecoregion Rep numbers
have been multiplied by 1,000 for readability.
nature, and engaging people in parks (DeFries, 2017),
which may shape future national parks research. These
disciplinary trends may differ across other National Park
holdings. For example, historical and archaeological
research may be much more prevalent at National His-
toric Parks and National Historic Battlefields than ecolog-
ical studies. Future work that examines research across
the NPS's 423 holdings could shed additional light on
both research trends overall and on the impacts of NPS-
wide programs and research initiatives. Both disciplinary
trends and the overall number of publications may be
affected by the proliferation of new journals and
increased opportunities for researchers to publish over
time. The increase in opportunities to share national
parks research makes the decline in peer-reviewed publi-
cations since 2013 even more noteworthy.
One potential limitation of our analysis is the use of
Web of Science disciplinary designations to categorize
research focus. These disciplinary designations are based
on the field and subfield to which each peer-reviewed
journal is assigned. As scholarship grows increasingly F I G U R E 3 Sources of funding that supported research in U.S.
inter- and transdisciplinary and field/sub-field designa- national parks (1970–2018). Where multiple sources of funding
tions shift, split, and merge, these designations may not were reported in a publication, all were included as unique funding
instances. Only funders listed through the Web of Science are
always represent the “most correct” taxonomy. For exam-
included
ple, in the life sciences, some designations are by biologi-
cal taxa (e.g., mycology, ornithology), while others are
categorized by approach or application (e.g., biological Engineering, and Medicine (NASEM, 2006) under “social
conservation, horticulture). Categorizing the interdisci- and behavioral studies” and here accounts for 56% of
plinary field of geography is also problematic; geography publications within that academic discipline, but we
is classified by the National Academies of Sciences, noted a considerable number of physical geographyVUKOMANOVIC AND RANDALL 7 of 15 papers that might be better classified within the nearby Great Smoky Mountains National Park. For some geosciences. By using the Web of Science designations for researchers, longitudinal research questions, and the geography, we may have overestimated research in the need for repeat measurements, make it necessary to social and behavioral sciences (8% of publications). If so, return to the same park (e.g., Turner, Romme, Gardner, & the dearth of national park research in the social and Hargrove, 1997). The differing research outputs among behavioral sciences becomes even more stark and may parks suggest that a complex suite of drivers influence more closely approximate the proportion of research in national parks research, even as large numbers of the arts and humanities (
8 of 15                                                                                           VUKOMANOVIC AND RANDALL

nonprofits, for example, are likely smaller than those         web-based “one-stop” for data and information related to
from NSF or private companies. A deeper exploration of         NPS natural and cultural resources and houses docu-
funding levels is necessary to support efforts that aim to     ments, reports, publications, data sets, and park species
increase research productivity by strategically leveraging     lists. We found that the main repository for the agency is
different funding sources or targeting new funders.            little used and infrequently updated. For example, for
     We found that 25% of funding instances were from          Congaree National Park, only eight peer-reviewed publi-
international sources (universities, organizations, and        cations that met our search criteria were uploaded to
government agencies), indicating considerable interna-         IRMA (with the most recent published in 1997), but Web
tional interest in research opportunities in U.S. national     of Science yielded 18 publications for Congaree. By work-
parks. This interest exemplifies the idea that national        ing directly with the Chief of Resource Stewardship and
parks are the world's living laboratories. Overall, interna-   Science at Congaree and examining the park archives, we
tional research productivity is growing, with China in         were able to identify 48 peer-reviewed publications that
particular showing exponential growth in research pro-         stem from work at Congaree. Some of these articles did
ductivity (Leydesdorff & Wagner, 2009). While the              not appear in any database search, but did fit our criteria
U.S. leads in terms of total spending, South Korea, Japan,     (peer-reviewed publication of work conducted at the
Finland, Switzerland, Austria, Sweden, Denmark, and            park). Comprehensively surveying park research at Con-
Germany devote a larger share of their gross domestic          garee required the assistance and input of someone
product (GDP) to research and development; these coun-         deeply involved in that park, but this level of effort is not
tries also all have higher numbers of researchers per          currently sustainable for NPS staff or for researchers
capita than the United States (UNESCO UIS, 2020). The          seeking park-related information. Research conducted in
extent to which funding and research capacity from these       U.S. national parks is valued worldwide, and maintaining
nations will extend to the science done at U.S. national       a comprehensive record of that work is in the world's col-
parks is unknown. What NPS, university consortia, and          lective interest. We call on NPS leadership to provide the
U.S. government agencies do to either promote or hinder        time and resources needed for park staff to collect, orga-
international research collaborations could impact the         nize, and share the scholarly research conducted in their
next chapter of national parks research.                       parks. Chief Resource Officers (or equivalent) at each
     Information on funding instances to-date may also         park are likely best suited to monitor and update the
offer a window to future opportunities. For example, we        scholarly effort related to their parks, especially if that
found that non-profit organizations contribute 16% of all      research is connected to a park-issued research permit,
funding instances, suggesting ample room for new part-         and we therefore suggest that they be supported to make
nerships. This information could be used by non-profits        inventories of park research publicly available. These
to consider pivoting efforts and resource allocation to        efforts could also largely clear up the primary concerns
take advantage of the charismatic draw of natural parks        with the use of non-peer-reviewed publications (the “gray
to donors. Park-associated non-profits in particular could     literature”) - quality, discovery, access and archiving
look at their contributions to national park research (3%      (Corlett, 2011), allowing for more comprehensive
of all instances) and decide to amplify fundraising efforts    future work.
or to consider targeting their contributions to disciplines         Our analysis illustrates several key points. First, fol-
in the social sciences or humanities for which there is        lowing a marked increase in the output of scholarly work
less peer-reviewed literature. Similarly, those sitting on     starting in 1990, there has been a steady decline since
the research or philanthropic boards of private compa-         2013. The majority of publications come from five large,
nies (3% of funding instances) could see untapped oppor-       iconic parks and focus on ecology and other life sciences.
tunities to boost their image by supporting research in        Second, regional representativeness is very skewed, with
national parks. Funder information could bring to light        some large, heterogeneous ecoregions having only a
potential partnerships and collaborations where interests      handful of national-park associated publications. And
overlap. Our open-source data repository (github.com/          third, even as U.S. funding for basic research stagnates,
ncsu-landchangelab/research-trends-national-parks)             support for applied research and interest from interna-
allows those interested to take a closer look at the organi-   tional funders offers new opportunities. A comprehensive
zations funding research at specific parks.                    understanding of disciplinary, regional, and funding
     Future research and needs assessments will also bene-     trends in national parks research is essential to support
fit from improved tracking and archiving of national park      future work, address research gaps and biases, and deter-
research studies. Prior to performing our review using         mine funding priorities. As land use intensifies and cli-
Web of Science, we explored NPS's Integrated Resource          mate change continues, Grinnell & Storer's, 1916
Management Applications (IRMA) portal, which is a              warning that national parks may be the only unspoiled
VUKOMANOVIC AND RANDALL 9 of 15
areas remaining for scientific study looms large. This DeFries, R. (2017). The tangled web of people, landscapes, and
analysis can support NPS personnel, researchers, and protected areas. In Science, conservation, and National Parks
other decision-makers as they assess needs and guide the (pp. 227–246). Chicago: The University of Chicago Press.
Floyd, M. F. (2001). Managing national parks in a multicultural
direction of the second century of park science and
society: Searching for common ground. The George Wright
management. Forum, 18(3), 41–51.
Francis, J., Easterday, K., Scheckeland, K., & S. Beissinger S.R.
A C K N O WL E D G M E N T S (2017). The world is a park: Using citizen science to engage
This research was supported by the National Park Service people in parks and build the next century of global stewards.
(award P17AC01439). We thank S. Jones for assistance In Science, conservation, and National Parks (pp. 275-293). Chi-
with preparation of figures and L. Smart, N. Inglis, cago: The University of Chicago Press.
Gonzalez, P., Neilson, R. P., Lenihan, J. M., & Drapek, R. J. (2010).
D. Agostini, and A. Yoshizumi for helpful feedback on
Global patterns in the vulnerability of ecosystems to vegetation
earlier versions of this manuscript. We thank
shifts due to climate change. Global Ecology and Biogeography,
K. Wegmann for his input on impactful national parks 19(6), 755–768.
publications in the geosciences and L. Larson, Grinnell, J., & Storer, T. I. (1916). Animal life as an asset of national
E. Seekamp, and Y.-F. Leung for sharing their perspec- parks. Science, 44(1133), 375–380.
tives on impactful social science research in national Haefele, M., Loomis, J., & Bilmes, L. (2016). Total economic value
parks. The manuscript was improved by constructive of US National Park Service estimated to be $92 billion:
comments and suggestions from M. Skrip. Implications for policy. The George Wright Forum, 33(3),
335–345.
Leaman, G. (2013). Co-managing parks with aboriginal communi-
CONFLICT OF INTEREST
ties: Improving outcomes for conservation and cultural heri-
The authors declare no conflict of interest. tage. The George Wright Forum, 30(3), 287–294.
Leopold, A. S. (1963). Wildlife management in the national parks.
A U T H O R C ON T R I B U T I O NS Washington, DC: U.S. National Park Service.
Jelena Vukomanovic conceived the study. Jelena Leydesdorff, L., & Wagner, C. (2009). Macro-level indicators of the
Vukomanovic and Joshua Randall contributed to study relations between research funding and research output. Jour-
design. Joshua Randall performed the analysis and dra- nal of Informetrics, 3(4), 353–362.
fted figures. Jelena Vukomanovic wrote the manuscript. Mech, L. D., & Barber, S. M. (2002). A critique of wildlife radio-
tracking and its use in National Parks: A report to the National
Park Service. Jamestown, ND: U.S. Geological Survey.
DATA AVAILABILITY STATEMENT
Mervis, J. (2017). Data check: US government share of basic research
The data that support the findings of this study are funding falls below 50%. Science, 355(6329), 1005.
openly available at github.com/ncsu-landchangelab/ Mongeon, P., & Paul-Hus, A. (2016). The journal coverage of web of
research-trends-national-parks. science and Scopus: A comparative analysis. Scientometrics, 106
(1), 213–228.
E TH IC S ST A T EME N T Nancarrow, N. (2006). Glacial Run-off [quilt]. Retrieved from
No ethics approval was required for this research. https://www.nps.gov/articles/fabric-art.htm
National Academies of Sciences, Engineering, and Medicine
[NASEM]. (2006) Retrieved from https://sites.
ORCID
nationalacademies.org/PGA/Resdoc/PGA_044522
Jelena Vukomanovic https://orcid.org/0000-0001-6477- National Center for Science and Engineering Statistics [NCSES].
6551 (2019). National Patterns of R&D resources: 2017–18 data
Joshua Randall https://orcid.org/0000-0002-4039-7255 update. Alexandria, VA: National Science Foundation. 20–307.
Retrieved from https://ncses.nsf.gov/pubs/nsf20307
R EF E RE N C E S National Park Service [NPS]. (2016). Research Learning Centers
Beissinger, S. R., & Ackerly, D. D. (2017). Science, parks, and con- (RLC). Retrieved from https://www.nps.gov/rlc/index.htm
servation in a rapidly changing world. In Science, conservation, National Park Service Inventory and Monitoring [NPS I&M].
and National Parks (pp. 363–387). Chicago: The University of (2020). Retrieved from https://www.nps.gov/im/index.htm
Chicago Press. National Research Council (NRC). (1992). Science and the national
Bishop, S., Burch, W., Cahn, R., Cahill, R., Clark, T., Dean, R., … parks. Washington, DC: National Academies Press.
Wyatt, V. (1989). National parks: From vignettes to a global view. Palomo, I., Martín-López, B., Potschin, M., Haines-Young, R., &
Ithaca: National Parks and Conservation Association. Montes, C. (2013). National Parks, buffer zones and surround-
Corlett, R. T. (2011). Trouble with the gray literature. Biotropica, 43 ing lands: Mapping ecosystem service flows. Ecosystem Services,
(1), 3–5. 4, 104–116.
Cowles, H. C. (1899). The ecological relations of the vegetation on the Parsons, D. J. (2004). Supporting basic ecological research in US
sand dunes of Lake Michigan. Chicago: The University of Chi- National Parks: Challenges and opportunities. Ecological Appli-
cago Press. cations, 14, 5–13.10 of 15 VUKOMANOVIC AND RANDALL
Postel, S. L., & Thompson, B. H., Jr. (2005). Watershed protection: Turner, M. G., Romme, W. H., Gardner, R. H., & Hargrove, W. W.
Capturing the benefits of nature's water supply services. Natu- (1997). Effects of fire size and pattern on early succession in
ral Resources Forum, 29(2), 98–108. Blackwell Publishing. Yellowstone National Park. Ecological Monographs, 67(4),
Rehfeldt, G. E., Ferguson, D. E., & Crookston, N. L. (2009). Aspen, 411–433.
climate, and sudden decline in Western USA. Forest Ecology UNESCO Institute for Statistics [UIS]. (2020). Retrieved from
and Management, 258(11), 2353–2364. http://data.uis.unesco.org/Index.aspx?DataSetCode=SCN_DS&
Roland, C. A., Stehn, S. E., Schmidt, J. H., & Houseman, B. (2016). lang=en
Proliferating poplars: The leading edge of landscape change in US EPA. (2016). Ecoregions of North America. Retrieved from
an Alaskan subalpine chronosequence. Ecosphere, 7(7), 1–30. https://www.epa.gov/eco-research/ecoregions-north-america
Simberloff, D. S. (1969). Experimental zoogeography of islands: A Vaughn, N., & Lovett, J. (aka Nuisance and Cangaroo). (2019).
model for insular colonization. Ecology, 50(2), 296–314. Defenders of Florissant [song]. Retrieved from https://www.nps.
Simberloff, D. S., & Wilson, E. O. (1969). Experimental zoogeogra- gov/articles/hip-hop-camp-at-florissant-fossil-beds-national-
phy of islands: The colonization of empty islands. Ecology, 50 monument.htm
(2), 278–296. Watson, J. E., Dudley, N., Segan, D. B., & Hockings, M. (2014). The
Smith, R. B., & Braile, L. W. (1994). The Yellowstone hotspot. Jour- performance and potential of protected areas. Nature, 515
nal of Volcanology and Geothermal Research, 61, 121–187. (7525), 67–73.
Soares-Filho, B., Moutinho, P., Nepstad, D., Anderson, A., Westerling, A. L., Turner, M. G., Smithwick, E. A.,
Rodrigues, H., Garcia, R., … Silvestrini, R. (2010). Role of Brazilian Romme, W. H., & Ryan, M. G. (2011). Continued warming
Amazon protected areas in climate change mitigation. Proceedings could transform Greater Yellowstone fire regimes by mid-21st
of the National Academy of Sciences, 107(24), 10821–10826. century. Proceedings of the National Academy of Sciences, 108
Tabor, R. W., & Cady, W. M. (1978). The structure of the Olympic (32), 13165–13170.
Mountains, Washington: Analysis of a subduction zone (Vol.
1033). Washington, DC: US Govt. Print. Off.
Thomas, C. D., Hare, P. G., Reuther, J. D., Rogers, J. S.,
How to cite this article: Vukomanovic J,
Cooper, H. K., & Dixon, E. J. (2020). Yukon first nation use of
Randall J. Research trends in U.S. national parks,
copper for end-blades on hunting arrows. Journal of Glacial
Archaeology, 2016, 109–131. the world's “living laboratories”. Conservation
Turner, M. G., Hargrove, W. W., Gardner, R. H., & Romme, W. H. Science and Practice. 2021;e414. https://doi.org/10.
(1994). Effects of fire on landscape heterogeneity in Yellowstone 1111/csp2.414
National Park, Wyoming. Journal of Vegetation Science, 5, 731–742.VUKOMANOVIC AND RANDALL 11 of 15 A P P EN D I X F I G U R E A 1 Publications by ecoregion over time. The five ecoregions with the most peer-reviewed publications (Northwestern Forested Mountains, North American Deserts, Eastern Temperate Forests, Marine West Coast Forest, and Tropical Wet Forests) are highlighted F I G U R E A 2 National Park Service Natural Resource Reports (total = 1,910) and Cultural Landscape Reports (total = 316) published from 1990 to 2010. Source: NPS Integrated Resource Management Applications (IRMA) Data Store
12 of 15                                                                                                          VUKOMANOVIC AND RANDALL

T A B L E A 1 The disciplinary focus of peer-reviewed journal articles containing national park research. The academic sub-fields (right
column) were designated in the Web of Science database. We aggregated the sub-field of each article to its broader academic field (middle
column) and discipline (left column), as defined by the National Academies of Sciences, Engineering, and Medicine (NASEM, 2006).
Numbers in brackets indicate tallies

  Life Sciences               Biochemistry, Biophysics, and Structural                Biochemical Research Methods (4); Biochemistry &
    (4,147)                     Biology (85)                                            Molecular Biology (75); Biophysics (6)
                              Cell and Developmental Biology (3)                      Anatomy & Morphology (3)
                              Ecology and Evolutionary Biology (2,166)                Evolutionary Biology (16); Ecology (1389);
                                                                                        Mycology (51); Limnology (26); Biodiversity
                                                                                        Conservation (580); Marine & Freshwater
                                                                                        Biology (104)
                              Public Health (70)                                      Medicine, General & Internal (7); Medicine, Legal
                                                                                       (1); Emergency Medicine (4); Public,
                                                                                       Environmental & Occupational Health (57);
                                                                                       Reproductive Biology (1)
                              Genetics and Genomics (9)                               Genetics & Heredity (8); Mathematical &
                                                                                       Computational Biology (1)
                              Immunology and Infectious Disease (16)                  Parasitology (7); Immunology (9)
                              Biology/Integrated Biology/ Integrated                  Biology (103)
                                Biomedical Sciences (103)
                              Microbiology (320)                                      Microbiology (171); Virology (13); Biotechnology &
                                                                                       Applied Microbiology (136)
                              Pharmacology, Toxicology and Environmental              Pharmacology & Pharmacy (1)
                                Health (1)
                              Physiology (3)                                          Endocrinology & Metabolism (1); Physiology (2)
                              Animal Sciences (503)                                   Fisheries (89); Zoology (281); Agriculture, Dairy &
                                                                                        Animal Science (21); Veterinary Sciences (46);
                                                                                        Ornithology (66)
                              Entomology (134)                                        Entomology (134)
                              Forestry and Forest Sciences (346)                      Forestry (346)
                              Nutrition (2)                                           Nutrition & Dietetics (2)
                              Plant Sciences (386)                                    Agronomy (32); Agricultural Engineering (8);
                                                                                       Horticulture (1); Plant Sciences (332);
                                                                                       Agriculture, Multidisciplinary (13)
  Physical Sciences           Statistics and Probability, Mathematics, and            Mathematics (1); Mathematics, Applied (2);
    & Mathematics               Applied Mathematics (5)                                Statistics & Probability (2)
    (1,766)                   Chemistry (31)                                          Chemistry, Analytical (14); Chemistry, Inorganic &
                                                                                       Nuclear (4); Chemistry, Multidisciplinary (10);
                                                                                       Chemistry, Physical (3)
                              Computer Sciences (51)                                  Computer Science, Hardware & Architecture (1);
                                                                                       Computer Science, Information Systems (3);
                                                                                       Computer Science, Interdisciplinary Applications
                                                                                       (9); Computer Science, Software Engineering (1);
                                                                                       Robotics (2); Remote Sensing (35)
                              Earth Sciences (1,555)                                  Geology (124); Mineralogy (2); Geosciences,
                                                                                       Multidisciplinary (353); Paleontology (35); Water
                                                                                       Resources (34); Soil Science (48); Geochemistry &
                                                                                       Geophysics (215); Environmental Sciences (744)
                              Oceanography and Atmospheric Sciences and               Oceanography (7); Meteorology & Atmospheric
                               Meteorology (88)                                        Sciences (81)
                              Physics (36)                                            Physics, Condensed Matter (1); Physics, Fluids &
                                                                                        Plasmas (4); Optics (4); Astronomy &
                                                                                        Astrophysics (20); Acoustics (5); Microscopy (2)
VUKOMANOVIC AND RANDALL 13 of 15
TABLE A1 (Continued)
Engineering (215) Chemical Engineering (17) Engineering, Chemical (7); Engineering, Petroleum
(1); Energy & Fuels (9)
Civil and Environmental Engineering (191) Engineering, Civil (56); Engineering,
Environmental (107); Engineering, Geological
(9); Architecture (14); Green & Sustainable
Science & Technology (5)
Electrical and Computer Engineering (4) Engineering, Electrical & Electronic (4)
Materials Science and Engineering (1) Materials Science, Characterization & Testing (1)
Operations Research, Systems Engineering Engineering, Industrial (2)
and Industrial Engineering (2)
Social & Hospitality, Leisure, Sport & Tourism (67) Hospitality, Leisure, Sport & Tourism (67)
Behavioral Behavioral Sciences (42) Behavioral Sciences (42)
Sciences (561)
Anthropology (40) Anthropology (25); Archaeology (15)
Communication (4) Communication (4)
Economics (13) Economics (11); Agricultural Economics & Policy
(2)
Geography (316) Geography (53); Geography, Physical (262); Area
Studies (1)
Political Science (4) Political Science (4)
Public Affairs, Public Policy and Public Public Administration (3); Planning &
Administration (13) Development (4); Management (2); Law (1);
Business (3)
Psychology (15) Psychology, Biological (9); Psychology,
Experimental (5); Psychology, Social (1);
Sociology (47) Sociology (2); Demography (1); Environmental
Studies (43); Social Issues (1)
Arts & History (53) History (52); History & Philosophy Of Science (1)
Humanities Philosophy (4) Philosophy (1); Ethics (3);
(61)
Religion (1) Religion (1)
Performing Arts (3) Music (2); Theater (1)
Other (214) Education (11) Education & Educational Research (10); Education,
Scientific Disciplines (1)
Multidisciplinary (203) Multidisciplinary Sciences (183); Social Sciences,
Interdisciplinary (7); Humanities,
Multidisciplinary (13)14 of 15 VUKOMANOVIC AND RANDALL
TABLE A2 Characteristics of U.S. national parks that have been the location of peer-reviewed published research 1970–2018
Number R1
or
Number Area of Annual R2 Inst.b
of Park park Year visitors w/in
National Park papers Repa EPA Ecoregion I (km2) founded (2017) 350 km
Acadia 116 4.08 Eastern Temperate Forest 192.8 1919 3,509 15
Arches 41 0.06 North American Desert 309.0 1971 1,539 2
Badlands 27 7.07 Great Plains 988.6 1978 1,054 1
Big Bend 164 0.25 North American Desert 3,242.2 1944 440 0
Biscayne 66 5.76 Tropical Wet Forests 699.8 1980 447 7
Black Canyon of the 7 0.01 North American Desert 123.0 1999 307 7
Gunnison
Bryce canyon 22 0.03 North American Desert 145.0 1928 2,572 4
Canyonlands 103 0.16 North American Desert 1,366.2 1964 742 2
Capitol Reef 19 0.03 North American Desert 979.0 1971 1,150 3
Carlsbad Caverns 21 9.90 Temperate Sierras 189.3 1930 520 3
Channel Islands 31 29.97 Mediterranean California 1,009.1 1980 384 10
Congaree 18 0.63 Eastern Temperate Forest 89.8 2003 160 15
Crater Lake 33 0.02 Northwestern Forested 741.5 1902 712 3
Mountain
Cuyahoga Valley 9 0.32 Eastern Temperate Forest 133.5 2000 2,227 22
Death Valley 50 0.08 North American Desert 13,759.3 1994 1,295 13
Denali 127 0.21 Marine West Coast Forest 24,398.2 1917 643 1
Dry Tortugas 34 2.97 Tropical Wet Forests 261.8 1992 54 4
Everglades 475 41.44 Tropical Wet Forests 6,105.0 1947 1,019 7
Gates of the Arctic 13 0.06 Tundra 34,398.3 1980 11 1
Glacier 390 0.22 Northwestern Forested 4,101.8 1910 3,306 4
Mountain
Glacier Bay 67 0.11 Marine West Coast Forest 13,274.5 1980 547 0
Grand Canyon 169 0.26 North American Desert 4,926.7 1919 6,254 3
Grand Teton 91 0.05 Northwestern Forested 1,254.5 1929 3,317 3
Mountain
Great Basin 19 0.03 North American Desert 312.3 1986 168 3
Great Sand Dunes 16 0.02 North American Desert 433.0 2004 487 7
Great Smoky Mountains 434 15.27 Eastern Temperate Forest 2,110.4 1934 11,339 19
Guadalupe Mountains 22 10.38 Temperate Sierras 349.7 1966 225 3
Hot Springs 8 0.28 Eastern Temperate Forest 22.5 1921 1,562 5
Isle Royale 68 2.39 Eastern temperate Forest 2,314.0 1940 28 1
Joshua Tree 44 0.07 North American Desert 3,213.2 1994 2,854 11
Katmai 78 0.13 Marine West Coast Forest 16,551.6 1980 38 0
Kenai Fjords 15 0.02 Marine West Coast Forest 2,456.4 1980 304 0
Kings Canyon 31 0.02 Northwestern Forested 1869.2 1940 693 15
Mountain
Kobuk Valley 3 0.07 Taiga 7,082.0 1980 16 0
Lake Clark 9 0.01 Marine West Coast Forest 16,369.5 1980 23 0VUKOMANOVIC AND RANDALL 15 of 15
TABLE A2 (Continued)
Number R1
or
Number Area of Annual R2 Inst.b
of Park park Year visitors w/in
National Park papers Repa EPA Ecoregion I (km2) founded (2017) 350 km
Lassen Volcanic 60 0.03 Northwestern Forested 430.5 1916 507 4
Mountain
Mammoth Cave 39 1.37 Eastern Temperate Forest 213.8 1941 588 12
Mesa Verde 27 0.04 North American Desert 210.7 1906 614 1
Mount Rainier 61 0.03 Northwestern Forested 953.5 1899 1,416 6
Mountain
North Cascades 21 0.01 Northwestern Forested 2,768.0 1968 30 4
Mountain
Olympic 131 0.21 Marine West Coast Forest 3,731.2 1938 3,402 3
Petrified Forest 48 0.07 North American Desert 378.5 1962 628 4
Pinnacles 3 2.90 Mediterranean California 107.7 2013 233 7
Redwood 32 0.05 Marine West Coast Forest 438.7 1968 445 3
Rocky Mountain 282 0.16 Northwestern Forested 1,075.5 1915 4,437 7
Mountain
Saguaro 22 0.03 North American Desert 370.1 1994 965 4
Sequoia 93 0.05 Northwestern Forested 1,635.2 1890 1,291 15
Mountain
Shenandoah 125 4.40 Eastern Temperate Forest 794.4 1935 1,459 33
Theodore Roosevelt 26 6.80 Great Plains 285.1 1978 708 0
Voyageurs 62 2.18 Eastern Temperate Forest 882.4 1975 237 3
Wind Cave 32 0.02 Northwestern Forested 114.5 1903 620 1
Mountain
Wrangell—St. Elias 22 0.04 Marine West Coast Forest 53,369.9 1980 68 1
Yellowstone 2,519 1.43 Northwestern Forested 8,991.2 1872 4,117 3
Mountain
Yosemite 372 0.21 Northwestern Forested 3,026.9 1890 4,337 8
Mountain
Zion 46 0.07 North American Desert 593.2 1919 4,505 3
a
Park Representativeness (Park Rep) index normalized the number of publications in each park by the number of area of parks in each ecoregion—that is., for
each park, we divided its number of publications by the number of parks in the ecoregion, then multiplied that value by the total park area within the
ecoregion. Park Rep numbers have been multiplied by 1,000 for readability.
b
R1 (doctoral university with very high research activity) and R2 (doctoral university with high research activity) institutions.You can also read