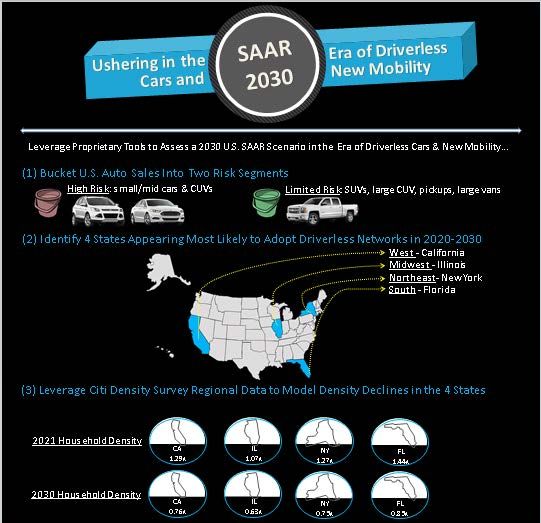
Autonomous Vehicle Networks - From Urban RoboTaxis to AV Subscriptions - 2020 FAV Summit
←
→
Page content transcription
If your browser does not render page correctly, please read the page content below

November 16, 2018

Autonomous Vehicle Networks
From Urban RoboTaxis to AV Subscriptions
 Itay MichaeliAC
 +1 (212) 816 4557
 itay.michaeli@citi.com

See Appendix A-1 for Analyst Certification, Important Disclosures and non-US research analyst disclosures
Citi Research is a division of Citigroup Global Markets Inc. (the "Firm"), which does and seeks to do business with companies covered in its research reports. As a result, investors should be
aware that the Firm may have a conflict of interest that could affect the objectivity of this report. Investors should consider this report as only a single factor in making their investment decision.
Certain products (not inconsistent with the author’s published research) are available only on Citi's portals.
Autonomous Vehicle Networks
A Number of Value Creation Points; Driverless Most Transformative

                                         The Car’s “P&L” Has Much Room for Improvement

                                                                                                              1. Lower Costs, Higher Affordability
      ADAS,                                                                                                   2. Vehicle Data Monetization
    Autonomous                            OTA                  EV                         Data
     & Shared                                                                                                 3. OTA & Related Revenue
                                                                                                              4. Unlocking Time Spent in Car

                                             Who Gets the Lifetime Revenue of a Car?
                                                             $98,025
                                                                    Repair/Maintainence
                                                                           13%

                                                                            EV/AV
                                 Roughly Half                                                    OEM/FinCos
                                                  Insruance Cos.                                   39%
                                 of a Vehicle’s        18%
                                                                       AV
                                 Lifetime Value
                                  Sits Outside
                                     of OEM
                                                                              EV
                                 Ecosystem…

                                                                   Fuel Providers
                                                                        30%

Source: Citi Research, Company Reports

2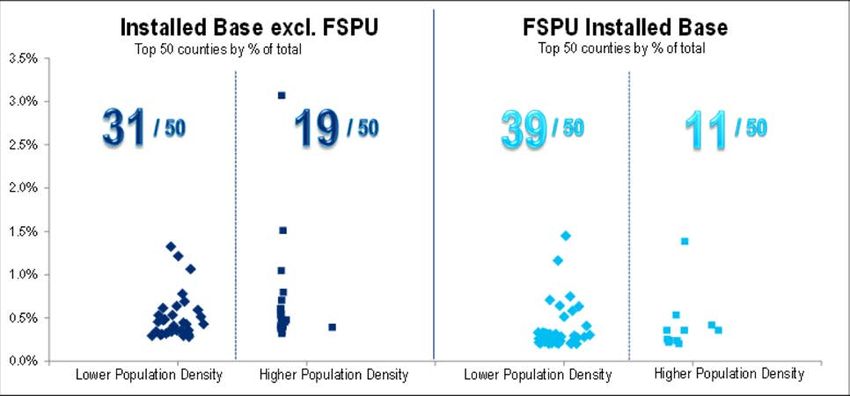
Autonomous Vehicle Networks
    AV Verticals

          “RoboTaxi” Purpose-Built AV Fleet Networks                                               AV Sub Networks                              AVs Non-Network
        RoboTaxis (Urban/Suburban)                RoboTaxis (Urban/Suburban)                      Personal AV Subscriptions                  AV Features on Personal Cars

                                                       +                                                +                                             +
             +                                       19                                               21                                            19
           19                                      20                                               20                                            20
         20

                                                              What Is It?                                    What Is It?                                  What Is It?
                 What Is It?
                                              -   RoboTaxis, but confined to point-to-        -   AV people subscribe to—see next        -   Regular cars sold with level 3-4
-   RoboTaxi in geo-fenced urban/close                                                            few slides for deeper dive                 highway features as options
    suburban zone                                 point fixed routes chosen on density
                                                  and ease (i.e. no unprotected left turns)
                                                                                              -   Network race different than            -   No network effect
-   U.S. TAM = ~$900bln                                                                           RoboTaxis—more about peer-to-peer
                                              -   An easier launch than fully-geo-fenced
                                                  RoboTaxi                                        density, market share gains from new   -   AV cost less than RoboTaxi and less
-   Likely purpose-built AV (EV = edge)                                                           services &compelling economics             than AV Subs
                                              -   Likely purpose-built AV (EV= edge)
-   A network race (speed, load factor)                                                       -   Early mover edge critical
                                              -   AV cost less crucial, players focusing
-   AV cost less crucial (very high),             on network build                            -   The AV costs less than RoboTaxi                         Key Players
    players focusing on network build
                                                              Key Players                                   Key Players                  -   Many automakers pursuing, end-user
                 Key Players                                                                                                                 differentiation could come from HMI
                                              -   Aptiv & partners (Mobileye/Intel),          -   Possibly Tesla (though issues)             (cockpit electronics)
-   Waymo, GM, Rideshare networks                 Rideshare networks
                                                                                              -   We think Ford should pivot here        -   Aptiv & partners (Mobileye/Intel)
-   Not Tesla                                 -   Not Tesla
                                                                                              -   GM could be advantaged too (Maven)     -   Veoneer focused here
-   Ford appears behind                       -   Ford appears behind
                                                                                              -   Aptiv & partners amongst suppliers     -   Other Tier-1s
-   Magna & partners (AV build)               -   Magna & partners (AV build)

            Source: Citi Research Estimates
    3
Autonomous Vehicle Networks
What the AV Path Might Look Like
(1) Early to Launch RoboTaxi AV Network (in complex cities)
Investors Starting to
2019- •Complex city makes it easier to recoup initial very expensive AV costs Focus on This
•Greatest impact on pollution & congestion; very large profit TAM (transformational)
Important Part
•Conquering complex domains = faster scaling later in “easier” domains
(2) Scale Network to Achieve “Escape Velocity”
Early 2020s •Faster urban scaling = more data = better safety track record = competitive edge
•Faster urban scaling = higher load factor (dedicated AVs with partitions)
•Higher load factor = lower user costs = higher usage = larger network effect = moat
(3) Expand Network to Cover Most Urban/Suburban Miles
Early/Mid 2020s •Scaling easier if complex cities are conquered first
•Urban/Suburban miles = 1.5trln (~50% of total U.S. miles driven)
•RoboTaxi cover major cities and surrounding population centers (commuting)
(4) Expand Network to AV Subs (high-volume)
Mid 2020s •AV sensor costs decline enough to sell L4/L5 as a vehicle option (like ADAS)
•Integrate RoboTaxi + OEM App network into broader subscription & P2P network
•More robust network = greater share of these PERS-AVs (part of SAAR)
(5) Achieve Virtuous Loup of an Integrated Mobility Network
Late 2020s+ •Rideshare business becomes more asset light (source AVs from consumers too)
•AV owners make money renting to rideshare, P2P or subscription service
•Non-AV owners can still access network (one App for rideshare, rentals)
Source: Citi Research
4Autonomous Vehicle Networks
Urban RoboTaxi—Urban Mobility Battlegrounds
Cities Become Mobility Battlegrounds
All Years Pro Forma 2019 2020 2030
TAM & Market Assumptions
Total RoboTaxi Installed Base 17,000 34,000 3,000,000
% of Vehicles on Road 0.0% 0.0% 1.2%
% of Vehicles on Road (excl. Pickups) 0.0% 0.0% 1.4%
=
Seattle Battleground
RoboTaxi Miles vs. TAM 0.1% 0.2% 18.0%
GM Risk/Reward
Lost SAAR: 2,700 Units GM Key P&L Outputs
EBIT Lost: $24 Million
GM Revenue $622 $1,244 $38,666
Robotaxi EBIT*: $233 Million
Net Opportunity: $209 Million GM EBIT ($46) $101 $7,094
Margin -7% 8% 18%
=
Chicago Battleground GM RoboTaxi Network Fleet
GM Risk/Reward =
NYC Battleground San Francisco 5,950 11,900 21,250
Lost SAAR: 12,300 Units
EBIT Lost: $111 Million
GM Risk/Reward Seattle 0 0 21,000
Robotaxi EBIT*: $590 Million Lost SAAR: 1,000 Units
New York 0 0 46,250
=
San Fran Battleground
Net Opportunity: $479 Million EBIT Lost: $9 Million
Robotaxi EBIT*: $725 Million Austin 0 0 16,750
GM Risk/Reward Net Opportunity: $716 Million
Phoneix Area 0 0 33,000
Lost SAAR: 1,400 Units
EBIT Lost: $12 Million
Others 0 0 611,750
Robotaxi EBIT*: $334 Million Total GM 5,950 11,900 750,000
Net Opportunity: $322 Million =
Phoenix Metro Battleground
GM Risk/Reward
= Annual EBIT - GM
Lost SAAR: 17,250 Units
EBIT Lost: $155 Million
Austin Battleground
GM Risk/Reward
San Francisco ($46) $101 $334
Robotaxi EBIT*: $290 Million Lost SAAR: 5,800 Units Seattle $0 $0 $233
Net Opportunity: $135 Million EBIT Lost: $52 Million New York $0 $0 $726
Robotaxi EBIT*: $150 Million
Net Opportunity: $98 Million
* - 18% EBIT margin; 25% share
Austin $0 $0 $147
Phoneix Area $0 $0 $289
Others $0 $0 $5,365
Total GM: ($46) $101 $7,094
Source: Citi Research, IHS
5Autonomous Vehicle Networks
AV Subscription Outside Urban Centers
AV Subscriptions in the Suburbs
AV Subs: What is it?
1. Combines best of owning (instant access to mobility) with share
2. Consumer makes a single monthly payment. They effectively
“lease” the AV/EV and have access to it 24/7 much like today.
3. Driverless mode only enabled when car is human-less and only
from 11pm-4am—think of it as a “level-4+” domain
4. This AV domain enables: (1) swapping cars; (2) servicing cars
autonomously at dealer; (3) Last-mile delivery; (4) Charging; (5)
Peer-to-peer sharing for earning subscribers extra money
5. Sharing is purely optional
6. When not in AV mode, car performs L3/4 features in various
domains, and of course very advanced ADAS all the time
7. What if the monthly subscription were equal to non-AV/EVs?
…then AV convenience features are “free”…
…and car is inherently safer…
…and car can make/save you money…
…yet freedom of instant car access isn’t compromised
Source: Citi Research Estimates
6Autonomous Vehicle Networks
AV Subscription Outside Urban Centers
How AV Subs Unlock OEM Value
OEM/FinCo Share of Lifetime Vehicle Revenue
1. Value unlock of AV Subs inherent in the
OEM network capturing significant lifetime
$98,025
Repair/Maintainence vehicle economics that currently sit outside
13% of the OEM ecosystem
Roughly Half
of a Vehicle’s EV/AV
2. This occurs by leveraging AV/EVs & the
Lifetime Value OEM/FinCos
Insruance Cos.
network (dealers as hubs) to enable AV
Sits Outside 39%
of OEM 18% Sub cost at same TCO of “regular” cars
AV
Ecosystem…
3. AVs unlock lower insurance costs, hassle-
…AV Subs free maintenance. EVs unlock propulsion
Could EV costs, lower maintenance
Change This
4. Feature wise, consumer would likely prefer
Fuel Providers
30% AV/EV for the same monthly cost
Source: Citi Research Estimates
7Autonomous Vehicle Networks
AV Subscription Outside Urban Centers
How AV Subs Unlock OEM Value
The "Level-4+" Domain = Human-Less (11pm-4am) 1. “Level-4+” domain would reduce AV costs
by geo-fencing development around a
Warehouse P2P Lot dealer “hub”, with outlets including a
subscriber’s home, mall/warehouse and
Map/Train Map/Train peer-to-peer lots. Domain = middle of the
night with no humans to statistically ensure
Map/train pre-delivery greater safety—this is similar to the point-
Subsciber Dealer (Hub) to-point approach of urban RoboTaxi
2. This would allow AV Sub network to
expand prior to “level-5” vehicles, at a
Map/Train
presumably lower cost
Mall 3. Aptiv’s successful Vegas tests (point-to-
point rides) evidences that this level-4+
domain could work
Source: Citi Research Estimates
8Autonomous Vehicle Networks
AV Subscription Outside Urban Centers
Sell AV Sub Contract AV Sub Economics
Ford + Dealer FinCo (FMCC)
1. Assume AV Sub at same monthly payment as ICE vehicle
Vehicle Cash + Sub Fee Share
2. Assume AV/EV = $6k price premium to ICE
Sell AV Sub 3. 4.5% rate, 300 miles on a 70kWh EV, $0.12 electricity cost
Sub Payments 4. 40% insurance savings, 35% maintenance savings
Use Network
(swap, service, Support Subscriber 5. New battery installed in the 9th year, 15yr total life
peer-to-peer)
6. AV Sub fleet = >$2bln of adj. gross profit
AV Data stream
Subscriber (AV/EV) 7. Plus OEM still earns variable profit on vehicle, with
possible share gains for early leaders
8. No peer-to-peer sharing revenue assumed
Network 1 2 3 4 5 6 7 8 9 10 11 12 13 14 15
Revenue (ICE cost) $773 $782 $803 $904 $858 $613 $748 $606 $621 $690 $519 $436 $452 $569 $478
COGS ($373) ($379) ($387) ($458) ($405) ($428) ($493) ($423) ($953) ($461) ($464) ($416) ($420) ($486) ($420)
Gross Prof $399 $403 $416 $446 $453 $185 $255 $183 ($331) $229 $55 $20 $31 $83 $58
Annual $4,792 $4,832 $4,990 $5,347 $5,433 $2,219 $3,058 $2,192 ($3,975) $2,751 $659 $241 $374 $1,001 $693
Source: Citi Research Estimates
9Autonomous Vehicle Networks
The Most Coveted Asset in Car of the Future is the Network Effect
Rideshare AVs (RoboTaxi)
Dedicated RoboTaxi AV fleet
Supplemented by PERS-AVs
“One Stop Shop”
PERS-AV Access Initially urban focus (Battlegrounds) for Rideshare
For Cash (same App)
Dedicated AVs
(partitions)
Ownership (PERS-AV) Traditional Ownership (Non-AV)
AV features sold as an option Own car much like today (pickups)
Share car into the network for cash Enjoy connected car benefits
Network Car
Enjoy owning & AV experience Value instant access to mobility
Fu
ll
L
in
e
of
AV
PERS-AV Access
s
“One Stop Shop”
For Cash for Car Rental
(same App)
AV Subscription Services
Leasing, P2P or rental (Maven AV)
Subscribe for hours, days or longer
Customers can be anyone
Source: Citi Research Estimates
10Autonomous Vehicle Networks What Happens to U.S. Auto Sales?—How We Model a Path to 2030E Source: Citi Research (as of June 20, 2015 published report) 11
Autonomous Vehicle Networks
U.S. SAAR 2030 Simulation in a “Driverless World” (14.5-15.7 million)

                                                               Citi Current
               20.00                                           Cycle Thesis
                                                                                    Simulated   Driverless Car Era
                                                                              17.70 Recession
               18.00                                                      17.50
                                                                      17.39

                                                                                                16.02
               16.00                                                                                             15.74

                                                                                      14.24
               14.00

               12.00

               10.00

                8.00

                6.00

                4.00

                2.00

                0.00
                       1980
                       1981
                       1982
                       1983
                       1984
                       1985
                       1986
                       1987
                       1988
                       1989
                       1990
                       1991
                       1992
                       1993
                       1994
                       1995
                       1996
                       1997
                       1998
                       1999
                       2000
                       2001
                       2002
                       2003
                       2004
                       2005
                       2006
                       2007
                       2008
                       2009
                       2010
                       2011
                       2012
                       2013
                       2014
                       2015
                       2016
                       2017
                       2018
                       2019
                       2020
                       2021
                       2022
                       2023
                       2024
                       2025
                       2026
                       2027
                       2028
                       2029
                       2030
Source: Citi Research (as of June 20, 2015 published report)

12
Autonomous Vehicle Networks
2030: A Transforming Industry
What Changes the Least?
§ Business models concentrated in rural U.S. areas…
§ …Or commercial/utility vehicles (pickups, large SUVs/vans, luxury)
What Changes the Most?
§ Personal mobility in major cities & surrounding areas
§ Potential market share away from mass transit
§ Models around unlocking time spent in car
What Also Changes?
§ New business models – subscription networks
§ Aftermarket dynamics
§ Big data monetization opportunities
Source: Company data, Citi Research.
13Autonomous Vehicle Networks
Pickup Trucks vs. the Broader Auto Market
Key Points
Pickup Trucks vs. SAAR: High Density vs. Low Density County Analysis 1. We’ve analyzed the
distribution of Pickups
(FSPU) and SAAR (ex.
pickups) in their respective
Top 50 U.S. counties
2. Sorting the counties by
population density shows
that pickups are more
concentrated in lower
density counties
3. We think population density
will be a distinguishing
factor as investors assess
OEM exposure to shared
AV/EV mobility
Source: Citi Research, IHS
14Autonomous Vehicle Networks
Global Potential: Unlocking > 8mln “SAAR” in Frontiers
Large “On the Cusp Markets India Illustrative Example
1,000
INDIA 2020 2020 2020
Urban Rural Total
900
Adult Population 354 607 961
800 % drivers /commuters 88% 3% 34%
Total Traveling Adult Pop 311 15 326
Vehicle Density per 1,000 people
700
600
# of trips per person per day 2 2
500 # of trips per taxi per day 24 10
# ppl per taxi per trip 1.2 1.2
400
People moved per taxi 14.4 6
300
Amnt. Of Robo Taxi Needed (mlns) 21.6 2.5 24.1
200 Current PARC (mln) 56.8
TOTAL PF DENSITY (cars per 1,000 adults) 84.3
100
Nigeria
India Indonesia
0
0 10,000 20,000 30,000 40,000 50,000 60,000 70,000 80,000 90,000 100,000
Average Life of Robo Taxi (yrs) 4.5
GDP per Capita (2014, 2014 $USD) Robo Taxis Needed per Year (mln) 5.4
Source: LMC, World Bank, Govt. of NCT of Delhi, Citi Research Estimates
15Companies Mentioned (GM.N; US$35.55; 1; 15 Nov 18; 16:00); (TSLA.O; US$348.44; 3H; 15 Nov 18; 16:00); (F.N; US$9.31; 2; 15 Nov 18; 16:00); (MGA.N; US$49.78; 1; 15 Nov 18; 16:00); (APTV.N; US$75.15; 1; 15 Nov 18; 16:00); (VNE.N; US$33.05; 2; 15 Nov 18; 16:00); (INTC.O; US$48.11; 2; 15 Nov 18; 16:00); (GOOGL.O; US$1,071.05; 1; 15 Nov 18; 16:00) Source: Citi Research 16
Appendix A-1
     Analyst Certification
     The research analysts primarily responsible for the preparation and content of this research report are either (i) designated by “AC” in the author block or (ii) listed
     in bold alongside content which is attributable to that analyst. If multiple AC analysts are designated in the author block, each analyst is certifying with respect to
     the entire research report other than (a) content attributable to another AC certifying analyst listed in bold alongside the content and (b) views expressed solely with
     respect to a specific issuer which are attributable to another AC certifying analyst identified in the price charts or rating history tables for that issuer shown below.
     Each of these analysts certify, with respect to the sections of the report for which they are responsible: (1) that the views expressed therein accurately reflect their
     personal views about each issuer and security referenced and were prepared in an independent manner, including with respect to Citigroup Global Markets Inc. and
     its affiliates; and (2) no part of the research analyst's compensation was, is, or will be, directly or indirectly, related to the specific recommendations or views
     expressed by that research analyst in this report.
     IMPORTANT DISCLOSURES
     Due to Citi's involvement in Intel Corporations (the Company”) acquisition of Mobileye B.V. Citi Research suspended its rating and target price on March 13th 2017 (the
     Suspension Date”). Please note the Company price chart that appears in this report and available on Citi Research's disclosure website does not reflect that Citi Research did
     not have a rating or target price between the Suspension Date and January 29th 2018 when Citi Research resumed full coverage.
     Due to Citi's involvement in Delphi Automotive PLC's (“the Company”) sale of its thermal business to Mahle GmbH, Citi Research restricted publication of new research reports,
     and suspended its rating and target price on the Company on February 19th, 2015 (the Suspension Date”). Please note that the Company price chart available on Citi
     Research's disclosure website does not reflect that Citi Research did not have a rating or target price between the Suspension Date and July 9th, 2015, when Citi Research
     resumed full coverage
     Due to Citi's role advising GM on the announced sale of Vauxhall/Opel & GM Financial Europe to PSA Group,Citi Research restricted publication of new research reports,and
     suspended its rating and target price on (03/06/2017) (the Suspension Date”). Please note that the Company price chart that appears in this report and available on Citi
     Research's disclosure website does not reflect that Citi Research did not have a rating or target price between the Suspension Date (03/06/2017) and (03/07/2017) when Citi
     Research resumed full coverage.
     Citigroup Global Markets Inc. or its affiliates beneficially owns 1% or more of any class of common equity securities of Ford Motor Co, General Motors Company. This position
     reflects information available as of the prior business day.
     Citigroup Global Markets Inc. or its affiliates has a net long position of 0.5% or more of any class of common equity securities of Tesla Inc, Ford Motor Co, General Motors
     Company.
     Citigroup Global Markets Inc. or its affiliates beneficially owns 2.0% or more of any class of common equity securities of Ford Motor Co.
     Within the past 12 months, Citigroup Global Markets Inc. or its affiliates has acted as manager or co-manager of an offering of securities of Tesla Inc, Ford Motor Co, General
     Motors Company.

17
Citigroup Global Markets Inc. owns a position of 1 million USD or more in the debt securities of Tesla Inc, Ford Motor Co, Intel Corp, General Motors Company, Alphabet Inc,
Magna International Inc.
Citigroup Global Markets Inc. or its affiliates has received compensation for investment banking services provided within the past 12 months from Tesla Inc, Ford Motor Co, Intel
Corp, Aptiv PLC, General Motors Company, Alphabet Inc, Magna International Inc.
Citigroup Global Markets Inc. or its affiliates expects to receive or intends to seek, within the next three months, compensation for investment banking services from Tesla Inc,
Ford Motor Co, General Motors Company.
Citigroup Global Markets Inc. or an affiliate received compensation for products and services other than investment banking services from Tesla Inc, Ford Motor Co, Intel Corp,
Aptiv PLC, General Motors Company, Alphabet Inc, Magna International Inc in the past 12 months.
Citigroup Global Markets Inc. currently has, or had within the past 12 months, the following as investment banking client(s): General Motors Company, Tesla Inc, Ford Motor Co,
Intel Corp, Aptiv PLC, Alphabet Inc, Magna International Inc.
Citigroup Global Markets Inc. currently has, or had within the past 12 months, the following as clients, and the services provided were non-investment-banking, securities-
related: Tesla Inc, Ford Motor Co, Intel Corp, Aptiv PLC, General Motors Company, Alphabet Inc, Magna International Inc.
Citigroup Global Markets Inc. currently has, or had within the past 12 months, the following as clients, and the services provided were non-investment-banking, non-securities-
related: Tesla Inc, Ford Motor Co, Intel Corp, Aptiv PLC, General Motors Company, Alphabet Inc, Magna International Inc.
Citigroup Global Markets Inc. and/or its affiliates has a significant financial interest in relation to Tesla Inc, Ford Motor Co, Aptiv PLC, General Motors Company, Alphabet Inc,
Magna International Inc. (For an explanation of the determination of significant financial interest, please refer to the policy for managing conflicts of interest which can be found
at www.citiVelocity.com.)
Disclosure for investors in the Republic of Turkey: Under Capital Markets Law of Turkey (Law No: 6362), the investment information, comments and recommendations
stated here, are not within the scope of investment advisory activity. Investment advisory service is provided in accordance with a contract of engagement on investment
advisory concluded between brokerage houses, portfolio management companies, non-deposit banks and clients. Comments and recommendations stated here rely on the
individual opinions of the ones providing these comments and recommendations. These opinions may not fit to your financial status, risk and return preferences. For this reason,
to make an investment decision by relying solely to this information stated here may not bring about outcomes that fit your expectations. Furthermore, Citi Research is a division
of Citigroup Global Markets Inc. (the “Firm”), which does and seeks to do business with companies and/or trades on securities covered in this research reports. As a result,
investors should be aware that the Firm may have a conflict of interest that could affect the objectivity of this report, however investors should also note that the Firm has in
place organisational and administrative arrangements to manage potential conflicts of interest of this nature.
Analysts’ compensation is determined by Citi Research management and Citigroup’s senior management and is based upon activities and services intended to benefit the
investor clients of Citigroup Global Markets Inc. and its affiliates (the “Firm”). Compensation is not linked to specific transactions or recommendations. Like all Firm employees,
analysts receive compensation that is impacted by overall Firm profitability which includes investment banking, sales and trading, and principal trading revenues. One factor in
equity research analyst compensation is arranging corporate access events between institutional clients and the management teams of covered companies. Typically, company
management is more likely to participate when the analyst has a positive view of the company.
For securities recommended in the Product in which the Firm is not a market maker, the Firm is a liquidity provider in the issuers' financial instruments and may act as principal
in connection with such transactions. The Firm is a regular issuer of traded financial instruments linked to securities that may have been recommended in the Product. The Firm
regularly trades in the securities of the issuer(s) discussed in the Product. The Firm may engage in securities transactions in a manner inconsistent with the Product and, with
respect to securities covered by the Product, will buy or sell from customers on a principal basis.
The Firm is a market maker in the publicly traded equity securities of Tesla Inc, Ford Motor Co, Intel Corp, Aptiv PLC.
18For important disclosures (including copies of historical disclosures) regarding the companies that are the subject of this Citi Research product ("the Product"), please contact
Citi Research, 388 Greenwich Street, 28th Floor, New York, NY, 10013, Attention: Legal/Compliance [E6WYB6412478]. In addition, the same important disclosures, with the
exception of the Valuation and Risk assessments and historical disclosures, are contained on the Firm's disclosure website at
https://www.citivelocity.com/cvr/eppublic/citi_research_disclosures. Valuation and Risk assessments can be found in the text of the most recent research note/report regarding
the subject company. Pursuant to the Market Abuse Regulation a history of all Citi Research recommendations published during the preceding 12-month period can be
accessed via Citi Velocity (https://www.citivelocity.com/cv2) or your standard distribution portal. Historical disclosures (for up to the past three years) will be provided upon
request.
Citi Research Equity Ratings Distribution
12 Month Rating Catalyst Watch
Data current as of 30 Sep 2018 Buy Hold Sell Buy Hold Sell
Citi Research Global Fundamental Coverage 54% 35% 11% 9% 88% 3%
% of companies in each rating category that are investment banking clients 64% 63% 56% 70% 64% 63%
Guide to Citi Research Fundamental Research Investment Ratings:
Citi Research stock recommendations include an investment rating and an optional risk rating to highlight high risk stocks.
Risk rating takes into account both price volatility and fundamental criteria. Stocks will either have no risk rating or a High risk rating assigned.
Investment Ratings: Citi Research investment ratings are Buy, Neutral and Sell. Our ratings are a function of analyst expectations of expected total return ("ETR") and risk.
ETR is the sum of the forecast price appreciation (or depreciation) plus the dividend yield for a stock within the next 12 months. The target price is based on a 12 month time
horizon. The Investment rating definitions are: Buy (1) ETR of 15% or more or 25% or more for High risk stocks; and Sell (3) for negative ETR. Any covered stock not assigned a
Buy or a Sell is a Neutral (2). For stocks rated Neutral (2), if an analyst believes that there are insufficient valuation drivers and/or investment catalysts to derive a positive or
negative investment view, they may elect with the approval of Citi Research management not to assign a target price and, thus, not derive an ETR. Analysts may place covered
stocks "Under Review" in response to exceptional circumstances (e.g. lack of information critical to the analyst's thesis) affecting the company and / or trading in the company's
securities (e.g. trading suspension). As soon as practically possible, the analyst will publish a note re-establishing a rating and investment thesis. To satisfy regulatory
requirements, we correspond Under Review and Neutral to Hold in our ratings distribution table for our 12-month fundamental rating system. However, we reiterate that we do
not consider Under Review to be a recommendation. Investment ratings are determined by the ranges described above at the time of initiation of coverage, a change in
investment and/or risk rating, or a change in target price (subject to limited management discretion). At other times, the expected total returns may fall outside of these ranges
because of market price movements and/or other short-term volatility or trading patterns. Such interim deviations from specified ranges will be permitted but will become subject
to review by Research Management. Your decision to buy or sell a security should be based upon your personal investment objectives and should be made only after evaluating
the stock's expected performance and risk.
Catalyst Watch Upside/Downside calls:
Citi Research may also include a Catalyst Watch Upside or Downside call to highlight specific near-term catalysts or events impacting the company or the market that are
expected to influence the share price over a specified period of 30 or 90 days. A Catalyst Watch Upside (Downside) call indicates that the analyst expects the share price to rise
(fall) in absolute terms over the specified period. A Catalyst Watch Upside/Downside call will automatically expire at the end of the specified 30/90 day period; the analyst may
also close a Catalyst Watch call prior to the end of the specified period in a published research note. A Catalyst Watch Upside or Downside call may be different from and does
not affect a stock’s fundamental equity rating, which reflects a longer-term total absolute return expectation. For purposes of FINRA ratings-distribution-disclosure rules, a
Catalyst Watch Upside call corresponds to a buy recommendation and a Catalyst Watch Downside call corresponds to a sell recommendation. Any stock not assigned to a
Catalyst Watch Upside or Catalyst Watch Downside call is considered Catalyst Watch Non-Rated (CWNR). For purposes of FINRA ratings-distribution-disclosure rules, we
correspond CWNR to Hold in our ratings distribution table for our Catalyst Watch Upside/Downside rating system. However, we reiterate that we do not consider CWNR to be a
recommendation. For all Catalyst Watch Upside/Downside calls, risk exists that the catalyst(s) and associated share-price movement will not materialize as expected.
19NON-US RESEARCH ANALYST DISCLOSURES
Non-US research analysts who have prepared this report (i.e., all research analysts listed below other than those identified as employed by Citigroup Global Markets Inc.) are
not registered/qualified as research analysts with FINRA. Such research analysts may not be associated persons of the member organization and therefore may not be subject
to the FINRA Rule 2241 restrictions on communications with a subject company, public appearances and trading securities held by a research analyst account. The legal entities
employing the authors of this report are listed below:
Citigroup Global Markets Inc Itay Michaeli; Christopher Danely; Mark May
OTHER DISCLOSURES
Any price(s) of instruments mentioned in recommendations are as of the prior day’s market close on the primary market for the instrument, unless otherwise stated.
European regulations require that where a recommendation differs from any of the author’s previous recommendations concerning the same financial instrument or issuer that
has been published during the preceding 12-month period that the change(s) and the date of that previous recommendation are indicated. For fundamental coverage please
refer to the price chart or rating change history within this disclosure appendix or the issuer disclosure summary at
https://www.citivelocity.com/cvr/eppublic/citi_research_disclosures.
European regulations require that a firm must establish, implement and make available a policy for managing conflicts of interest arising as a result of publication or distribution
of investment research. The policy applicable to Citi Research's Products can be found at https://www.citivelocity.com/cvr/eppublic/citi_research_disclosures.
The proportion of all Citi Research research recommendations that were the equivalent to “Buy”,”Hold”,”Sell” at the end of each quarter over the prior 12 months (with the % of
these that had received investment firm services from Citi in the prior 12 months shown in brackets) is as follows: Q3 2018 Buy 33% (69%), Hold 43% (64%), Sell 23% (58%),
RV 0.6% (99%); Q2 2018 Buy 33% (70%), Hold 43% (64%), Sell 23% (57%), RV 0.6% (89%); Q1 2018 Buy 32% (71%), Hold 44% (63%), Sell 24% (56%), RV 0.4% (98%); Q4
2017 Buy 32% (70%), Hold 44% (65%), Sell 24% (57%), RV NA (NA). For the purposes of disclosing recommendations other than for equity or high yield recommendations
(whose definitions can be found in their corresponding disclosure sections), “Buy” means a positive directional trade idea; “Sell” means a negative directional trade idea; and
“Relative Value” means any trade idea which does not have a clear direction to the investment strategy.
European regulations require a 5 year price history when past performance of a security is referenced. CitiVelocity’s Charting Tool
(https://www.citivelocity.com/cv2/#go/CHARTING_3_Equities) provides the facility to create customisable price charts including a five year option. This tool can be found in the
Data & Analytics section under any of the asset class menus in CitiVelocity (https://www.citivelocity.com/). For further information contact CitiVelocity support
(https://www.citivelocity.com/cv2/go/CLIENT_SUPPORT). The source for all referenced prices, unless otherwise stated, is DataCentral, which sources price information from
Thomson Reuters. Past performance is not a guarantee or reliable indicator of future results. Forecasts are not a guarantee or reliable indicator of future performance.
Investors should always consider the investment objectives, risks, and charges and expenses of an ETF carefully before investing. The applicable prospectus and key investor
information document (as applicable) for an ETF should contain this and other information about such ETF. It is important to read carefully any such prospectus before investing.
Clients may obtain prospectuses and key investor information documents for ETFs from the applicable distributor or authorized participant, the exchange upon which an ETF is
listed and/or from the applicable website of the applicable ETF issuer. The value of the investments and any accruing income may fall or rise. Any past performance, prediction
or forecast is not indicative of future or likely performance. Any information on ETFs contained herein is provided strictly for illustrative purposes and should not be deemed an
offer to sell or a solicitation of an offer to purchase units of any ETF either explicitly or implicitly. The opinions expressed are those of the authors and do not necessarily reflect
the views of ETF issuers, any of their agents or their affiliates.
Citigroup Global Markets India Private Limited and/or its affiliates may have, from time to time, actual or beneficial ownership of 1% or more in the debt securities of the subject
issuer.
20Citi Research generally disseminates its research to the Firm’s global institutional and retail clients via both proprietary (e.g., Citi Velocity and Citi Personal Wealth Management)
and non-proprietary electronic distribution platforms. Certain research may be disseminated only via the Firm’s proprietary distribution platforms; however such research will not
contain changes to earnings forecasts, target price, investment or risk rating or investment thesis or be otherwise inconsistent with the author’s previously published research.
Certain research is made available only to institutional investors to satisfy regulatory requirements. Individual Citi Research analysts may also opt to circulate published
research to one or more clients by email; such email distribution is discretionary and is done only after the research has been disseminated. The level and types of services
provided by Citi Research analysts to clients may vary depending on various factors such as the client’s individual preferences as to the frequency and manner of receiving
communications from analysts, the client’s risk profile and investment focus and perspective (e.g. market-wide, sector specific, long term, short-term etc.), the size and scope of
the overall client relationship with the Firm and legal and regulatory constraints.
Pursuant to Comissão de Valores Mobiliários Rule 598 and ASIC Regulatory Guide 264, Citi is required to disclose whether a Citi related company or business has a
commercial relationship with the subject company. Considering that Citi operates multiple businesses in more than 100 countries around the world, it is likely that Citi has a
commercial relationship with the subject company.
Securities recommended, offered, or sold by the Firm: (i) are not insured by the Federal Deposit Insurance Corporation; (ii) are not deposits or other obligations of any insured
depository institution (including Citibank); and (iii) are subject to investment risks, including the possible loss of the principal amount invested. The Product is for informational
purposes only and is not intended as an offer or solicitation for the purchase or sale of a security. Any decision to purchase securities mentioned in the Product must take into
account existing public information on such security or any registered prospectus. Although information has been obtained from and is based upon sources that the Firm
believes to be reliable, we do not guarantee its accuracy and it may be incomplete and condensed. Note, however, that the Firm has taken all reasonable steps to determine the
accuracy and completeness of the disclosures made in the Important Disclosures section of the Product. The Firm's research department has received assistance from the
subject company(ies) referred to in this Product including, but not limited to, discussions with management of the subject company(ies) or visiting company sites. Firm policy
prohibits research analysts from sending draft research to subject companies. However, it should be presumed that the author of the Product has had discussions with the
subject company to ensure factual accuracy prior to publication. All opinions, projections and estimates constitute the judgment of the author as of the date of the Product and
these, plus any other information contained in the Product, are subject to change without notice. Prices and availability of financial instruments also are subject to change
without notice. Notwithstanding other departments within the Firm advising the companies discussed in this Product, information obtained in such role is not used in the
preparation of the Product. Although Citi Research does not set a predetermined frequency for publication, if the Product is a fundamental equity or credit research report, it is
the intention of Citi Research to provide research coverage of the covered issuers, including in response to news affecting the issuer. For non-fundamental research reports, Citi
Research may not provide regular updates to the views, recommendations and facts included in the reports. Notwithstanding that Citi Research maintains coverage on, makes
recommendations concerning or discusses issuers, Citi Research may be periodically restricted from referencing certain issuers due to legal or policy reasons. Where a
component of a published trade idea is subject to a restriction, the trade idea will be removed from any list of open trade ideas included in the Product. Upon the lifting of the
restriction, the trade idea will either be re-instated in the open trade ideas list if the analyst continues to support it or it will be officially closed. Citi Research may provide different
research products and services to different classes of customers (for example, based upon long-term or short-term investment horizons) that may lead to differing conclusions or
recommendations that could impact the price of a security contrary to the recommendations in the alternative research product, provided that each is consistent with the rating
system for each respective product.
Investing in non-U.S. securities, including ADRs, may entail certain risks. The securities of non-U.S. issuers may not be registered with, nor be subject to the reporting
requirements of the U.S. Securities and Exchange Commission. There may be limited information available on foreign securities. Foreign companies are generally not subject to
uniform audit and reporting standards, practices and requirements comparable to those in the U.S. Securities of some foreign companies may be less liquid and their prices
more volatile than securities of comparable U.S. companies. In addition, exchange rate movements may have an adverse effect on the value of an investment in a foreign stock
and its corresponding dividend payment for U.S. investors. Net dividends to ADR investors are estimated, using withholding tax rates conventions, deemed accurate, but
investors are urged to consult their tax advisor for exact dividend computations. Investors who have received the Product from the Firm may be prohibited in certain states or
other jurisdictions from purchasing securities mentioned in the Product from the Firm. Please ask your Financial Consultant for additional details. Citigroup Global Markets Inc.
21takes responsibility for the Product in the United States. Any orders by US investors resulting from the information contained in the Product may be placed only through
Citigroup Global Markets Inc.
Important Disclosures for Bell Potter Customers: Bell Potter is making this Product available to its clients pursuant to an agreement with Citigroup Global Markets Australia
Pty Limited. Neither Citigroup Global Markets Australia Pty Limited nor any of its affiliates has made any determination as to the suitability of the information provided herein
and clients should consult with their Bell Potter financial advisor before making any investment decision.
The Citigroup legal entity that takes responsibility for the production of the Product is the legal entity which the first named author is employed by. The Product is
made available in Australia through Citigroup Global Markets Australia Pty Limited. (ABN 64 003 114 832 and AFSL No. 240992), participant of the ASX Group and regulated
by the Australian Securities & Investments Commission. Citigroup Centre, 2 Park Street, Sydney, NSW 2000. Citigroup Global Markets Australia Pty Limited is not an
Authorised Deposit-Taking Institution under the Banking Act 1959, nor is it regulated by the Australian Prudential Regulation Authority. The Product is made available in Australia
to Private Banking wholesale clients through Citigroup Pty Limited (ABN 88 004 325 080 and AFSL 238098). Citigroup Pty Limited provides all financial product advice to
Australian Private Banking wholesale clients through bankers and relationship managers. If there is any doubt about the suitability of investments held in Citigroup Private Bank
accounts, investors should contact the Citigroup Private Bank in Australia. Citigroup companies may compensate affiliates and their representatives for providing products and
services to clients. The Product is made available in Brazil by Citigroup Global Markets Brasil - CCTVM SA, which is regulated by CVM - Comissão de Valores Mobiliários
("CVM"), BACEN - Brazilian Central Bank, APIMEC - Associação dos Analistas e Profissionais de Investimento do Mercado de Capitais and ANBIMA – Associação Brasileira
das Entidades dos Mercados Financeiro e de Capitais. Av. Paulista, 1111 - 14º andar(parte) - CEP: 01311920 - São Paulo - SP. If the Product is being made available in certain
provinces of Canada by Citigroup Global Markets (Canada) Inc. ("CGM Canada"), CGM Canada has approved the Product. Citigroup Place, 123 Front Street West, Suite 1100,
Toronto, Ontario M5J 2M3. This product is available in Chile through Banchile Corredores de Bolsa S.A., an indirect subsidiary of Citigroup Inc., which is regulated by the
Superintendencia de Valores y Seguros. Agustinas 975, piso 2, Santiago, Chile. The Product is made available in Germany by Citigroup Global Markets Deutschland AG
("CGMD"), which is regulated by Bundesanstalt fuer Finanzdienstleistungsaufsicht (BaFin). CGMD, Reuterweg 16, 60323 Frankfurt am Main. Research which relates to
"securities" (as defined in the Securities and Futures Ordinance (Cap. 571 of the Laws of Hong Kong)) is issued in Hong Kong by, or on behalf of, Citigroup Global Markets Asia
Limited which takes full responsibility for its content. Citigroup Global Markets Asia Ltd. is regulated by Hong Kong Securities and Futures Commission. If the Research is made
available through Citibank, N.A., Hong Kong Branch, for its clients in Citi Private Bank, it is made available by Citibank N.A., Citibank Tower, Citibank Plaza, 3 Garden Road,
Hong Kong. Citibank N.A. is regulated by the Hong Kong Monetary Authority. Please contact your Private Banker in Citibank N.A., Hong Kong, Branch if you have any queries
on or any matters arising from or in connection with this document. The Product is made available in India by Citigroup Global Markets India Private Limited (CGM), which is
regulated by the Securities and Exchange Board of India (SEBI), as a Research Analyst (SEBI Registration No. INH000000438). CGM is also actively involved in the business
of merchant banking and stock brokerage in India, and is registered with SEBI in this regard. CGM’s registered office is at 1202, 12th Floor, FIFC, G Block, Bandra Kurla
Complex, Bandra East, Mumbai – 400098. CGM’s Corporate Identity Number is U99999MH2000PTC126657, and its contact details are: Tel:+9102261759999
Fax:+9102261759961. The Product is made available in Indonesia through PT Citigroup Securities Indonesia. 5/F, Citibank Tower, Bapindo Plaza, Jl. Jend. Sudirman Kav. 54-
55, Jakarta 12190. Neither this Product nor any copy hereof may be distributed in Indonesia or to any Indonesian citizens wherever they are domiciled or to Indonesian
residents except in compliance with applicable capital market laws and regulations. This Product is not an offer of securities in Indonesia. The securities referred to in this
Product have not been registered with the Capital Market and Financial Institutions Supervisory Agency (BAPEPAM-LK) pursuant to relevant capital market laws and
regulations, and may not be offered or sold within the territory of the Republic of Indonesia or to Indonesian citizens through a public offering or in circumstances which
constitute an offer within the meaning of the Indonesian capital market laws and regulations. The Product is made available in Israel through Citibank NA, regulated by the
Bank of Israel and the Israeli Securities Authority. Citibank, N.A, Platinum Building, 21 Ha'arba'ah St, Tel Aviv, Israel. The Product is made available in Italy by Citigroup Global
Markets Limited, which is authorised by the PRA and regulated by the FCA and the PRA. Via dei Mercanti, 12, Milan, 20121, Italy. The Product is made available in Japan by
Citigroup Global Markets Japan Inc. ("CGMJ"), which is regulated by Financial Services Agency, Securities and Exchange Surveillance Commission, Japan Securities Dealers
Association, Tokyo Stock Exchange and Osaka Securities Exchange. Otemachi Park Building, 1-1-1 Otemachi, Chiyoda-ku, Tokyo 100-8132 Japan. If the Product was
distributed by SMBC Nikko Securities Inc. it is being so distributed under license. In the event that an error is found in an CGMJ research report, a revised version will be
22posted on the Firm's Citi Velocity website. If you have questions regarding Citi Velocity, please call (81 3) 6270-3019 for help. The Product is made available in Korea by
Citigroup Global Markets Korea Securities Ltd., which is regulated by the Financial Services Commission, the Financial Supervisory Service and the Korea Financial Investment
Association (KOFIA). Citibank Building, 39 Da-dong, Jung-gu, Seoul 100-180, Korea. KOFIA makes available registration information of research analysts on its
website. Please visit the following website if you wish to find KOFIA registration information on research analysts of Citigroup Global Markets Korea Securities
Ltd. http://dis.kofia.or.kr/websquare/index.jsp?w2xPath=/wq/fundMgr/DISFundMgrAnalystList.xml&divisionId=MDIS03002002000000&serviceId=SDIS03002002000. The
Product is made available in Korea by Citibank Korea Inc., which is regulated by the Financial Services Commission and the Financial Supervisory Service. Address is Citibank
Building, 39 Da-dong, Jung-gu, Seoul 100-180, Korea. This research report is intended to be provided only to Professional Investors as defined in the Financial Investment
Services and Capital Market Act and its Enforcement Decree in Korea. The Product is made available in Malaysia by Citigroup Global Markets Malaysia Sdn Bhd (Company
No. 460819-D) (“CGMM”) to its clients and CGMM takes responsibility for its contents. CGMM is regulated by the Securities Commission of Malaysia. Please contact CGMM at
Level 43 Menara Citibank, 165 Jalan Ampang, 50450 Kuala Lumpur, Malaysia in respect of any matters arising from, or in connection with, the Product. The Product is made
available in Mexico by Citibanamex Casa de Bolsa, S.A. De C. V., Casa de Bolsa, Integrante del Grupo Financiero Citibanamex which is a wholly owned subsidiary of Citigroup
Inc. and is regulated by Comision Nacional Bancaria y de Valores. Reforma 398, Col. Juarez, 06600 Mexico, D.F. In New Zealand the Product is made available to ‘wholesale
clients’ only as defined by s5C(1) of the Financial Advisers Act 2008 (‘FAA’) through Citigroup Global Markets Australia Pty Ltd (ABN 64 003 114 832 and AFSL No. 240992), an
overseas financial adviser as defined by the FAA, participant of the ASX Group and regulated by the Australian Securities & Investments Commission. Citigroup Centre, 2 Park
Street, Sydney, NSW 2000. The Product is made available in Pakistan by Citibank N.A. Pakistan branch, which is regulated by the State Bank of Pakistan and Securities
Exchange Commission, Pakistan. AWT Plaza, 1.1. Chundrigar Road, P.O. Box 4889, Karachi-74200. The Product is made available in the Philippines through Citicorp
Financial Services and Insurance Brokerage Philippines, Inc., which is regulated by the Philippines Securities and Exchange Commission. 20th Floor Citibank Square Bldg. The
Product is made available in the Philippines through Citibank NA Philippines branch, Citibank Tower, 8741 Paseo De Roxas, Makati City, Manila. Citibank NA Philippines NA is
regulated by The Bangko Sentral ng Pilipinas. The Product is made available in Poland by Dom Maklerski Banku Handlowego SA an indirect subsidiary of Citigroup Inc., which
is regulated by Komisja Nadzoru Finansowego. Dom Maklerski Banku Handlowego S.A. ul.Senatorska 16, 00-923 Warszawa. The Product is made available in the Russian
Federation through AO Citibank, which is licensed to carry out banking activities in the Russian Federation in accordance with the general banking license issued by the Central
Bank of the Russian Federation and brokerage activities in accordance with the license issued by the Federal Service for Financial Markets. Neither the Product nor any
information contained in the Product shall be considered as advertising the securities mentioned in this report within the territory of the Russian Federation or outside the
Russian Federation. The Product does not constitute an appraisal within the meaning of the Federal Law of the Russian Federation of 29 July 1998 No. 135-FZ (as amended)
On Appraisal Activities in the Russian Federation. 8-10 Gasheka Street, 125047 Moscow. The Product is made available in Singapore through Citigroup Global Markets
Singapore Pte. Ltd. (“CGMSPL”), a capital markets services license holder, and regulated by Monetary Authority of Singapore. Please contact CGMSPL at 8 Marina View, 21st
Floor Asia Square Tower 1, Singapore 018960, in respect of any matters arising from, or in connection with, the analysis of this document. This report is intended for recipients
who are accredited, expert and institutional investors as defined under the Securities and Futures Act (Cap. 289). The Product is made available by The Citigroup Private Bank
in Singapore through Citibank, N.A., Singapore Branch, a licensed bank in Singapore that is regulated by Monetary Authority of Singapore. Please contact your Private Banker
in Citibank N.A., Singapore Branch if you have any queries on or any matters arising from or in connection with this document. This report is intended for recipients who are
accredited, expert and institutional investors as defined under the Securities and Futures Act (Cap. 289). This report is distributed in Singapore by Citibank Singapore Ltd
("CSL") to selected Citigold/Citigold Private Clients. CSL provides no independent research or analysis of the substance or in preparation of this report. Please contact your
Citigold//Citigold Private Client Relationship Manager in CSL if you have any queries on or any matters arising from or in connection with this report. This report is intended for
recipients who are accredited investors as defined under the Securities and Futures Act (Cap. 289). Citigroup Global Markets (Pty) Ltd. is incorporated in the Republic of
South Africa (company registration number 2000/025866/07) and its registered office is at 145 West Street, Sandton, 2196, Saxonwold. Citigroup Global Markets (Pty) Ltd. is
regulated by JSE Securities Exchange South Africa, South African Reserve Bank and the Financial Services Board. The investments and services contained herein are not
available to private customers in South Africa. The Product is made available in the Republic of China through Citigroup Global Markets Taiwan Securities Company Ltd.
("CGMTS"), 14 and 15F, No. 1, Songzhi Road, Taipei 110, Taiwan, subject to the license scope and the applicable laws and regulations in the Republic of China. CGMTS is
regulated by the Securities and Futures Bureau of the Financial Supervisory Commission of Taiwan, the Republic of China. No portion of the Product may be reproduced or
23quoted in the Republic of China by the press or any third parties [without the written authorization of CGMTS]. Pursuant to the applicable laws and regulations in the Republic of
China, the recipient of the Product shall not take advantage of such Product to involve in any matters in which the recipient may have conflicts of interest. If the Product covers
securities which are not allowed to be offered or traded in the Republic of China, neither the Product nor any information contained in the Product shall be considered as
advertising the securities or making recommendation of the securities in the Republic of China. The Product is for informational purposes only and is not intended as an offer or
solicitation for the purchase or sale of a security or financial products. Any decision to purchase securities or financial products mentioned in the Product must take into account
existing public information on such security or the financial products or any registered prospectus. The Product is made available in Thailand through Citicorp Securities
(Thailand) Ltd., which is regulated by the Securities and Exchange Commission of Thailand. 399 Interchange 21 Building, 18th Floor, Sukhumvit Road, Klongtoey Nua, Wattana
,Bangkok 10110, Thailand. The Product is made available in Turkey through Citibank AS which is regulated by Capital Markets Board. Tekfen Tower, Eski Buyukdere Caddesi
# 209 Kat 2B, 23294 Levent, Istanbul, Turkey. In the U.A.E, these materials (the "Materials") are communicated by Citigroup Global Markets Limited, DIFC branch ("CGML"), an
entity registered in the Dubai International Financial Center ("DIFC") and licensed and regulated by the Dubai Financial Services Authority ("DFSA") to Professional Clients and
Market Counterparties only and should not be relied upon or distributed to Retail Clients. A distribution of the different Citi Research ratings distribution, in percentage terms for
Investments in each sector covered is made available on request. Financial products and/or services to which the Materials relate will only be made available to Professional
Clients and Market Counterparties. The Product is made available in United Kingdom by Citigroup Global Markets Limited, which is authorised by the Prudential Regulation
Authority (“PRA”) and regulated by the Financial Conduct Authority (“FCA”) and the PRA. This material may relate to investments or services of a person outside of the UK or to
other matters which are not authorised by the PRA nor regulated by the FCA and the PRA and further details as to where this may be the case are available upon request in
respect of this material. Citigroup Centre, Canada Square, Canary Wharf, London, E14 5LB. The Product is made available in United States by Citigroup Global Markets Inc,
which is a member of FINRA and registered with the US Securities and Exchange Commission. 388 Greenwich Street, New York, NY 10013. Unless specified to the contrary,
within EU Member States, the Product is made available by Citigroup Global Markets Limited, which is authorised by the PRA and regulated by the FCA and the PRA.
The Product is not to be construed as providing investment services in any jurisdiction where the provision of such services would not be permitted.
Subject to the nature and contents of the Product, the investments described therein are subject to fluctuations in price and/or value and investors may get back less than
originally invested. Certain high-volatility investments can be subject to sudden and large falls in value that could equal or exceed the amount invested. Certain investments
contained in the Product may have tax implications for private customers whereby levels and basis of taxation may be subject to change. If in doubt, investors should seek
advice from a tax adviser. The Product does not purport to identify the nature of the specific market or other risks associated with a particular transaction. Advice in the Product
is general and should not be construed as personal advice given it has been prepared without taking account of the objectives, financial situation or needs of any particular
investor. Accordingly, investors should, before acting on the advice, consider the appropriateness of the advice, having regard to their objectives, financial situation and needs.
Prior to acquiring any financial product, it is the client's responsibility to obtain the relevant offer document for the product and consider it before making a decision as to whether
to purchase the product.
Citi Research product may source data from dataCentral. dataCentral is a Citi Research proprietary database, which includes the Firm’s estimates, data from company reports
and feeds from Thomson Reuters. The source for all referenced prices, unless otherwise stated, is DataCentral. Past performance is not a guarantee or reliable indicator of
future results. Forecasts are not a guarantee or reliable indicator of future performance. The printed and printable version of the research report may not include all the
information (e.g., certain financial summary information and comparable company data) that is linked to the online version available on the Firm's proprietary electronic
distribution platforms.
© 2018 Citigroup Global Markets Inc. Citi Research is a division of Citigroup Global Markets Inc. Citi and Citi with Arc Design are trademarks and service marks of Citigroup Inc.
and its affiliates and are used and registered throughout the world. All rights reserved. The research data in this report is not intended to be used for the purpose of (a)
determining the price or amounts due in respect (or to value) of one or more financial products or instruments and/or (b) measuring or comparing the performance of a financial
product, a portfolio of financial instruments, or a collective investment undertaking, and any such use is strictly prohibited without the prior written consent of Citi Research. Any
unauthorized use, duplication, redistribution or disclosure of this report (the “Product”), including, but not limited to, redistribution of the Product by electronic mail, posting of the
Product on a website or page, and/or providing to a third party a link to the Product, is prohibited by law and will result in prosecution. The information contained in the Product is
intended solely for the recipient and may not be further distributed by the recipient to any third party. Where included in this report, MSCI sourced information is the exclusive
24You can also read