Caffeine Consumption Habits and Perceptions among University of New Hampshire Students
←
→
Page content transcription
If your browser does not render page correctly, please read the page content below
University of New Hampshire
University of New Hampshire Scholars' Repository
Honors Theses and Capstones                                                                                                 Student Scholarship

Spring 2013

Caffeine Consumption Habits and Perceptions
among University of New Hampshire Students
Nicole L. Olsen
University of New Hampshire - Main Campus, nln28@unh.edu

Follow this and additional works at: https://scholars.unh.edu/honors
     Part of the Marketing Commons

Recommended Citation
Olsen, Nicole L., "Caffeine Consumption Habits and Perceptions among University of New Hampshire Students" (2013). Honors
Theses and Capstones. 103.
https://scholars.unh.edu/honors/103

This Senior Honors Thesis is brought to you for free and open access by the Student Scholarship at University of New Hampshire Scholars' Repository.
It has been accepted for inclusion in Honors Theses and Capstones by an authorized administrator of University of New Hampshire Scholars'
Repository. For more information, please contact nicole.hentz@unh.edu.
Caffeine Consumption Habits and Perceptions among
University of New Hampshire Students
Honors Thesis
Nicole Olsen
Marketing
Peter T. Paul College of Business and Economics
Faculty Advisor: M. Billur Akdeniz
Assistant Professor of Marketing
Peter T. Paul College of Business and Economics
Spring 2013CAFFEINE CONSUMPTION HABITS AND PERCEPTIONS
Caffeine Consumption Habits and Perceptions among University of New Hampshire Students
Abstract
College students in today’s society have become dependent on caffeine in order to perform at their
best in multiple facets of their hectic lives, including classes, clubs, and internships. This study
focuses on the specific reasons why college students at the University of New Hampshire are
consuming caffeine, where they purchase it, what types of caffeinated beverages they are consuming,
and how much they are consuming on a daily basis. The results from the study indicate that coffee is
the most popular caffeinated product on campus, and that Dunkin’ Donuts at the MUB is the most
popular place to buy coffee among UNH caffeine consumers. Major situations in which UNH
students consume caffeinated products include when they did not get enough sleep the night before,
before driving long distances, and before studying for an exam. University of New Hampshire
students seem to understand the health benefits and concerns of caffeine intake, are not influenced
by the media or their peers when making caffeine purchase decisions, and very price-sensitive. In
order to gain market share in the UNH community, I recommend that retail locations effectively
target segments of students whose caffeinated beverage preferences align with their product
offerings.
2CAFFEINE CONSUMPTION HABITS AND PERCEPTIONS
Table of Contents
Abstract ............................................................................................................................................................... 2
Introduction ........................................................................................................................................................ 4
Literature Overview ........................................................................................................................................... 7
History ............................................................................................................................................................ 7
Consumption Habits ..................................................................................................................................... 8
Health Concerns ..........................................................................................................................................10
Health Benefits ............................................................................................................................................13
Methodology .....................................................................................................................................................14
Aims and Objectives ...................................................................................................................................14
Study Design and Data Collection ............................................................................................................15
Results................................................................................................................................................................17
Focus Group Results ..................................................................................................................................17
Descriptive Statistics ...................................................................................................................................19
Segmentation and Positioning Analysis ...................................................................................................29
Discussion .........................................................................................................................................................35
Conclusion and Recommendations...............................................................................................................38
References .........................................................................................................................................................42
Figures ...............................................................................................................................................................44
Figure 1 .........................................................................................................................................................44
Figure 2 .........................................................................................................................................................45
Figure 3 .........................................................................................................................................................46
Figure 4 .........................................................................................................................................................47
Figure 5 .........................................................................................................................................................48
Figure 6 .........................................................................................................................................................49
Figure 7 .........................................................................................................................................................50
Figure 8 .........................................................................................................................................................51
Figure 9 .........................................................................................................................................................52
Figure 10 .......................................................................................................................................................53
Figure 11 .......................................................................................................................................................54
Appendix ...........................................................................................................................................................55
Appendix A ..................................................................................................................................................55
Appendix B ..................................................................................................................................................56
Appendix C ..................................................................................................................................................67
3CAFFEINE CONSUMPTION HABITS AND PERCEPTIONS
Introduction
On the University of New Hampshire (UNH) campus, as well as in other college campuses
nationally and internationally, caffeine is a major part of students’ lives. Between exams, homework,
and socializing, students have an increasing demand for caffeinated products. Energy drinks, coffee,
tea, and soda can be seen in UNH students’ hands as they go to class, hang out downtown, or head
out for the night. The University of New Hampshire provides students with a wide assortment of
caffeinated beverages to satisfy this demand, some options healthier than others. This research
focuses on the perceptions of different types of caffeinated beverages among the college student
demographic, main types including energy drinks, soft drinks, coffee, and tea. The research also
covers the frequency of caffeine intake among UNH students, students’ daily expenditures on
caffeine, and the most popular circumstances in which college students consume caffeine. Another
purpose of the study is to find the most popular type of caffeinated beverage on campus, and the
most popular location to buy. This study will also report differences found among different genders,
class years, and colleges.
To begin my research, I conducted a literature review on caffeine consumption in the United
States; covering the history, current statistics on U.S. caffeine consumers, and the health benefits and
concerns surrounding caffeine intake. Through my research on the U.S. population as a whole, I
found that about 90 percent of the adult population ingests caffeine on a daily basis, and the average
American ingests as much as 300 milligrams of caffeine a day, which can equal as much as four cups
of coffee (Hruby, 2012). Forty percent of 18 to 24 year olds, the ages in which students typically
attend college, drink coffee every day ("National coffee drinking," 2012). I also found that more 18
to 24 year olds are turning to coffee rather than caffeinated sodas (Aubrey, 2013). This shows a
trend towards healthier choices in the college demographic. Contrary to that finding, a study of
4CAFFEINE CONSUMPTION HABITS AND PERCEPTIONS
college student consumption found that 50 percent of students drank at least one to four energy
drinks per month (Sifferlin, 2013), which shows that college students are not looking for only
healthy options in their caffeinated beverage choices. Through this research, I found information
about the population as a whole as well as information specific to the University of New Hampshire
campus. I learned the University of New Hampshire proposed to ban the sale of energy drinks in its
retail and vending locations beginning in January 2012. This effort was put forth to further UNH’s
mission to be the healthiest campus community in the country by 2020. The demand from students
for energy drinks on campus was the driving force behind stopping this ban, which shows how
important caffeine is to UNH students.
In my research on caffeine consumption habits on campus, I will utilize focus groups and
survey data to gather all relevant information. Using these sources, I will study UNH students’
perceptions of caffeinated products and caffeine consumption habits. Using the data from the
survey, I will identify and describe the different caffeine consumer segments within the University of
New Hampshire student population through segmentation analysis. I will also create a positioning
map of the four main types of caffeinated products available on campus: coffee, energy drinks, soft
drinks, and tea. This positioning analysis will help me to understand the competition between the
different product offerings on the UNH campus, and see how UNH students perceive each type of
caffeinated beverage. I will use this information to determine which types of caffeinated products,
brands, and stores are the most popular among UNH students. Furthermore, this research will
allow me to figure out potential improvements that stores in the UNH community could make to
their current marketing strategies.
The methodologies of this research consist of secondary data, two focus groups, and a
survey distributed among UNH students. The first step was preliminary research, which consisted of
5CAFFEINE CONSUMPTION HABITS AND PERCEPTIONS
two focus groups of UNH students, held on the UNH campus. In these focus groups, I collected
qualitative data in order to determine important attributes of caffeinated beverages, preferences for
different types of caffeinated beverages, and situational use of caffeine among college students. I
also used the focus group to test the relevance of my survey questions and responses. After this
stage of research, I conducted a survey online using Qualtrics.com, and distributed that survey using
email, Facebook, and Twitter. Quantitative and qualitative analysis was used for the survey results. I
performed statistical analysis on the survey data, including frequencies, descriptive statistics, and
cross tabulations. I also utilized Marketing Engineering for Excel software to perform a
segmentation and positioning analysis of the data.
This research will provide a background for stores on campus to target the college
demographic more effectively. In addition to being beneficial to myself, I believe this project could
benefit other individuals in the University community who may be interested in doing further
research on the subject. It could also be of interest to local stores in the area who sell caffeinated
beverages. This study could benefit those stores in finding their target market among UNH college
students or in understanding the college student demographic as a whole to more effectively market
their products to the right consumers.
This paper will begin with a literature review on the topic, followed by a breakdown of the
methodology, which includes the aims and objectives of the research as well as the study design and
data collection procedures. The results will be presented in order of attainment; with the focus
group findings presented first, followed by the overall descriptive statistics of the data, and lastly the
segmentation and positioning analysis. The discussion section will summarize the main findings of
the study. The study will conclude with recommendations and managerial implications of the study.
6CAFFEINE CONSUMPTION HABITS AND PERCEPTIONS
Literature Overview
History
The history of caffeine in America starts with the introduction of coffees and teas to the
United States in 1670, when the first American coffee trader was granted a license to sell coffee in
Boston. After the Boston Tea Party, coffee became the caffeinated beverage of choice, as tea was
looked upon as unpatriotic (Lumin Interactive, How Coffee changed America). In 1820, German
chemist Friedlieb Ferdinand Runge first isolated a drug in the coffee bean and named it "caffeine,"
meaning something found in coffee. American per capita coffee consumption rose from three
pounds per year to eight pounds per year between 1830 and 1859 (Hruby, 2012). During the Civil
War in the 1860s, coffee was a primary ration for soldiers (Lumin Interactive, How Coffee changed
America). In 1886, the first widely known caffeinated soft drink debuted in Atlanta, Georgia by the
name of Coca-Cola. Coca-Cola, originally invented as a cure to relieve headaches, was made with
natural caffeine from the Kola nut ("The Coca Cola," 2011). Coffee still held the lead as the most
popular beverage, especially with the invention of instant coffee and dehydrated coffee in the early
1900s (Lumin Interactive, How Coffee changed America). The ‘coffee break’ was made popular
among both factory and office workers due to a clever advertising campaign by the Pan American
Coffee Bureau in the 1950’s, which featured slogans like “Give yourself a coffee-break” and “Get
more out of life with coffee” ("NPR: The coffee break," 2002). Coffee surpassed beer as New York
City’s most popular breakfast drink in 1688. The iconic Starbucks brand was founded in 1971,
originally selling beans and coffee brewing equipment). By 1995, Starbucks had become the most
popular coffee shop in the United States, and still holds that title. From 1995 to 2000, coffee
consumption in the U.S. increased by 700 percent (Lumin Interactive, How Coffee changed
America).
7CAFFEINE CONSUMPTION HABITS AND PERCEPTIONS
Today, caffeine plays an integral role in not only the United States, but in various cultures
around the world. In Japanese culture, it is common to have a tea ceremony daily, and the British
have turned drinking tea into a luxurious affair, complete with fine china and scones (Reid). Finland
was rated the most caffeinated country in 2010, and its citizens drink an average of four to five cups
per day, preferring a lighter roast (Paranada, 2010). Americans, in general, prefer a more casual ritual
involving a morning coffee and a doughnut at a local coffee shop, or a latte at a more upscale
Starbucks-like location (Reid).
Consumption Habits
Ninety percent of North American adults consume some form of caffeine on a daily basis,
making this substance the most commonly used drug in the world (Majithia, 2007). There are
currently about 183 million coffee drinkers and about 173.5 million tea drinkers in the United States.
According to an article in the Washington Times, the average American ingests as much as 300
milligrams of caffeine per day (Hruby, 2012). According to a study done by Gallup in July of 2012,
coffee has become more popular than soda among adults, and is especially popular with whites,
middle-aged, and older adults, while nonwhites and younger adults tend to consume more soda than
coffee. Men and women are about equally likely to drink coffee, however, by 69 percent to 45
percent; whites are much more likely than nonwhites to drink it. Coffee drinking is also much more
prevalent among middle-aged (70 percent) and older Americans (74 percent) than among those aged
18 to 34 (44 percent). The study indicates that 64 percent of American adults consume one cup of
coffee on an average day, while only 48 percent of adults have at least one soda daily (Tuttle, 2012).
Among those who drink soda, the average daily amount is 2.6 glasses, with 28 percent drinking one
glass per day and 20 percent drinking two or more glasses. The 2012 Gallup study also revealed that
the amount of coffee consumed per day has declined, as Americans consumed an average of 2.5
cups per day in 2012, compared with 2.9 cups in 1999. This same study found that coffee
8CAFFEINE CONSUMPTION HABITS AND PERCEPTIONS
consumption overall has remained relatively flat since 1999, with 64 percent of Americans drinking
at least one cup of coffee per day, only 1 percent more than in 1999 (Saad, 2012). This lack of
growth is surprising, given the introduction of upscale coffee shops and fast food chains offering
specialty coffee drinks. The introduction of new types of caffeinated beverages to give Americans
their caffeine “fix” could contribute to the lack of increase in overall coffee consumption. According
to an article in TIME magazine, a study of college student consumption found that 50 percent of
students drank at least one to four energy drinks per month (Sifferlin, 2013). Energy drink
consumption has increasingly gained popularity beginning in 1997 with the debut of Red Bull, the
current leader in the energy drink market (Reid). From 2010 to 2011, sales of energy drinks in the
United States grew 15.4 percent, according to Mintel, a market research group (Johnson, 2011).
Since its introduction, other forms of caffeinated products have made their way into the
marketplace, those including caffeinated water, gum, pills, shots, snack foods, liquid caffeine water
enhancers, and even caffeinated air in the form of an inhaler ("Serious warnings surrounding,"). The
lack of growth in coffee consumption could also be due to the fact that Americans are drinking
larger cups or stronger coffee than they did in the past (Saad, 2012). The Center for Science found
that the caffeine content varies widely among different types of caffeinated beverages, and even
among different types of coffee. A 12-ounce cup of coffee from Starbucks contains about 260
milligrams of caffeine, which is about five times more than a 12-ounce can of Diet Coke. Coffee
sold at McDonald's only has about 100 milligrams and Dunkin' Donuts coffee is somewhere in the
middle. Energy drinks have about as much caffeine as a strong cup of coffee, plus ingredients such
as taurine, guarana, vitamin B, ginseng, and ginkgo, that boost energy and alertness more than just
caffeine alone, making the effects of energy drinks difficult to measure (Aubrey, 2013).
Caffeine increases energy, alertness, attentiveness, and sociability for its users. College
students today have a higher need for these types of benefits as they attempt to juggle classes, sports,
9CAFFEINE CONSUMPTION HABITS AND PERCEPTIONS
work, and a social life. The college-aged consumer has unique caffeine consumption habits given
their hectic lifestyle. Their choice in caffeinated beverages, consumption amounts, and frequency of
consumption vary from the average American consumer. The demand for caffeine has greatly
increased among the college demographic in recent years. A survey conducted by the NPD Group,
which tracks trends in what Americans eat and drink, found that more 18 to 24 year olds are turning
to coffee rather than caffeinated sodas. The study found that between 2002 and 2012, the
percentage of 18 to 24 year olds that reported drinking coffee within a two-week period increased
from 25 percent to 39 percent (Aubrey, 2013). According to the latest National Coffee Drinking
Study from the National Coffee Association, 40 percent of 18 to 24 year olds drink coffee every day
("National coffee drinking," 2012). In addition to drinking an increased amount of coffee, college
aged consumers also out-drink adults in soda consumption. The 2012 Gallup study found that more
than half of young adults ages 18 to 34 (56 percent) drink soda every day, compared to only 46
percent of adults ages 35 to 54, and 42 percent of adults ages 55 and older (Saad, 2012). Knowing
this, energy drink companies have been aggressively marketing towards college students. Red Bull,
the leader in the college market, hires campus representatives to hand out free Red Bull on college
campuses and raise awareness of the product. One of the company’s advertised slogans is “Nobody
ever wishes they’d slept more during college” (Johnson, 2011).
Health Concerns
There have been more than 19,000 studies on caffeine and coffee in the past 30 years, most
of which have aimed to uncover the drug's exact effects on the human body (Brain, Bryant &
Cunningham, 2000). Although widely popular among the majority of people around the world,
caffeine intake has been linked to a variety of health issues, both short and long term. Although
moderate caffeine intake is not harmful to the majority of adults, too much can lead to some
unpleasant effects. Caffeine, or trimethylxanthine (Brain, Bryant & Cunningham, 2000), is analeptic,
10CAFFEINE CONSUMPTION HABITS AND PERCEPTIONS
meaning that it stimulates the central nervous system, and ergogenic, meaning that it improves physical
performance. It is also a diuretic, meaning that it causes dehydration (Reid). Consuming more than
500 to 600 milligrams a day may cause insomnia, nervousness, restlessness, irritability, stomach
upset, fast heartbeat, and muscle tremors (Harms). Many studies have shown that people who
consume caffeine have higher rates of kidney and bladder cancer, fibrocystic breast disease,
pancreatic cancer, and osteoporosis. Caffeinated drinks also increase urine output and boost blood
pressure, but this effect is temporary. Caffeine has also been linked to calcium loss, but the effect is
very small and short-term. In a small minority of people, doses of 300 milligrams or more may
prompt an increase in tension, anxiety, and even panic attacks (Reid).
Although there have been links made to these long-term health issues, only short-term
effects of drinking caffeine can be studied and proven. Most short-term disadvantages to drinking
caffeine are classified as withdrawal symptoms, as caffeine is considered a drug. According to an
article published in the National Geographic, a day or so without caffeine can cause headaches,
irritability, a lack of energy, and sleepiness. Compared to withdrawal from more serious drugs, such
as cocaine, withdrawal symptoms from caffeine are much less intense and tend to disappear in two
to four days. Even still, avoiding withdrawal symptoms may be why so many people consume
caffeine each day. Ireland's Stimulant Drinks Committee report advised that consumption of highly
caffeinated beverages should be discouraged in children to prevent possible increases in anxiety or
nervousness (Reid). Some religious groups, such as the Mormon Latter-Day Saints, even advise its
members against consuming caffeinated products, as they feel caffeine can do just as much harm to
the body as other drugs (Stack, 2012). According to a study done by Mayo Clinic, people may
experience different reactions to caffeine depending on regular caffeine consumption, body mass,
age, medication use, and health conditions such as anxiety disorders. Their research also suggests
that men are more susceptible to the effects of caffeine than women (Harms).
11CAFFEINE CONSUMPTION HABITS AND PERCEPTIONS
Caffeine can also have a major impact on sleeping habits. The half-life of caffeine in the
human body can range from 2.5 to 12 hours. Because of genetic differences, some metabolize
caffeine more quickly than others. The typical half-life among adults is about five hours, which
means caffeine typically stays in the body for about 10 hours or longer. Amy Wolfson, of the
College of the Holy Cross in Massachusetts, studied how caffeine influences sleep among
adolescents, and found that high caffeine use is linked to decreased rapid eye movement (REM)
sleep. Wolfson believes that if college students are getting too little or poor quality sleep, it will have
negative implications on their academic performance (Aubrey, 2013). A major health hazard lies in
the ingredients of energy drinks. Along with containing many unfamiliar ingredients, the amount of
caffeine added to energy drinks is not regulated by the U.S. Food and Drug Administration (FDA).
Energy drink companies avoid the FDA caffeine limit, 71 milligrams per twelve-ounce can, by not
referring to their products as soda, and they can contain about 80 milligrams of caffeine per eight
ounce serving (Brain, Bryant & Cunningham, 2000).
A recent trend in the college student demographic is mixing alcohol with energy drinks while
partying, which can mask the effects of alcohol and give drinkers the impression that they have
consumed less alcohol than they have (Sifferlin, 2013). In a study, Caffeinated Cocktails: Energy Drink
Consumption, High-risk Drinking, and Alcohol-related Consequences among College Students, consumption of
alcohol mixed with energy drinks was found to be correlated with higher prevalence of alcohol
related consequences, including being taken advantage of sexually, taking advantage of another
sexually, riding with an intoxicated driver, being physically hurt or injured, and requiring medical
treatment. This study found that almost 25 percent of college student drinkers mix alcohol with
energy drinks and are at increased risk for alcohol-related consequences (O’Brian, McCoy, Rhodes,
Wagoner & Wolfson, 2008).
12CAFFEINE CONSUMPTION HABITS AND PERCEPTIONS
Health Benefits
In contrast to the many perceived disadvantages of consuming caffeine, there are also many
advantages, which may explain why so many people consume the drug on a daily basis. For most
healthy adults, consuming moderate doses of caffeine, or about 200 to 300 milligrams a day, equal to
about two to four cups of brewed coffee, is not harmful (Harms). Studies have shown it can help
relieve pain, thwart migraine headaches, reduce asthma symptoms, and elevate mood. As a mental
stimulant, caffeine increases alertness, cognition, and reaction speed. Although caffeine can
contribute to dehydration, recent studies show that it is not dehydrating in moderate amounts, even
in athletes. Caffeine reduces fatigue, therefore improving performance on tasks like driving,
homework, and playing sports (Reid). In a study was done by Harvard University, involving 126,000
people over an 18 year period, it was found that people who drink one to three cups of coffee per
day are up to nine percent less likely to contract diabetes than those who do not. The same study
also found that people who drank six or more cups of coffee per day decreased their chances of
contracting diabetes by 30-54 percent. The Harvard study also found that regular coffee drinkers
were 80 percent less likely to develop Parkinson's disease, 20 percent less likely to get colon cancer,
80 percent less likely to develop cirrhosis, and 50 percent less likely to develop gallstones compared
with those who did not consume caffeine. Caffeine is being studied further for its potential benefits
in battling Parkinson's disease, Alzheimer's and cancer (Brain, Bryant & Cunningham, 2000). Recent
studies link coffee consumption to a range of good health effects, including decreased risk of
dementia and decreased risk of depression among women (Aubrey, 2013). Studies have also
suggested that caffeine is beneficial in treating asthma and preventing cavities (Brain, Bryant &
Cunningham, 2000).
Unlike many other drugs, caffeine has rarely been abused. Jack Bergman, a behavioral
pharmacologist in the department of psychiatry at Harvard Medical School, reported that caffeine
13CAFFEINE CONSUMPTION HABITS AND PERCEPTIONS
overuse tends to stop itself. He found that the user typically stops consumption after getting jittery
and uncomfortable from consuming too much caffeine. Although it advised to prevent children
from consuming caffeinated products, there is no conclusive evidence about whether caffeine is
harmful to children in small amounts. A report from the Australia New Zealand Food Authority
concluded that children metabolize caffeine more quickly and there was no reason to suspect that
they are more sensitive to its effects than adults. Studies have shown that pregnant women can
consume 300 milligrams of caffeine per day without harming the child. After decades of testing,
caffeine remains on the FDA's list of food additives that are "generally recognized as safe" (Reid).
Looking at all of the studies on caffeine and its effects, it is very hard to argue that moderate
consumption harmful. Although some issues have been linked to caffeine consumption, no long-
term health issues have been proven to be the direct result of moderate caffeine consumption. It is
also important to note that many of the health concerns stem from other additional ingredients
added to caffeinated beverages, such as sugar, taurine, and guarana, which boost energy more than
one could measure and contribute to other health problems such as diabetes.
Methodology
Aims and Objectives
The objectives of this study are to research the perceptions of different types of caffeine intake
among the college student demographic, main types including energy drinks, soft drinks, coffee, and
tea. The study will focus on the frequency and amount of caffeine intake among University of New
Hampshire students for each type of caffeine, and then compare that to how college students view
each caffeine type. It will also research the circumstances in which college students drink each type
of caffeine, such as for insufficient sleep, to increase energy, while studying, driving long periods of
14CAFFEINE CONSUMPTION HABITS AND PERCEPTIONS
time, drinking with alcohol while partying, and to treat a hangover (Heidel). The perceived benefits
and disadvantages of drinking each type of caffeine are also of interest in this research study. For
each type and for each circumstance, the study will research the frequency of consumption and also
report differences in gender, class year, college, and age. The specific aims of the study are as
follows:
To measure frequency of caffeine consumption among college students at the University of
New Hampshire and among different segments of the college demographic.
To determine situations and reasons in which college students consume caffeine and reasons
for doing so.
To identify the types of caffeine consumed on campus and most popular caffeine intake for
UNH students.
To determine the leaders in the caffeine industry among college students, including the most
popular type of caffeine, the most popular distribution channel, and the most popular
brands for each type of caffeine.
To examine the student perceptions of different forms of caffeine and the perceived
advantages and disadvantages of the different types of caffeinated products.
To segment the UNH consumer market into different groups and pick a target segment for
each type of caffeine.
To examine trends in caffeine consumption among college students in the community and
throughout the U.S. and use those trends to make predictions for the future.
To make recommendations to businesses in the local community on their marketing
strategies.
Study Design and Data Collection
On March 14, 2013, I received written approval from the Institutional Review Board (IRB)
to pursue my research on caffeine consumption habits among UNH students. Please see Appendix
A to view the official letter of approval. Two focus groups consisting of 5-6 UNH students were
conducted and participants were asked open-ended questions regarding situations in which they
consume caffeinated products, the factors that cause students to consume caffeine, the most
common caffeinated products college students were using, frequency patterns, and the advantages
and disadvantages of consuming caffeine. Participants were also asked questions particular to the
15CAFFEINE CONSUMPTION HABITS AND PERCEPTIONS
UNH campus, such as the most popular place to buy caffeinated products on campus, and what
advertisements or promotions were effective in getting college students to purchase caffeine (see
Appendix C). This was done to allow test research questions, edit the online survey, and ensure its
relevance among UNH students. A 32-question online survey was developed using Qualtrics.com
that assessed consumption patterns of caffeinated products among college students (see Appendix
B).
Estimated total enrollment at the University of New Hampshire is currently 15,000 students,
including undergraduate and graduate students. The survey distribution goal was to obtain an
estimated 100 responses. The survey was distributed using email and social media, such as Facebook
and Twitter. The survey was sent through email to every student on the Paul College email list
through Paul College Directed Communications. In order to get an unbiased number of responses
from all of the colleges within the University of New Hampshire, the survey was emailed to
professors in other colleges who were currently teaching a course at UNH on the Durham campus.
With this distribution strategy, the survey returned an initial 342 responses, which surpassed the
initial goal. Of those respondents who took the survey, 335 attended the University of New
Hampshire, Durham campus. Those who did not attend were not included in the research study, as
the focus was on those who attended the Durham campus. Of those who attended the University of
New Hampshire, 251 students consumed caffeine, which was equal to 74.93 percent. All subsequent
analyses are restricted to those UNH students who consume caffeine.
16CAFFEINE CONSUMPTION HABITS AND PERCEPTIONS
Results
Focus Group Results
Two focus groups were conducted on campus to learn more about advantages and
disadvantages of consuming caffeine, situations in which college students consume caffeinated
products, the factors that cause students to consume caffeine, the most common caffeinated
products college students were using, and frequency patterns. To find out more about UNH
students, participants were asked about the most popular place to buy caffeinated products on
campus, and what advertisements or promotions were effective in getting college students to
purchase caffeine. Only one person from both focus groups did not consume caffeine, and this was
due to her religious beliefs. Of the remaining participants, the average caffeine consumption
frequency ranged from 2-6 times per week, depending on their schedule, amount of work they had
to do, and their mood.
Participants found caffeine to be advantageous for its effects on staying awake, getting good
grades, being able to focus, being better able to socialize. Some participants noted that caffeine is a
safer alternative to using Adderall or other drugs for these purposes. Participants said that most
people consider caffeine as a drink, not a drug, and that students do not realize how easy it is to
become addicted. They also stated that instead of being an alternative, it could act as a gateway drug
to other drugs or behaviors. Focus groups participants said that caffeine helps them to wake up in
the morning, even noting that they “wouldn’t do anything all day without it.”
Although most participants found caffeine to be very helpful in their day-to-day lives, they
were also very aware of some disadvantages of using the drug. Most participants agreed that
purchasing caffeinated beverages every day is expensive, especially when college students do not
make much discretionary income. They also noted that the cost of driving to purchase caffeinated
17CAFFEINE CONSUMPTION HABITS AND PERCEPTIONS
products every day adds up, and the time spent purchasing is a hassle and inconvenience. Addiction
was a main disadvantage found among both groups, and participants focused on the withdrawal
symptoms as being some of the most important disadvantages. Some of these symptoms include
headaches, crankiness, and tiredness. One participant who admitted to be addicted to caffeine,
stated, “Coffee runs my life.” Of lesser importance were the long-term health concerns of the drug,
as only one participant noted that caffeine could be bad for the heart. One participant said she
perceived alcoholic beverages as being healthier than caffeinated beverages, stating that one can of
soda changes her mood more than one can of beer. On the contrary, one participant said that
consuming caffeine is just about a mindset, and sometimes just buying it will make them feel more
awake.
The top three situations in which focus groups participants consumed caffeine were to wake
up, to accomplish things throughout the day, and for the taste. The type of caffeinated products that
performed best in those situations were Red Bull and coffee. The top three occasions or situations
where focus group participants consume caffeinated products were the night before an exam, at
their job to be more productive, and to be social when going out. Other circumstances include going
to class, spending time with friends while getting coffee, and while doing homework.
The caffeinated products that participants said they consumed were coffee (all types),
espresso (in cappuccinos or lattes), soda, iced and hot tea, energy drinks (Red Bull, Amp Energy,
and Starbucks Refreshers), ice cream (coffee flavor), and chocolate. When asked what they thought
was the most popular place to buy caffeinated products on the University of New Hampshire
campus, participants thought it was either Dunkin’ Donuts in the MUB or Aroma Joe’s. They
thought that before Aroma Joe’s opened, which was last year, Breaking New Grounds was the
leader in coffee sales on campus. Among the participants of one group, the Coffee Station (The
18CAFFEINE CONSUMPTION HABITS AND PERCEPTIONS
Hut) was very popular, and most participants purchased coffee there at least three times per week.
Philbrook café, the coffee carts on campus, and the grocery store were also popular places they
though students went to buy caffeinated beverages.
When asked about promotions on campus that may have affected their caffeine purchase
decision, many participants said that the UNH Dining promotion for the free flavor shot with the
purchase of Red Bull was very effective in getting them to buy. They also noted that they may have
bought a caffeinated beverage anyways, but they chose Red Bull because they felt they were getting a
better value. Contrary to this, one participant said that she would never buy Red Bull because it is
unhealthy and too expensive. When asked what discount would convince them to buy any
caffeinated beverage, most said that a 50 percent off coupon would be an attractive offer. Free
coffee is also a very effective promotion for college students, one participant recalling the promotion
to give blood and get a free coffee at Union Court in the MUB. The participants said coupon books,
which are distributed around campus every semester, are an effective way to raise awareness of new
stores as well as to entice students to purchase for a percentage off. A few participants said that they
were so dependent on coffee, their decision of whether to buy or not was not affected by
promotions. However, they may be more apt to try a new product if they were offered free samples
or at least a 10 percent discount. A 50 percent off discount may persuade participants to buy if they
were not planning on buying previously. Many students did agree that when they want or need
caffeine, they are going to get it, discount or not. The decision that could be influenced is what type
of caffeine, and furthermore what brand, they decide to purchase.
Descriptive Statistics
Of the 251 students who both attended the University of New Hampshire in Durham and
consumed caffeine, 26 percent were male and 74 percent were female. The gender ratio at the
19CAFFEINE CONSUMPTION HABITS AND PERCEPTIONS
University of New Hampshire is 46 percent male and 54 percent female, but the discrepancy may
have been due to the fact that females are more likely to take surveys than males. The majority of
participants, 66 percent, were between 18 and 21 years old. Thirty-two percent of participants were
between 22 and 34 years old. The highest percentage of respondents, 33 percent, were in their senior
year at the University of New Hampshire. Juniors (25 percent), sophomores (19 percent), freshmen
(13 percent), and graduate students (10 percent) also contributed to the results. As seen in Figure 1,
the highest number of responses were from students enrolled in the College of Liberal Arts (24
percent) and Paul College (23 percent). Eighty-one respondents (32 percent) started drinking
caffeinated products between the ages of 12 and 16, and 64 respondents (25 percent) started to
drink caffeine between ages 16 and 18. The majority of respondents (51 percent) spent less than
$2.00 on caffeinated products per day (see Figure 2).
Survey respondents rated the importance of fourteen attributes on a scale of 1 to 6, with 1
being “Not at all important” and 6 being “Extremely important”. The attributes were caffeine content
(how much caffeine), freshness of the product, health benefits, taste, popularity among friends, convenient location,
brand name, price, quality of product, and whether you have plans for the night, whether you have an exam, and the
time of day (morning, night, etc.). Of these attributes, taste had the highest average rating, 5.36, meaning
taste was the most important attribute to college students when buying caffeinated products. The
second most important attribute was quality of product, with an average rating of 5.00. Surprisingly,
price was of third importance, with an average rating of 4.66. Freshness and convenient location were of
equal importance among UNH students, with an average rating of 4.56. The two least important
attributes among survey respondents were popularity among friends (2.03) and packaging (2.79).
Survey respondents also ranked different caffeinated products’ performance on certain
attributes on a scale of 1 to 5, with 1 being “Poor” and 5 being “Excellent”. These attributes were
20CAFFEINE CONSUMPTION HABITS AND PERCEPTIONS
caffeine content (how much caffeine the product contains), freshness of the product, health benefits, taste, popularity
among friends, convenient location, brand name, availability of product in stores, price, quality of product, and
packaging. Individual ratings were done for four types of caffeinated products: coffee, caffeinated tea,
soft drinks, and energy drinks. Of all attributes of coffee, the attribute that respondents felt coffee
performed best on was convenient location, with an average performance rating of 3.92. Of all attributes
compared on coffee, coffee performed worst on the attribute health benefits, with an average rating of
2.52. The attribute that respondents felt caffeinated tea performed best on, among all attributes of
caffeinated tea, was health benefits, with an average performance rating of 3.76. Of all attributes of
caffeinated tea, caffeinated tea performed worst on the attribute popularity among friends, with an
average rating of 2.66. The attribute that respondents felt that soft drinks performed best on was
availability of product in stores, with an average performance rating of 3.89. Of all attributes, soft drinks
performed worst on health benefits, with an average rating of 1.58. The attribute that respondents felt
that energy drinks performed best on was caffeine content, with an average performance rating of 3.79.
Of all attributes compared on energy drinks, energy drinks performed worst on health benefits, with an
average rating of 1.30.
Discrimination questions were used to learn more about the University of New Hampshire
caffeine consumers as a whole. Respondents were asked to rank questions on how much they agreed
with them. The rank was from 1 to 5, with 1 being “Strongly Disagree” and 5 being “Strongly
Agree.” The questions helped to understand buying habits and feelings about caffeinated products.
Key findings include questions that were ranked very low or very high among all UNH students.
Overall, the media and celebrities do not influence University of New Hampshire caffeine
consumers when purchasing caffeinated products, as shown by the low mean (1.45) and therefore
disagreement with the statement the media and celebrity endorsers influence which type of caffeine you prefer.
Peers are not influential in UNH students’ decision making when purchasing caffeine, as shown by
21CAFFEINE CONSUMPTION HABITS AND PERCEPTIONS
the mean rating of 1.59. TV advertisements are also not effective in persuading UNH students to
buy certain caffeinated products (1.65). Most students disagreed with the statement you drink
caffeinated products mostly at night, as shown by an average rating of 1.88. Students do agree that
consuming too much caffeine is unhealthy (4.20) and mixing caffeine with alcohol is very dangerous
(3.84). Most students disagreed somewhat (2.02) when asked if they were addicted to caffeine.
Among the University of New Hampshire caffeine consumers, coffee is the caffeinated
product of choice, with 77.3 percent of students consuming coffee (see Figure 3). About 81 percent
of UNH females consume coffee versus 66.67% of males. Sixty-one percent of students consume
caffeinated tea, 43.8 percent consume caffeinated soft drinks, and 31.9 percent consume energy
drinks. The less popular caffeinated products were those that were not typical caffeinated beverages.
Only 4 percent of the University of New Hampshire caffeine consumers purchase energy shots, 2.4
percent consume caffeine pills, and only 0.8 percent of students consume caffeinated gum. Other
products consumed included espresso beans and Clif Shot Blok Energy Chews, which are chewable
cubes with 50 milligrams of caffeine ("Clif bar & company,”).
Of those students who consume coffee (194 respondents), 74.2 percent purchase and
consume made-at-home coffee, such as coffee grounds and K-cups. Almost all coffee drinkers on
the University of New Hampshire campus, 94 percent, purchase coffee at coffee shops. 24.7 percent
purchase pre-made coffee drinks at stores, and less than 1 percent of students consume coffee
somewhere else, such as the dining hall. The largest percentage of coffee drinkers on the University
of New Hampshire campus, 61.9 percent, purchase coffee from the Dunkin’ Donuts at the
Memorial Union Building (MUB). 40.7 percent of the University of New Hampshire coffee drinkers
purchase coffee at Breaking New Grounds and 39.2 percent of coffee consumers have purchased
coffee at Aroma Joe’s, both on Main Street. 31.4 percent of students who drink coffee purchase it at
22CAFFEINE CONSUMPTION HABITS AND PERCEPTIONS
Dunkin’ Donuts inside Irving, 20.1 percent at Zeke’s Café, and 14.4 percent purchase it at the Hut.
The less popular stores on campus to purchase coffee include Philbrook Café (13.4 percent), Union
Court (12.3 percent), the Works (11.3 percent), Albert’s Café (10.3 percent), Wildcattessen (9.7
percent), the Dairy Bar (7.7 percent), and Gables Café (6.2 percent). Overall, 79.9 percent of the
University of New Hampshire coffee drinkers (155 out of 194) purchase coffee at the University of
New Hampshire Dining establishments, which consists of Zeke’s Café, Philbrook Café, Union
Court, Albert’s Café, the Dairy Bar, and Gables Café, but not counting the new Peter T. Paul
College café, Cornerstone 1926. Of coffee drinkers on the UNH campus, 4.6 percent purchased
coffee at somewhere other than the places listed above, including the new café, Cornerstone 1926.
Five percent of the University of New Hampshire coffee drinkers do not purchase coffee on
campus. 61.9 percent of coffee drinkers purchase coffee at the food and coffee carts around
campus. Higher Grounds is the most popular among students who purchase coffee at coffee carts;
42.5 percent of the total 120 students who purchase coffee at coffee carts purchase it here.
RRRamon’s Food and Coffee attracts 30 percent of student coffee carts buyers, and Wild Child
Express attracts 27.5 percent of coffee drinkers who purchase coffee at coffee carts on campus.
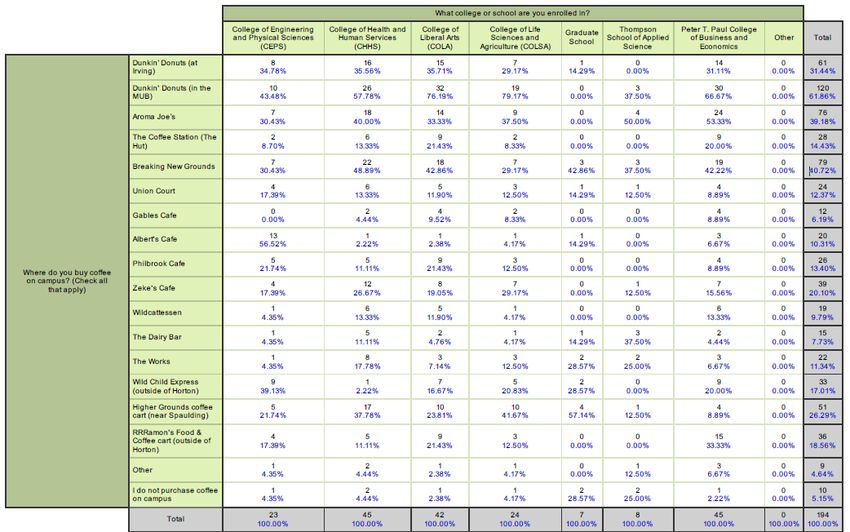
Dunkin’ Donuts in the MUB is also most popular among Peter T. Paul College of Business and
Economics students, as shown in a crosstab of What college or school are you enrolled in? by Where do you
buy coffee on campus? (Appendix A). The majority of Peter T. Paul College of Business and Economics
students, 66.67 percent, purchase coffee from this location. Aroma Joe’s (53.33 percent) and
Breaking New Grounds (42.22 percent) are also popular among Paul College students. Dunkin’
Donuts in the MUB is also the most popular location to buy coffee among College of Health and
Human Services students (57.78 percent), College of Liberal Arts students (76.19 percent), and
College of Life Sciences and Agriculture students (79.17 percent). Albert’s Café was most popular
(56.92 percent) among College of Engineering and Physical Sciences students, as that café is located
23CAFFEINE CONSUMPTION HABITS AND PERCEPTIONS
in Kingsbury, the engineering building on campus. Breaking New Grounds was the most popular
location to buy coffee among Graduate School students (42.86 percent), and Thompson School of
Applied Science students prefer Aroma Joe’s to any other location on campus (50 percent).
Of those students who consume caffeinated tea (153 respondents), 89.5 percent purchase
and consume made-at-home tea, such as tea bags and mixes. 48.4 percent of tea drinkers on the
University of New Hampshire campus purchase caffeinated tea at coffee shops. 35.3 percent of tea
drinkers purchase store-bought, pre-made tea drinks at stores, and 2 percent of students purchase
tea somewhere else, such as the dining hall or make their own from loose leaves. A large percentage
of student tea drinkers, 39.2 percent, do not purchase caffeinated tea products on campus. 18.3
percent of tea drinkers said they purchased tea products at somewhere other than what was listed,
and specified that Dunkin’ Donuts, Breaking New Grounds, and the new Paul College café,
Cornerstone, were where they bought caffeinated tea. They also mentioned that the University of
New Hampshire dining halls provided them with tea so that they did not have to purchase it. 22.2
percent of caffeinated tea drinkers at the University of New Hampshire purchased tea at the
Durham Marketplace, 16.3 percent purchased tea at Zeke’s Café in the library, 13.1 percent
purchased tea products at Union Court, and 7.2 percent purchased tea at Aroma Joe’s. 9.2 percent
purchased tea at Philbrook café, 7.2 percent purchased tea at Wildcattessen, and 5.2 percent of the
University of New Hampshire tea drinkers purchased caffeinated tea at Campus Convenience. Less
than 5 percent of student tea consumers purchased tea products at each of the following: the Hut,
Gables Café, Albert’s Café, the Dairy Bar, The Works, Tedeschi’s (Store-24), and Circle K (at
Irving).
Lipton is the most popular brand among students who consume and purchase caffeinated
tea on campus, with 53.7 percent of the University of New Hampshire tea drinkers purchasing this
24CAFFEINE CONSUMPTION HABITS AND PERCEPTIONS
brand of tea. Tazo Tea (50.54 percent), AriZona (44.1 percent), Snapple (38.7 percent), Arnold
Palmer (36.6 percent), and Honest Tea (31.2 percent) are among the most popular brand on campus
among those who consume caffeinated tea. Other tea brands that UNH students consume include
Nestea (22.6 percent), FUZE (12.9 percent), SoBe (5.4 percent), and Sweet Leaf (4.3 percent). The
students who buy other brands than those listed (11.83 percent) purchase Twinings, Bigelow, Yogi,
Celestial Seasonings, and Stash.
Of the students that consume energy drinks (80 respondents), 42.5 percent purchase from
Zeke’s Café in the University of New Hampshire’s Dimond Library. Union Court, in the Memorial
Union Building, is another popular place to buy energy drinks on campus, with 35 percent of all the
University of New Hampshire energy drink consumers purchasing their energy drinks at that
location. Other popular locations to purchase energy drinks on campus include Wildcattessen (31.25
percent), Durham Marketplace (28.75 percent), Circle K at Irving (27.5 percent), and Tedeschi’s
(27.5 percent). Philbrook Café and Aroma Joe’s seem to be equally as popular among the University
of New Hampshire energy drink consumers, with 23.75 percent of students purchasing from both
of these locations. Campus Convenience, referred to as “CampCo” among UNH students, is the
next in popularity, with 21.25 percent of students purchasing energy drinks here. Less common
locations to buy energy drinks include Gables Café (16.25 percent), Albert’s Café (7.5 percent), the
Hut (5 percent), the Dairy Bar, and the Works (both 1.25 percent). Ten percent of energy drink
consumers do not purchase energy drinks on campus, and 6.25 percent purchase at a location not
listed, such as Rite Aid, RRRamon’s, Phillip’s 66, and Breaking New Grounds. Of all energy drink
brands on the University of New Hampshire campus, Red Bull is the clear winner, with 94.44
percent of energy drink consumers at the University of New Hampshire purchasing this brand. The
next most popular brand on campus is Monster, but still only 15.28 percent of the University of
New Hampshire energy drinkers consume this brand. Other brands consumed include Rockstar
25You can also read