National Hydrogen Scenarios - How many stations, where, and when? - Locations Roadmap Working Group - NREL
←
→
Page content transcription
If your browser does not render page correctly, please read the page content below

National
Hydrogen
Scenarios
How many stations, where, and when?

     October 2017

  Locations Roadmap Working Group
ii | National Hydrogen Scenarios

Disclaimer
Since fuel cell electric vehicles (FCEVs) went on sale to the public in California in the fall of 2015, auto original
equipment manufacturers (OEMs) and hydrogen station developers have gained real-world experience about the
refueling patterns and preferences of FCEV customers. In review of these learnings, OEMs and the State of California
have developed target locations for the next phase of hydrogen station build-out in California. Similarly in the
Northeast, OEMs are working with station developers and public stakeholders to coordinate next steps.

An understanding of consumer demand, balanced with sound business cases for new hydrogen stations, is essential
in the successful build-out and growth of the hydrogen station network. This goal can be more readily attained by
increasing communication between multiple stakeholders, including public officials, investors, auto OEMs, station
developers, and other decision makers.

H2USA members and working groups adhere to strict anti-trust guidelines. The information shared between Locations
Roadmap Working Group members adhered to these anti-trust guidelines. Development of the analysis for this
report occurred in parallel with the deployment of FCEVs into the early market. The resulting scenarios in this report
represent the future potential of the network image. The contents of the present report therefore represent a very
general means of achieving the common goal of hydrogen station network growth. Any forward-looking statements
should not be interpreted as basis for making business decisions or investment decisions.

                                                                                        National Hydrogen Scenarios | iii
Acknowledgements
This report has been developed by the H2USA Locations Roadmap Working Group and approved for publication by
H2USA members. The contents reflect the result of many working group discussions and reviews, as well as reviews
and feedback provided by several different stakeholders. Key contributors include the co-chairs of the Locations
Roadmap Working Group, Stephen Ellis (American Honda Motor Company) and Marc Melaina (National Renewable
Energy Laboratory), as well as Brian Bush (National Renewable Energy Laboratory), Matteo Muratori (National
Renewable Energy Laboratory), and Jarett Zuboy (Independent Contractor). The full list of Locations Roadmap
Working Group members is provided in the Appendix.

This work has been authored by employees of the Alliance for Sustainable Energy, LLC (“Alliance”) under Contract
No. DE-AC36-08GO28308 with the U.S. Department of Energy (“DOE”). The U.S. Department of Energy’s Fuel Cell
Technologies Office within the Office of Energy Efficiency and Renewable Energy (EERE) provided support for this
work. The views and opinions of authors expressed herein do not necessarily state or reflect those of the United
States government or any agency thereof. Toyota Motor Company provided support for station location analyses
conducted by the University of California, Irvine, for the Northeast states, which have been used to develop station
rollout scenarios in the Northeast. Similarly, the scenarios rely on successful strategies developed through many years
of planning, coordination, and resource development conducted by the California Fuel Cell Partnership, California
Energy Commission, California Air Resources Board, and California Governor’s Office.

This report should be cited as:

Melaina, M., B. Bush, M. Muratori, J. Zuboy and S. Ellis, 2017. National Hydrogen Scenarios: How Many Stations, Where,
and When? Prepared by the National Renewable Energy Laboratory for the H2USA Locations Roadmap Working
Group. http://h2usa.org/sites/default/files/H2USA_LRWG_NationalScenarios2017.pdf.

iv |   National Hydrogen Scenarios

Acronyms
EAM    Early Adopter Metric                  mpge   Miles per gasoline gallon equivalent
FCEV   Hydrogen fuel cell electric vehicle   ROC    Rest of country
HRS    Hydrogen refueling station            ZEV    Zero-emission vehicle
LDV    Light-duty vehicle

                                                                                           National Hydrogen Scenarios | v
Executive Summary
Technological advances are transforming personal                last two decades, California’s successful planning and
mobility, providing improved safety, automated                  execution of coordinated FCEV adoption and hydrogen
driving, enhanced vehicle performance, and increased            refueling station deployment can serve as a valuable
sustainability. Hydrogen fuel cells are a key technology        resource for other states and regions in their hydrogen
option within this transformation. As fully zero-emission       infrastructure development efforts. The following
electrified vehicles, hydrogen fuel cell electric vehicles      planning processes have been key ingredients of
(FCEVs) can refuel in 3–5 minutes to a range of 360             California’s historical success:
miles or more and can be scaled from small sedans for
personal use to large line-haul trucks and car or truck         1. Quantify FCEV market potential and automaker
platforms in between. When compared to conventional                commitments.
gasoline vehicles, FCEVs provide a range of economic,           2. Establish financial support mechanisms for hydrogen
energy security, public health, and environmental                  refueling station investments.
benefits for the nation without requiring consumers             3. Establish FCEV market support mechanisms.
to compromise on vehicle size or performance (NRC
                                                                4. Implement station network planning and
2013). Several FCEVs are commercially available today.
                                                                   coordination tools.
However, the lack of convenient and extensive networks
of hydrogen refueling stations is limiting market growth.The success of government-industry partnerships in
                                                         California, along with comparable initiatives in Europe
A significantly larger network of retail hydrogen stations
must be established before FCEVs can be sold to the      and East Asia, are laying the foundations for global
general public in a broad, geographically diverse manner FCEV market growth by funding hydrogen stations.
similar to conventional                                                                 Although additional U.S.
vehicles.                                                                               cities, states, and industry
                                                                                        partnerships may follow a
This report was                      Technological advances are                         slightly different process,
developed within
                                     transforming personal mobility,                    these four strategies
the framework of the                                                                    have been demonstrated
U.S. public-private                  providing improved safety,                         as successful methods
collaboration known                  automated driving, enhanced                        to reduce investment
as H2USA, with                                                                          risks and leverage the
approximately 50                     vehicle performance, and increased
                                                                                        effectiveness of public
partners committed                   sustainability. Hydrogen fuel cells                and private funds in the
to enabling hydrogen
infrastructure for FCEV              are a key technology option within                 development of hydrogen
                                                                                        station networks.
adoption. The report             this transformation.
examines development                                                                        In this report, an internally
scenarios for hydrogen                                                                      consistent analytic
station networks                                                                            modeling method
needed to support a national rollout of FCEVs in the      simulates how station networks might develop across
United States. As FCEV prices decrease and the variety    cities and regions, assuming that successful planning and
of available FCEVs increases over the next 5–10 years,    coordination activities result in a rollout of FCEVs and
a select number of urban, state, and regional markets     stations similar to California’s. The report’s three scenarios
can help establish the station networks required for      capture some of the variations that might occur as FCEV
FCEV market growth. California is fully engaged in this   markets and station networks expand.
station funding and deployment process today, and a
                                                          In the Urban Markets scenario, FCEV markets are driven
number of other states are showing interest, primarily in
                                                          by a combination of consumer demand, initiatives
the northeast but also in Hawaii, Texas, Ohio, and South
                                                          implemented by individual cities, and stakeholder focus
Carolina to name a few. Based on experience over the
                                                          on the most promising urban markets. The State Success

vi |   National Hydrogen Scenarios
scenario achieves a higher level of FCEV market adoption than does the
Urban Markets scenario, with FCEV sales primarily driven by the Zero Emission
Vehicle (ZEV) mandate and other market support mechanisms, which are
complemented by strong stakeholder planning and coordination in ZEV states.
The National Expansion scenario achieves the highest levels of FCEV adoption,
with FCEV markets and station network development responding to consumer
demand, strong market support initiatives implemented at city, state, and
national levels, as well as aggressive stakeholder coordination and planning
across economically integrated megaregions.

These scenarios are not forecasts of future market outcomes. Rather, they
provide insight to various public and private stakeholders engaged in the
planning and coordination required to help facilitate their own station
networks, while reducing hydrogen station investment risks. Early markets
for alternative fuel vehicles are widely acknowledged as difficult to develop—
these scenarios are meant to help stakeholders better understand and
potentially leverage California’s past lessons and ongoing efforts to build
momentum for national FCEV market growth while respecting their own
differences, processes, and local knowledge.

The following conclusions and insights are supported by the scenario results:

• Robust networks of hydrogen stations must be established in advance of
  selling large volumes of FCEVs into any given urban area. Following the
  rollout of stations planned for California, by 2025 a total of 320–570 additional
  stations would be required both in California and nationwide to enable
  significant FCEV market growth. Intensive stakeholder coordination and
  planning activities should precede the introduction of these initial stations to
  ensure progress toward a national milestone of “500 in 2025.”

• There are multiple means of achieving FCEV market growth beyond
  California. Although the ZEV mandate has been a key policy driver in
  California, high concentrations of early adopters in other cities and states—
  combined with track records of strong support for advanced vehicles—
  suggest many other markets are promising for FCEV sales and hydrogen
  station investments.

• Large cities with high concentrations of early adopters and strong market
  support mechanisms, as demonstrated in California, are assumed to be
  the most promising markets for introducing FCEVs and hydrogen station
  networks. With adequate market support mechanisms in place, these
  markets could prove to be the most promising options for rapidly achieving
  vehicle growth and substantial hydrogen demand, thereby reducing the
  financial risk posed to hydrogen station investors.

• The market potential for hydrogen station networks is large. The scenarios
  portray a national network of approximately 1,500–3,300 hydrogen
  stations by 2035, with a hydrogen capacity of 1.3 million to 3.4 million kg/
  day, serving 1.8 million to 4.5 million FCEVs. Assuming average hydrogen
  prices of $8–$10 per kg, annual revenues would be around $3.0 billion to
  $9.2 billion. Based upon the scenario results, the largest and most robust
  segments of these station networks would initially be located in a select
  number of major urban areas where a track record of surrogate vehicles has
  already paved the way for FCEVs.
                                                                                      National Hydrogen Scenarios | vii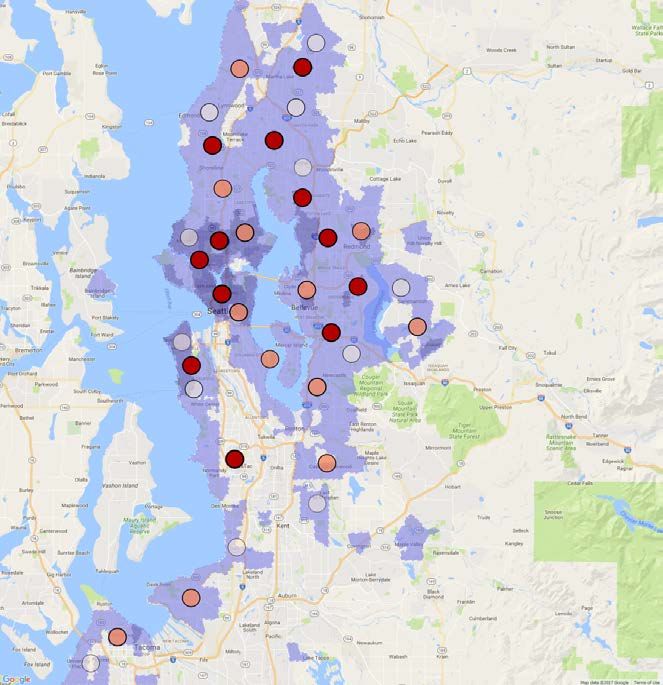
Table of Contents
1 Introduction............................................................................................................................................................................................................1
      1.1 International Context..................................................................................................................................................................................4
      1.2 Purpose of this Report...............................................................................................................................................................................5
2 The California Precedent...................................................................................................................................................................................6
3 Hydrogen Infrastructure Scenarios...............................................................................................................................................................8
      3.1 Overview of Analytic Methods................................................................................................................................................................8
      3.2 Scenario Results..........................................................................................................................................................................................9
      3.3 Fuel Cell Electric Vehicle Market Growth Scenarios.......................................................................................................................11
      3.4 Hydrogen Station Network Development........................................................................................................................................13
4 Scenario Results................................................................................................................................................................................................. 15
5 Summary and Conclusions.............................................................................................................................................................................21
Appendix: .................................................................................................................................................................................................................23
References............................................................................................................................................................................................................... 25

Figures
Figure 1. Commercially available FCEVs (top) and examples of limited-production FCEVs (bottom) ....................................2
Figure 2. Existing and planned stations in Northern (top) and Southern (bottom) California (CEC 2017a; CEC 2017c;
AFDC 2017; CARB 2017)........................................................................................................................................................................................3
Figure 3. Existing and planned hydrogen refueling stations in Europe and East Asia (LBST 2017).........................................4
Figure 4. Basic components of a continuous cycle of support for early FCEV and HRS markets.............................................7
Figure 5. U.S. population across urban areas and regions. Megaregions indicate frequency and geographic extent of
household vehicle commuting patterns..........................................................................................................................................................9
Figure 6. FCEV sales by scenario compared with total U.S. LDV sales................................................................................................11
Figure 7. Breakdown of FCEV sales by period and region.......................................................................................................................12
Figure 8. Market activation station example: Seattle, Washington (Map data: Google).............................................................. 14
Figure 9. Number of FCEVs on the road and total HRSs by scenario and region.......................................................................... 15
Figure 10. Population with access to hydrogen refueling by scenario................................................................................................ 16
Figure 11. Number of stations and average capacity for select urban areas in 2025 ................................................................... 18
Figure 12. Number of stations and average capacity for select urban areas in 2035.................................................................... 19
Figure 13. Number of stations and average capacity for select urban areas in 2050..................................................................20

Tables
Table 1. Status of hydrogen fuel cell electric vehicles and hydrogen refueling stations in 2016 and future planned
stations by country..................................................................................................................................................................................................4
Table 2. Scenario geographic scales and time periods...............................................................................................................................8
Table 3. Market influences by scenario...........................................................................................................................................................10
Table 4. Summary of scenario results by period.........................................................................................................................................22

viii |            National Hydrogen Scenarios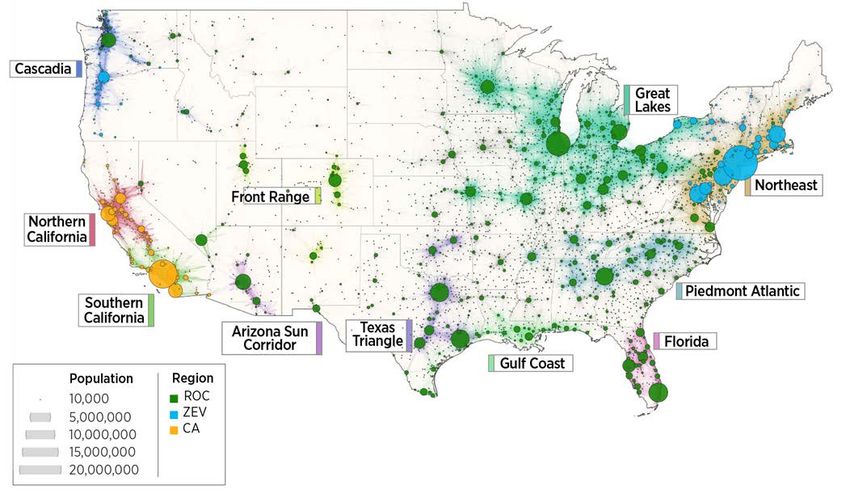
1 Introduction
Hydrogen fuel cell electric vehicles (FCEVs) are one of                  the development of prototype FCEVs and completion
several promising advanced transportation technologies                   of several real-world retail consumer demonstration
that can help to address the nation’s energy, economic,                  programs (FCHJU 2017; Wipke et al. 2012). Figure 1
and environmental challenges. FCEVs are fully electric                   shows commercially available and limited-production
zero-emission vehicles: hydrogen stored onboard is                       FCEVs. Additional light-duty FCEV makes and models
converted into electricity by the fuel cell stack, and                   will be introduced into these hydrogen station enabled
water is the only tailpipe emission. The high efficiency                 markets in the near future.
of fuel cell propulsion systems, combined with onboard
                                                                         The major barrier to widespread national deployment
hydrogen storage, enables FCEVs to be fully functional
                                                                         of FCEVs is the lack of convenient, extensive networks
long-range, zero-emission vehicles—with the size, power,
                                                                         of hydrogen refueling stations (HRSs). The existing U.S.
and range of conventional gasoline vehicles. Passenger
                                                                         fleet of about 240 million gasoline-fueled light-duty
FCEVs have a range of 300–350 miles and, unlike plug-
                                                                         vehicles (LDVs) is served by a network of 120,000–
in electric vehicles, can refuel in less than 5 minutes.
                                                                         150,000 retail gasoline refueling stations (AFDC 2014;
Drivetrain components can be scaled cost effectively
                                                                         U.S. Census 2012; NACS 2015). This suggests a ratio of
for use in a broad array of light, medium, and heavy
                                                                         about 2,000 gasoline vehicles for every gasoline station.
duty vehicles. Because hydrogen can be produced from
                                                                         By comparison, at the end of 2016, 33 retail HRSs served
various energy resources—including domestic natural
                                                                         approximately 1,000 FCEVs in the United States (CEC
gas, nuclear, and renewables—FCEVs are a clean, secure,
                                                                         2017a; Cobb 2017). Private companies, government
and sustainable substitute for conventional gasoline and
                                                                         agencies, and research institutions own and operate
diesel vehicles (NRC 2013).1
                                                                         another 26 HRSs (AFDC 2017). Eight HRSs are serving
The cost and performance of fuel cell powertrain                         25 active fuel cell transit buses, and deployment of
technologies have improved dramatically over the past                    another 46 fuel cell buses is planned (Eudy et al. 2016).
15 years (Wilson et al. 2016). Today three passenger                     The vast majority of these early HRSs is concentrated in
FCEVs are commercially available in California, by                       California, which has a total of 62 operational and under-
nature of progress with hydrogen station developments.                   construction stations (Figure 2) (AFDC 2017; CARB
These are: the Hyundai Tucson, Toyota Mirai, and                         2017). In 2016, Air Liquide and Toyota announced plans
Honda Clarity. These commercial vehicles build on                        to install an initial network of 12 HRSs along a Northeast
experience accumulated by many automakers through                        corridor extending from northern New Jersey through
                                                                         Boston (Air Liquide 2016). In early 2017, the California
                                                                         Energy Commission announced awards for 16 additional
1 For a brief introduction to hydrogen fuel cell technologies, see the
                                                                         stations in California (CEC 2017c).
U.S. Department of Energy’s video, “Energy 101: Fuel Cell Technology,”
https://energy.gov/eere/videos/energy-101-fuel-cell-technology.

                                                                                                     National Hydrogen Scenarios | 1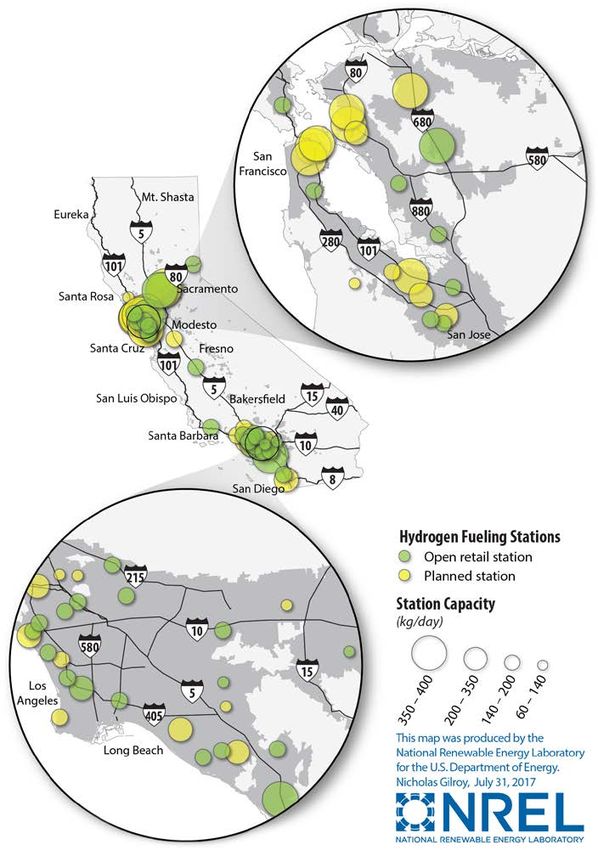
FCEVs commercially available today

  Hyundai Tucson Fuel Cell                        Toyota Mirai Fuel                               Honda Clarity Fuel Cell
  Vehicle                                         Cell Vehicle                                    Vehicle
  May 2014, Commercially Available                October 2015, Commercially                      December 2016, Commercially
  265-mile range, 49 mpge, 100-kW                 Available                                       Available
  max power                                       312-mile range, 66 mpge, 113-kW                 366-mile range, 67 mpge, 103-kW
  Photo from the California Fuel Cell
                                                  max power                                       max power
  Partnership
                                                  Photo from Toyota                               Photo from Honda

Examples of limited-production FCEVs

  2008 Chevrolet Equinox Fuel Cell Vehicle                                Mercedes Benz B-Class F-Cell
  2008 Demonstration, Project Driveway, 100 Vehicles                      2002–2012, Multiple Generations
  200-mile range, 43 mpge, 94-kW max power                                Photo from NREL 18281

  Photo from NREL 15340

Figure 1. Commercially available FCEVs (top) and examples of limited-production FCEVs (bottom)

Source: http://www.fueleconomy.gov

2 |    National Hydrogen Scenarios
More information on FCEVs, the
existing HRS network, and real-time
tracking of station status for mobile
applications can be found through
H2USA (http://h2usa.org), the California
Fuel Cell Partnership (http://cafcp.
org), the Alternative Fuels Data Center
(http://www.afdc.energy.gov), and
the international H2-Stations website
maintained by Ludwig-Bölkow-
Systemtechnick GmbH (http://www.
H2Stations.org).
Figure 2. Existing and planned stations in Northern (top) and Southern (bottom) California
(CEC 2017a; CEC 2017c; AFDC 2017; CARB 2017)
Source: NREL
National Hydrogen Scenarios | 31.1 International Context
Efforts to commercialize FCEVs in the United States numbers of non-bus FCEVs, fuel cell buses, and hydrogen
are among the initiatives led by many governments stations as of 2016 are reported in Table 1. Figure 3 shows
and private corporations, with major concentrations in the locations of existing and planned stations in Europe
Europe, Japan, and South Korea (LBST 2017; HARC 2017; and East Asia.
Schneider 2016; James and Karlsson 2016). Approximate
Table 1. Status of hydrogen fuel cell electric vehicles and hydrogen refueling stations in 2016 and future planned stations by country
2016 Status
Country Planned Hydrogen Stations
FCEVs FC Buses Stations
United States 1,186 25 53 100 in California by 2024, 15 in
Northeast beginning in 2017
Germany 103 14 22 400 by 2023
Japan 573 Demo only 86 1,000 by 2025
France 110 - 5
United Kingdom 37 8 7
Scandinavia 40 5 10 21 by 2017
Total 2,049 52 183
Sources: Schneider 2016; James and Karlsson 2016; CEC 2017; AFDC 2017; HARC 2017. Total FCEVs in the United States comprise the sum of sales in
2016 and 2015, as reported by Cobb (2017).
Figure 3. Existing and planned hydrogen refueling stations in Europe and East Asia (LBST 2017)
Source: NREL
4 | National Hydrogen Scenarios1.2 Purpose of this Report
This report provides context and insight to stakeholders of stakeholder decisions, investment risks, and profit
involved in the development of national HRS networks potential, and they emphasize the fundamental
by examining the quantity, location, and deployment role of planning and coordination among multiple
schedule of stations needed to satisfy consumer demand stakeholders. The scenarios presented here contribute
for FCEVs. The results of these scenarios can help guide to these collaborative efforts by examining the national
plans to enable FCEV market growth. Three national expansion of HRS networks across different cities,
scenarios are developed based on California’s successful regions, and time periods.
market transformation and planning processes. These
Scenario results provide preliminary and high-level
scenarios illustrate how national FCEV markets and HRS
answers to the following questions:
networks might coevolve in space and time in response to
various combinations of market demand, market support, • How many HRSs are needed to serve growing FCEV
and corporate strategy trends. The scenarios represent markets? This question is addressed by examining
a range of possible futures, with the goal of enabling initial coverage requirements for urban areas, total
more informed decisions by various public and private network capacity required to satisfy local demand,
stakeholders with different perspectives and priorities, and geographic network expansion required to satisfy
ranging from near-term investors to long-term planning growth into mainstream consumer markets.
organizations.
• Where would HRSs need to be located? This question
Coordination and planning by public-private partnerships is addressed at neighborhood, urban area, and regional
will be an essential part of the successful creation and scales, relying on previous analytic studies and new
acceleration of future markets for FCEVs and HRSs. applications of detailed station location and national
Consumers are reluctant to buy FCEVs until the refueling network expansion models. All scenarios include strong
infrastructure is well developed, and investment in growth in California followed by a variety of expansion
alternative fuel infrastructure is only justified with patterns into additional urban and regional markets.
assurance of a significant level of demand. Stakeholder
coordination can reduce HRS network investment • When would new HRSs need to be deployed? This
risks by increasing the probability of achieving high question is addressed through three distinct rates
utilization rates and larger economies of scale, which are of FCEV market growth, ranging from 23 million to
fundamental requirements for a successful business case. 61 million passenger FCEVs deployed by 2050 (1.8
This business case must be achieved while establishing an million to 4.5 million by 2035). For all new markets,
infrastructure network sufficient in scale and geographic initial coverage stations are established before FCEVs
scope to enable strong FCEV market growth. As HRS are introduced.
networks coevolve
All three questions depend on assumptions about initial
with FCEV market
station coverage requirements for early FCEV adopters,
Coordination and growth, they must
average station sizes, the geographic extent of urban
provide coverage
planning by public- markets, consumer demographics, and rates of FCEV
to entire urban
private partnerships areas, link clusters
market growth. Each of the three scenarios resolves
these interrelated factors through internally consistent
will be an essential of urban areas,
simulations of FCEV adoption and HRS network
and enable long-
part of the successful distance travel
expansion dynamics, drawing on empirical trends and
updated plans from recent studies. The result is a set
creation and along interstate
of complete national HRS network simulations, with
acceleration of corridors.
temporally and spatially resolved HRS locations, sizes,
future markets for These requirements and installation years as FCEV market shares increase
highlight the over time and across different U.S. cities and regions.
FCEVs and HRSs.
interdependence
National Hydrogen Scenarios | 5This report reflects the perspectives of H2USA Locations promising markets. For more information on investment
Roadmap Working Group members. The scenarios are opportunities, see the online H2FAST investment
intended to inform stakeholders involved in developing tool, the H2USA website, and the Hydrogen Network
partnerships for local or regional HRS networks. Investment Plan (NREL 2017; H2USA 2017; Eckerle and
The FCEV sales volumes discussed in each scenario, Garderet 2013).
nationally and by region, do not necessarily suggest
The remainder of the report is organized as follows.
that sales are more or less likely to materialize in a given
Section 2 reviews California’s successful market
market. Instead, the trends and relationships discussed
transformation process. Section 3 describes the elements
in each scenario provide insight into likely dynamics
of each scenario, and Section 4 presents scenario results.
as HRS networks and FCEV markets coevolve. Specific
Finally, Section 5 summarizes key study takeaways.
investment decisions should be made based on the
Supporting information on modeling methods is provided
latest and most reliable market data and in response
in a companion report (Bush et al. forthcoming).
to progress with stakeholder coordination activities in
2 The California Precedent
Because California leads the United States in the FCEVs are one aspect of California’s overall goal to
development of a successful passenger FCEV market deploy 1.5 million ZEVs by 2025, as articulated in
and convenient HRS network, the present study is the state’s ZEV Action Plan (CAGO 2016). Financial
grounded in the research, processes, and empirical support today relies on public funds allocated through
results that have emerged from California’s experience. the California Energy Commission’s Alternative and
This experience is summarized in Figure 4 and the box at Renewable Fuel and Vehicle Technology Program, which
the end of this section, summarized as basic components is authorized to allocate $20 million in program funds to
and key ingredients that may prove useful to other U.S. HRSs each year (CEC 2016; CEC 2017a). In 2013 California
states and regions. signed a memorandum of understanding with seven
additional states to pursue the multi-state ZEV Action
Building on a long history of air-quality improvement
Plan, with the goal of deploying 3.3 million ZEVs by 2025
efforts, California began setting aggressive advanced
in California, Connecticut, Maryland, Massachusetts, New
vehicle standards in the 1990s, including the Zero
York, Oregon, Rhode Island, and Vermont (ZEV-PITF 2014).
Emission Vehicle (ZEV) mandate, to address issues
Each of these states, as well as Maine and New Jersey
related to air quality, energy security, and climate change.
more recently, has adopted California’s ZEV mandate
The state government also began proactively supporting
regulation—thus, about 25%–30% of all new vehicles sold
implementation of advanced and alternative fuel vehicles.
in the United States are subject to ZEV regulation (CARB
In 2009, the California Fuel Cell Partnership—which
2017). Therefore, OEMs have an intrinsic business reason
includes automakers, energy companies, government
to help promote and advance ZEV infrastructure, for
agencies, fuel cell and hydrogen technology companies,
both battery electric vehicles and FCEVs. Sales of FCEVs
and research and advocacy organizations—published
result in necessary credits under the ZEV mandate, but
a plan outlining the early introduction of FCEVs and
a convenient HRS network must be in place first to allow
HRSs in key geographic clusters with large numbers
an initial FCEV market launch and subsequent growth.
of expected early FCEV adopters. This led to the
While partnership arrangements, planning methods, and
identification of early markets to be targeted by local
market support mechanisms may all vary across states
HRS clusters (Ogden and Nicholas 2011; CaFCP 2012a;
and regions, the basic components shown in Figure 4
CaFCP 2014; Brown et al. 2015).
6 | National Hydrogen ScenariosNational Scenario
Planning
- Station Location & Planning Tools
- OEM Survey and - HRS Subsidies
Commitments - Finance
provide fundamental support for - ZEV Mandate Local HRS - Mechanisms
Automaker
FCEV markets. - ZEV Purchase Commitment Availability - Stakeholder Partnerships
Incentives - Public Outreach
- Early Adopter - Codes & Standards
A wide variety of outreach, planning, Demand
National
- Education
analysis, and coordination activities Network Expansion
has contributed to the successful
establishment of FCEV markets in
California. These have included fire Figure 4. Basic components of a continuous cycle of support for early FCEV and HRS markets
marshal training by U.S. Department
of Energy and California Fuel Cell 2013), and long-term scenarios be found in various reports and
Partnership staff, financial analyses developed by the National Academy workshop proceedings (Melaina et
of early station clusters (Ogden and of Sciences (NRC 2008). Detailed al. 2008; NREL 2011; CaFCP 2017).
Nicholas 2011; Eckerle and Garderet descriptions of these activities can
Key ingredients of California’s strategic market success
1. Quantify near and mid-term FCEV intended market locations and
vehicle volume potential by way of automaker commitments.
This has been achieved through an annual survey of original
equipment manufacturers required by the California Air
Resources Board (CARB 2016).
2. Establish financial support mechanisms for HRS investments.
These include direct capital subsidies as well as operation
and maintenance grants provided by the California Energy
Commission (CEC 2016). Assembly Bill 8 provides $20 million per
year in investment commitment toward HRSs.
3. Establish FCEV market support mechanisms. These include the
H2
ZEV mandate as the major market pull mechanism as well as direct
vehicle subsidies as market push mechanisms. The Clean Vehicle
Rebate Program is one example, offering a $5,000 rebate for each
FCEV purchased (CSE 2017).
4. Implement HRS network planning and coordination tools in
collaboration with OEMs. Within California, these have included the
University of California, Irvine’s STREET model, the station coverage
modeling conducted by researchers at the University of California, Davis,
the National Renewable Energy Laboratory’s SERA model, the proposal
scoring methods used internally by the California Energy Commission (CEC
2017b), and the California Air Resource Board’s CHIT and CHAT models
(CARB 2016, available online at: https://www.arb.ca.gov/msprog/zevprog/
hydrogen/h2fueling.htm).
National Hydrogen Scenarios | 73 Hydrogen Infrastructure Scenarios
Each of the three scenarios developed in this report— geographic extent, and average size of hydrogen stations
Urban Markets, State Success, and National Expansion— increases in proportion to the growth in FCEV sales
varies by the rate and geographic scope of HRS for any individual city. Total nationwide FCEV sales are
network investments. These infrastructure investments different for each scenario, as is the distribution of sales
support FCEV market growth trends that vary based between regions and cities. Hydrogen station network
on responsiveness to consumer demand, policy drivers, expansion modeling assumptions rely upon the most
and local and regional planning and coordination efforts. recent trends in new station installations, and draw
Each scenario is similar in that successful FCEV market from planning guidelines developed over many years by
growth is achieved through the coordinated rollout of various California stakeholders (CEC 2017a; CEC 2017c;
vehicles and stations, ensuring a positive consumer CARB 2016; Brown et al. 2015; CaFCP 2012a; Ogden and
experience and reducing station investment risks. Nicholas 2011).
Differences between the scenarios provide insights into
As summarized in Table 2, HRS networks are described
infrastructure development trends that could result from
in terms of three geographic scales, each of which
the combined influences of market support mechanisms,
is useful for analyzing different types of market and
consumer demand, and successful coordination and
infrastructure development trends: urban areas, regions,
planning among automakers, fuel providers, station
and megaregions. FCEV sales and use are resolved at
owners, investors, and government agencies.
the urban area scale,2 with sales rates varying between
3.1 Overview of Analytic
regions, which include California, the other ZEV states,
and the rest of the country based on presumed future
Methods influence of state government policies. Megaregions—
integrated regional economies that extend across
All three scenarios assume strong future FCEV market conventional political boundaries—are useful in capturing
growth in California followed by market expansion into large-scale infrastructure and market development
other cities, states, and regions. Cities are modeled trends. Table 2 also indicates the three time periods over
individually with respect to when and how many new which the scenarios are analyzed.
stations are installed before FCEVs can be sold in large
numbers. After establishing initial station coverage to 2 The U.S. Census Bureau defines urban areas as densely populat-
satisfy the driving needs of early adopters (Melaina ed urbanized areas of 50,000 or more people. In the present report,
urban area also includes urban clusters, which are based on the same
2003; Nicholas, Handy and Sperling 2004), the number, criteria but with 2,500–50,000 people (https://www.census.gov/geo/
reference/ua/uafaq.html).
Table 2. Scenario geographic scales and time periods
Geographic Scales Time Periods
Urban areas Early Markets (2015–2025)
• U.S. Census designations
Expansion (2025–2035)
Regions
• California (CA) Long-term Growth (2035–2050)
• Other states adopting the ZEV mandate (ZEV)
• Rest of the country (ROC)
Megaregions
• As proposed by the Regional Plan Association (RPA 2017)
8 | National Hydrogen ScenariosUrban area populations are illustrated in Figure 5 by New Jersey, New York, Oregon, Rhode Island, and
circles (totaling 224 million people), with circle color Vermont. The color density of the 11 megaregions shown
indicating the region. The ZEV region includes states in Figure 5 indicates frequency and geographic extent
other than California that have adopted the ZEV of household vehicle commuting patterns between cities
mandate: Connecticut, Maine, Maryland, Massachusetts, (Nelson and Rae 2016).
Figure 5. U.S. population across urban areas and regions. Megaregions indicate frequency and geographic extent of household vehicle
commuting patterns.
Source: NREL
3.2 Scenario Results Urban Markets—Local Demand and
Metropolitan Area Initiatives
The scenarios assume three distinct FCEV market growth
futures followed by a simulation of the HRS network Focused infrastructure investments respond to a
expansion required to support the resulting hydrogen combination of highly concentrated early adopters and
demand. The market growth rates are not forecasts of market support mechanisms implemented by a select
future outcomes. Instead, they illustrate how national number of major metropolitan areas. The result is rapid
station networks might develop over time as FCEV growth within a relatively small number of large urban
markets grow in response to a variety of future market markets, followed by slower diffusion into nearby cities
conditions. By taking into account a relatively wide range and across megaregions. Although the select urban
of market influences and infrastructure development areas experience rapid market growth, overall national
patterns, the scenarios are intended to be useful to a growth is slower than in the other two scenarios.
broader set of stakeholders. Each scenario is described
below, and market influences for each scenario are
summarized in Table 3.
National Hydrogen Scenarios | 9Table 3. Market influences by scenario
Market Influence Urban Markets State Success National Expansion
Dominant market drivers Support at local and municipal ZEV mandate and other state Combination of strong local,
levels combined with strong market support mechanisms state, and national market
early adopter demand support mechanisms
Coordination and Investments focused on Strong coordination across ZEV Strong coordination and planning
planning most promising metropolitan mandate states across all regions
markets
Consumer adoption High concentrations of early FCEV adoption primarily driven Adoption moves quickly from
adopters guide market by ZEV mandate concentrated early adopters and
development ZEV mandate states to broad
megaregion markets
HRS network expansion Gradual expansion from Focus on ZEV mandate states, Strong stakeholder planning and
promising urban markets to with gradual expansion into coordination reduces investment
nearby cities additional markets risks, allowing rapid network
expansion
FCEV sales per year (millions) and total urban area market share (%) in 2050
United States 3.1 M (23%) 5.0 M (35%) 8.9 M (59%)
California (CA) 1.0 M (49%) 1.3 M (64%) 1.7 M (84%)
Other ZEV States (ZEV) 0.9 M (26%) 1.9 M (56%) 1.9 M (57%)
Rest of Country (ROC) 1.2 M (10%) 1.9 M (14%) 5.3 M (41%)
State Success—Creating Markets occur across megaregions. HRS network investments
respond to the combined influence of highly concentrated
through Regulation early adopters, the ZEV mandate, other market support
In this scenario, implementation of the ZEV mandate and mechanisms, and successful stakeholder coordination
other state market support mechanisms are assumed and planning activities at the national and megaregion
to be significant drivers of market growth. HRS network scales. Most major urban markets open quickly, followed
investments are guided through highly coordinated by strong local spillover into smaller nearby cities within
efforts across states, resulting in strong FCEV market all megaregions.
growth. Larger urban markets outside states offering
policy support grow more slowly. Urban markets in Table 3 summarizes the market influences that define
the western Cascadia, Front Range, and Arizona Sun each scenario. These influences capture the major
Corridor megaregions open and grow relatively quickly influences on how FCEV markets and HRS networks
owing to market spillover from California and Oregon, expand geographically and over time. The bottom of
while cities with very high early adopter concentrations Table 3 shows the corresponding annual FCEV sales and
take the lead in other regions. The result is relatively urban area market share in 2050 for the United States
rapid growth in a select number of states followed by and each region (CA, ZEV, and ROC). Additional details
more moderate growth across the rest of the country. on FCEV market share influences by scenario and
region are provided in Section 3.3. Section 3.4 discusses
National Expansion—Unleashing how HRS network expansion responds to the resulting
FCEV market trends. A companion report provides
Market Forces
additional details on the modeling assumptions and
By combining highly coordinated planning and analytical methods used to develop each scenario
development efforts with aggressive market support (Bush et al. forthcoming).
mechanisms, rapid FCEV market growth is assumed to
10 | National Hydrogen Scenarios3.3 Fuel Cell Electric Vehicle
Market Growth Scenarios
FCEV sales are assumed to follow an “s-curve” growth pattern, with relatively
slow adoption in early years giving way to rapid growth and eventual market
saturation (Rogers 1995; Lund 2006). This pattern is realized at the urban
area level and at the regional and national scales. National sales of FCEVs
out to 2050 are shown in Figure 6 with reference to total U.S. LDV sales.
Initial (2016–2022) sales in the State Success scenario match FCEV sales
estimates in California from recent automaker surveys. Sales in the Urban
Markets and State Success scenarios reach approximately 3 million and 5
million FCEVs per year by 2050, respectively. The sales trajectory in Urban
Markets is approaching saturation near 2050, while sales in State Success are
still growing strongly by 2050. Sales in the National Expansion scenario are
at about 9 million FCEVs per year by 2050, roughly half of all LDV sales, and
still experiencing relatively strong growth.
20M
Total U.S. LDV Sales
18M
16M
14M
12M
FCEV Sales per Year
10M
National Expansion
8M
6M
State Success
4M
Urban Markets
2M
0M
2015 2020 2025 2030 2035 2040 2045 2050
Figure 6. FCEV sales by scenario compared with total U.S. LDV sales
A more detailed depiction of these sales projections is shown by region in
Figure 7. The top set of panels indicates that within the Early Markets time
period (2015–2025), FCEV sales in the Urban Markets and State Success
scenarios are significantly lower than those in the National Expansion
scenario. Most of the sales are into California markets in each scenario, with
the State Success scenario having minimal sales into ROC markets. The
middle set of panels shows sales for the Expansion time period (2015–2035),
and has a different scale on the vertical axis: 1.5 million FCEVs per year,
compared with 100,000 FCEVs per year in the Early Market time period.
Sales into ROC markets are still minimal in the State Success scenario, but
ROC and ZEV sales begin stronger growth in the Urban Markets and National
Expansion scenarios. California sales still dominate the FCEV market by
2035. The bottom set of panels shows FCEV sales in the Long-term Growth
time period (2015–2050), adjusting to a scale of 10 million FCEVs per year
on the vertical axis. By 2050, FCEV sales in State Success are nearly double
those in Urban Markets, and sales in National Expansion are nearly double
those in State Success. These sales are roughly equally divided among the
National Hydrogen Scenarios | 11three regions in the Urban Markets to growth in the FCEV success the National Expansion scenario
scenario, while the ZEV states play scenario developed in a report from sales trend indicated in Figure 7.
a larger role in the State Success the National Academy of Sciences The National Expansion scenario
scenario and the ROC region (NRC 2013). In that study, annual is therefore more conservative
becomes the dominant market in sales of 10 million FCEVs were than the 2013 NRC estimate of
the National Expansion scenario. achieved through aggressive market feasible FCEV market growth
growth between 2015 and 2036, under favorable market and policy
The rate of growth in the National
approximately 15 years earlier than conditions.
Expansion scenario is comparable
Early Markets
Urban Markets State Success National Expansion
100K
Region
FCEV Sales per Year
80K ROC
ZEV
60K CA
40K
20K
0K
2016 2018 2020 2022 2024 2016 2018 2020 2022 2024 2016 2018 2020 2022 2024
Expansion
Urban Markets State Success National Expansion
1.5M
Region
FCEV Sales per Year
ROC
ZEV
1.0M CA
0.5M
0.0M
2020 2025 2030 2035 2020 2025 2030 2035 2020 2025 2030 2035
Long-term Growth
Urban Markets State Success National Expansion
10M
Region
FCEV Sales per Year
8M ROC
ZEV
CA
6M
4M
2M
0M
2020 2030 2040 2050 2020 2030 2040 2050 2020 2030 2040 2050
Figure 7. Breakdown of FCEV sales by period and region
Note: The scale of the vertical axis changes between each of the three periods.
12 | National Hydrogen Scenarios3.4 Hydrogen Station Network Development
The first three market influences summarized in Table Activation Station Requirements—For early FCEV
3—market drivers, coordination, and adoption—indicate markets to be successful, consumers must be confident
major influences on FCEV market success in each of in the availability of convenient local and regional HRS
the three scenarios. The fourth influence—HRS network networks (Melaina 2003; Nicholas, Handy and Sperling,
expansion—describes the refueling infrastructure 2004). During the early years of FCEV introduction,
deployment that responds to FCEV market growth. The convenience for early adopters is of primary concern.
rollout of FCEVs and HRS networks in ZEV and ROC cities Based on the analytic approach used to develop the
and megaregions is assumed to follow patterns similar to California Fuel Cell Partnership Roadmap (see Section
the planned rollout in California, although delayed in time 2), a certain number of market activation stations must
and adjusted for variations in consumer demographics. be installed before OEMs will begin unique dealership
Three main dynamics influence infrastructure supply outreach and marketing of FCEVs, allowing them to
simulations: (1) the influence of early adopters, (2) the be sold in large volumes into a given urban area. The
requirement for activation stations to open urban markets coverage of activation stations must enable most early
to large FCEV sales volumes, and (3) the sequence in adopters to live within a 6-minute drive of a station
which additional urban markets are opened over time. (Nicholas et al. 2004; Melaina et al. 2013; CaFCP 2014;
Each dynamic is reviewed below. Brown et al. 2015). This approach tends to result in one or
more activation stations being clustered in neighborhoods
Early Adopter Influence—Because so few FCEVs have
with high concentrations of early adopters. Additional
been deployed to date, future consumer demand for
activation stations provide refueling availability across
FCEVs is projected by analyzing empirical data on
the larger urban area, resulting in a network that satisfies
historical sales of other advanced vehicles (including
the refueling needs of most early adopters. An example
hybrid electric and plug-in electric vehicles) and luxury
of how activation stations might be distributed across
vehicles as well as the prevalence of high-income
an urban area is shown in Figure 8, with 36 stations
households. The result is a consumer demand metric
serving early adopters in Seattle. These activation stations
referred to as the Early Adopter Metric (EAM), which
represent approximately 5% of all gasoline stations
serves as a proxy for where FCEV sales are likely to be
serving the urban area indicated in the map.
strongest and, therefore, where and how many new
stations must be built to activate FCEV market growth. Urban Market Sequencing—More than 600 urban
Early adopters are critical to initial market development areas are prioritized based on the density of early
in all three scenarios. However, the scenarios differ in the adopters (EAM per square mile) and the number
extent to which network development patterns depend of early adopters served by the activation stations
on the influence of early adopters compared with the required in any given city (EAM per activation station).
other market drivers summarized in Table 3. The EAM is The rationale behind this sequencing approach is that
a unitless metric, indicating the spatial distribution and capital is the limiting factor in determining the most
density of early adopters.3 The EAM does not influence effective station investments, whether it is provided
the rate of FCEV market growth. by government agencies through subsidies or directly
by private investors. Cities with both large numbers
of early adopters and high densities of early adopters,
3 Analytically, EAM is resolved at the ZIP-code level based on vehicle measured as a ratio of early adopters per activation
registrations and Census household income. EAM is determined by
giving 50% weight to the number of hybrid electric, plug-in hybrid
station, are opened to new FCEV sales before other
electric, and pure battery electric vehicle registrations, 25% weight cities. In addition, cities in close proximity to these high-
to luxury vehicle registrations, and 25% weight to average household
income. For the sake of exposition, it is assumed that one out of five
priority cities are also prioritized, although this effect is
consumers falls into the early adopter category, resulting in a spatial stronger in the National Expansion and State Success
representation of 63 million potential early adopters in more than 600
urban areas.
scenarios than in the Urban Markets scenario, where
National Hydrogen Scenarios | 13Activating Greater Seattle
It is estimated that 36 hydrogen stations could Snohomish
provide sufficient refueling availability for early
adopters such that large volumes of FCEVs could Mountlake
be sold into the Greater Seattle market. The map Terrace Bothell
indicates high densities of early adopters (darker
shades of purple) as well as the location (circles)
of the first 12 stations (red), second 12 stations North Sea*le
(salmon), and third 12 stations (gray).
Central Sea*le Bellevue
The first 12 stations include four clusters: four
West Sea*le
stations in North, Central, and West Seattle; four
stations running through Bellevue north to Bothell;
and three northern stations extending from
SeaTac/
Mountlake Terrace to Snohomish; and a station at the
Airport
airport. The airport in SeaTac serves as a destination
station and is therefore distinct from the other high
EAM density stations. Additional activation stations 1st 12 Stations
reinforce these clusters, provide connectivity across 2nd 12 Stations
Tacoma 3rd 12 Stations
outlying urban areas, and extend south to Tacoma.
High EAM density
Mid EAM density
Figure 8. Market activation station example: Seattle, Washington Low EAM density
(Map data: Google)
FCEV markets are strongly influenced by market support Additional cities are then activated as total FCEV sales
mechanisms provided by individual cities. Following this in a given region increase over time. The modeling
sequence of prioritization, new cities are activated as methodology companion report includes a more detailed
the volumes of FCEV sales shown in Figure 6 and Figure discussion of the city sequencing methodology (Bush et
7 increase over time. The result is that large cities with al. forthcoming).
high concentrations of early adopters receive the first
activation stations and large volumes of FCEV sales.
14 | National Hydrogen Scenarios4 Scenario Results
Each of the scenarios represents a successful rollout Markets scenario expands into both ROC and ZEV large
of FCEVs and HRS networks into major urban areas metropolitan areas early, with significant growth at the
across the United States. All three scenarios involve end of both 2025 and 2035, but relatively limited growth
strong FCEV and HRS growth in California followed by nationally by 2050. The State Success scenario involves
expansion into other regions and urban areas. The total strong early growth in ZEV markets followed by delayed
FCEV stocks and HRSs installed are shown by scenario growth in ROC markets. The National Expansion scenario
in Figure 9 for three time periods, each represented by involves rapid growth in all three regions, reaching the
a panel with FCEV stock in the upper bar charts and greatest number of stations and FCEVs by 2050.
total stations in the lower bar charts. The panel on the
Again, these scenarios are not predictions of future
left indicates results at the end of 2025, the middle
market outcomes. Instead, they are intended to stimulate
panel shows results at the end of 2035, and the panel
discussions about HRS network requirements and
on the right shows results by 2050. The magnitude
provide insights into how those networks might coevolve
and geographic distribution of FCEV stocks and HRS
with a growing national FCEV market.
network expansion vary among the three scenarios.
In succession, each scenario involves greater market An HRS network will provide convenient refueling access
growth in California accompanied by increased market to a share of the total population based on how many
growth in either the ZEV or ROC markets. The Urban stations are deployed and the population density of
2025 2035 2050
250K
Region Region 60M Region
4M
FCEV Stock (veh)
FCEV Stock (veh)
200K ROC ROC 50M ROC
FCEV Stock (veh)
ZEV ZEV ZEV
150K CA 3M CA 40M CA
2M 30M
100K
20M
50K 1M
10M
0K 0M 0M
Urban State National Urban State National Urban State National
Markets Success Expansion Markets Success Expansion Markets Success Expansion
1000
20K
3K
800
Total Stations
Total Stations
Total Stations
15K
600 2K
10K
400
1K
200 5K
0 0K 0K
Urban State National Urban State National Urban State National
Markets Success Expansion Markets Success Expansion Markets Success Expansion
Figure 9. Number of FCEVs on the road and total HRSs by scenario and region
Note: The scale of the vertical axis changes between each of the three periods.
National Hydrogen Scenarios | 15You can also read