Water, energy and climate benefits of urban greening throughout Europe under different climatic scenarios - Nature
←
→
Page content transcription
If your browser does not render page correctly, please read the page content below
www.nature.com/scientificreports
OPEN Water, energy and climate
benefits of urban greening
throughout Europe under different
climatic scenarios
Emanuele Quaranta1*, Chiara Dorati2 & Alberto Pistocchi1
Urban greening is an effective mitigation option for climate change in urban areas. In this
contribution, a European Union (EU)-wide assessment is presented to quantify the benefits of urban
greening in terms of availability of green water, reduction of cooling costs and CO2 sequestration
from the atmosphere, for different climatic scenarios. Results show that greening of 35% of the EU’s
urban surface (i.e. more than 26,000 km2) would avoid up to 55.8 Mtons year−1 CO2 equivalent of
greenhouse gas emissions, reducing energy demand for the cooling of buildings in summer by up to 92
TWh per year, with a net present value (NPV) of more than 364 billion Euro. It would also transpire
about 10 km3 year−1 of rain water, turning into “green” water about 17.5% of the “blue” water that
is now urban runoff, helping reduce pollution of the receiving water bodies and urban flooding. The
greening of urban surfaces would decrease their summer temperature by 2.5–6 °C, with a mitigation
of the urban heat island effect estimated to have a NPV of 221 billion Euro over a period of 40 years.
The monetized benefits cover less than half of the estimated costs of greening, having a NPV of
1323 billion Euro on the same period. Net of the monetized benefits, the cost of greening 26,000
km2 of urban surfaces in Europe is estimated around 60 Euro year−1 per European urban resident. The
additional benefits of urban greening related to biodiversity, water quality, health, wellbeing and
other aspects, although not monetized in this study, might be worth such extra cost. When this is the
case, urban greening represents a multifunctional, no-regret, cost-effective solution.
Climate change and the current trends in urbanization make city resilience a clear priority1. Urban areas suf-
fer from heat w aves2–4 and generally require a high amount of energy for the cooling of buildings. Impervious
surfaces exacerbate floods and their impacts, because urban runoff is quickly discharged to the receiving water
bodies where it may cause disturbance to aquatic e cosystems5, and is often a significant source of pollution6.
Health and environmental risks due to climate effects in urban areas are expected to increase, especially in
developing cities that are experiencing rapid population g rowth3,7. A recent study found that the accumulated
total costs resulting from the impact of global and local climate change on cities since the year 2000 were about
2.6 times the costs without urban weather-related e ffects7.
Urban climate has been acknowledged to be strongly modified by human influences8. Green areas inside a
city can lower the ambient air temperature and adjust the humidity of surrounding a reas9–12, besides regulating
runoff and enabling rainwater harvesting13,14, as unsealed soil allows retaining rainwater subsequently available
for vegetation to grow.
In the last years, urban greening has attracted considerable interest as a broad-scoped management m easure9.
In the context of urban greening, a frequent option is not to restore unsealed soil, but to cover an impervious
surface with a vegetated soil layer, usually on top of a waterproof membrane and a drainage layer to protect the
underlying impervious surface. The latter is sometimes the roof of a building (which would be turned into a
“green roof ”), but could equally be a paved external surface with underlying pipelines or other services. If not
specified otherwise , in the remainder of this work we refer to “greened surface” , or equivalently "green roof ", as
any soil cover of an urban impervious surface, enabling water infiltration and vegetation growth.
While green roofs have been used for centuries, they are now reviving under the current climate and urbani-
zation trends15. Essentially, they harvest “blue” rainwater and make it available for evapotranspiration (turning
it into “green water”, i.e. water used by vegetation and soil), modifying the hydrologic and energy balance of
1
European Commission, Joint Research Centre (JRC), Ispra, Italy. 2ARHS, Ispra, Italy. *email: emanuele.quaranta@
ec.europa.eu
Scientific Reports | (2021) 11:12163 | https://doi.org/10.1038/s41598-021-88141-7 1
Vol.:(0123456789)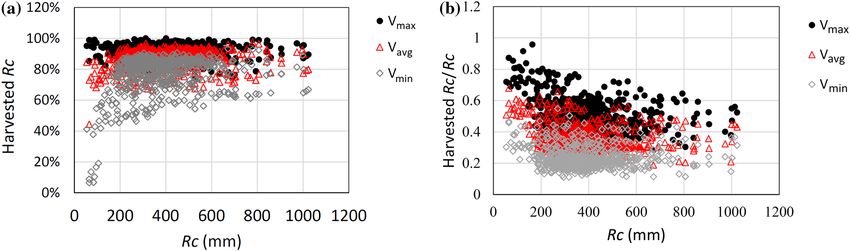
www.nature.com/scientificreports/
the surfaces. In addition, rainwater in excess of evapotranspiration may be collected through drainage for pos-
sible reuse. Green roofs bring several potential benefits including reduction of storm water runoff by retain-
ing precipitation13,14,16,17, reduction of energy demand for the cooling of b uildings18,19, mitigation of the urban
microclimate19,20. Moreover, by supporting vegetation growth, they enhance sequestration of carbon dioxide and
pollutants from the a tmosphere21,22, reduce noise in b uildings23 , provide usable spaces for social activities and
horticulture24–26 and for wildlife habitat, especially birds and pollinators27,28. Because of these multiple benefits,
green roofs can be an important urban management measure, meeting the aspirations of the European green
deal on buildings renovation29.
Having in mind the local benefits of urban greening (single building- or city-scale), in this contribution we
present a European-scale quantification of the potential benefits of green roofs in terms of water and climate regu-
lation, energy saving and biomass production (hence carbon sequestration), using the meta-models described in
Quaranta et al.30. On this basis, we discuss the opportunities and limitations of greening as a tool for sustainable
urban development in Europe. The objective of the present paper is not a detailed assessment at single sites but
the screening of a comprehensive strategy to develop urban greening as a mainstream solution.
Materials and methods
Our analysis combines a GIS implementation of the meta-models proposed in30 applied to the EU context to
quantify the benefits of converting 1 m2 of impervious surface into a green surface, with an empirical quanti-
fication of costs and benefits. The Net Present Value (NPV) of the investment was also calculated. NPV is an
economic valuation analysis that takes into account the difference between the present value of benefits and the
present value of costs over a period of time, that in our case was assumed to be 40 years. NPV allows to estimate
the profitability of an investment or a project. Therefore, NPV accounts for the time value of money and can be
used to compare similar investment alternatives. The NPV relies on a discount rate, that is the rate of return used
to discount future cash flows back to their present value.
Quaranta et al.30 combined the hydrological model of Pistocchi et al.31, with the energy and biomass model
of Neitsch et al.32, to simulate biomass growth, the water and surface energy balance for 671 functional urban
areas (FUA) across Europe at daily time step, using European scale gridded weather time series for the period
1990–201333 as input. The results were used to derive simple meta-models predicting the following indicators as
a function of climatic descriptors, i.e. annual precipitation (P), annual potential evapotranspiration (ET0) and
annual actual evapotranspiration (AET):
1. the average difference in surface (skin) temperature in summer, ΔTs (°C), between an impervious urban
surface and a greened surface at the same location (Eq. 1);
2. the average difference in summer temperature, ΔT (°C), between an impervious urban surface and the bot-
tom of the soil layer, placed for the greening on the urban surface at the same location (Eq. 2);
3. the difference between annual rainfall and annual runoff, RR (mm year−1), for a greened surface, representing
the runoff avoided as a consequence of greening (Eq. 3);
4. the annual biomass that may grow on a greened surface CB (kg m −2 year−1), Eq. (4):
Ts = 0.0061AET + 1.46 (1)
�T = 6.85 ln(ET0)−27.83 (2)
RR/P = 17.8P −0.544 (3)
CB = 1.65 ln(ET0) − 8.685 (4)
In the derivation of the metamodels of Quaranta et al.30 ET0 was computed at daily step with the Pen-
man–Monteith equation by Bisselink et al.33, and aggregated as a yearly value. While AET is usually estimated
with a hydrological model and may not be as readily available as P or ET0, in the European context it can be
very well approximated by a simple Budyko model 30 and is therefore considered a climatic predictor on a par
with P and ET0 for the purposes of this analysis. The meta-models proved to surrogate the results obtained by
solving the integrated hydrological-energy-biomass model with an error usually below 10% quite evenly across
the European region30.
The above equations are valid for the European context, and for a soil layer thickness of 30 cm covered with
an annual herbaceous cover (the meta-models were derived for a generic thickness t and proved to be relatively
insensitive to the selected herbaceous crop30). In the present study we refer to a 30 cm thick soil with the aim of
determining the maximum benefits of greening implementation. Higher thickness would imply higher costs,
while benefits would not change substantially. A soil of 30 cm may be unfeasible as a uniform cover of roofs in
many buildings due to architectural and structural constraints, but could be a reasonable solution when greening
e.g. paved ground or subterranean parking lots. In the greening of roofs, patches of 30 cm-thick soil cover on
less than 100% of the surface could still be feasible.
In the analysis presented here, the above indicators (Eqs. 1–4) were computed using the climatic predictors
ET0, P and AET for present conditions (1990–2013) and for 2 climatic scenarios represented by regional con-
centration pathways (RCP) 8.5 and 4.534 for the period 2070–2100, using 4 regional climate models from the
Euro-Cordex ensemble 63. Therefore, we considered a total of eight climatic scenarios in our estimations. The
Scientific Reports | (2021) 11:12163 | https://doi.org/10.1038/s41598-021-88141-7 2
Vol:.(1234567890)
www.nature.com/scientificreports/
models included were from the Danish Meteorological Institute (model code used here: DM), Swedish Meteoro-
logical and Hydrological Institute (SM), Royal Dutch Meteorological Institute (KN) and Institute Pierre-Simon
Laplace (IP). In the following, the scenarios are defined by the above model codes followed by codes 45 or 85 for
the two RCPs considered, respectively. P and ET0 needed to compute AET under climate scenario conditions
were average values for the climate simulation period 2070-2100 for each model. Under each scenario, P and
ET0 were computed as the annual average from daily values over the period considered.
The four indicators of Eqs. (1–4) were quantified at the nodes of the regular grid of 5 × 5 km at which the
climate variables were a vailable33 . The impervious surface (roofs and other surfaces) within each of the 5 × 5 km
grid cells was also quantified, so that cumulative curves could be calculated for each indicator, quantifying the
area in km2 where a certain indicator value was exceeded. The impervious surface area was estimated as p er35.
The summer temperature difference of Eq. (2), ΔT, can be interpreted as the cooling reduction of a roof if
covered by soil, which implies a reduced energy demand for cooling. The corresponding energy cost saving G
was estimated as:
1
G = UA Th C (5)
SEER
where A is the area of the roofs, h is the amount of hours during summer months (from June to August
included), SEER (set to 3.1) is the seasonal energy efficiency ratio for E urope36, C is the electricity cost set to 0.2
Є kWh−137 representative of an average value in Europe and U is the average transmittance of the roof (set to
0.30 W m−2 K−1 as a European reference value, Eurima38). The carbon emissions are assumed to be 0.325 kg CO2
equivalent kWh−1, a value corresponding to the European electricity generation 39. Obviously, this calculation
should be applied only to the impervious surfaces that are represented by roofs of buildings. The impervious
surface covered by building roofs was assumed to be 26,450 k m2 (35% of the total impervious area) as in Bódis
et al.40. The remaining 65% is represented by urban areas like streets and impervious open spaces assumed to
not be amenable to greening.
The carbon sequestered by an annual herbaceous biomass was estimated as 0.35 kg C m −2 year−1 in Saliendra
et al.41, and 0.27 kg C m
−2 year−1 in Gilmanov et al.42. In this analysis, we considered the more conservative value
of Gilmanov et al.42 that corresponds to 0.98 kg C O2 m−2 year−1. The present carbon dioxide ( CO2) market price
is 22.5 Є tons−1 of C
O243. This amount of carbon is effectively sequestered if the biomass is preserved as straw
or if it avoids an equivalent amount of biomass to be mineralized elsewhere, and is therefore an upper limit.
The residual runoff (i.e. P-RR) generated by the green surfaces can be in principle harvested, instead of
discharging it into the environment, if we provide a sufficient storage volume to buffer demand and availabil-
ity. In this assessment, we compute the storage volume required to harvest all the runoff generated by a green
surface, assuming a constant demand whose yearly cumulate equals the yearly cumulate of available runoff.
The required storage volume was calculated for each FUA using the classic mass diagram a nalysis64 for every
year of the time series. The calculations were based on the daily runoff predicted under current conditions with
the model described in Quaranta et al.30. In particular, we computed the average volume among those required
in the various years, Vavg, the maximum, V max, and the minimum, Vmin. We derived an ordinary least squares
multiple linear regression model to predict Vavg, Vmin and Vmax (mm) as a function of the climatic predictors
already used for the above indicators. After testing various combinations of the predictors, we chose the best
performing models (with mean absolute error (MAE) of 19% when considering Vavg and 30% when considering
Vmin), whose equations are given by:
Vavg = −109 + 0.07ET0 + 0.25P
Vmin = −13 − 0.02ET0 + 0.13P (6)
Vmax = −251 + 0.23ET0 + 0.40P
Results and discussion
Calculation of the indicators. Figure 1 shows the distribution of the urban greening benefit indicators
computed at European scale under the current scenario, while Fig. 2 shows the cumulative distribution of imper-
vious urban areas by increasing value of each indicator, under the current and future scenarios. It should be
stressed that, while the indicators of Eqs. (1–4) are computed for every grid cell, the curves of Fig. 2 reflect also
the spatial distribution of impervious urban surfaces, and hence they give more prominence to the values of the
indicators in the most densely urbanized areas of the continent.
The reduction of surface temperature ΔTs (Fig. 1a) is highest in the warmer and not excessively dry climates
of Central and Southern Europe, reflecting the patterns of actual evapotranspiration. Most European urban areas
would achieve temperature reductions of about 3–3.5 °C (Fig. 2a), slightly increasing with the severity of climate
heating under the various scenarios, causing a reduction of sensible heat to the atmosphere, a driver of urban
heat island effects, between 20 and 40% (see Appendix 1, Supplementary Material for further details). The highest
temperature reduction at the roof surface, ΔT, is mostly perceived in the South of Europe (Fig. 1b), consistent
with the pattern of potential evapotranspiration, similarly to the production of dry biomass CB (Fig. 1d). The
reduction of temperature at the roof is predicted between 15 and 17 °C for most of Europe under the current
scenario, and may increase of about 2 °C under the most severe climate scenario (Fig. 2b). Runoff reduction is
significantly higher in areas with moderate precipitation, particularly in the plains, compared to rainier areas
such as the Atlantic edge of the continent and high mountain ranges (Fig. 1c).
The maximum storage volume, Vmax , calculated by Eq. 6, would allow to reuse 92% of the annual runoff,
while Vmin and Vavg would allow to store 77% and 86% of the runoff, respectively, as resulting from a daily balance
Scientific Reports | (2021) 11:12163 | https://doi.org/10.1038/s41598-021-88141-7 3
Vol.:(0123456789)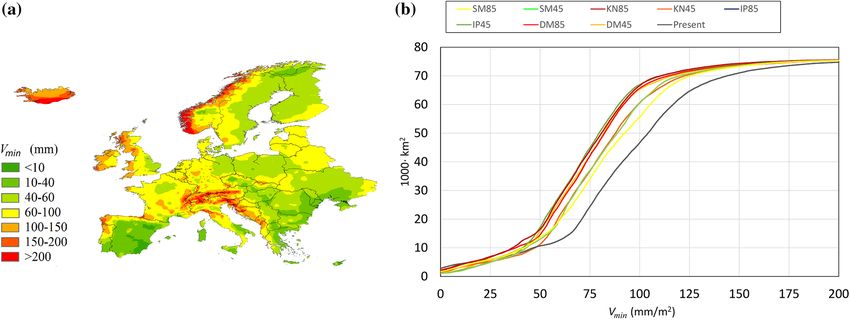
www.nature.com/scientificreports/
Figure 1. Maps of benefits per m
2 across Europe for ΔTs (a), ΔT (b), RR/P (c) and CB (d), in the present
scenario.
Figure 2. Cumulative curves of urban surfaces versus the indicator ΔTs (a), ΔT (b), RR/P (c) and CB (d). The
black line represents present conditions, while lines in color stand each for one climatic scenario. The y-axis is
the cumulative surface area of the present European urban areas.
Scientific Reports | (2021) 11:12163 | https://doi.org/10.1038/s41598-021-88141-7 4
Vol:.(1234567890)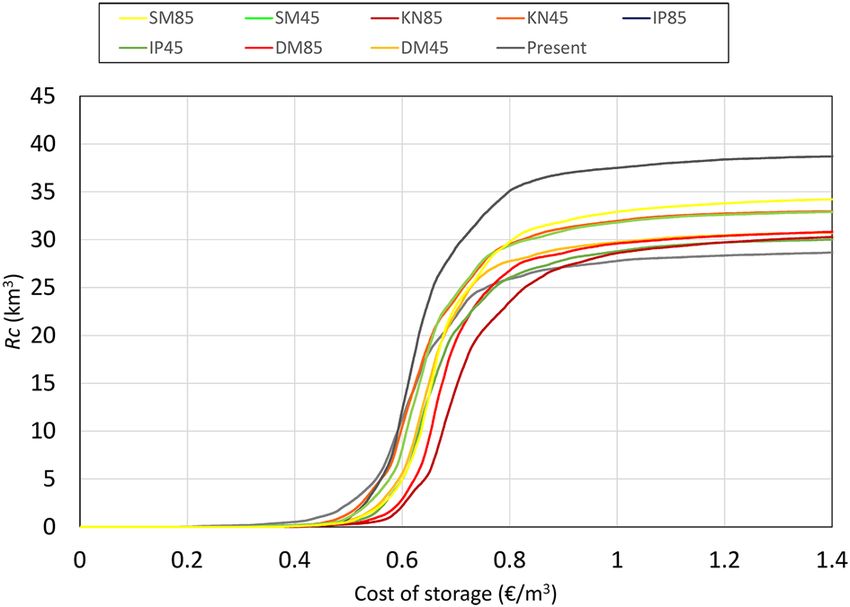
www.nature.com/scientificreports/
Figure 3. Storage volume Vmin required to store the runoff in the case of constant demand.
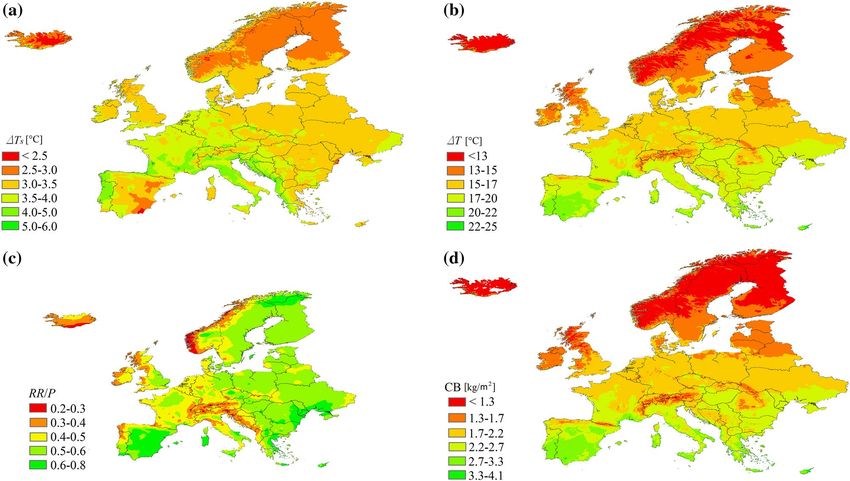
Figure 4. Runoff that could be harvested, and normalized storage volume Vmin versus the annual average
runoff (Rc) for the case of constant withdrawal, calculated throughout the 14 year time series.
Units 85KN 85SM 85IP 85DM 45KN 45SM 45IP 45DM Present
Annual precipitation mm 715 772 836 719 708 753 757 721 685
Annual ET0 mm 859 795 748 817 771 735 732 751 695
Runoff reduction km3 10.0 11.4 12.9 10.2 9.8 10.9 10.9 10.1 9.3
Savings on energy needed for the cooling of build-
bill. Є 19.6 19.1 18.3 19.2 19.0 18.5 18.5 18.8 18.4
ings
CO2 emissions reduction (through energy saving) Mtons 31.9 31.0 29.7 31.2 30.9 30.1 30.1 30.6 29.9
CO2 sequestration (through biomass) Mtons 25.9 25.9 25.9 25.9 25.9 25.9 25.9 25.9 25.9
Total CO2 emissions reduction Mtons 57.8 57.0 55.7 57.1 56.8 56.0 56.0 56.5 55.8
Table 1. Climatic descriptors and quantification of annual benefits at the European scale in the present
and future climatic scenarios, assuming to green all roof surfaces, or 35% of the European impervious
surfaces.
of the storage volume calculated over the 14 year time series. As the storage volume normalized to the annual
runoff Rc is 0.24, 0.36 and 0.51 for Vmin, Vavg and Vmax, respectively (Figure 4b), choosing a storage volume equal
to Vmin appears to be the most cost-effective solution. Vmin is mapped as shown in Fig. 3a for the case of constant
demand, under the current scenario, while in Fig. 3b the volumes are plotted versus the cumulated areas.
Physical and environmental implications. These potential effects of green surfaces at European scale
correspond to potential benefits. The total benefits extrapolated for the EU are summarized in Table 1. Results
are referred to the impervious surfaces corresponding to building roofs, that are assumed to amount to a total
of 26,450 km2 as per Bódis et al.40 . This represents 35% of the European impervious surface. Although it is
Scientific Reports | (2021) 11:12163 | https://doi.org/10.1038/s41598-021-88141-7 5
Vol.:(0123456789)www.nature.com/scientificreports/
highly unlikely that the majority of the roofs may support a uniform soil cover of 30 cm, they could still bear
patches of that thickness over a part of their surface. Moreover, additional surfaces such as sealed ground could
be greened. Overall, having in mind these considerations, we pragmatically regard this 35% of impervious urban
areas as a maximum extent that could be greened in Europe. All benefits calculated below would obviously scale
proportionally for any reduction of the percentage of area subjected to greening. The quantification of Table 1
is explained below.
The reduction of land surface temperatures, ΔTs, reduces the thermal irradiation and convective heat flux
from urban surfaces (see Appendix 1 of Supplementary Material), which are the drivers of the heat island effect44.
As a first order approximation, the reduction of air temperature at 2 m from the surfaces can be expected to be
about a half of ΔTs45 as an average value in summer. The reduction of air temperature would generate economic
benefits, like the life cycle extension of electronic material and cars, benefits in the health and transport sectors,
reduction of social stress and morbidity, and reduction of damages to trees and animals46–48.
The reduction of the surface temperature ΔT potentially reduces the cooling demand in summer (Eq. 5) by
92 TWh year−1. This energy saving corresponds to 29.9 Mtons of CO2 for the present scenario, considering emis-
sions of 0.325 kg CO2 equivalent kWh−1 for European electricity39. Our estimate is arguably an upper limit of
cooling energy savings. In many cases, underroof spaces of buildings are not cooled and effectively work already
as an insulation, hence the reduction in the heat transferred from the roofs to underlying inhabited spaces may
be lower than we estimate.
The yearly produced biomass CB is a benefit in itself whenever the biomass may be used (e.g. crops from urban
agriculture). However, more importantly, it may be appraised in terms of carbon and carbon dioxide sequestra-
tion. The carbon dioxide sequestered from the atmosphere through biomass growth is 25.9 Mtons year−1 in the
present scenario. This must be summed to the reduction of carbon emission following the expected decrease in
cooling energy use for a total of 55.8 Mtons, or about 1.2% of the 4500 Mtons C O2 produced in the EU every
year37.
It should be stressed that carbon dioxide sequestration by the biomass in green roofs is effective only if
residues are not significantly degraded. This may be achieved by removing the biomass periodically before it
undergoes respiration and mineralization. One could alternatively employ woody plants with a higher carbon
accumulation capacity instead of herbaceous vegetation. Although our calculations are referred to a herbaceous
annual crop, the results in terms of dry biomass would not be radically different had we considered a tree or
shrub crop, as the dry matter potentially produced per unit surface is relatively independent of the p lant49. On
the other hand, trees and shrubs may be expected to have higher evapotranspiration, thus enhancing the benefits
quantified here for a herbaceous crop.
If greening is implemented on about 35% of the impervious urban areas, we expect a reduction of runoff in
the order of 17.5% compared to the total. Considering that pollutant loads associated to runoff are estimated in
the order of about 30 million population equivalents (PE) in terms of biochemical oxygen demand (BOD), about
18 million PE in terms of total nitrogen and about 6 million PE in terms of total phosphorus 6,35, this can be a
sizable contribution to the treatment of pollution from European urban areas. Besides the reduction of runoff
volume, greened surfaces may also help reduce the frequency of combined sewer overflows because they buffer
runoff and release it more slowly than impervious surfaces. This effect is arguably more important for smaller
storm events, and tends to disappear as events cause the saturation of green roof storage.
It should be stressed that the above analysis considers a soil thickness of 30 cm on greened surfaces. Using the
meta-models proposed i n30 for the thickness of 10 cm we obtain a ratio between the indicators for thickness of
10 and 30 cm ranging between 80–97% for the reduction of surface temperatures, 55–57% for roof temperatures,
47–57% for biomass, and 84–86% for runoff. Soil thickness affects in particular the roof temperature, due to the
associated thermal insulation effect, and the biomass, because a thicker soil can store a larger amount of water
and allows a higher evapotranspiration for vegetation growth, while not impeding root growth. A comparison
of different climate scenarios sheds light on the sensitivity of our results to the input climatic predictors (P and
ET0). From Table 1, it can be calculated that the range (difference between the maximum and minimum value)
of precipitation and potential evapotranspiration, as a percentage of the average value, is 20.3%, and 21.4%
respectively. The corresponding ranges are 7% of the average for the cooling reduction, 3.7% for the reduced
carbon dioxide emission, and 34% for the runoff reduction. The curves in Fig. 2 visualize the relatively small
sensitivity of results to the climatic scenario.
Economic implications. Most of the benefits of green roofs are collective. Only a few (e.g. energy saving
in summer, and gardening) have an apparent private nature. The costs of greening roofs, on the contrary, are
primarily borne by the private owners50. It has been observed that, in the absence of specific incentives, green
roof implementation can be economically convenient only for specific commercial and multifamily buildings25.
Therefore, private investments should be encouraged through appropriate fiscal and funding policies if the
objective is to facilitate a mainstream uptake of this solution. In this section, an indicative cost-benefit analysis is
carried out in order to shed light on the possible financing needs at stake, and considering to green the impervi-
ous surfaces covered by roofs.
The two main benefits that can be easily monetized are the avoided cost of cooling in summer (based on
energy prices) and the reduction of carbon dioxide emissions (based on greenhouse gas emissions market prices).
By summing the results of Eq. (5) for all gridcells in Europe where the greened surface is assumed to be 35%
of the impervious urban area in the gridcell, cooling savings can reach 18.4 billion Є each year for the current
scenario. For comparison, the current expenditure for residential cooling in summer can be assumed to be 78
billion Є year−1, based on an electricity use of 391 T Wh51. Therefore, the cooling energy saving is 23.5% (18.4
Scientific Reports | (2021) 11:12163 | https://doi.org/10.1038/s41598-021-88141-7 6
Vol:.(1234567890)www.nature.com/scientificreports/
NPV(billion
Costs/benefits Annual cost/saving Euro) Notes
Cost of greening 61.2 1323 Costs vary by a factor 0.5–1.6
Benefits from energy saving 18.4 364 Benefits depend on assumed cooling of buildings beneath greened surfaces
1) Reduced costs: electronic devices, maintenance of cars, electric grid
faults and damages to animal and trees, reduced productivity loss and flight
Benefits from heat island mitigation 11.2 221 cancellation, fire-fighting, masks; 2) Better performance of cooling, benefits
on health, transport, tourism
Assumed benefit: 20 €/urban resident per year
Benefits depend on energy saving (cooling) and assuming no mineraliza-
Benefits of GHG emission reduction 1.26 25
tion of biomass
Outstanding benefits of greening
Pollution and flooding reduction Not quantified
Health benefits Not quantified Partially included in heat island reduction
Recreation and wellbeing Not quantified
Support to biodiversity Not quantified
Improvement of urban landscapes (including value of properties) Not quantified Property value can increase by 8%15
Table 2. Summary of benefits and costs of urban greening considered in this study for the European context.
billion Є/78 billion Є), in agreement with the results of Manso et al.15 for the value of 15% estimated for the
hot-summer Mediterranean climate.
At the present carbon market price of 22.5 Є tons−1 (Ruf and M azzoni43), the annual benefit related to the
estimated reduction of greenhouse gas emissions corresponds to about 1.26 billion Є. It should be stressed
how this is apparently an upper limit of this benefit, because not all greened surfaces may correspond to roofs
of cooled building volumes, and because the biomass is likely to undergo at least a partial mineralization if not
timely removed from the green surfaces.
The benefit associated to the reduction of the heat island effect can also be quantified to some extent on the
basis of existing literature studies, although their estimation is very complex and would require ad hoc studies.
For example, for the city of Phoenix, this benefit was quantified in 80 € for 1 °C decrease per working resident,
considering costs of electronic devices, maintenance of cars and performance of c ooling47. In another analysis
for the Melbourne area, the annual cost was quantified in 18 € per inhabitant, including health, transport, social
distress, electric grid faults and damages to animal and trees48. In Malaysia, the annual cost of hazes, related to
the urban heat island, was quantified in 12 € per habitant in 1997, including cost of illness, productivity loss,
flight cancellation, tourism reduction, decline in fish landings, fire-fighting, cloud seeding and m asks46. Therefore,
costs can vary significantly among different contexts. Assuming conservatively a yearly benefit of 20 € for each
of the ca. 559.5 million European urban inhabitants living in urban areas (75% of the t otal52), the Net Present
Value (NPV) of this benefit over 40 years would be 221 billion € using a discount rate of 4%.
The cost of greening the roofs or other impervious surfaces is more difficult to quantify as it depends on
several design details and site-specific conditions. For example, in Finland the cost ranges between 70 and 80
Є m−2, in Germany between 13 and 41 Є m−2, while in Switzerland around 20 Є m−253. Assuming an average unit
cost of 50 Є m−2, the costs to turn 26,450 k m2 of impervious urban areas in Europe into green surfaces amounts
to 1323 billion Є. This corresponds to an annual cost (discount rate 4%, 40 years life) of 63 billion euro. This
means a cost of 6.3 € m−3 of annual runoff saved (assuming an average annual runoff saving of 10 k m3), which is
reasonably in line with an estimate of 9.2 € m−3 for the U.S. context, where the annual runoff volume reduction
was 12%54 compared to our estimate of 17.5%.
Assuming a lifespan of 40 years55 and a discount rate of 4%50, the NPV of the cost saving of summer cooling
over 40 years (18.4 billion Є year−1 in Table 1), that is the main private benefit of a green roof installed in a private
building, is 364 billion Є (using a discount rate of 4%). The benefits of CO2 reduction, monetized in an emission
trading system, would lead to a NPV of 24.85 ≈ 25 billion Є over 40 years (55.8 Mtons year−1). The NPV of the
heat island benefit over 40 years would be 221 billion €. Deducting the sum of these benefits (totalling 610 billion
€) from the estimated investment of 1323 billion €, yields a net gap of 713 billion Є, corresponding to an annual
cost of about 60 € for each of the 559.5 million European citizens living in urban areas. This estimated annual
cost is apparently affected by the uncertainty on green roof costs: it could reduce to 4 Є/year per urban citizen if
the cost of the green roof is 25 Є m−2, and 129 Є/year per urban citizen if the cost is 80 Є m−2. An annual cost of
60 Є/year per urban citizen may be in many cases compensated by the additional benefits not quantified here.
For example, the average increase of property value (rental prices) was estimated to be 8%15. Other benefits can
be associated e.g. to leisure and recreation, socialization, amenity of the urban environment, and the creation of
habitat or ecological connections in urban areas, besides the abovementioned positive effects in terms of water
pollution and floods. Table 2 summarizes the economic results.
The harvesting of runoff is a potential additional benefit, but it also entails costs. These can be quantified as a
first approximation considering a cost of the storage volume Cs = 50 € m−3, a lifetime of the storage of 100 years,
a discount rate of 4% and annual operation and maintenance costs of 3% of the investment. For a unit greened
surface, the runoff potentially harvested equals P-RR and can be computed from Eq. 3, while the required storage
volume to harvest it is given by Eq. 6. The cost of harvesting one m3 of runoff (marginal harvesting costs) follows
Scientific Reports | (2021) 11:12163 | https://doi.org/10.1038/s41598-021-88141-7 7
Vol.:(0123456789)www.nature.com/scientificreports/
Figure 5. Cumulate runoff versus the cost of storage per unit of runoff, for a storage cost of 50 € m
−3. Different
climatic scenarios are shown.
from the abovementioned costing parameters. Figure 5 depicts the cumulate value of runoff as a function of
the marginal harvesting cost. It can be seen that about 75% of the runoff can be harvested with marginal costs
below 0.7 € m−3, a value compatible with urban water prices usually applied in Europe. Cs may be lower than 50
€ m−3 , but often it may also be higher. Hence our calculation can be only regarded as a first indication and is
accurate not more than within one order of magnitude. The quality of water from green surface runoff harvest-
ing is arguably adequate for non-potable domestic use, but depends on the type of green roof and v egetation13.
Conclusions
In this study, meta-models were used to estimate the maximum achievable benefits of urban greening at the
European scale, focusing on converting 26450 k m2, or 35% of the European urban surfaces into green surfaces
Our results show how green roofs may deliver significant benefits to European cities. They cool surfaces by
between 2.5° and 6°, causing a reduction of sensible heat to the atmosphere, a driver of urban heat island effects,
reducing air temperature of about 50% with respect to the surface temperature reduction. We estimate the benefits
associated to surface temperature reduction at a NPV of 221 billion over 40 years. The reduction of heat flow
to buildings corresponds to a potential cooling energy saving of about 92 TWh year−1 in the present scenario,
which turns into energy cost savings whose upper limit is estimated at a NPV of 364 billion € over 40 years.
The combined effect of carbon dioxide sequestration by biomass growing on green roofs, and energy savings
can be up to 55.8 Mtons per year (present scenario), with a sequestration component of 25.9 Mtons year−1 (if
biomass is removed or accumulated and not mineralized), yielding a NPV of avoided greenhouse gas emissions
of about 25 billion € over 40 years . These monetized benefits, though, cover at best less than half of the costs of
implementing urban greening, which we estimate to have a NPV of 1323 billion €.
Urban greening has the potential to reduce urban runoff by about 17.5%, helping reduce urban diffuse pol-
lution and the frequency of combined sewer overflows. As such, the role of green roofs should be considered
in the context of river basin management. The residual runoff from green roofs could be in principle harvested
and reused, but this would require an adequate storage capacity to buffer demand and availability. The costs of
harvested runoff are usually expected to be below 0.7 € m−3, although the quality of water may not be sufficient
for potable use.
We did not quantify the benefits related to runoff reduction and combined sewer overflow mitigation, nor to
the economic value of the biomass beyond carbon sequestration, and our study does not explicitly address other
benefits of urban greening, including possible increase of property values, socialization (e.g. related to community
gardening) and wellbeing. Biodiversity improvement is also an important benefit, supporting pollination and
improving the environmental quality of urban landscapes. Due to the fact that urban greening requires for a
large part private investments, if we want to implement it on a large scale on European urban surfaces, we may
need appropriate fiscal and funding policies. According to our quantification, the costs of greening not covered
by the monetized benefits would be around 60 € per year per urban citizen. In many situations, the additional
benefits not monetized in our study may be worth these costs. When this is the case, urban greening could rep-
resent a multifunctional no-regret, cost-effective solution meeting the aspirations of the European (and global)
sustainability agenda.
Received: 29 October 2020; Accepted: 8 March 2021
References
1. European Commission. The future of cities—opportunities, challenges and the way forward. EUR 29752 EN, 2019. https://doi.
org/10.2760/375209.
Scientific Reports | (2021) 11:12163 | https://doi.org/10.1038/s41598-021-88141-7 8
Vol:.(1234567890)www.nature.com/scientificreports/
2. Li, D. et al. Urban heat island: Aerodynamics or imperviousness?. Sci. Adv. 5, 4 (2019).
3. Patz, J. A., Campbell-Lendrum, D., Holloway, T. & Foley, J. A. Impact of regional climate change on human health. Nature 438,
310–317 (2005).
4. Sharma, A. et al. Green and cool roofs to mitigate urban heat island effects in the Chicago metropolitan area: Evaluation with a
regional climate model. Environ. Res. Lett. 11(6), 064004 (2016).
5. Pistocchi, A. Hydrological Impacts of Soil Sealing and Urban Land Take 157–168 (Land Cover and Soil Ecosystem Services, 2017).
6. Pistocchi, A. A preliminary pan-European assessment of pollution loads from urban runoff. Environ. Res. 182, 109129 (2020).
7. Darmanto, N. S., Varquez, A. C. G., Kawano, N. & Kanda, M. Future urban climate projection in a tropical megacity based on
global climate change and local urbanization scenarios. Urban Clim. 29, 100482 (2019).
8. Chandler, T. J. London’s Urban climate. Geogr. J. 128(3), 279–298 (1962).
9. Bowler, D., Buyung-Ali, L., Knight, T. & Pullin, A. Urban greening to cool towns and cities: A systematic review of the empirical
evidence. Landsc. Urban Plan. 97(3), 147–155 (2010).
10. Chang, C. R., Li, M. H. & Chang, S. D. A preliminary study on the local cool-island intensity of Taipei city parks. Landsc. Urban
Plan. 80(4), 386–395 (2007).
11. Park, M., Hagishima, A., Tanimoto, J. & Narita, K. I. Effect of urban vegetation on outdoor thermal environment: Field measure-
ment at a scale model site. Build. Environ. 56, 38–46 (2012).
12. Spronken-Smith, R. A. & Oke, T. R. The thermal regime of urban parks in two cities with different summer climates. Remote Sens.
19(11), 2085–2104 (1998).
13. Berndtsson, J. C. Green roof performance towards management of runoff water quantity and quality: A review. Ecol. Eng. 36(4),
351–360 (2010).
14. Soulis, K. X., Ntoulas, N., Nektarios, P. A. & Kargas, G. Runoff reduction from extensive green roofs having different substrate
depth and plant cover. Ecol. Eng. 102, 80–89 (2017).
15. Manso, M., Teotónio, I., Silva, C. M. & Cruz, C. O. Green roof and green wall benefits and costs: A review of the quantitative
evidence. Renew. Sustain. Energy Rev. 135, 110111 (2021).
16. Shafique, M., Kim, R. & Kyung-Ho, K. Green roof for stormwater management in a highly urbanized area: The case of Seoul, Korea.
Sustainability 10(3), 584 (2018).
17. Zhang, Q. et al. The capacity of greening roof to reduce stormwater runoff and pollution. Landsc. Urban Plan. 144, 142–150 (2015).
18. La Roche, P. & Berardi, U. Comfort and energy savings with active green roofs. Energy Build. 82, 492–504 (2014).
19. Susca, T., Gaffin, S. R. & Dell’Osso, G. R. Positive effects of vegetation: Urban heat island and green roofs. Environ. Pollut. 159(8–9),
2119–2126 (2011).
20. Issa, R. J., Leitch, K. & Chang, B. Experimental heat transfer study on green roofs in a semiarid climate during summer. Construct.
Eng. 20, 20 (2015).
21. Kuronuma, T. et al. CO2 payoff of extensive green roofs with different vegetation species. Sustainability 10(7), 2256 (2018).
22. Whittinghill, L. J., Rowe, D. B., Schutzki, R. & Cregg, B. M. Quantifying carbon sequestration of various green roof and ornamental
landscape systems. Landsc. Urban Plan. 123, 41–48 (2014).
23. Van Renterghem, T. & Botteldooren, D. Reducing the acoustical façade load from road traffic with green roofs. Build. Environ.
44(5), 1081–1087 (2009).
24. Baldock, K. C. R. et al. A systems approach reveals urban pollinator hotspots and conservation opportunities. Nat. Ecol. Evol. 3,
363–373 (2019).
25. Blackhurst, M., Hendrickson, C. & Matthews, H. S. Cost-effectiveness of green roofs. Archit. Eng. 16(4), 136–143 (2010).
26. Orsini, F. et al. Exploring the production capacity of rooftop gardens (RTGs) in urban agriculture: The potential impact on food
and nutrition security, biodiversity and other ecosystem services in the city of Bologna. Food Secur. 6(6), 781–792 (2014).
27. Colla, S. R., Willis, E. & Packer, L. Can green roofs provide habitat for urban bees (Hymenoptera: Apidae)?. Cities Environ 2(1), 4
(2009).
28. Fernández Cañero, R. & González Redondo, P. Green roofs as a habitat for birds: A review. Anim. Vet. Adv. 9(15), 2041–2052
(2010).
29. European Commission. The European Green Deal, COM (2019) 640 final.
30. Quaranta, E., Dorati, C. & Pistocchi, A. Meta-models for rapid appraisal of the benefits of urban greening in the European context.
Hydrol. Region. Stud. 34, 100772 (2021).
31. Pistocchi, A., Bouraoui, F. & Bittelli, M. A simplified parameterization of the monthly topsoil water budget. Water Resour. Res. 44,
12 (2008).
32. Neitsch, S. L., Arnold, J. G., Kiniry, J. R. & Williams, J. R. Soil and Water Assessment Tool, Theoretical Documentation Version (Texas
Water Resources Institute, 2011).
33. Bisselink, B. et al. Impact of a changing climate, land use, and water usage on Europe’s water resources. A model simulation study.
EUR 29, 130 (2018), EUR 29130 EN, ISSN 1018-5593 (print), 1831-9424 (online) DOI: 10.2760/847068 (online)10.2760/09027
(print).
34. Moss, R. H. et al. The next generation of scenarios for climate change research and assessment. Nature 463(7282), 747–756 (2010).
35. Pistocchi, A., Dorati, C., Aloe, A., Ginebreda, A. & Marcé, R. River pollution by priority chemical substances under the Water
Framework Directive: A provisional pan-European assessment. Sci. Total Environ. 662, 434–445 (2019).
36. Werner, S. European space cooling demands. Energy 110, 148–156 (2016).
37. Grave, K., Breitschopf, B., Ordonez, J., Wachsmuth, J., Boeve, S., Smith, M., Schubert, T., Friedrichsen, N., Herbst, A., Eckartz, K.,
Pudlik, M., Bons, M., Ragwitz, M., Schleich J. Prices and costs of EU energy. Report of European Commission 2016, Ecofys.
38. European Insulation Manufacturers Associations (EURIMA), 2017. https://www.eurima.org/u-values-in-europe/.
39. The Renewable Energy Information Source (Rensmart). https://www.rensmart.com/Calculators/KWH-to-CO2. Accessed Jan
2020.
40. Bódis, K., Kougias, I., Jäger-Waldau, A., Taylor, N. & Szabó, S. A high-resolution geospatial assessment of the rooftop solar pho-
tovoltaic potential in the European Union. Renew. Sustain. Energy Rev. 114, 109309 (2019).
41. Saliendra, N., Liebig, M. & Kronberg, S. Carbon use efficiency of hayed alfalfa and grass pastures in a semiarid environment.
Ecosphere 9(3), e02147 (2018).
42. Gilmanov, T. G. et al. Productivity and carbon dioxide exchange of leguminous crops: Estimates from flux tower measurements.
Agron. J. 106(2), 545–559 (2014).
43. Ruf, P., & Mazzoni, M. The European carbon market: The impact of higher carbon prices on utilities and industries, Market Insight
Reed, Business Information Ltd.
44. Saneinejad, S., Moonen, P. & Carmeliet, J. Comparative assessment of various heat island mitigation measures. Build. Environ. 73,
162–170 (2014).
45. Alakama, R. & Cescatti, A. Biophysical climate impacts of recent changes in global forest cover. Science (Res. Rep.) 351(6273),
600–604 (2016).
46. Elsayed, I. Mitigation of the Urban Heat Island of the City of Kuala Lumpur, Malaysia. Middle-East Sci. Res. 11(11), 1602–1613
(2012).
47. Miner, M., Taylor, R., Jones, C. & Phelan, P. Efficiency, economics, and the urban heat island. Environ. Dev. (IIED) 29(1), 183–194
(2017).
Scientific Reports | (2021) 11:12163 | https://doi.org/10.1038/s41598-021-88141-7 9
Vol.:(0123456789)www.nature.com/scientificreports/
48. Van Raalte, L., Nolan, M., Thakur, P., Xue, S. & Parker, N. Economic Assessment of the Urban Heat Island Effect (AECOM Australia
Pty Ltd, 2012).
49. Li, Z. et al. Comparing cropland net primary production estimates from inventory, a satellite-based model, and a process-based
model in the Midwest of the United States. Ecol. Model. 277, 1–12 (2014).
50. Carter, T. & Keeler, A. Life-cycle cost-benefit analysis of extensive vegetated roof systems. Environ. Manag. 87(3), 350–363 (2008).
51. Dalin, P., Nilsson, J., Rubenhag, A. The European Cold Market Final Report. Ecoheatcool and Euroheat & Power 2016, Brussels.
52. World Bank (2019). https://data.worldbank.org/indicator/SP.URB.TOTL.IN.ZS?locations=EU.
53. Nurmi, V., Votsis, A., Perrels, A., & Lehvävirta, S. Cost-benefit analysis of green roofs in urban areas: Case study in Helsinki, Finn-
ish Meteorological Institut 2013, 2 (ISBN 978-951-697-787-7).
54. Chen, J. et al. Evaluation of the effectiveness of green infrastructure on hydrology and water quality in a combined sewer overflow
community. Sci. Total Environ. 665, 69–79 (2019).
55. Feng, H. & Hewage, K. N. Economic benefits and costs of green roofs. Nat. Based Strat. Urban Build. Sustain. 20, 307–318 (2018).
56. Charalambous, K., Bruggeman, A., Eliades, M., Camera, C. & Vassiliou, L. Stormwater retention and reuse at the residential plot
level—green roof experiment and water balance computations for long-term use in cyprus. Water 11(5), 1055 (2019).
57. Deng, S., Shi, Y., Jin, Y. & Wang, L. A GIS-based approach for quantifying and mapping carbon sink and stock values of forest
ecosystem: A case study. Energy Proced. 5, 1535–1545 (2011).
58. European Commission. Study on Water efficiency Standards. Bio intelligence Service- Scaling Sustainable Development 2009,
070307/2008/5208889/ETU/D2.
59. Laminack, K. D. Green Roof Water Harvesting and Recycling Effects on Soil and Water Chemistry and Plant Physiology, 2014
(Doctoral dissertation).
60. Van Der Knijff, J. M., Younis, J. & De Roo, A. LISFLOOD: A GIS-based distributed model for river basin scale water balance and
flood simulation. Geogr. Inf. Sci. 24(2), 189–212 (2010).
61. Vestrella, A., Savé, R. & Biel, C. An experimental study in simulated green roof in Mediterranean climate. Agric. Sci. 7(4), 95 (2015).
62. Wang, G., Jager, H. I., Baskaran, L. M. & Brandt, C. C. Hydrologic and water quality responses to biomass production in the Ten-
nessee river basin. GCB Bioenergy 10(11), 877–893 (2018).
63. Pistocchi, A., Beck, H., Bisselink, B., Gelati, E., Lavalle, C., Feher, J.; Water scenarios for the Danube River Basin: Elements for the
assessment of the Danube agriculture-energy-water nexus; EUR 27700 EN; doi:10.2788/375680; 2015
64. Rippl, W. (1883) “The capacity of storage reservoirs for water supply” Instit. Civ. Eng. Proc., 71, 270-278
Acknowledgements
This work was conducted within the research project WEFE (Water Energy Food Ecosystem Nexus) at the Joint
Research Centre of European Commission. We would like to thank JRC colleagues Marco Pastori and Alessandro
Cescatti for their suggestions and inputs.
Author contributions
E.Q. and A.P. designed the study and wrote the manuscript.C.D. curated the data,. E.Q. and A.P. performed the
analysis. A.P. supervised and steered the study.
Competing interests
The authors declare no competing interests.
Additional information
Supplementary Information The online version contains supplementary material available at https://doi.org/
10.1038/s41598-021-88141-7.
Correspondence and requests for materials should be addressed to E.Q.
Reprints and permissions information is available at www.nature.com/reprints.
Publisher’s note Springer Nature remains neutral with regard to jurisdictional claims in published maps and
institutional affiliations.
Open Access This article is licensed under a Creative Commons Attribution 4.0 International
License, which permits use, sharing, adaptation, distribution and reproduction in any medium or
format, as long as you give appropriate credit to the original author(s) and the source, provide a link to the
Creative Commons licence, and indicate if changes were made. The images or other third party material in this
article are included in the article’s Creative Commons licence, unless indicated otherwise in a credit line to the
material. If material is not included in the article’s Creative Commons licence and your intended use is not
permitted by statutory regulation or exceeds the permitted use, you will need to obtain permission directly from
the copyright holder. To view a copy of this licence, visit http://creativecommons.org/licenses/by/4.0/.
© The Author(s) 2021
Scientific Reports | (2021) 11:12163 | https://doi.org/10.1038/s41598-021-88141-7 10
Vol:.(1234567890)You can also read