An Integrated Approach to Study Spatial Patterns and Drivers of Land Cover Within Urban Functional Units: A Multi-City Comparative Study in China
←
→
Page content transcription
If your browser does not render page correctly, please read the page content below
remote sensing
Article
An Integrated Approach to Study Spatial Patterns and
Drivers of Land Cover Within Urban Functional
Units: A Multi-City Comparative Study in China
Hua-Feng Wang 1,2 , Xia-Lan Cheng 1 , Mir Muhammad Nizamani 1 , Kelly Balfour 3 ,
Liangjun Da 2 , Zhi-Xin Zhu 1 and Salman Qureshi 4, *
 1    Hainan Key Laboratory for Sustainable Utilization of Tropical Bioresources, School of Life and
      Pharmaceutical Sciences, Hainan University, Haikou 570228, China; hfwang@hainanu.edu.cn (H.-F.W.);
      chengxialan@hainanu.edu.cn (X.-L.C.); mirmuhammadnizamani@hainanu.edu.cn (M.M.N.);
      992982@hainanu.edu.cn (Z.-X.Z.)
 2    Shanghai Key Lab for Urban Ecological Processes and Eco-Restoration, School of Ecological and
      Environmental Sciences, East China Normal University, Shanghai 200041, China; ljda@des.ecnu.edu.cn
 3    Department of Biology, Algoma University, Sault Sainte Marie, ON P6A 2G4, Canada; kbalfour@algomau.ca
 4    Department of Geography, Humboldt University of Berlin, Rudower Chaussee 16, 12489 Berlin, Germany
 *    Correspondence: salman.qureshi@geo.hu-berlin.de

 Received: 14 May 2020; Accepted: 7 July 2020; Published: 9 July 2020

 Abstract: Understanding the factors that drive green space composition and richness in heterogeneous
 urban landscapes is critical for maintaining important ecosystem services and biodiversity. Few studies
 have been conducted on urban greening and plant diversity at the urban functional unit (UFU) level,
 although a handful of studies have explored the drivers of greening percentage and its relationships with
 plant richness in tropical cities. In this study, we conducted field surveys, compiled census and remote
 sensing data, and performed spatial analyses to investigate the interrelationship between greening
 percentages, plant diversity, and the socioeconomic variables of different primary and secondary UFUs
 in the cities of Beijing, Zhanjiang, and Haikou in China. We found that these relationships did not differ
 significantly between primary and secondary UFUs, and that Parks represented the largest areas of
 forested land, grassland, and water bodies across all three cities. Moreover, the greening percentages
 of all UFUs across these three cities were positively correlated with both socioeconomic variables and
 plant species richness. These relationships can be utilized to guide future green space planning within
 urban ecosystems.

 Keywords: plant diversity; remote-sensing images; socioeconomic; socio-ecological complexities;
 urban ecology; tropical area; urban green space; urban greening

1. Introduction
     As the “green lung” of urban ecosystems [1], vegetation plays an irreplaceable role in the urban
ecological environment as well as in the social functioning and well-being of the human population [2–5].
The structure of urban green space determines its ability to provide ecosystem services and functions,
such as food production and erosion protection [6]. Understanding the relationship between urbanization
intensity and the structure and attributes of urban green space is the central topic of urban ecological and
biodiversity conservation. This is also an urgent task for modern cities aiming to optimize infrastructure
and protect the urban ecological environment [1,7], which is conducive to maximizing the function of
ecological services and designing suitable urban green infrastructure [4]. Exploring the coupling mechanism
between urban plant diversity and both socioeconomic and natural environmental factors will aid our
understanding of the spatiotemporal variation of urban vegetation patterns and the evolution of urban

Remote Sens. 2020, 12, 2201; doi:10.3390/rs12142201                       www.mdpi.com/journal/remotesensing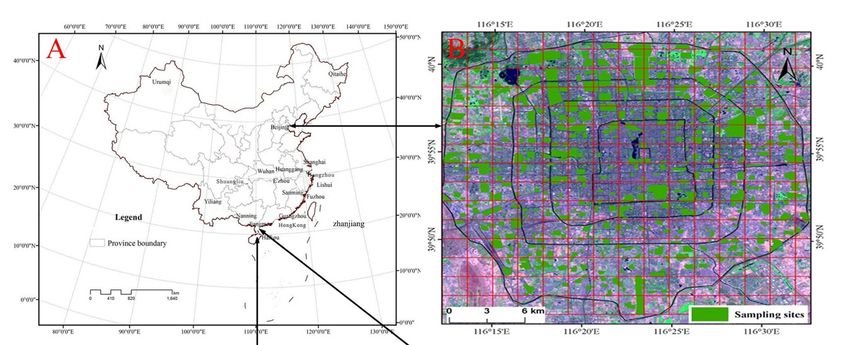
Remote Sens. 2020, 12, 2201                                                                                2 of 19

ecosystems. Additionally, this will provide the theoretical basis and scientific support for understanding
the interaction between human social and economic activities and the urban ecological environment [8–10].
      To provide scientific suggestions for the sustainable development of tropical coastal cities in
China, we must strengthen our understanding of plant diversity variation across urban ecosystems
as well as the driving mechanisms of this variation within different tropical cities. Urban functional
units (UFUs) are ideal models for analyzing the components of urban ecosystems and powerful
grippers for uncovering complex and highly heterogeneous urban ecosystem structures. A UFU is a
physical space with a defined boundary within an urban area (e.g., a park, school, residential area,
road, etc.), and is utilized by humans to perform a specific function, such as education, transportation,
or residency. UFUs have also been called urban structure units [10–13]. At different levels of social
and economic development, the study of urban vegetation patterns combines both natural and
anthropogenic factors to reveal the mechanisms responsible for vegetation pattern variation between
different UFUs [14–16]. Groffman et al. [17] studied the composition of land cover, landscape structure,
and ecosystem functions in six major cities in the United States (Miami, Baltimore, Boston, Minneapolis,
Sao Paulo, and Los Angeles), and found that biological homogenization extends to the structure and
function of ecosystems (continental scale, carbon dynamics, and microclimate) from the regional to the
continental scale. Although the structure of China’s urban green space is somewhat similar to other
countries around the world, it is more fragmented and less discrete than that of other countries [6].
Thus, the quantitative mechanism of environmental factors and management measures on urban
vegetation remains unclear [18]. Da et al. [19] proposed “learning from nature” through the “different
age compound deciduous-evergreen mixed forest” urban landscape construction model; this model
was implemented in Shanghai Pudong for the construction of the Shanghai Urban Landmark plant
community, which has provided guidance and reference for similar greening projects in the country.
Zhang et al. [4] recommended improving the service function of urban forests by increasing the average
fractal dimension, thereby maintaining the aggregation and proximity of forest patches.
      There are three shortcomings regarding UFU-based studies: firstly, only a few studies have been
conducted at the UFU level within cities across China as a means of studying urban vegetation patterns;
secondly, few studies have compared variations within different UFU types between the rapidly urbanizing
inland cities and tropical coastal cities; thirdly, fewer studies have explored the drivers of greening percentage
and their relationship with plant richness at the UFU level [10–13]. We address these shortcomings through
this study.
      We coupled remote sensing interpretation with field investigation, and obtained the land-use
statuses of UFUs in the suburban gradients of three cities in China: Beijing, Haikou, and Zhanjiang.
The spatial patterns of green patches in all UFU types were analyzed using data pertaining to the
socioeconomic characteristics of the area. We searched for a correlation between land use and green
space characteristics across different UFUs as well as social and economic factors, such as population
density, maintenance practices, and housing prices. We also determined the influence of urbanization,
as reflected by increases in population density and building floor proportion, on land use and the
patterns of urban green space within different UFU types. We mapped and quantified the land cover
patterns of UFUs in Beijing, Zhanjiang, and Haikou with SPOT 5 (Satellite Pour l’Observation de la
Terre) [20] images taken in 2010. In this study, we aimed to (1) dynamically map the spatial extent of
urban land cover across different primary and secondary UFUs; (2) compare the greening percentages
of different UFUs and identify possible drivers; and (3) analyze the relationships between greening
percentages and species richness across different UFUs within Beijing, Zhanjiang, and Haikou.

2. Materials and Methods

2.1. Field Survey and Sampling Settings
    A combination of mesh sampling and random sampling comprising field surveys for urban
vegetation, UFU types, and a socioeconomic questionnaire were completed in Haikou, Zhanjiang,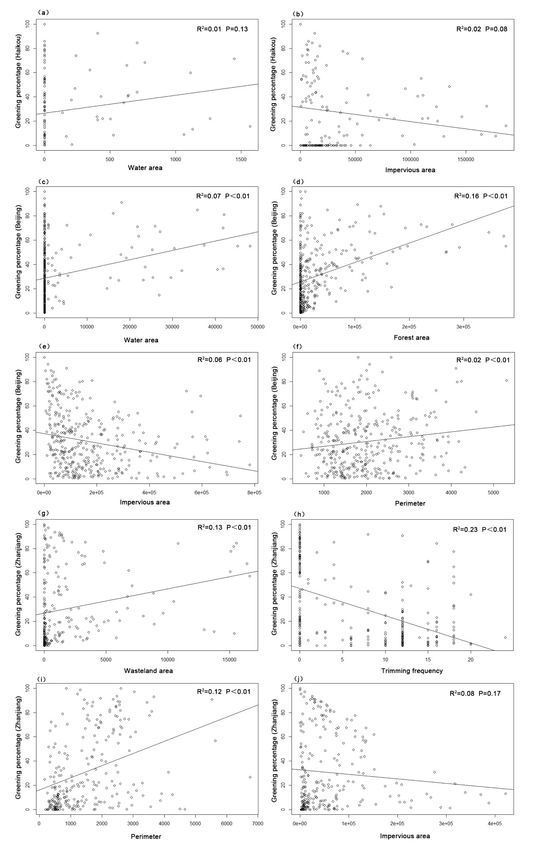
Remote Sens. 2020, 12, 2201                                                                             3 of 19

and Beijing [10,13,21]. After selecting the sampling areas, a kilometer grid was used to divide the city into
several uniformly sized lattices. Mesh sampling was used to ensure that urban vegetation was sampled
uniformly within each of the three cities. The comprehensive consideration of all UFU types in the grid
ensured that all urban sampling points were represented. This sampling method combined the uniformity
and representativeness of samples, which can better reflect the basic characteristics of urban green space;
however, the use of random sampling led to the abandonment of certain sample sites, such as those located
on impervious surfaces, large areas of water, or in unreachable regions. The completion of sampling in
urban areas is subject to restrictions and obstacles; for example, the landowners often denied us access to
private UFUs. Moreover, randomly selected regions often have large areas that are covered with some
impervious surface or water, thus making plant sampling impossible or meaningless. Such restrictions
and obstacles were present, so we were unable to use strictly stratified random sampling, which would
have been desirable. We therefore adopted a purposive sampling method based on Wang et al. [13].
      To include sites that represented the distribution of socioeconomic variables in Beijing, we applied the
following procedure, which has key elements of iterative random sampling [10]. Two scenes of cloud-free
SPOT 5 (Satellite Pour l’Observation de la Terre) images of the urban area of Haikou (north of Haikou
West Line) for the year 2010 were obtained. These images were divided into 190 2 × 2 km grids [10,13,22]
according to the probability theory of double density mosaic stratified sampling, which proposes a 3:1
sampling density in urban areas and suburbs [23]. A comprehensive analysis was completed to determine
the UFU types within each grid. To make the repeated set-up of plant sampling at each location easier,
each long-term observation sampling area was assigned one or more markers, such as buildings, as well
as GPS positioning and topographic map marking—detailed records of these data were kept. Based on
the American Urban Forestry classification [24], we selected hundreds of UFUs within each city to ensure
that the sampling areas were equally represented.
      The same standard was used to determine the urban and rural gradient division of Haikou and
Zhanjiang. The classification criteria for urban areas and suburbs were determined according to the
proportion of impervious area in the sample site: the impervious rate was 67–100% for urban areas,
34–66% for the suburbs, and 34% for non-urban areas [25]. Three sides of Haikou and Zhanjiang were
covered by the sea (Figure 1C,D).

2.2. Remote Sensing Interpretation of Land Cover Type
      The urban greening percentage was calculated by dividing the total areas of forest, mixed forest
and herb, and herb by the total area of each UFU. A suitable land cover classification system developed
by Cadenasso et al. [26] was applied for the identification of land cover levels from SPOT 5 images.
Land use/land cover maps for the study areas were derived using the object-based image analysis
(OBIA) method. Two SPOT image scenes were obtained for each city from August 30 (all) as well
as October 12 (Haikou), October 23 (Zhanjiang), or October 25 (Beijing) of 2010 (four colors banded;
10 m resolution)—these were used as the primary source for land use and land cover (LULC) classification.
We performed multi-resolution image segmentation to generate image objects to which the classification
algorithm could be applied. For this segmentation, we used a scale ‘parameter’ of 20, which was determined
by the visual interpretation of the segmentation results. An important result of the segmentation process
was the identification of uniform objects and features that could be used for classification (e.g., spectral
values, shapes, textures, etc.) [27]. Once segmentation was achieved, we used a combination of fuzzy rules
and standards nearest neighbor (SNN) algorithms to classify each image object. We selected more than
100 training samples and reference assistance data including digital topographic maps, field survey data,
high spatial resolution image (QB), and Google Earth to identify their representative classes. Based on the
spectral and spatial information of these samples, we created SNN feature space and fuzzy rule algorithms
for classification. Each image object was assigned a probability of the LULC class to which it belonged,
and the final image object class was determined based on which class had the highest probability. Finally,
we refined the classification by manual adjustment to improve the overall quality. As a result, six categories
were identified using the Definiens 7.0 software: exposed land, open waters, forests, high-density cities,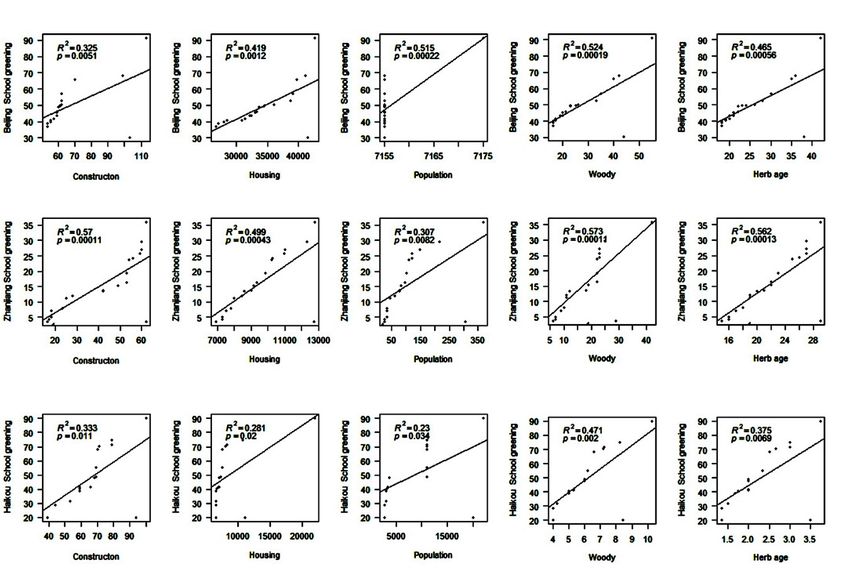
Remote Sens. 2020, 12, 2201 4 of 19
low-density cities, and farmland. Classification accuracy was assessed by comparing the reference collection
with the classified image [28]. Based on the confusion matrix, the overall accuracy of the land cover
classification was 94.42% with a Kappa coefficient of 0.94. By employing the LULC map, we further
Remote Sens. 2020, 12, x FOR PEER REVIEW 4 of 21
determined the percentage of each LULC type in each UFU in ArcGIS 10 (ESRI).
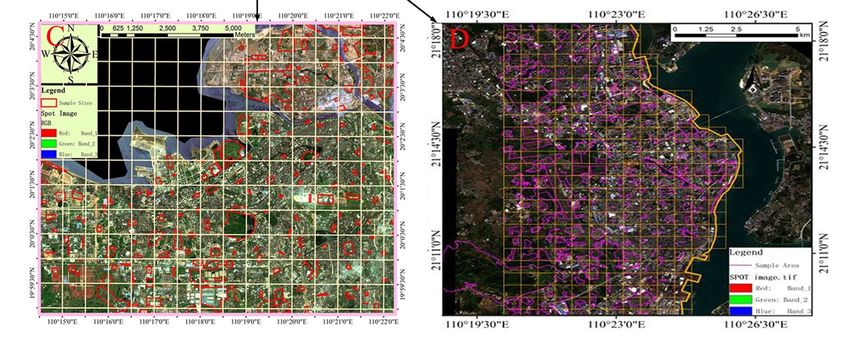
1. Satellite
FigureFigure images
1. Satellite showing
images the locations
showing the locationsof the
of study sitessites
the study (A)(A)as well as the
as well sampling
as the samplingarea within
area
the cities
withinof the
Beijing
cities(B); cited from
of Beijing Wang
(B); cited from etWang
al. [10,13], two scenes
et al. [10,13], of cloud-free
two scenes SPOT
of cloud-free SPOT5 (Satellite
5 (SatellitePour
l’Observation de la Terre)
Pour l’Observation de images
la Terre)with
imagesspatial
with resolution of 10 m
spatial resolution of and
10 macquisition datesdates
and acquisition of 30ofAugust
30
and 25 October
August and2002), Haikou
25 October (C);Haikou
2002), cited from Zhufrom
(C); cited et al.Zhu
[11], Satellite
et al. Pour l’Observation
[11], Satellite de lade
Pour l’Observation Terre)
with alaspatial
Terre) resolution
with a spatial resolution
of 10 of 10 m
m (accessed in (accessed
October 2010)in October 2010) and Zhanjiang
and Zhanjiang (D); cited(D);
fromcited fromet al.,
Cheng
underCheng
review; et One
al., under review;
Spot 193 OneofSpot
image our 193
studyimage
areaof(November
our study area27th,(November
2016) with27th, 2016) with
a resolution of a1.5 m
resolution of 1.5 m was interpreted in order to
was interpreted in order to assess the ground cover of each UFU).assess the ground cover of each UFU).
2.2. Remote
There Sensing
is a time Interpretation
difference of Land
between Cover
these Type sensing and socio-economic data, but this is also
remote
the case inThe
similar
urban greening percentage was calculated bywith
studies [29,30]. Due to limitations ourthe
dividing funding, weof
total areas were not
forest, able forest
mixed to obtain
2017/18
andSPOT
herb, remote
and herbsensing data
by the total forofthe
area three
each UFU.cities, and socio-economic
A suitable data were
land cover classification systemnotdeveloped
available for
by Cadenasso
hundreds of UFUsetwithin
al. [26]Beijing,
was applied for the
Haikou, andidentification
Zhanjiangoffor land
thecover
year levels
2002. from SPOT 5 images.
We decided to identify
Land use/land cover maps for the study areas were derived using the object-based
correlations between SPOT in different years (see legend of Figure 1) and socio-economic data in image analysis
(OBIA)
2017/2018 formethod.
the sameTwo SPOT image scenes were obtained for each city from August 30 (all) as well as
UFUs.
October 12 (Haikou), October 23 (Zhanjiang), or October 25 (Beijing) of 2010 (four colors banded; 10 m
resolution)—these
2.3. Field were used as the primary source for land use and land cover (LULC) classification.
Vegetation Survey
We performed multi-resolution image segmentation to generate image objects to which the
Aclassification
stratified algorithm
samplingcould
method was used
be applied. to complete
For this segmentation, vegetation
we used asurveys within each
scale ‘parameter’ of 20,UFU.
We investigated trees, shrubs,
which was determined andvisual
by the herbinterpretation
layers in eachofUFU, and randomly
the segmentation selected
results. a sampling
An important resultpoint
of in
each layer. If the trunkprocess
the segmentation of an individual woody plant
was the identification was larger
of uniform thanand
objects 2 cm in diameter,
features it was
that could considered
be used for
a tree,classification
otherwise it (e.g., spectral values,
was classified shapes,
as a shrub. We textures, etc.) [27].
had at least threeOnce
10 msegmentation was achieved,
× 10 m tree sampling plotswewithin
used a combination of fuzzy rules and standards nearest neighbor (SNN)
each UFU with five 2 m × 2 m shrub sampling plots and five 1 m × 1 m herb sampling plots algorithms to classify each
nested
withinimage object.
each tree WeFor
plot. selected
UFUsmore
whichthan
were100 training
highly samples and(e.g.,
heterogeneous reference
Parks)assistance
or had an data
areaincluding
greater than
digital topographic maps, field survey data, high spatial resolution image (QB), and Google Earth to
30 square kilometers, more than three tree plots were sampled. We recorded the species name, diameter
identify their representative classes. Based on the spectral and spatial information of these samples, we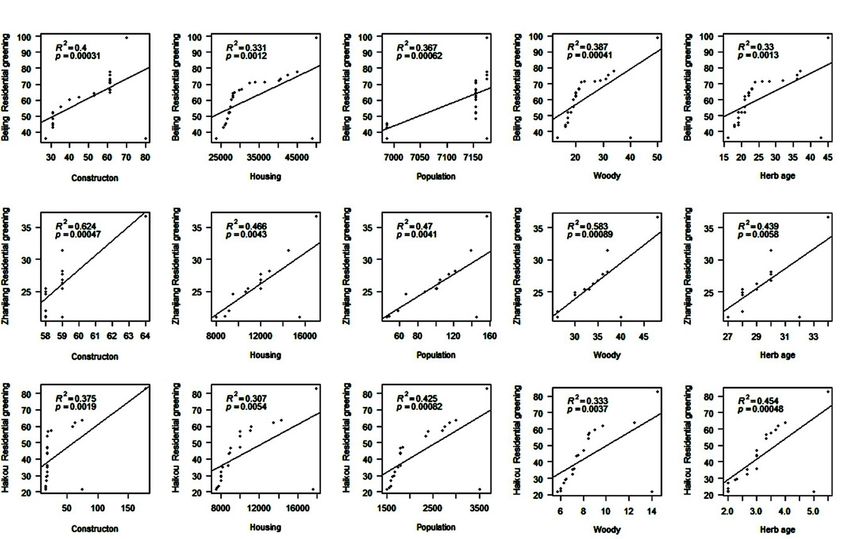
Remote Sens. 2020, 12, 2201                                                                         5 of 19

at breast height (DBH), height, and crown width of each tree; the species name, height, and crown width
of each shrub; and the species name, height, and population size of each herb. The plant richness and
density variables were calculated as follows: tree and shrub richness = the total number of tree and shrub
species in three 10 m × 10 m tree/shrub plots for each UFU; herb richness = the number of herb species in
each 1 m × 1 m herb plot.

2.4. Socioeconomic Variables
     We collected data regarding the construction period, housing price, and population density of
each UFU. The UFU construction period was determined by referencing the city portal or through
interviews with locals of each UFU. The housing prices (yuan/square meter) within each UFU were
available from the Beijing Anju website [31] with a query time from May 1, 2017 to June 1, 2018, and the
average price of second-hand homes was also retrieved from this website. We obtained the average
number of members (B) within each family by referring to the “China cities’ Statistical Yearbook”
Beijing Municipal Bureau of Statistics [32], the Guangdong Bureau of Statistics [33], and the Hainan
Bureau of Statistics [34]. The population (P) of each UFU was determined as follows: P = B × S × M,
permanent population density (Person / km2) = P / A, where A was the area of each UFU. B is the
number of members in each family. S is the number of houses of each building, while M is the number
of buildings in the area by accessing each UFU or by referencing Google Earth images [35].

2.5. Data Analysis
     Correlation analysis was carried out with landscape pattern index and diversity data to analyze
the relationship between landscape heterogeneity and diversity, and the ecological significance of
the landscape pattern index. SPSS was used to analyze the percentage of plots containing woodland,
grassland, pavement, and buildings within three UFUs types. We also analyzed the relationship
between land use status and spatial vegetation characteristics of UFUs (greening rate, the degree of
fragmentation of green patches) and factors such as distance from city center and population density.
     The different LULC types of primary and secondary UFUs in Beijing, Zhanjiang, and Haikou
were assessed using the Urban Forest Effects (UFORE) Model: Field Data Collection Manual [24].
We analyzed the data by comparing the areas of land cover types (e.g., impervious area, forest land
area, grassland area, and water area; Figure 2) and the greening percentages of different primary and
secondary UFUs in Beijing, Zhanjiang, and Haikou; the correlation between the greening percentages of
parks, schools, and residential areas and the construction period, house price, and population density
of each city; and the correlation between the greening percentage of parks, schools, and residential
areas and species richness of woody plant species and herbaceous species in each city.
     We conducted Kruskal–Wallis tests to compare the differences between greening percentages
among UFUs in each city. We used generalized linear models (GLMs) to look for associations between
greening percentages and our list of predictors (Table 1). We performed backward stepwise regression
using the “step” function in R [36] to select the best model with the lowest Akaike information criterion
(AIC). To avoid multicollinearity of variables, we removed predictors correlated at Pearson’s r > 0.7.
Construction age, the water content of the soil, green space area, wasteland area, impervious area,
water area, perimeter, fertilization frequency, and watering frequency were log-transformed in order
to meet the assumption of normality. All predictor variables were standardized and centered before
being included in the models.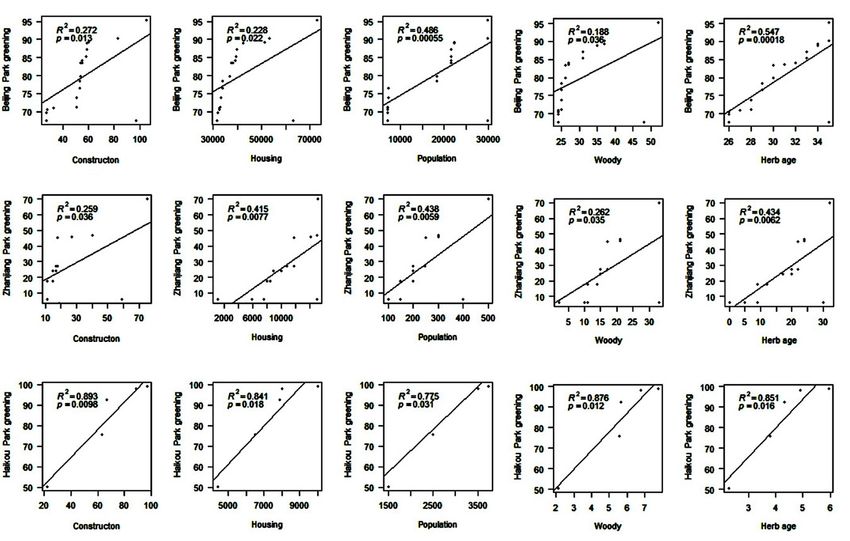
Remote  Sens.2020,
Remote Sens.  2020,12,12, 2201PEER REVIEW
                       x FOR                                                                                    9 of 21      6 of 19

     Figure
      Figure2.2.Areas
                  Areas of of
                           primary   urban
                               primary      functional
                                         urban            units units
                                                 functional     in Beijing, Zhanjiang,
                                                                       in Beijing,       and Haikou
                                                                                     Zhanjiang,    andfor impervious
                                                                                                       Haikou   for impervious
     area
      area(km
           (km) 2(a),
              2       forest
                  ) (a),      land
                         forest    areaarea
                                 land   (km2(km
                                             ) (b),2 )grassland area (km
                                                       (b), grassland
                                                                          2) (c), and
                                                                        area  (km2 ) water   area
                                                                                      (c), and    (km2)area
                                                                                                water   (d). (km2 ) (d).

      Table 1. A summary of the predictor variables used in the analysis as well as the units and transformations
      associated with each.

                               Variables                              Units                  Transformations
                                Predictors
                          UFU characteristics
                            Construction age                              year                       log(x)
                               House price                           RMB (Yuan)
                           Population density                        person/km2
                       Distance from main road                          g/100 g                      log(x)
                      Distance from urban center                        g/1000 g
                                Traffic flow                              km2                        log(x)
                                Longitude                         decimal degrees
                                 Latitude                         decimal degrees
                            Land-use factors
                             Impervious area                              km2                        log(x)
                              Wasteland area                              km2                        log(x)
                                Water area                                km2                        log(x)
                                 Perimeter                                 km                        log(x)
                          Human maintenance
                      Fertilization frequency/year                    times/year                     log(x)
                       Pesticide frequency /year                      times/year                     log(x)
                        Watering frequency/year                       times/year                     log(x)
                        Weeding frequency/year                        times/year                     log(x)
                       Trimming frequency/year                        times/year                     log(x)
                               Plant factors
                         Herb species richness                   number of species                   log(x)
                         Shrub species
     Figure 3. Areas of secondary         richness
                                      urban                      numberZhanjiang,
                                             functional units in Beijing,   of species and Haikou forlog(x)
                                                                                                      impervious
                          Tree species richness                  number of species                   log(x)
     area (km2) (a), forest land area (km2) (b), grassland area (km2) (c), and water area (km2) (d).
                         Total species richness                  number of species                   log(x)
                              Natural factors
                         Organic matter of soil                         g/1000 g                     log(x)
                          Water content of soil                         g/100 g                      log(x)
                               Temperature                                 ◦C                        log(x)
                               Precipitation                              mm                         log(x)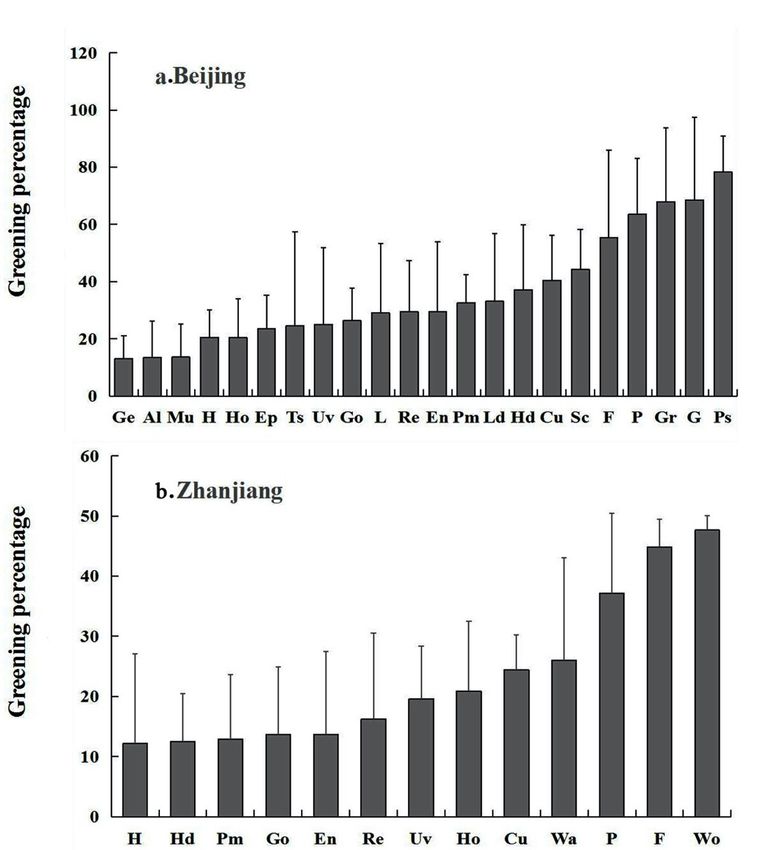
Remote Sens. 2020, 12, 2201                                                                                                             7 of 19

     We calculated Moran’s I with the R package “ape” [37] to assess whether greening percentages
were spatially autocorrelated. In cases where we found spatial autocorrelation (e.g., the greening
percentage of Zhanjiang), we also included “latitude” and “longitude” as confounding variables in
our models. Results from Moran’s I test on model residuals confirmed a notable reduction in spatial
autocorrelation. We chose a level of significance of P < 0.05 to reject the null hypothesis. All statistical
procedures were conducted in R software v 3.5.2 (R Foundation for Statistical Computing, Vienna, AT).

3. Results

3.1. The Number of Primary and Secondary UFUs Within the Three Cities
      We identified 10 primary UFU types in Beijing, the most and least numerous of which were
Institutional/Cemetery (n = 63, 21.58%) and Golf Course (n = 3, 1.03 %) respectively. We identified 31
secondary UFU types in Beijing, the most and least numerous of which were Park (n = 53, 18.15%) and
Nursery/ Shopping Center/Airport/Refuse Processing Plant (n = 1, 0.34%), respectively (Table 2).

      Table 2. The numbers and percentages of primary and secondary urban functional units within Beijing,
      Zhanjiang, and Haikou based on the Urban Forest Effects (UFORE) model.

                                                                           Beijing                Zhanjiang               Haikou
  Primary Urban Functional        Secondary Urban Functional                  Percentage              Percentage             Percentage
                                                                    Number                 Number                  Number
         Unit Type                        Unit Type                              (%)                     (%)                    (%)
                                         Farmland (F)                 6          2.05        38          14.62       -              -
                                        Greenbelt (Gr) or
        Agriculture (A)                                               5          1.71        19          7.31        -              -
                                        Woodland (Wo)
                                          Nursery (N)                 1          0.34        -             -         -              -
         Cemetery (E)                     Cemetery (E)                3          1.03        -             -         -              -
                                         Enterprise (En)              17         5.82        22          8.46        12          7.1
                                           Hotel (H)                  3          1.03        6           2.31        9          5.33
        Comm/Ind (C)
                                       Logistics centre (L)           6          2.05         -            -          -           -
                                       Shopping center (S)            1          0.34         -            -         8          4.73
        Golf course (G)                  Golf course (G)              3          1.03        -             -         -              -
                                  Colleges or universities (Cu)       34         11.64       4           1.54        7          4.14
                                  Places of historic interest and
                                                                      2          0.68        -             -         -              -
                                       scenic beauty (Ph)
        Institutional (I)                Museum (Mu)                  5          1.71        -             -         5          2.96
                                      Primary and middle
                                                                      15         5.14        18          6.92        18        10.65
                                          schools (Pm)
                                    Research institution (Ri)         7              2.4     1           0.38        4          2.37
                                    High-density residential
  Multi family residential (M)                                        38         13.01       18          6.92        40        23.67
                                          areas (Hd)
           Park (P)                          Park (P)                 53         18.15       14          5.38        6          3.55
                                    Alleyway (Hutong) (Al)            4          1.37        -             -         -              -
                                    Low-density residential
        Residential (R)                                               25         8.56        -             -         -              -
                                          areas (Ld)
                                      Urban village (Uv)              15         5.14        23          8.85        5          2.96
                                         Airport (Ai)                 1          0.34         1           0.38        -           -
                                        Bus station (Bs)              2          0.68         1          0.38         4         2.37
                                       Train station (Ts)             4          1.37         1           0.38        -           -
      Transportation (T)
                                        Parking lot (Pl)              -            -          3          1.15         -           -
                                       Traffic island (Ti)            -            -         3           1.15         -           -
                                      Road or express (Re)            9          3.08        42          16.15       24         14.2
                                    Government office (Ge)            5          1.71         -            -          1         0.59
                                       Public square (Ps)             3          1.03         -            -          -           -
                                  Refuse processing plant (Rp)        1          0.34         -            -          -           -
          Utility (U)             Sewage treatment plant (St)         2          0.68         -            -          -           -
                                        Sport center (Sc)             7           2.4         -            -          -           -
                                   Entertainment Plaza (Ep)           4          1.37         -            -          -           -
                                 Government Organizations (Go)        6          2.05        15          5.77        13         7.69
                                         Hospital (Ho)                5          1.71        8           3.08        10         5.92
                                         Wasteland (Wa)               -               -      23          8.85        -            -
          Vacant (V)
                                         Sand land (Sl)               -               -       -            -         3          1.78
             Total                                                   292             100    260          100        169            100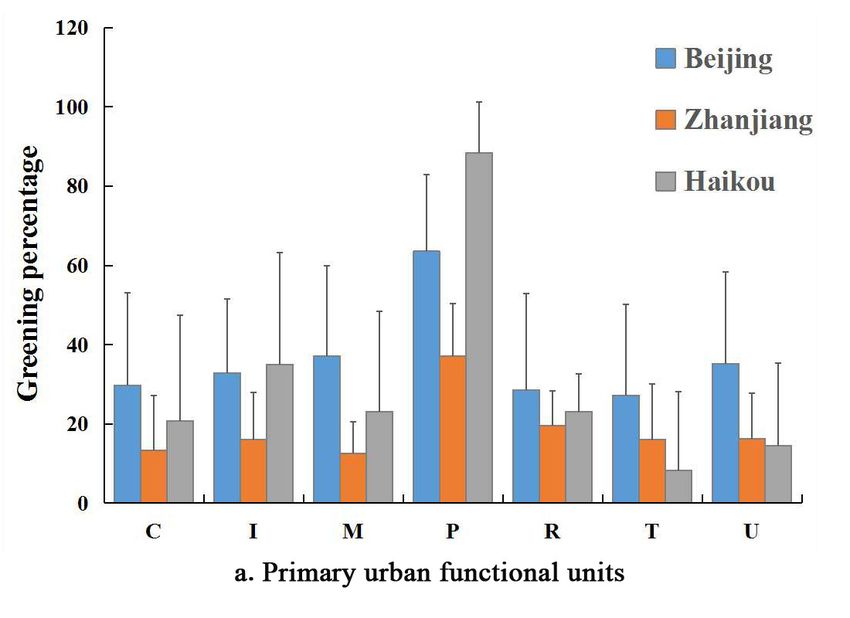
Remote Sens. 2020, 12, x FOR PEER REVIEW                                                                  9 of 21

Remote Sens. 2020, 12, 2201                                                                                     8 of 19

     We identified nine primary UFU types in Zhanjiang, the most and least numerous of which were
Agriculture (n = 57, 21.92%) and Park (n = 14, 5.38%), respectively. We identified 19 secondary UFU
types in Zhanjiang, the most and least numerous of which were Road or Express (n = 42, 16.15%) and
Research Institution/Airport/Bus Station/Train Station (n = 1, 0.38%), respectively (Table 2).
     We identified eight primary UFUs in Haikou, the most and least numerous of which were
Multi-Residential (n = 40, 23.67%) and Vacant (n = 3, 1.78%), respectively. We identified 16 secondary
UFUs in Haikou, the most and least numerous of which were High-Density Residential Areas (n = 40,
23.67%) and Government Office (n = 1, 0.59%), respectively (Table 2).

3.2. The Greening Percentages of Different UFUs
     Our results indicated that within the primary UFUs of Beijing, Zhanjiang, and Haikou, Residential
areas have the most impervious surface areas while Parks have the most forest, grass, and watery land
areas (Figure 2). Within the secondary UFUs of Beijing, Zhanjiang, and Haikou, Colleges/Universities
have the most impervious surface area while Parks have the most forest, grass, and watery land
areas (Figure 3). Mean greening percentage was greatest in Parks for all three cities, with Haikou
having the highest greening percentage overall (90.31 ± 5.1). The greening percentage of Parks was
significantly higher than the other primary UFU types within Beijing and Haikou (t-test, p < 0.01).
Transportation area has the lowest greening percentage in both Beijing and Haikou, while Commercial
        Figure 2. Areas of primary urban functional units in Beijing, Zhanjiang, and Haikou for impervious
area had the lowest     greening percentage in Zhanjiang. The lowest greening percentage overall was in
        area (km2) (a), forest land area (km2) (b), grassland area (km2) (c), and water area (km2) (d).
the Transportation area (10.33 ± 4.3) in Haikou (see boxplot Figures 4 and 5).

      Figure 3. Areas of secondary urban functional units in Beijing, Zhanjiang, and Haikou for impervious
         Figure
      area (km23.  Areas
                ) (a),    of secondary
                       forest land areaurban
                                         (km2 )functional units area
                                                (b), grassland  in Beijing,
                                                                     (km2 )Zhanjiang, and Haikou
                                                                            (c), and water        for
                                                                                           area (km 2 )impervious
                                                                                                        (d).
         area (km2) (a), forest land area (km2) (b), grassland area (km2) (c), and water area (km2) (d).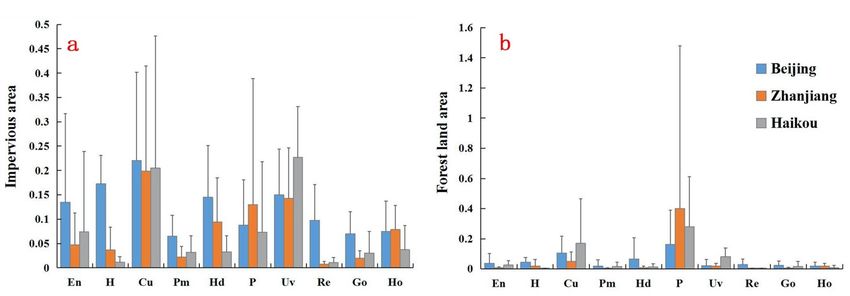
RemoteSens.
Remote  Sens.2020,
              2020,12,
                    12,2201
                        x FOR PEER REVIEW                                                                         910ofof1921

     Figure 4. Greening percentages of different secondary urban functional units within Beijing (a), Zhanjiang (b),
     and Haikou
      Figure     (c).
              4. Greening  percentages of different secondary urban functional units within Beijing (a),
      Zhanjiang (b), and Haikou (c).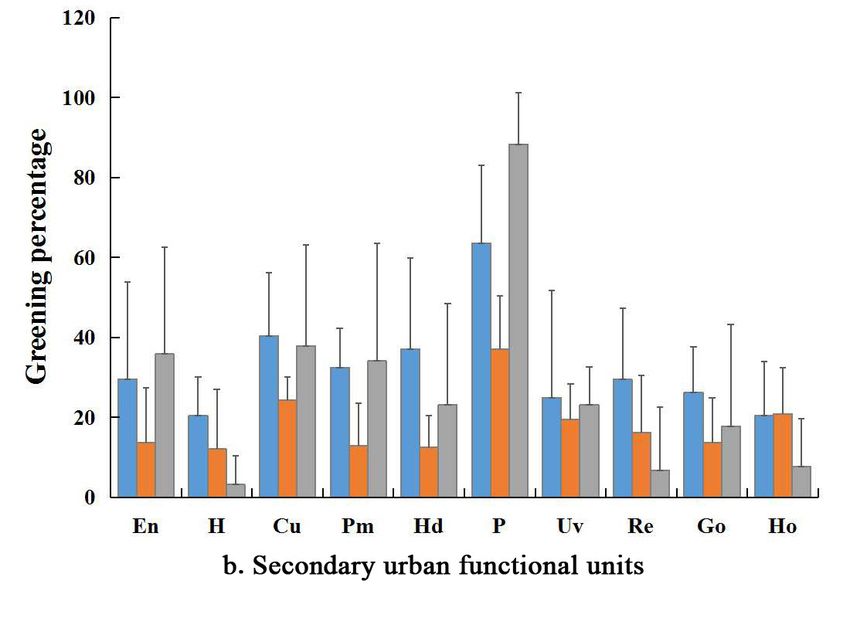
Remote Sens. 2020, 12, 2201                                                                                   10 of 19
        Remote Sens. 2020, 12, x FOR PEER REVIEW                                                          11 of 21

      Figure 5. Greening percentages of both primary (a) and secondary (b) urban functional units found
      within Figure
             Beijing,5. Zhanjiang, and Haikou.
                        Greening percentages of both primary (a) and secondary (b) urban functional units found
            within Beijing, Zhanjiang, and Haikou.
3.3. Greening Percentages of Different UFUs Across Three Cities Correlated with Socioeconomic Variables and
Species Richness
     The greening percentages of Parks in Beijing, Zhanjiang, and Haikou were positively correlated
with socioeconomic variables and species richness (R2 = 0.893–0.188, p < 0.05) (Figure 6). The greening
percentages of School areas in Beijing, Zhanjiang, and Haikou were positively correlated with socioeconomic
Remote Sens. 2020, 12, x FOR PEER REVIEW 12 of 21
3.3. Greening Percentages of Different UFUs Across Three Cities Correlated with Socioeconomic Variables
and Species Richness
Remote Sens.The 12, 2201 percentages of Parks in Beijing, Zhanjiang, and Haikou were positively correlated
2020,greening 11 of 19
with socioeconomic variables and species richness (R2 = 0.893–0.188, p < 0.05) (Figure 6). The greening
percentages of School areas in Beijing, Zhanjiang, and Haikou were positively correlated with
and=species
variables and speciesvariables
richness (R 2 0.573–0.23, p < 0.05) (Figure 7). The greening percentages of Residential
socioeconomic richness (R2 = 0.573–0.23, p < 0.05) (Figure 7). The greening
areas percentages
in Beijing, Zhanjiang, and Haikou were Zhanjiang,
of Residential areas in Beijing, positivelyandcorrelated
Haikou with
were socioeconomic variables
positively correlated with and
species
socioeconomic2 = 0.624–0.23,
richness (R variables p < 0.05)
and species (Figure
richness (R8).= 0.624–0.23, p < 0.05) (Figure 8).
2
Figure 6. Scatterplots depicting the relationships between the greening percentages of Parks and both
Figure
Remote 6. Scatterplots
Sens. 2020, depicting
12, x FOR PEER the relationships between the greening percentages of Parks and both13 of 21
REVIEW
socioeconomic variables (construction age, housing price, and population density) and species richness
socioeconomic variables (construction age, housing price, and population density) and species
(woody and herbaceous) within Beijing, Zhanjiang, and Haikou.
richness (woody and herbaceous) within Beijing, Zhanjiang, and Haikou.
Figure 7. Scatterplots depicting the relationships between the greening percentages of Schools and
Figure 7. Scatterplots
both socioeconomic depicting
variables the relationships
(construction between
age, housing the greening
price, percentages
and population of Schools
density) and
and species
both socioeconomic variables (construction age, housing price, and population density) and species
richness (woody and herbaceous) within Beijing, Zhanjiang, and Haikou.
richness (woody and herbaceous) within Beijing, Zhanjiang, and Haikou.Figure 7. Scatterplots depicting the relationships between the greening percentages of Schools and
both socioeconomic variables (construction age, housing price, and population density) and species
richness (woody and herbaceous) within Beijing, Zhanjiang, and Haikou.
Remote Sens. 2020, 12, 2201 12 of 19
8. Scatterplots
FigureFigure depicting the relationships between the greening percentages of Residential
8. Scatterplots depicting the relationships between the greening percentages of Residential
areas and both socioeconomic
areas and both socioeconomicvariables (construction
variables (constructionage,
age, housing price,and
housing price, and population
population density)
density) and and
speciesspecies
richness (woody and herbaceous) within Beijing, Zhanjiang, and Haikou.
richness (woody and herbaceous) within Beijing, Zhanjiang, and Haikou.
3.4. Response of Greening Percentage to UFU Characteristics and Maintenance Intensity
No spatial autocorrelation was found in the three cities. Our models predicted that the greening
percentages of the three cities were not correlated with natural predictors such as temperature and
precipitation, but that they were significantly correlated with land use cover (Table 3). The greening
percentages of all three cities were negatively correlated with impervious area, and positively correlated
with forest area in Beijing (R2 = 0.16, p < 0.01), water area in Haikou (R2 = 0.01, p = 0.13), and wasteland
area in Zhanjiang (R2 = 0.13, p < 0.01). In addition, maintenance predictors, such as trimming frequency,
were significantly negatively correlated with greening percentage (R2 = 0.23, p < 0.01). The perimeter
of the UFUs was positively correlated with greening percentage in both Beijing (R2 = 0.02, p < 0.01)
and Zhanjiang (R2 = 0.12, p < 0.01) (Figure 9).
Table 3. The top models for predicting greening percentage in Beijing, Haikou, and Zhanjiang, China.
The R-squared value (R2 ) for each model and the estimated coefficient for each predictor are provided.
*** p < 0.001, ** p < 0.01, * p < 0.05, · p < 0.1.
Beijing Haikou Zhanjiang
R2 0.49 0.61 0.68
Intercept 3.08 *** 2.15 *** 2.76 ***
Construction period 0.12 *
Population density −0.15
Perimeter 0.02 ** 0.12 **
The distance from urban center 0.11 *
Impervious area −0.06 ** −0.02 −0.08
Wasteland area −0.07 0.13 **
Water area 0.17 *** 0.13 *** 0.13
Forest area 0.16 ***
Shrub species −0.26
Herb species 0.22 −0.19 *
Trimming frequency/year −0.23 **
Fertilizing frequency/year 0.24
Watering frequency/year 0.24 **
Water content of soil 0.14 *Remote Sens. 2020, 12, 2201 13 of 19
Remote Sens. 2020, 12, x FOR PEER REVIEW 15 of 21
Figure 9. Scatterplots depicting the correlations between greening percentages and impervious area,
wasteland area, trimming frequency, and perimeter within Haikou, Beijing, and Zhanjiang.Remote Sens. 2020, 12, 2201 14 of 19
4. Discussion
4.1. Variations in the Areas of Primary and Secondary UFUs
Our results indicated that within the primary UFUs of Beijing, Zhanjiang, and Haikou, Residential
areas have the most impervious surface areas while Parks have the most forest, grass, and watery land
areas (Figure 2). Within the secondary UFUs of Beijing, Zhanjiang, and Haikou, Colleges/Universities
have the most impervious surface area while Parks have the most forest, grass, and watery land areas
(Figure 3). These results are similar to those of previous work, which determined the size of primary
and secondary UFUs in Beijing [10,13] and Haikou [11].
Two explanations may account for the observed variation between the areas of different primary
and secondary UFUs. Firstly, Fang and Zhao [38] stated that this variation may be attributed to
discrepancies in methodologies and data sources as well as the particular urban areas included in
sampling. To avoid confusion, Wu [39] proposed a hierarchical system to define urban land with
respect to three different levels: impervious area, built-up area, and urban region. We adopted this
three-level urban region in this study as we included impervious areas, vegetated areas, barren land,
and watery land in our classifications of urban land [40,41]. Although we used these same categories to
define urbanized areas in Beijing, Zhanjiang, and Haikou, these classifications may have changed over
time and with the occurrence of rapid urbanization; for example, the greening percentage of Beijing,
the capital city of China, was 44.99% in 2005 and is expected to reach 55% in 2022 [42]. In comparison,
the urban greening percentage of Haikou was only 40.6% in 2017, even though this city harbors more
native species than temperate cities.
Secondly, urban planning and policy stimulate urban expansion, thereby increasing capital
and population growth and ultimately promoting urban greening [9,38,43]. During the 2008 “green
Olympic Games” in Beijing, for example, UFUs invested a lot of money into greening measures, such as
planting trees and seeding yards. At the end of 1990, there were only three parks in Haikou with a
public green area of about 34 hm2 , an urban greening percentage of 23.7%, and a per capita green
area of only 4.35 m2 [44]. In 1995, the Haikou Green Space System was implemented, and in 1997 it
began to develop the city’s reputation as a National Garden City. These policies effectively controlled
green space encroachment, with the total green space area experiencing a reduction of only 333 hm2
from 2000 to 2006. Between 1999 and 2006, the number of parks in Haikou increased to 18, built-up
area greening percentage increased to 33%, and the number of green patches within built-up areas
increased as well [44]. In addition, human disturbance from urban development has led to an increase
in the overall number of green patches—specifically green patches with smaller areas. Therefore,
the development of national and local government policies is one of the most important driving forces
for the changing landscape pattern of Haikou urban green space and may similarly affect the landscape
patterns of other cities.
4.2. Variation in Greening Percentages of Different UFUs
Like plant diversity in urban areas [23], greening percentages were not greatly affected by
environmental factors. In this study, the highest greening percentages were measured within Parks.
As one of the most important forms of urban green space, Parks are typically associated with high green
cover and greening percentages [45]. The greening percentages of UFUs differed greatly among the
three cities; the planning of green infrastructure varies drastically between nations [46], so this observed
variation within cities may be attributed to different greening policies. The greening percentage of
urban areas was more dependent on impervious area. It has been suggested by many studies that the
impervious surface areas within cities seem to decrease overall green area [16,23].
As a temperate inner-land city with a GDP exceeding three trillion yuan in 2018 [33], Beijing
has the highest greening percentage in its public squares. This finding indicates that the local
government invests more money in public affairs which increase the well-being of citizens and the
overall beautification of the city. Tropical coastal cities with more suitable habitat for vegetationRemote Sens. 2020, 12, 2201 15 of 19
(e.g., moderate to high temperature and rainfall) can harbor more plant species. Zhanjiang and Haikou
have the highest greening percentages within Parks and woodlands despite having lower GDPs
(300 and 151 billion Yuan in Zhanjiang and Haikou, respectively) than Beijing. Even though the local
governments of Zhanjiang and Haikou have lower budgets for public square greening than Beijing,
the climate of both cities enables more native plant species to grow in these regions, thereby increasing
the greening percentages of woodlands and Parks. We also noticed that the lowest greening percentage
of all UFU types was within Hotels; it is possible that increasing impervious surface area allows for the
building of more rooms and parking lots, thereby increasing profits, as suggested by Wang et al. [13].
At the early stage of Haikou urban development in the 1990s, its urban buildings, roads and other
infrastructure cut natural vegetation into patches, resulting in the irregular edge shapes of many urban
green patches. After the combination of Haikou with Qiongshan city in 2002, the urban areas of Haikou
entered a stage of rapid development. Urban green space planning was vigorous, and the reduction
of green space was effectively controlled; however, due to the expansion of commercial buildings,
residential areas, factories, and other buildings, the shapes of these green spaces became more and more
complex [47]. Urban construction was concentrated in the current Haikou Old Town area in the 1990s,
and its residential areas became smaller and more dispersed. Around 1992, the Haikou real estate
market started expanding, with buildings replacing green space and dominating the urban landscape.
By 2006, a large proportion of urban residential areas had been concentrated in coastal regions and the
international trade district, and the new residential quarters in the old city had gradually joined to
form a larger, continuous residential area. New residential areas tend to pay more attention to the
construction of green space, greatly increasing the total green landscape area. With the increasing
number of buildings and rising population density the influence of human disturbance on green space
is becoming stronger, leading to an increase in the number of small green patches and the overall
fragmentation of the green landscape [47].
We found that the greening percentages of all UFUs across all three cities were positively correlated
with socioeconomic variables and species richness, which are subsequently suggested as the dominant
driving forces of urban green space changes [13,23,48–54]. Wang et al. [55] explained that citizens of
residential areas are not directly responsible for local greening practices and plant species richness,
instead they hire property management companies to maintain greening and trimming. Wang et al. [55]
suspected that companies managing private yards are doing so by the docks as well. This differs from the
United States, where 60–70% of urban land is privately owned, and landscaping, household education,
and income levels directly affect plant species richness [50,52,53].
4.3. The Relationship Between Greening Percentages and Plant Species Richness in Different UFUs
Across China
Greening percentage was significantly positively correlated with both woody and herbaceous species
richness across all UFU types and within each of the three cities (Figures 6–8). This result indicates that
increased greening percentages in Beijing, Zhanjiang, and Haikou are associated with increased herb and
woody species diversity. Wang et al. [13] stated that the green spaces of urban areas are supported by the
ground water, and as such they mainly support increased greening by herbs with tap roots rather than
fibrous root systems as they have greater success in accessing ground water. Yan et al. [16] suggested
that impervious surface area is a key predictor of urban plant diversity during rapid urbanization.
In our study, we found evidence of a significant relationship between the greening percentages of UFUs
and plant diversity, which may indicate that the areas which we studied are built-up. Future studies
on the percentages of impervious surface area within UFUs might reveal a better predictor for urban
plant diversity.
We explored the relationships between land cover changes and socioeconomic variables at the UFU
level within different cities. Cities are comprised of many different UFUs (e.g., parks, schools, roads,
etc.), and these data will be useful for the planning and design of UFUs within a rapidly urbanizing
society. When developing UFUs, it is important to consider that the land cover (e.g., the specific plantRemote Sens. 2020, 12, 2201 16 of 19
species present) should complement the intended land use; for example, we find there are more edible
plant species within lower income residential areas, whereas there are more ornamental plant species in
higher income residential areas [10]. Socioeconomic factors provide critical information for urban and
landscape planning.
One of the biggest differences between the vegetation in tropical coastal cities and temperate
cities is climate. Haikou and Zhanjiang are rapidly developing tropical coastal cities, while Beijing
is a rapidly developing temperate inner city. Haikou uses real estate to promote urban expansion
along the coast, whereas Beijing displays a circular development which extends to all sides of the city.
A previous study reported that the percentage of high-density urban areas in Beijing was significantly
correlated with both distance from city center and population density, and that the percentage of urban
green spaces decreased exponentially from urban centers to suburbs [10]. The urban development
models of Haikou and Beijing are very different (Figures 2 and 5). Investigating these urban greening
patterns and plant species composition within cities with different patterns of urban development may
provide scientific advice concerning the sustainable development of tropical coastal cities in China.
In this study, we investigated the forces driving urban green space and plant diversity variation
across different UFUs. We considered the relationships between land use types (e.g., recreation,
education), socioeconomic variables (e.g., housing price, maintenance intensity), and climatic factors
(e.g., temperature, humidity). Presently, tropical coastal cities still have considerable area available
for urban expansion. Rapid growth within these coastal regions has led to the serious damage of
natural vegetation and landscapes on account of the disordered development of real estate. Haikou
is in the rapid development period of an international free trade port and in the process of rapid
urban development. The relationships identified through this study provide a scientific basis for
these efforts. For Haikou, and cities undergoing similar urban development, the layout of green
spaces and the selection of vegetation should differ between UFUs on account of land use type and
socioeconomic factors.
5. Conclusions
Urban functional units (UFUs) are ideal models for analyzing the components of urban ecosystems
and powerful grippers for uncovering complex and highly heterogeneous urban ecosystem structures.
Different from previous randomly sampling, we can get the land cover and socioeconomic variables at
the UFU level and explore the relationships among different components in complex urban ecosystems,
for example, Parks represented the largest areas of forest land, grassland, and water bodies in Beijing,
Zhanjiang, and Haikou. Moreover, Parks displayed the highest greening percentages of the three UFU
types in Zhanjiang and Haikou. The greening percentages of all UFUs across all three cities were
positively correlated with socioeconomic variables (e.g., urban population density), indicating that these
are dominant forces driving urban green space changes. UFU level analyses are an ideal method to explore
the relationships between environmental and socioeconomic variables in complex urban ecosystems.
UFUs are the minimum spatial units of urban ecosystems, and socioeconomic and greening management
measures are generally homogeneous within them; therefore, we can directly and precisely ascertain the
socioeconomic variables driving urban plant diversity changes, which may help to elucidate the drivers
of urban greening. Due to the existence of a variety of methods for investigating urban plant diversity,
it is hard to compare the data obtained from different studies; however, the methodology of this study
may provide an effective way to investigate urban plant diversity within UFUs in individual cities while
balancing representative sampling across different cities.
Author Contributions: Conceptualization, H.-F.W. and Z.-X.Z.; methodology, H.-F.W.; software, M.M.N. and L.D.;
validation, X.-L.C. and L.J.D.; formal analysis, M.M.N. and X.-L.C.; investigation, H.-F.W. and X.L.C.; resources, H.-F.W.;
data curation, M.M.N. and X.-L.C.; writing—original draft preparation, H.-F.W., X.-L.C., M.M.N.; writing—review
and editing, H.-F.W., K.B. and S.Q.; visualization, L.J.D.; supervision, H.-F.W.; project administration, H.-F.W.;
funding acquisition, L.J.D, H.-F.W., Z.-X.Z. and S.Q. All authors have read and agreed to the published version of
the manuscript.Remote Sens. 2020, 12, 2201 17 of 19
Funding: This study was funded by the Shanghai Key lab for urban Ecological processes and Eco-Restoration
(SHUES2020A07) and a start-up fund from Hainan University [kyqd1633 and kyqd1840 (ZR)].
Acknowledgments: We thank the anonymous reviewers for their constructive comments on this manuscript,
and Xiurong Ke for her data analyses help.
Conflicts of Interest: The authors declare no conflict of interest.
References
1. Li, F.; Wang, R.; Zhao, D. Urban Ecological Infrastructure based on ecosystem services: Status, problems and
perspectives. Acta Ecol. Sin. 2014, 34. [CrossRef]
2. Li, J.; Li, C.; Zhu, F.; Song, C.; Wu, J. Spatiotemporal pattern of urbanization in Shanghai, China between
1989 and 2005. Landsc. Ecol. 2013, 28, 1545–1565. [CrossRef]
3. Yang, J.; Yan, P.; He, R.; Song, X. Exploring land-use legacy effects on taxonomic and functional diversity of
woody plants in a rapidly urbanizing landscape. Landsc. Urban Plan. 2017, 162, 92–103. [CrossRef]
4. Zhang, D.; Wang, W.; Zheng, H.; Ren, Z.; Zhai, C.; Tang, Z.; He, X. Effects of urbanization intensity on forest
structural-taxonomic attributes, landscape patterns and their associations in Changchun, Northeast China:
Implications for urban green infrastructure planning. Ecol. Indic. 2017, 80, 286–296. [CrossRef]
5. Masoudi, M.; Tan, P.Y.; Liew, S.C. Multi-city comparison of the relationships between spatial pattern and
cooling effect of urban green spaces in four major Asian cities. Ecol. Indic. 2019, 98, 200–213. [CrossRef]
6. Huang, C.; Yang, J.; Jiang, P. Assessing Impacts of Urban Form on Landscape Structure of Urban Green Spaces
in China Using Landsat Images Based on Google Earth Engine. Remote Sens. 2018, 10, 1569. [CrossRef]
7. Pickett, S.T.; Zhou, W. Global urbanization as a shifting context for applying ecological science toward the
sustainable city. Ecosyst. Health Sustain. 2015, 1, 1–15. [CrossRef]
8. Wu, J. Urban ecology and sustainability: The state-of-the-science and future directions. Landsc. Urban Plan.
2014, 125, 209–221. [CrossRef]
9. Wu, W.J.; Zhao, S.Q.; Zhu, C.; Jiang, J.L. A comparative study of urban expansion in Beijing, Tianjin and
Shijiazhuang over the past three decades. Landsc. Urban Plan. 2015, 134, 93–106. [CrossRef]
10. Wang, H.-F.; Qureshi, S.; Qureshi, B.A.; Qiu, J.-X.; Friedman, C.R.; Breuste, J.; Wang, X.-K. A multivariate
analysis integrating ecological, socioeconomic and physical characteristics to investigate urban forest cover
and plant diversity in Beijing, China. Ecol. Indic. 2016, 60, 921–929. [CrossRef]
11. Zhu, Z.-X.; Pei, H.-Q.; Schamp, B.S.; Qiu, J.-X.; Cai, G.-Y.; Cheng, X.-L.; Wang, H.-F. Land cover and plant
diversity in tropical coastal urban Haikou, China. Urban Urban Green. 2019, 44, 126395. [CrossRef]
12. Kremer, P.; Andersson, E.; McPhearson, T.; Elmqvist, T. Advancing the frontier of urban ecosystem services
research. Ecosyst. Serv. 2015, 12, 149–151. [CrossRef]
13. Wang, H.-F.; Qiu, J.-X.; Breuste, J.; Ross Friedman, C.; Zhou, W.-Q.; Wang, X.-K. Variations of urban greenness
across urban structural units in Beijing, China. Urban Urban Green. 2013, 12, 554–561. [CrossRef]
14. Li, X.; Zhou, W.; Ouyang, Z. Forty years of urban expansion in Beijing: What is the relative importance of
physical, socioeconomic, and neighborhood factors? Appl. Geogr. 2013, 38, 1–10. [CrossRef]
15. Fei, W.; Zhao, S. Urban land expansion in China’s six megacities from 1978 to 2015. Sci. Total Environ. 2019,
664, 60–67. [CrossRef] [PubMed]
16. Yan, Z.; Teng, M.; He, W.; Liu, A.; Li, Y.; Wang, P. Impervious surface area is a key predictor for urban plant
diversity in a city undergone rapid urbanization. Sci. Total Environ. 2019, 650, 335–342. [CrossRef] [PubMed]
17. Groffman, P.M.; Cavender-Bares, J.; Bettez, N.D.; Grove, J.M.; Hall, S.J.; Heffernan, J.B.; Hobbie, S.E.;
Larson, K.L.; Morse, J.; Neill, C.; et al. Ecological homogenization of urban USA. Front. Ecol Environ. 2014,
12, 74–81. [CrossRef]
18. Liu, H.; Fang, C.; Zhang, X.; Wang, Z.; Bao, C.; Li, F. The effect of natural and anthropogenic factors on haze
pollution in Chinese cities: A spatial econometrics approach. J. Clean. Prod. 2017, 165, 323–333. [CrossRef]
19. Da, L.J.; Hang, Y.; Xiaoli, H. The diversity, spatial pattern and dynamic response of Shanghai vegetation in
the process of urbanization (VII): Dynamic change and mode optimization of Shanghai Pudong near natural
forest in 10 years. J. East China Norm. Univ. Natur. Sci. Ed. 2011, 4, 15–23.
20. SPOT-5 Satellite Sensor. Available online: https://www.satimagingcorp.com/satellite-sensors/other-satellite-
sensors/spot-5/ (accessed on 12 December 2015).Remote Sens. 2020, 12, 2201 18 of 19
21. Wang, H.-F.; Qureshi, S.; Knapp, S.; Friedman, C.R.; Hubacek, K. A basic assessment of residential plant
diversity and its ecosystem services and disservices in Beijing, China. Appl. Geogr. 2015, 64, 121–131.
[CrossRef]
22. Zhu, Z.-X.; Roeder, M.; Xie, J.; Nizamani, M.M.; Friedman, C.R.; Wang, H.-F. Plant taxonomic richness and
phylogenetic diversity across different cities in China. Urban Urban Green. 2019, 39, 55–66. [CrossRef]
23. Hope, D.; Gries, C.; Zhu, W.; Fagan, W.F.; Redman, C.L.; Grimm, N.B.; Nelson, A.L.; Martin, C.; Kinzig, A.
Socioeconomics drive urban plant diversity. Proc. Natl. Acad. Sci. USA 2003, 100, 8788–8792. [CrossRef]
24. UFORE (Urban Forest Effects Model). Field Data Collection Manual. 2011. Available online: http://www.ufore.
org/using/03-00.html (accessed on 26 April 2020).
25. MacGregor-Fors, I. Misconceptions or misunderstandings? On the standardization of basic terms and definitions
in urban ecology. Landsc. Urban Plan. 2011, 100, 347–349. [CrossRef]
26. Cadenasso, M.L.; Pickett, S.T.; Schwarz, K. Spatial heterogeneity in urban ecosystems: Reconceptualizing
land cover and a framework for classification. Front. Ecol. Environ. 2007, 5, 80–88. [CrossRef]
27. Walker, J.S.; Blaschke, T. Object-based land-cover classification for the Phoenix metropolitan area: Optimization
vs. transportability. Int. J. Remote Sens. 2008, 29, 2021–2040. [CrossRef]
28. Congalton, R.G. A review of assessing the accuracy of classifications of remotely sensed data. Remote Sens. Environ.
1991, 37, 35–46. [CrossRef]
29. Luck, G.W.; Smallbone, L.T.; O’Brien, R. Socio-Economics and Vegetation Change in Urban Ecosystems:
Patterns in Space and Time. Ecosystems 2009, 12, 604–620. [CrossRef]
30. Soltanifard, H.; Roshandel, T.; Ghodrati, S. Assessment and ranking of influencing factors in the relationship
between spatial patterns of urban green spaces and socioeconomic indices in Mashhad urban districts, Iran.
J. Adv. Model. Earth Syst. Environ. 2020, 6, 1589–1605. [CrossRef]
31. Anonymous. Anjuke Housing Price. Available online: http://anjuke.com (accessed on 1 May 2017).
32. Beijing Municipal Bureau of Statistics. Beijing Statistical Yearbook; China Statistics Press: Beijing, China, 2018.
33. Guangdong Bureau of Statistics (GBS). Statistical Yearbook of Guangdong; Guangdong Bureau of Statistics:
Guangdong, China, 2014.
34. Hainan Bureau of Statistics (HBS). Statistical Yearbook of Hainan; Hainan Bureau of Statistics: Haikou, China, 2014.
35. Anonymous. Google Earth. Available online: https://www.google.com/earth/ (accessed on 1 May 2017).
36. Venables, W.N.; Ripley, B.D. Modern Applied Statistics with S; Springer: New York, NY, USA, 2002.
37. Paradis, E.; Claude, J.; Strimmer, K. APE: Analyses of phylogenetics and evolution in R language. J. Bioinform.
2004, 20, 289–290. [CrossRef]
38. Fang, C.; Zhao, S. A comparative study of spatiotemporal patterns of urban expansion in six major cities of
the Yangtze River Delta from 1980 to 2015. Ecosyst. Health Sustain. 2018, 4, 95–114. [CrossRef]
39. Wu, J. Hierarchy Theory: An Overview. Linking Ecology and Ethics for a Changing World; Springer: New York,
NY, USA, 2013; pp. 281–301. [CrossRef]
40. Douglas, I.; Goode, D. Urban natural histories to urban ecologies. The Routledge Handbook of Urban Ecology;
Routledge: London, UK, 1994. [CrossRef]
41. McIntyre, N.E.; Knowles-Yánez, K.; Hope, D. Urban Ecology as an Interdisciplinary Field: Differences in the
use of “Urban” Between the Social and Natural Sciences. Urban Ecol. 2000, 49–65. [CrossRef]
42. Anonymous. Beijing Greening Percentage. 2005. Available online: http://news.sina.com.cn/c/2005-03-30/
02205499366s.shtml (accessed on 12 October 2019).
43. Dahal, K.R.; Benner, S.; Lindquist, E. Urban hypotheses and spatiotemporal characterization of urban growth
in the Treasure Valley of Idaho, USA. Appl. Geogr. 2017, 79, 11–25. [CrossRef]
44. Wang, F. Launch of green projects to improve the ecological environment-Haikou the creation of a national
Garden City has achieved remarkable results. Today Hainan. 1999, 8, 15–16.
45. Wolch, J.R.; Byrne, J.; Newell, J.P. Urban green space, public health, and environmental justice: The challenge
of making cities ‘just green enough’. Landsc. Urban Plan. 2014, 234–244. [CrossRef]
46. Nock, C.A.; Paquette, A.; Follett, M.; Nowak, D.J.; Messier, C. Effects of urbanization on tree species functional
diversity in eastern north America. Ecosystems 2013, 16, 1487–1497. [CrossRef]
47. Fu, H.; Xu, X.S.; Fu, G. Study on Dynamic Changes of Green Space Landscape Pattern in Haikou. J. Fujian
For. Sci. Tech. 2015, 42, 142–146.
48. Iverson, L.R.; Cook, E.A. Urban forest cover of the Chicago region and its relation to household density and
income. Urban Ecosyst. 2000, 4, 105–124. [CrossRef]You can also read