Myanmar Opium Survey 2018 - Cultivation, Production and Implications - United Nations Office on Drugs and ...
←
→
Page content transcription
If your browser does not render page correctly, please read the page content below
Central Committee for
                                            Drug Abuse Control

  Myanmar Opium Survey 2018
Cultivation, Production and Implications

                              Research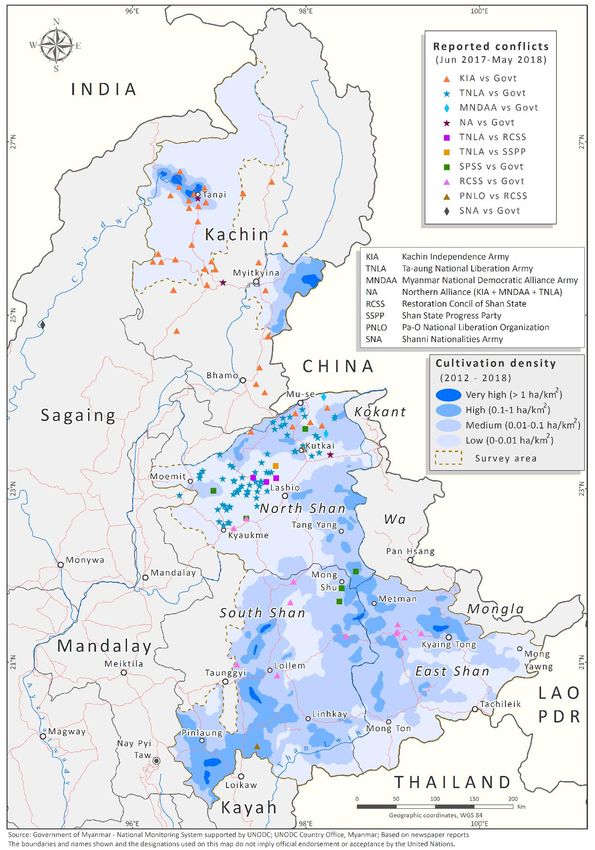
In Southeast Asia, UNODC supports Member States to develop and implement evidence‐
based rule of law, drug control and related criminal justice responses through the Regional
Programme 2014‐2018 and aligned country programmes including the Myanmar Country
Programme 2014‐2018. This study is connected to the Mekong MOU on Drug Control which
UNODC actively supports through the Regional Programme, including the commitment to
develop data and evidence as the basis for countries of the Mekong region to respond to
challenges of drug production, trafficking and use. UNODC’s Research and Trend Analysis
Branch promotes and supports the development and implementation of surveys globally,
including through its Illicit Crop Monitoring Programme (ICMP).
The implementation of Myanmar opium survey was made possible thanks to the financial
support of the Governments of Japan, the United States of America and China.

UNODC Regional Office for Southeast Asia and the Pacific
Telephone: +6622882100
Fax: +6622812129
Email: unodc‐thailandfieldoffice@un.org
Website: www.unodc.org/southeastasiaandpacific
     Twitter: @UNODC_SEAP

The designations employed and the presentation of material in this publication do not imply
the expression of any opinion whatsoever on the part of UNODC concerning the legal status
of any country, territory or city, or its authorities, or concerning the delimitation of its frontiers
or boundaries.
Front cover photos: Jeremy Douglas and Akara Umapornsakula, United Nations Office on
Drugs and Crime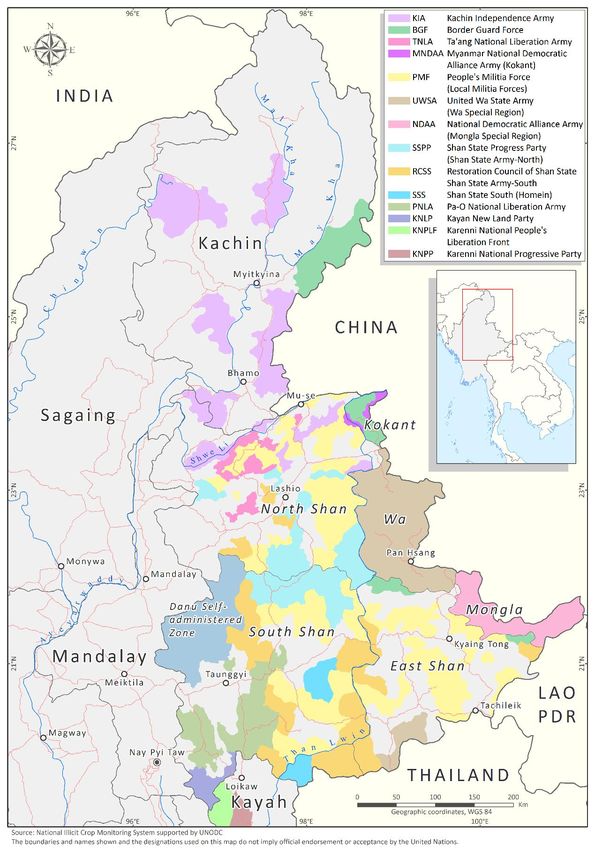
Contents
Acknowledgments .............................................................................................................. i
Abbreviations ..................................................................................................................... i
Key findings .......................................................................................................................iii
Fact Sheet ...........................................................................................................................v
1.     Introduction ............................................................................................................... 3
2.     Findings .................................................................................................................... 11
     2.1      Estimated area under opium poppy cultivation ...................................................... 11
     2.2      Opium yield and production estimates ................................................................... 15
     2.3      Opium farm‐gate price ............................................................................................ 18
     2.4      Opium economy in Myanmar .................................................................................. 19
3.     Eradication and Seizures........................................................................................... 25
     3.1      Eradication ............................................................................................................... 25
     3.2      Seizures .................................................................................................................... 27
4.     Methodology ........................................................................................................... 31
     4.1      Area estimation ....................................................................................................... 31
     4.2      Yield and potential opium production estimation .................................................. 42
     4.3      Estimating the value of opium economy in Myanmar ............................................ 47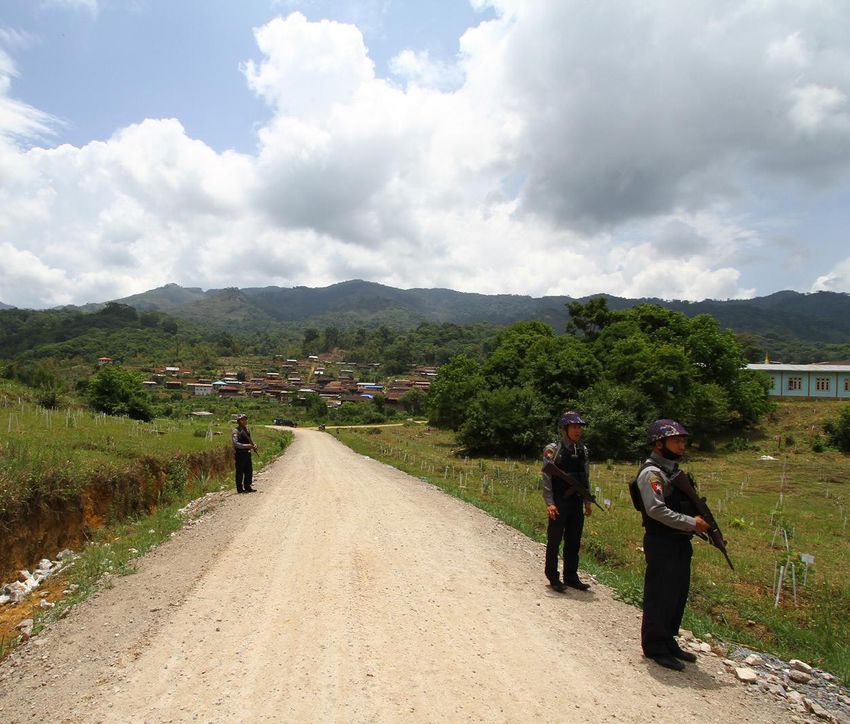
Myanmar Opium Survey 2018

Acknowledgments
Central Committee for Drug Abuse Control
Pol. Lt. Gen. Aung Win Oo    Chief of Myanmar Police Force, Secretary of CCDAC
Pol. Brig. Gen. Win Naing    Commander of Drug Enforcement Division, Joint Secretary
                             of CCDAC
Pol. Col. Oke Soe Tun        Head of Project Management Department, CCDAC
Forest Department
Dr. Nyi Nyi Kyaw             Director General, Forest Department
U Saw Daniel                 Assistant Director, Forest Department
UNODC Southeast Asia and the Pacific
Jeremy Douglas               Regional Representative, Southeast Asia and the Pacific
Akara Umapornsakula          Graphic Designer
Katherine North              UNAC International Development Programme
Troels Vester                Country Manager, Myanmar
San Lwin Htwe                GIS Specialist and Survey Coordinator
Naing Lin Aung               Data Analyst
UNODC Headquarters
Angela Me                    Chief, Research and Trend Analysis Branch (RAB)
Anja Korenblik               Chief, Programme and Development Unit (PDMU)
Coen Bussink                 Programme Officer, Team Leader, PDMU
Iban Ameztoy Aramendi        Programme Officer, Remote Sensing and GIS, PDMU
Lorenzo Vita                 Research Officer, PDMU
Irmgard Zeiler               Statistician, PDMU

Abbreviations
BGF                          Border Guard Force
CCDAC                        Central Committee for Drug Abuse Control
GOUM                         Government of the Republic of the Union on Myanmar
HR                           High Resolution
ICMP                         UNODC Illicit Crop Monitoring Programme
KIA                          Kachin Independence Army
KNLP                         Kayan New Land Party
KNPLF                        Karenni National People’s Liberation Front
KNPP                         Karenni National Progressive Party
LCLU                         Land Cover Land Use
MNDAA                        Myanmar National Democratic Alliance Army (Kokant)
NDAA                         National Democratic Alliance Army (Mongla Special Region)
PDMU                         Programme Management and Development Programme
PMF                          People’s Militia Force (Local Militia Forces)
PNLA                         Pa‐O National Liberation Army
QA/QC                        Quality Assurance/Quality Control
RAB                          Research and Trend Analysis Branch
RCSS                         Restoration Council of Shan State (Shan State Army‐South)
SR                           Special Region
SSPP                         Shan State Progress Party (Shan State Army‐North)
SSS                          Shan State South (Homein)
TNLA                         Ta’ang National Liberation Army
UNODC                        United Nations Office on Drugs and Crime
UWSA                         United Wa State Army (Wa Special Region)
VHR                          Very High Resolution

                                                                                          i
Myanmar Opium Survey 2018

ii
Myanmar Opium Survey 2018
Key findings
In 2018, the area under opium poppy cultivation in Myanmar was estimated at 37,300
hectares. In comparison to 2017, the area under opium cultivation decreased,
continuing the downward trend that started in 2014.
180,000
160,000
140,000
120,000
Hectares
100,000
80,000
60,000
40,000
20,000
0
1996
1997
1998
1999
2000
2001
2002
2003
2004
2005
2006
2007
2008
2009
2010
2011
2012
2013
2014
2015
2016
2017
2018
Best estimate Upper and lower limits
In the two main producer states, Shan and Kachin, the area under opium poppy
cultivation decreased by 12 per cent or 4,900 hectares from 41,000 hectares in 2017
to 36,100 hectares in 2018.1
In addition, in Chin and Kayah States together, an estimated 1,200 hectares of opium
poppy were cultivated.
Reductions have taken place in practically all regions, including North, East and South
Shan with decreases of 7%, 8% and 17% respectively, and Kachin State with 15%. Chin
and Kayah States were not surveyed in 2017. Compared to the latest year available,
2015, total opium poppy cultivation in these two states increased by 26% or by 250
hectares in 2018.
The average opium yield remained rather stable at 13.9 kilograms per hectare, with a
4% increase compared to 2017.
Potential opium production was estimated at 520 metric tons in 2018. Shan State,
which supplied nearly 90% of the total, remained the main producing region with 461
mt which is a decrease of 8% compared to last year.
Eradication ‐as reported by the Government‐ showed a similar trend to opium poppy
cultivation over the last nine years, with increases from 2010 to 2012‐2014 and a
decrease since 2015. The eradication numbers for the 2018 growing season (from
September 2017 to March 2018) were 26% lower than for the same period in 2017.
Opiate seizures have increased since 2015. For the period January to June 2018,
almost 3,000 kilograms of seized opiates were reported, already surpassing the total
reported seizures for 2017.
With an estimated gross value ranging from 1.1 to 2.3 billion USD, the illegal opiate
market in Myanmar represented a notable share of the country’s economy in 2018
(1.5 – 3.3 % of 2017 GDP).
Of this total, about 5%, corresponding to an estimated amount of 62 to 103 million
USD, or 0.4 % of the agricultural sector’s value, was earned by farmers cultivating
opium.
1
The exact percentage change from 2017 to 2018 cannot be estimated at the national level, because Chin and Kayah states were
not assessed in 2017.
iii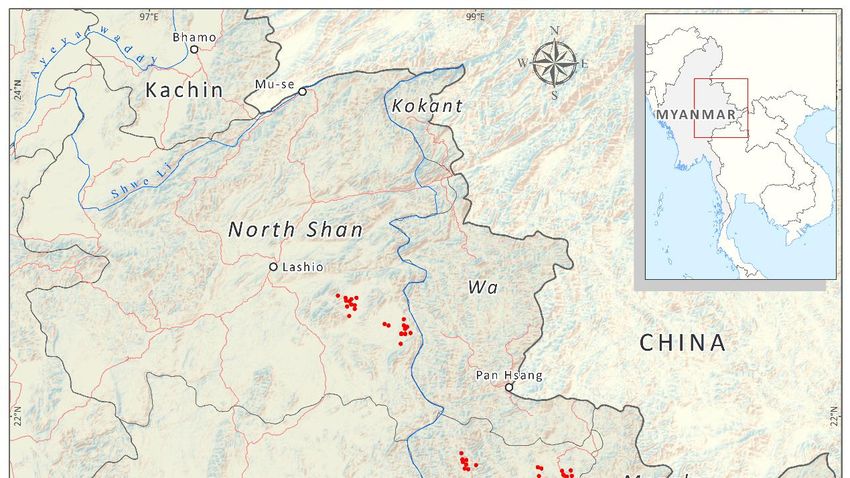
Myanmar Opium Survey 2018
The largest share of the 2018 opiate market value was income generated by heroin
manufacturing and trafficking. Domestic heroin consumption of 7.6 tons was valued
at 238 ‐ 401 million USD, whereas the export of heroin (20 ‐ 45 tons) was worth
between 782 and 1,798 million USD
Between 2015 and 2018, farm‐gate prices2 of fresh and dry opium decreased by 34
and 45 %, respectively. Decreasing prices together with a reduced supply of opium
can be an indication of a decreased demand for opiates from Myanmar in the country
and the region.
2
Average farm‐gate prices. Average is weighted based on production. Prices are inflation adjusted for the analysis of trends.
iv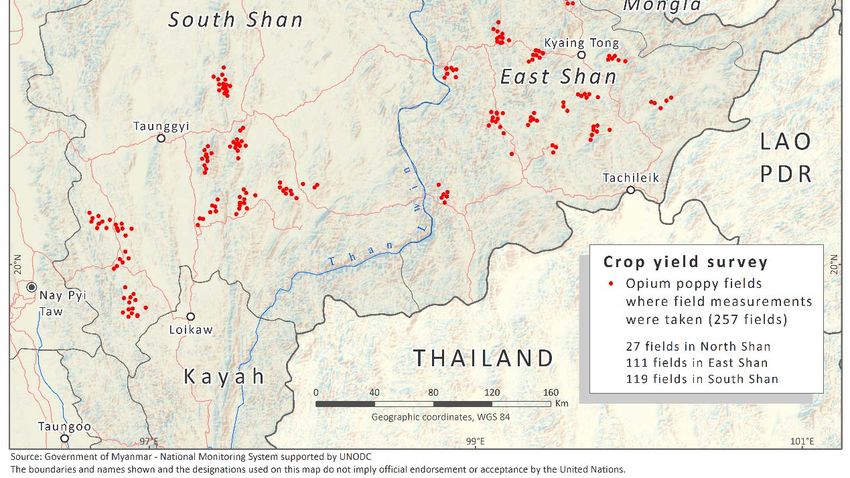
Myanmar Opium Survey 2018

Fact Sheet

                                                                                                                         Change
                                                                    Year 2017                   Year 2018
                                                                                                                        2017‐2018

     Total opium poppy cultivation (ha)3, 4                          41,000                     37,300
                                                                                                                             NA5
                                                               (30,200 to 51,900)         (29,700 to 47,200)

                           Opium poppy cultivation                   37,100                     32,700
                                                                                                                            ‐12%
                           in Shan State (ha)                  (26,500 to 47,600)         (25,300 to 42,400)

                           Opium poppy cultivation                   3,900                       3,400
                                                                                                                            ‐13%
                           in Kachin State (ha)                 (1,500 to 6,400)            (1,800 to 5,800)

                           Opium poppy cultivation                                                630
                                                                        NA                                                   NA6
                           in Chin State (ha)                                                 (573 to 677)

                           Opium poppy cultivation                                                570
                                                                        NA                                                   NA7
                           in Kayah State (ha)                                                (434 to 706)
     Total potential production of dry opium
                                                                       550                        520
     (mt)8                                                                                                                   NA9
                                                                   (395 to 706)               (410 to 664)

                           Potential dry opium
                                                                       501                        461
                           production in Shan State                                                                          ‐8%
                                                                   (349 to 653)               (348 to 605)
                           (mt)
                           Potential dry opium
                                                                        49                          42
                           production in Kachin                                                                             ‐14%
                                                                    (17 to 81)                  (21 to 74)
                           State (mt)
                           Potential dry opium
                                                                                                     8
                           production in Kayah State                    NA                                                   NA
                                                                                                 (5 to 12)
                           (mt)10
                           Potential dry opium
                                                                                                     9
                           production in Chin State                     NA                                                   NA
                                                                                                 (6 to 12)
                           (mt) 10

     Average opium yield (kg/ha)11                                     13.4                       13.9
                                                                                                                             4%
                                                                   (9.3 to 17.6)              (9.5 to 19.7)

3
  The total area estimate in 2017 does not consider cultivation in Chin and Kayah States. Since the total area in 2018 takes into
account both, the estimates are not directly comparable.
4
  The estimates may include areas that were eradicated after the acquisition date of the satellite images.
5
  Considering the sum of Shan and Kachin states only, the change percentage is ‐12%.
6
  Compared to values reported in 2015 (490 ha), the cultivated area has increased in Chin State by 29%.
7
  Compared to values reported in 2015 (460 ha), the cultivated area has increased in Kayah State by 24%.
8
 Based on area and yield estimates for Shan and Kachin states. Yield data for North Shan province and Kachin correspond to
2015.
9
 The 2018 estimate includes potential production for Chin and Kayah, therefore, the values are not comparable. Considering
only Shan and Kachin the potential production decreased by ‐9%.
10
     Potential production for Chin and Kayah was calculated using the Average opium yield (13.9kg/ha)
11
     National average weighted by regional area estimates.

                                                                                                                               v
Myanmar Opium Survey 2018

                                                                                            136 US$/kg
     Farm‐gate price of fresh opium12                                 NA13                                               NA14
                                                                                         (216,166 Kyat/kg)

                                                                                            154 US$/kg
     Farm‐gate price of dry opium12                                    NA                                                NA14
                                                                                         (243,783 Kyat/kg)

     Farm‐gate value of opium in million US$                           NA                        62 ‐ 103                 NA

     Value of the opiate economy (gross) in
                                                                       NA                      1,066 ‐ 2,281              NA
     million US$

     Value of the opiates economy (net) in
                                                                       NA                      1,004 ‐ 2,178              NA
     million US$

     Total opium poppy eradication reported by
     the Government of Myanmar (ha)                                  3,533                        2,605                  ‐26%

12
     National average weighted by regional production estimates.
13
     In 2017, few villages were interviewed regarding prices. See Myanmar Opium Survey 2017.
14
  From 2015 to 2017, average farm gate prices for fresh and dry opium decreased by 34% and 45%, respectively, taking inflation
into account

vi
1. INTRODUCTION
Myanmar Opium Survey 2018

1. Introduction
This report presents the results of the sixteenth opium survey in Myanmar. It was conducted
jointly by the Central Committee for Drug Abuse Control (CCDAC) of the Ministry of Home
Affairs and UNODC, which has been collecting statistical information on illicit crop cultivation
in Myanmar within the framework of its Illicit Crop Monitoring Programme. The methodology
used in this report combines satellite imagery and a yield survey to evaluate the extent of
opium poppy cultivation and production.

The 2018 survey builds on years of data regarding illicit opium production in Myanmar,
estimating and comparing the area under cultivation, and assessing yield and production. In
1996 over 160,000 hectares (ha) were used for cultivating opium poppy, making Myanmar
temporarily the most prominent country with cultivation in the world. However, cultivation
decreased significantly over the following ten years, reaching a low of just over 20,000 ha in
2006.

The area of opium cultivation increased again between 2006 and 2014 to just under 60,000
ha, but it has subsequently been in sharp decline. In 2017, the total area of opium poppy
consisted of 41,000 ha, a 25% decrease from the 55,000 ha recorded in 2015. The downward
trend has continued in 2018 with 37,300 ha of opium poppy. In the two main producing states,
Shan and Kachin, the cultivation area decreased by 12 percent from 41,000 hectares in 2017
to 36,100 hectares in 2018. As in previous years, the majority of opium poppy is again
cultivated in Shan State ‐nearly 90%‐ followed at a distance by Kachin State 9%, with negligible
cultivation in Chin and Kayah states.

The biggest drops in cultivation have been seen in areas that have had relatively good security.
However, in parts of Shan and Kachin experiencing a protracted state of conflict, high
concentrations of poppy cultivation have continued – a clear correlation between conflict and
opium production. For example: in Kachin State, the highest density of poppy cultivation took
place in areas under the control or influence of the Kachin Independence Army (KIA); in North
Shan, in areas of the Myanmar National Democratic Alliance Army (MNDAA); in South Shan,
of the Pa‐O National Liberation Army (PNLA), and the Restoration Council of Shan State (RCSS)
Shan State Army South (SSA‐S); and in East Shan, the People Militia’s Force (PMF); with each
engaged in conflicts of varying intensity and frequency.

A ceasefire agreement providing a degree of self‐administration has been concluded with
most of the armed groups in Myanmar, and the Government has limited access to, and limited
influence in, territories controlled by many militias. There are also several drivers for the illicit
cultivation of opium poppy in Myanmar. The most recent UNODC socio‐economic survey
identified insecurity, lack of employment opportunities, income inequality, and lack of
infrastructure (access to markets, availability of clinics) as conditions associated with the
cultivation of opium poppy. Illicit cultivation is also linked to limitations on access to areas of
cultivation and the absence of a process for independently monitoring compliance with
ceasefire provisions which include, among other conditions, the non‐engagement in drug
production. The presence of organized crime groups in the same areas is also associated with
the manufacturing and trafficking of heroin. According to the Government of Myanmar,
criminal activity in the country is estimated to generate US$15 billion per year – the equivalent

                                                                                                    3
Myanmar Opium Survey 2018 of approximately 24% of Gross Domestic Product (GDP)15 – with 84% or US$12.6 billion related to organized crime of which a significant portion would be transnational and drug related. However, the illicit drug economy is increasingly diverse and revenue is not only generated from opiates. There has been a sharp increase in the supply of, and demand for, synthetic drugs and particularly methamphetamine across East and Southeast Asia and neighbouring regions, and the downward trend in opium cultivation and related heroin production in Myanmar needs to be understood in this context. Of the 11 countries in the region systematically sharing drug data and information with UNODC, 9 are now reporting methamphetamine as their primary drug of concern, as opposed to 10 years ago when there were 4 countries reporting methamphetamine and 7 reporting heroin. Even countries with traditionally large heroin markets, including China and Malaysia, have reported this dramatic change. Most countries in the region do not have reliable data on drug use making it difficult to determine if the rapid expansion of methamphetamine and synthetic drugs has happened at the expense of, or in addition to, heroin, but findings of the opium survey point to the shrinking of the market for opiates originating from Myanmar: between 2015 and 2018, farm‐ gate prices of fresh and dry opium have decreased by 34 and 45 % respectively. Declining prices considered together with a reduction in the supply of opium and heroin are a possible indication of decreased demand for opiates from Myanmar, although data on other opioids which may be in the regional market are limited. The 2018 opium survey report finds that the current value of Myanmar’s opiate economy is a noticeable share of the overall national economy, ranging from 1.5%‐3.3% of GDP.16 with geographic pockets of Shan and Kachin where the opiate economy dominates. Where drug‐ related proceeds comprise a sizeable portion of the total economy of an area or community, dynamics are distorted with unfair competition, skewed income and wealth distributions, and increased corruption. Myanmar is the major supplier of opium and heroin in East and Southeast Asia, and Australia, and the value of opiates in the region is much higher than the US$1.1‐$2.3 billion estimated inside the country given the escalation of value as it approaches retail level. Manufacture and trafficking of heroin within the borders of Myanmar constitutes the largest value of the Myanmar opiate economy with a value range of US$1.0 to $2.2 billion – although this estimate does not take into account certain input costs including smuggled precursor chemicals. Traffickers and organized crime groups are the main beneficiaries of the opiate economy in Myanmar, with farming’ income, or the farm‐gate value of opium, comparatively small and estimated between US$62 and $103 million. Efforts to eradicate opium poppy decreased in 2018, with a reported total of 2,605 ha eradicated. This is 26% less than in 2017, and follows a continuous annual decline in the hectares of opium poppy eradicated since 2015. The slowdown in eradication efforts is reportedly linked to the existence of protracted conflict and limited access to areas under the 15 Executive Summary, Report on Money Laundering and Financing of Terrorism, the National Risk Assessment Committee on Money Laundering & Financing of Terrorism, the Myanmar Financial Intelligence Unit, the Republic of the Union of Myanmar, 2018. The report does not provide a breakdown of different forms of organized crime and associated revenue. 16 The estimated value includes opiates (raw opium and heroin) destined to domestic consumption and opiates for export. The range reflects uncertainties related to both production and heroin’s purity. For further details see chapter 2.4 and the methodology section. 4
Myanmar Opium Survey 2018

control of non‐state armed groups. Opium poppy is now mainly concentrated in areas where
government action against cultivation and organized crime groups is inhibited.

Opium cultivation, heroin manufacturing and the drug economy are important elements to
consider in the context of the peace process and the establishment of long‐term stability in
Myanmar. There is a direct connection between drugs and conflict in the country, with the
drug economy supporting the conflict and in‐turn the conflict facilitating the drug economy.
Providing solutions to the conflict requires breaking this cycle. The influence of the drug
economy can be mitigated through, among other things, scaling‐up alternative development
programmes that provide viable sources of legitimate income, as well as by addressing the
presence of transnational organized crime groups that continue to produce and traffic heroin
and that have significantly scaled‐up the production of methamphetamine and synthetic
drugs for the Asia Pacific market. Countering drug production and organized crime networks
active in Myanmar are also vital for providing sustainable peace and security to Shan and
Kachin states, and border areas of the surrounding Mekong region.

The annual opium survey remains an essential tool for assessing the extent of opium poppy
cultivation in Myanmar, as well as understanding changes in patterns and the links between
drugs and the economy. This information is useful for understanding farming techniques and
rural livelihoods, and for designing effective alternative development options and
programmes. It is also essential for supporting decision makers to develop effective strategies
to sustain the transition from an illicit to a licit economy, and as a basis for understanding the
connection between the drug economy and ongoing conflict.

                                                                                                  5
Myanmar Opium Survey 2018 Map 1: Cultivation density map (2013‐2018) with reported conflicts in Myanmar, June 2017‐ May 2018 6
Myanmar Opium Survey 2018

Map 2:   Armed groups in Myanmar, 2017‐2018 opium poppy growing season

                                                                                    7
Myanmar Opium Survey 2018 8
2. FINDINGS
Myanmar Opium Survey 2018

2. Findings
2.1 Estimated area under opium poppy cultivation
In 2018, the total amount of opium poppy cultivation area in Myanmar was estimated at
37,300 ha. Contrary to the survey in 2017, this year’s survey covered not only the major
producing states, Shan and Kachin, but also Chin and Kayah. Therefore, the total 2018
estimate cannot directly be compared with the 2017 estimate (41,000 ha). The comparison
can be made for Shan and Kachin states only.
Considering only Shan and Kachin, a decrease in cultivation of 12% was recorded, from 41,000
ha in 2017 to 36,000 ha in 2018.
                      Opium poppy cultivation in Myanmar, 1996‐2018 (ha)*
           180,000

           160,000

           140,000

           120,000
Hectares

           100,000

            80,000

            60,000

            40,000

            20,000

                0
                     1996
                            1997
                                   1998
                                          1999
                                                 2000
                                                        2001
                                                                2002
                                                                       2003
                                                                               2004
                                                                                      2005
                                                                                             2006
                                                                                                    2007
                                                                                                           2008
                                                                                                                  2009
                                                                                                                          2010
                                                                                                                                 2011
                                                                                                                                        2012
                                                                                                                                               2013
                                                                                                                                                      2014
                                                                                                                                                             2015
                                                                                                                                                                    2016
                                                                                                                                                                           2017
                                                                                                                                                                                  2018
                                                                          Best estimate                                  Upper and lower limits
*Sources: fr om 1996 t o 2001 USG, fr om 2002 t o 2018 GOUM‐UNODC. The s ur ve ys i n 2014, 2015 and 2018
i ncl ude d satellite image esti mate s f or Kayah and Chi n St ates.

                      Regional distribution of opium poppy cultivation areas in Myanmar, 2018*

                                                                       Chin and
                                                                        Kayah
                                                                          3%

                                                                              Kachin
                                                                               9%
                                                                                                           South
                                                                                                           Shan
                                                               North
                                                                                                            38%
                                                               Shan
                                                                23%

                                                                                             East
                                                                                             Shan
                                                                                             27%

*Chi n and Kayah St at es were s ur ve ye d i n 2018 but not i n 2017. Comparisons bet wee n the ye ars should
t he ref ore onl y consi der t he Shan re gi ons and Kachin State.

                                                                                                                                                                                         11
Myanmar Opium Survey 2018
Compared to 2017, moderate decreases were observed in practically all surveyed regions. In
Shan State alone, cultivation decreased by 4,400 hectares (‐12%). In South Shan the reduction
was of 2,800 hectares (‐17%). Decreases of 900 ha (‐8%) and 700 ha (‐7%) were also observed
in East and North Shan, respectively. In the same line, an area reduction of 600 hectares (‐
15%) was observed in Kachin State. In contrast, compared to the survey carried out in 2015,
Kayah and Chin are the only estates where cultivated area was larger, with increases of 110
ha (+24%) and 140 ha (+29%) respectively.
All in all, Shan continued to be by far the major cultivating state in Myanmar, accounting for
almost 90% of the total opium poppy area. Within Shan state, the sub‐regions of South, East
and North Shan accounted for 38%, 27% and 23% of total cultivation. Kachin State accounted
for 9% (3,300 ha) and Chin and Kayah States for 3% (1200 ha).
Table 1: Areas under opium poppy cultivation in Myanmar (ha), 2018*
2017 2018 Change 2017 ‐2018
11,000 10,100
East Shan ‐8%
(6,900 to 15,100) (6,900 to 14,000)
9,400 8,700
North Shan ‐7%*
(5,200 to 13,600) (4,400 to 14,200)
16,700 13,900
South Shan ‐17%
(7,900 to 25,400) (8,800 to 20,900)
37,100 32,700
Shan State Total ‐12%
(26,500 to 47,600) (25,300 to 42,400)
3,900 3,400
Kachin ‐13%
(1,500 to 6,400) (1,800 to 5,800)
570
Kayah NA NA**
(434 to 706)
630
Chin NA NA***
(573 to 677)
41,000 37,300
National Total (rounded) NA****
(30,200 to 51,900) (29,700 to 47,200)
* Val ues i n br acket s i ndi cate the 95% confi dence i nte rval.
** +24% compare d t o t he are a i n 2015 (460 ha)
*** +29% compare d t o t he area i n 2015 (490 ha)
**** ‐ 12% f or the compar able are as, consi deri ng t he sum of Shan and Kachin States onl y.
Opium poppy cultivation is now concentrated in areas characterized by a combination of
specific topographical conditions, socio‐economic circumstances and security. For example,
from a geographic perspective the south‐western mountains in South Shan provide a good
environment for opium poppy cultivation (Figure 3). In this region large areas with high to very
high density of opium poppy cultivation has been reported in 2018 (see map 1). The northern
area of Kyaing Tong city in East Shan and the areas near the boundaries of East and South
Shan, on both sides of the Than Lwin river, also present some extensive areas of poppy,
although the cultivation is dispersed, and the density is slightly lower than in South Shan
region.
As in the former survey, most of the reduction in cultivation between 2017 and 2018 took
place in areas well‐suited for opium cultivation but with a relatively good security situation
(South Shan, see Map 1). Although, decreases were also observed in major growing regions
12Myanmar Opium Survey 2018
with security incidents (North Shan and Kachin). The only increases in cultivation this year
were observed outside the major growing regions, in Kayah and Chin state, where no security
problems were reported.
Until 2005, Special Region 2 ‐ or Wa region ‐ showed high levels of poppy cultivation, but after
2005 there has been few poppy fields due to the ban on opium poppy cultivation. In 2018, the
eastern part of North Shan, bordering the Wa region, showed high concentrations of poppy,
similarly to the border with Kachin State. The latter is probably related to the insecurity
situation that is reflected by the number of conflicts in this area (see Map 1). The majority of
North Shan region presents areas with medium cultivation levels, but also some high
cultivation density areas are observed, especially along the border with Wa. Finally, the north‐
western zone of Tanai town, in Kachin State present some areas with very high cultivation
density.
Poppy field in South Shan, 2018
13Myanmar Opium Survey 2018 Map 3: Opium poppy cultivation trends in Myanmar, 2013‐2018 14
Myanmar Opium Survey 2018

2.2 Opium yield and production estimates
In 2018, several field studies were carried out to measure opium yields in three different
regions of Shan State. North Shan was the region with highest yield values (16.1ha/kg)
followed by East Shan (13.5ha/kg) and South Shan (13.3ha/kg). The average yield was
estimated at 14ha/kg, a 4% increase compared to 2017. However, it should be noted that the
2017 field work was not carried out in North Shan due to security constraints. For the opium
production calculation in Kachin state the 2015 yield estimate was used, which was estimated
at 12.5 kg/ha.
                          Average opium yield in Myanmar, 2002 – 2018

                  20.0

                  18.0                                     16.6
                  16.0                                                          15.1                 15.0
                                                    14.6          14.4                 14.0                                       14.0
                                                                                              13.5                         13.4
                  14.0           13.0
                                                                                                            11.7 11.7
  Yield (kg/ha)

                  12.0
                          10.0                                           10.4
                                              9.5
                  10.0
                                        8.0
                   8.0

                   6.0

                   4.0

                   2.0

                   0.0
                          2002 2003 2004 2005 2006 2007 2008 2009 2010 2011 2012 2013 2014 2015 2016 2017 2018

Nati onal aver age wei ghte d by re gi onal are a e sti mate s.

Table 2:                  Potential opium yield by region (kg/ha), 2017 and 2018
                                                                                                                         Change
                         Region                             2017                               2018
                                                                                                                        2015‐2017
                                                           12.8                               13.5
 East Shan                                                                                                                 5%
                                                       (11.4 ‐ 14.1)                      (12.3 ‐ 14.6)
                                                                                              16.1
 North Shan                                                  NA                                                            NA
                                                                                          (14.7 – 17.5)
                                                          14.2                                13.3
 South Shan                                                                                                                ‐6%
                                                      (12.7 – 15.6)                       (12.3 ‐ 14.3)
                                                           13.4                                14
 Average yield                                                                                                             4%
                                                       (9.3 – 17.6)                       (9.5 – 19.7)
Val ues i n br acket s i ndi cate t he 95% confi de nce i nter val.
For Kachin st ate yie l d s ur ve y coul d not be i m ple me nte d and for t he pr oduction cal cul ati on yiel d dat a fr om
2015 was use d (12. 5kg/ ha, 95% confi de nce inte r val: 9. 7 ‐ 15. 3kg/ ha)

The resulting estimate of potential dry opium production in 2018 was 520 metric tons. Shan
State, with 461 mt accounted for nearly 90% of the total.17 However, the estimates for this
state are not equally distributed; whilst the East and South regions showed small to moderate
decreases of 3% (‐4mt) and 21% (‐51 mt), North Shan showed an increase of 12% (+15mt),
even though a decrease in the area estimate was observed. This was caused by the yield that

17
   The 2017 production figure did not include the potential production in Chin and Kayah States, hence this figure is not directly
comparable with the values in 2018.

                                                                                                                                         15
Myanmar Opium Survey 2018
increased by almost 3kg/ha compared to the value of 2015. The production in Kachin State
decreased by 14% (‐7mt). The total opium production in Shan and Kachin States together
resulted in a decrease of 9%, from 550 mt to 503 mt. The other states (counting for 3% of the
national production) produced almost equal amounts, Chin state with 8 mt and Kayah with 9
mt. Compared to the production calculated in 2015,18 these values represented increases of 2
(+33%) and 4 mt (+80%) respectively.
Table 3: Potential opium production by region (mt), 2017 and 2018
Share of
Potential Potential Change
Region production by
production 2017 production 2018 2017‐2018
state (%)
East Shan 140 136 ‐3% 26%
North Shan 125 140 12% 27%
South Shan 236 185 ‐21% 36%
Shan state
501 461 ‐8% 89%
total
Kachin state 49 42 ‐14% 8%
Kayah state NA 8 ‐ 2%
Chin state NA 9 ‐ 1%
Total 550 520
NA* 100%
(rounded) (395 – 706) (410 – 664)
* Chi n and Kayah were i ncl ude d i n t he 2018 e sti mate , but not i n 2017 t heref or e t he t ot al s are not dir e ctly
compar abl e. Their pr oducti on e sti mate s wer e cal cul ate d with t he aver age yiel d f or 2018 (14kg/ ha)
**Consi deri ng onl y Shan and Kachin t he pote nti al production de cre ase d by 9%.
18
Kaya State: 5 mt and Chin State: 6 mt See Myanmar Opium Survey 2017 for further references.
16Myanmar Opium Survey 2018
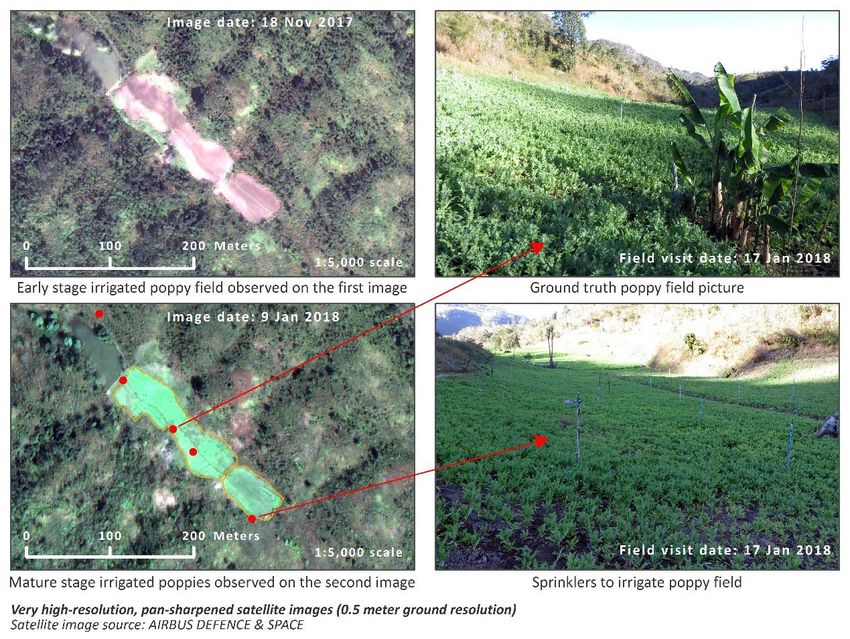
Irrigated poppy field as seen on the satellite images and in the field, at different
growing stages
Potential opium production, Myanmar 1996‐2018 (mt)
2,000
1,760
1,680
1,800
1,600
1,300
1,400
1,100
1,090
870
1,200
673
900
690
610
1,000
830
580
647
810
Metric tons
550
520
800
330
460
600
410
370
320
310
400
200
0
1996
1997
1998
1999
2000
2001
2002
2003
2004
2005
2006
2007
2008
2009
2010
2011
2012
2013
2014
2015
2016
2017
2018
Source: fr om 1996 t o 2001 USG, fr om 2002 to 2018 GOUM‐UNODC
17Myanmar Opium Survey 2018
Lancing poppy capsules in Myanmar, 2018
Harvested fresh opium gum, North Shan
2.3 Opium farm‐gate price
In 2018, a village survey was implemented, and opium price data were collected.19 The
average farm‐gate prices20 at harvest time of fresh and dry opium were assessed at 216,166
Kyat (136 US$) and 243,783 Kyat (154 US$) per kilogramme, respectively. In 2015,21 average
farm‐gate price22 of fresh opium was estimated at 290,357 Kyat per kilogramme and average
farm‐gate price23 of dry opium at 383,421 kyat/kg. Over the 3 year span, the farm‐gate prices
of fresh and dry opium dropped significantly by 26 % and 36 %, respectively. The decrease is
even larger if inflation is considered, ‐34 % for fresh opium price and ‐45 % for dry opium
19
The socio‐economic report will be published in early 2019.
20
Weighted average based on opium production, see methodology chapter.
21
Differently from 2016 and 2017, for the year 2015 both village survey price data and production data were available, and it was
possible to calculate the weighted average of farm‐gate prices based on production levels, as used in 2018 (see methodology
chapter). Therefore, for comparability reasons, the year 2015 was taken as reference for price trend analysis.
22
Not adjusted for inflation.
23
Not adjusted for inflation.
18Myanmar Opium Survey 2018
price.24 The fact that farm‐gate opium prices are falling so steeply, despite the concurrent
reduction of opium supply, suggests that the demand for opiates in Myanmar is lower than
before and endorses the hypothesis that the heroin market has declined in the region.
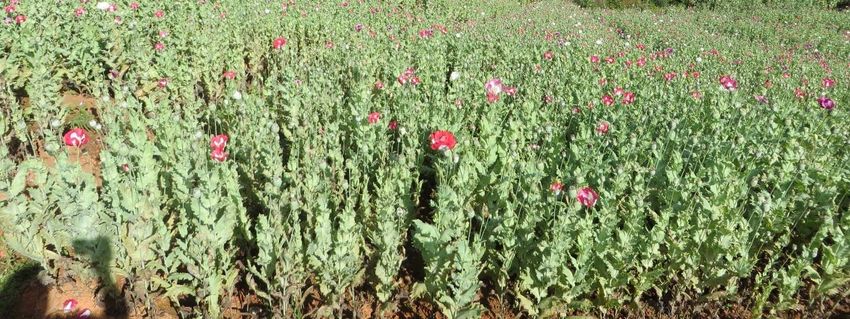
Poppy fields near a village in South Shan, 2018
2.4 Opium economy in Myanmar
Every year, hundreds of tons of opium are harvested in Myanmar and further commercialized.
Opium can be either consumed as raw opium or further processed into heroin. Both raw
opium and heroin reach the end‐consumer markets in and outside Myanmar (Table 4).
Table 4: Estimated quantities of the different opiate market´s components
Unprocessed opium
Domestic demand Domestic
Opium for consumption Heroin potentially
for unprocessed demand for
production 2018 potentially available for export
opium heroin
available for export
520tons
11 tons 7.6 tons 114 tons 20 ‐ 45 tons
(410 – 664)
Note: A r ati o of 10: 1 is use d for converti ng opi um t o her oi n of unknown purit y.
The farm‐gate value of opium is an important measure of the gross income of farmers
generated by opium poppy cultivation and it was estimated to range between 62 to 103
million USD (mid‐point 80 million USD). These values were calculated using information on
farm‐gate prices and were collected in the 2018 socio‐economic survey,25 showing the amount
of potential opium production ranging between 410 and 664 tons (mid‐point 520 tons).
24
Prices were adjusted for inflation on the base of the Consumer Price Index provided by the World Bank (base 2010=100). The
Consumer Price Index for 2018 was linearly extrapolated from the 2002‐2017 series.
25
The socio‐economic report will be published in early 2019.
19Myanmar Opium Survey 2018
Table 5: Estimated values of the opiates economy, 2018
Gross value Value in relation to
Millions of US$ (rounded) GDP* %
Value of the opiates economy (gross)** 1,082 ‐ 2,262 1.5 ‐ 3.3
Value of opiates potentially available for
829 ‐ 1,845 1.2 ‐ 2.7
export
Raw opium 47
Heroin 782 ‐ 1,798
Value of the opiates market for domestic
253 ‐ 416 0.4 ‐ 0.6
consumption
Raw opium 15
Heroin 238 ‐ 401
Farm‐gate value of opium 62 ‐ 103 0.1
Value of the opiates economy after farm‐gate to
1,020 ‐ 2,159 1.5 ‐ 3.1
the border
Note: Ranges are calculated based on lower and upper bounds of opium production and on
assumptions about the different purities of exported and domestic heroin.
Furthe r det ails on t he cal cul ati on and t he ke y compone nts t hat have be e n consi dere d are pr ovi de d i n t he
met hodol ogy se cti on.
*Source: Worl d Bank.
** t he sum of the val ue of t he domesti c market and t he val ue of opi ates belie ve d t o be ex porte d.
After deducting the seizures of opiates reported by relevant law enforcement agencies,26 it
can be estimated that nearly 125 tons of raw opium and some 28 to 53 tons of heroin reached
the illicit market. Out of these 125 tons of opium, 11 tons were destined for domestic
consumption, with a market value of 15 million USD; the remaining 114 tons of opium were
exported with a revenue of 47 million USD. The main value of the opiate market is generated
by the manufacturing and trafficking of heroin. In 2018 domestic consumption of 7.6 tons of
heroin led to an income between 238 and 401 million USD, whereas the export of heroin (20
‐ 45 tons) was deemed to be worth between 782 and 1,798 million USD for Myanmar
traffickers.
The overall gross value of the Myanmar opium economy for the year 2018 ranged between
1,082 and 2,262 million USD, equivalent to a noteworthy share (1.5 – 3.3 %) of the 2017
national GDP.27 The value of manufacturing and trafficking after farm‐gate up to the border of
Myanmar ranges between 1,020 and 2,159 million USD (1.5 – 3.1 % of the GDP). These values
represent the income generated by the traffickers after deducting the costs of buying the dry
opium from the farmers.
These estimates have some limitations. There is great uncertainty around the conversion ratio
of opium to heroin, which depends on three main factors: the morphine content of opium,
the efficiency of traffickers to extract morphine from opium and convert morphine to heroin,
26
HONLEA by September 2018 reported the seizure of 2.566 tons of opium and 750.9 kg of heroin. The quantities of opiates
seized in the whole year 2018 was extrapolated based on these figures.
27
Source: World Bank
20Myanmar Opium Survey 2018
and the purity of the heroin estimated.28 None of these factors are well researched in the
context of Myanmar, but can have a strong impact on the estimated values of the opiate
economy. Estimates on demand in the region are based on 2011 data and may have changed
since then. Moreover, the estimates presented are gross estimates before deducting any cost,
e.g. costs for precursor substances, such as acetic anhydride, which can substantially reduce
the profits of manufacturers and traffickers of heroin. To assess the profits made, other cost
components such as transportation, labour costs and costs of bribery also need to be
considered.
The estimates presented here need to be understood as an indication of the order of
magnitude rather than as precise measurements. UNODC, in collaboration with CCDAC of
Myanmar, are working on improving the accuracy of the estimates.
28
For a detailed description of the calculation of conversion ratios see “UNODC/MCN Afghanistan opium survey 2014” and
“UNODC/MCN Afghanistan opium survey 2017 – Challenges to sustainable development, peace and security”.
21Myanmar Opium Survey 2018 22
3. ERADICATION AND SEIZURES
Myanmar Opium Survey 2018

3. Eradication and Seizures
As in former years, the Government of the Republic of the Union of Myanmar (GOUM)
provided the data on eradication of opium poppy and seizures of opium in 2018.

3.1 Eradication
By the end of the 2018 growing season (February/March 2018), a total amount of 2,605 ha of
opium poppy eradication was reported by GOUM/CCDAC, representing a decrease of 26%
compared to 2017. As in previous years, most of the eradication, 2,209ha (85%) occurred in
South Shan, followed by East Shan with 224ha. The decline in eradication started in 2015,
manifesting a similar trend as the area under opium poppy cultivation (see Figure 10).

Table 6:        Reported eradication in Myanmar (ha), 2007‐2018

                   2006‐        2007‐           2008‐      2009‐     2010‐       2011‐       2012‐      2013‐           2014‐     2015‐    2016‐       2017‐
    Region
                   2007         2008            2009       2010      2011        2012        2013       2014            2015      2016     2017        2018

 East Shan         1,101           1,249        702         868      1,230       1,257        537           356          378      482          264     224

 North Shan         916             932         546        1,309     1,315        977         532           337          532       69          97       29

 South Shan        1,316           1,748        1,466      3,138     3,579       21,157      10,869     13,696          10,715    4,947    3,019       2,209

 Shan State
                   3,333           3,929        2,714      5,315     6,124       23,391      11,939     14,389          11,625    5,498    3,381       2,462
 total

 Kachin             189             790         1,350      2,936         847      83          250           395         1,495     1,504        28       65

 Kayah              12              12           14         13           38       84          59            67           54        16          47       12

 Magway             45                           1           1                     4             7          60            8        9           47       44

 Chin               10              86           5           2           10       110         32            277          267      534          28       22

 Mandalay                           3            2                       39       45                                                           1

 Sagaing                9                        1                                               2          1

 Other States       64

 National
                   3,662           4,820        4,087      8,267     7,058       23,718      12,288     15,188          13,450    7,561        3,533    2,605
 total

Source: GOUM/CCDAC
Figures for 2018 are parti al and refe rs t o t he peri od Se ptember 2017 – Febr uar y 2018

                Eradication versus opium poppy cultivation in Myanmar, 2007‐2018

 70,000
 60,000
 50,000
 40,000
 30,000                                                            23,718
 20,000                                                                                   15,188 13,450
                                                                               12,288
                                                 8,267     7,058                                                7,561
 10,000         3,662       4,820       4,087                                                                             3,533   2,605
          0
                2007        2008         2009     2010      2011    2012       2013       2014       2015       2016*     2017    2018

                                                      Eradication (ha)            Cultivation (ha)

*Opi um poppy culti vati on for t he ye ar 2016 was pl otte d with li ne ar i nte r pol ati on

                                                                                                                                          25
Myanmar Opium Survey 2018 Map 4: Reported eradication of opium poppy and seizures of opium products and processing laboratories, Myanmar (2017‐2018) 26
Myanmar Opium Survey 2018

Most of the locations in South Shan where eradication took place overlapped with areas with
high to very high opium poppy density. Map 4 shows eradication patterns in South Shan which
follow the high to very high‐density cultivation in mountainous areas. On the contrary,
eradication activities in East Shan presented a more irregular and dispersed pattern, covering
different density levels, from low to very high.
In North Shan only very little eradication was reported, equivalent to 29ha. This was
concentrated in the south, near the border with Wa State. The lower reporting of GOUM
activities in North Shan is probably related to the presence of different armed groups and
numerous security incidents (Maps 1 and 2).
In Kachin State, only some eradication was reported at the border with China (65ha), whilst
there was no reporting from other medium to high density areas, like the region surrounding
Tanai town. Finally, in the north of Chin state a few eradication points (22ha) were reported,
located at the eastern side of the Manipur River.
           GOUM eradication

The opium poppy cultivation estimates presented in this report refer to the fields that were
identified at the time that the satellite images were taken. Therefore, if any effective
eradication was carried out after the satellite image date, it is not reflected in the presented
cultivation figures. Besides, data provided by GOUM may include eradication implemented
during the monsoon poppy season, prior to the main growing season when the remote sensing
survey was implemented. The eradication figures reported by GOUM were not verified by
UNODC.

3.2 Seizures
Similarly, to the eradication figures, the seizures of different opium products reported by
GOUM showed decreases in all opiate types. Most of the opium and heroin seizures took place
near the larger towns, like Taunggyi, Mandalay, Bhamo, Lashio, Mho Nyin, or along trafficking
routes, like road and rivers, as shown in Map 4.

                                                                                               27
Myanmar Opium Survey 2018
Table 7: Seizures of drugs (opiates) in Myanmar (kg), 2007‐2018**
Raw
Year Heroin Brown Opium Liquid Opium Low‐grade opium
Opium
1988 1997 22992 3722 186 118 306
1998 5394 404 96 206 312
1999 1473 245 24 333 314
2000 1528 159 23 16 245
2001 1629 97 7 19 142
2002 1863 334 314 18 126
2003 1482 568 156 52 204
2004 607 974 59 39 396
2005 773 812 44 21 128
2006 2321 192 1371 29 6154
2007 1274 68 1121 56 10972
2008 1463 88 206 80 2453
2009 752 1076 326 27 465
2010 765 89 98 35 147
2011 828 42 37 60 282
2012 1470 336 46 29 81
2013 2357 239 72 115 66
2014 1828 435 1109 102 134
2015 889 186 539 38 35
2016 944 769 472 47 22
2017 1256 571 348 4 6
2018 (Jun) 2134 673 136 2 29
*Source: GOUM / CCDAC
** Fi gures f or 2018 corre spond t o Januar y – June onl y
Seizures of drugs (opiates) in Myanmar (kg), 2007‐2018*
14,000.00
12,000.00
10,000.00
Kilograms
8,000.00
6,000.00
4,000.00
2,000.00
0.00
2007 2008 2009 2010 2011 2012 2013 2014 2015 2016 2017 2018
Raw Opium Herion Brown Opium Liquid Opium Low‐grade opium
*Source: GOUM / CCDAC
** Fi gures f or 2018 corre spond t o Januar y – June onl y
284. METHODOLOGY
Myanmar Opium Survey 2018

4. Methodology
The 2018 opium survey included three components:
    1. Estimation of opium poppy cultivation area throughout North Shan, East Shan, South
       Shan, Kachin, Kayah and Chin states. The area estimation survey was based on the use
       of satellite images as the primary source of data, which was supplemented by field
       surveys to provide ground‐truthing that supports the interpretation of opium poppy
       fields;
    2. Crop yield estimation survey throughout South Shan, North Shan and East Shan. Due
       to ongoing conflicts and insecurity, crop yield measurements could not be
       conducted in Kachin state;
    3. A socio‐economic (village) survey in poppy growing areas of North Shan, East Shan
       and South Shan. An in‐depth analysis of the results will be presented in a separate
       report, expected to be ready in early 2019.

4.1 Area estimation
Remote sensing imagery
The area estimation to monitor the extent of opium poppy cultivation in Myanmar was carried
out by means of remote sensing techniques. North, East and South Shan in Shan State, the
eastern zone of Kachin State as well as the northern regions of Kayah and Chin States were
surveyed. Satellite imagery were acquired following two approaches (Map 5):
        1) A sampling approach with a selection of randomly selected squared segments; this
        was used for the three Shan regions and the south‐eastern part of Kachin (see Sample
        approach section);
        2) A full coverage approach with larger, targeted images; this was applied for the Tanai
        area of Kachin state, the northern part of Chin state and the northern part of Kayah
        (see Target area selection and Interpretation section).
The images used for the sampling areas were Very High Resolution (VHR) satellite images,
whilst a combination of VHR and High‐resolution images were used for the targeted areas.
The VHR images at the sample locations were taken by Pleiades satellites, which provides
images of 2 metre ground resolution with four spectral bands (blue, green, red and infra‐red)
and a 50‐centimetre panchromatic band. For every location (sample segment), two images
were acquired with an approximate five‐week interval; one image was taken in December or
January and the other between February and March. These two dates correspond to the pre‐
and post‐harvest periods of poppy, thus facilitating the identification and discrimination from
other land cover classes. To determine the image acquisition dates, the regional differences
between the crop calendars were considered.

                                                                                               31
Myanmar Opium Survey 2018
VHR image (Pleiades), on the left vs HR image (Rapid Eye), on the right
The images covering the Tanai area in Kachin state, the northern part of Chin state and the
northern part of Kayah state were acquired by RapidEye satellites, with 6.5 metre nominal
ground resolution or 5 meter resolution for orthorectified products. It provides five spectral
bands, ranging from blue to near infrared colours. A few VHR Pleiades images were acquired
for the same areas, to correct for interpretation errors caused by the lower spatial resolution
of the RapidEye images. By interpreting both image types independently, a factor was
determined that provides the difference in area estimates from a RapidEye image compared
to Pleiades images. This factor was applied to the fields that were only covered by the
RapidEye images, to correct for the differences in spatial resolution.
32Myanmar Opium Survey 2018
Map 5: Location of different types of satellite images used for the survey, 2018
Risk area and sampling frame for the selection of satellite image locations
A risk area describes the geographic area considered in the area estimation survey. Basically,
the risk area for the opium survey was developed by the combination of the following factors:
1) Land Cover;
2) Altitude;
3) Opium poppy free29 areas according to ground information.
29
Opium poppy free in the sense of no indication for significant levels of opium poppy cultivation.
33Myanmar Opium Survey 2018
Land cover was the first important factor in defining the sampling frame. From the 2012 survey
onwards, a land cover map, which was developed by classifying 5 DMC images with 22 metre
resolution, acquired in February 2011, was used. From this map, large agricultural areas were
extracted and considered to be poppy‐free, since the cultivation of opium poppy was
practised in small agricultural areas, often surrounded by natural vegetation. Wetlands and
settlements were also excluded. Other classes of land use were considered to have the
potential for opium poppy cultivation.
Prior to 2013, only altitudes between 800 and 1,800 metres were to be considered within the
risk area. This was based on survey findings which had revealed that 95% of opium poppy was
cultivated at such altitudes. However, later evidence showed the existence of poppy fields at
600 metre altitude and above, without a specific higher limit. Consequently, the sampling
frame for the selection of the sample locations was updated in 2013 using this finding. Several
opium poppy‐free areas were identified based on ground information. The special regions;
Wa (former S.R.2), Mongla (former S.R.4), and Kokant (former S.R.1); were excluded from the
sampling frame. The townships; Mabein, Kyaukme, Nawng Hkio and Kunlon in North Shan;
and Kalaw, Pindaya, Yak Sauk and Ywa Ngan in South Shan; were excluded from the sampling
frame for the same reason. A 10‐km buffer zone along the border with Thailand, which were
considered opium poppy‐free in earlier surveys, was included again in the sampling frame in
2013 because ground information from the 2012 survey indicated a certain poppy risk.
The above‐mentioned factors were combined in a Geographic Information System (GIS) to
calculate the sampling frame in Shan state. The sampling frame for Waingmaw Township in
Kachin state was developed only considering an altitude factor of more than 800 metres.
Altitude ranges of opium poppy fields found in satellite images, 2017/2018
(metres)
1600
100%
80%
% of poppy fields found
60%
40%
20%
0%
South Shan East Shan North Shan Kachin (Waingmaw)
Regions
Sampling approach, sample size and sample selection
Because of the widespread poppy cultivation in the North Shan, East Shan, South Shan and in
southern Kachin, a sampling approach is most cost‐ efficient given the required accuracy.
The sampling frame for this survey was a set of 5x5 km segments used to select the locations
for obtaining satellite imagery. For that purpose, a 5x5 km regular grid was superimposed on
the risk area. To increase the efficiency of the sample (thus to reduce the number of images
purchased that only cover a small part of the risk area), a threshold of a minimum of 30% of
risk area was set: if a segment contained less than 30% of risk area (e.g. is a cell at the
34Myanmar Opium Survey 2018
boundary of the risk area), it was not included in the sampling frame. Nevertheless, in the
extrapolation, the whole risk area is considered, with the underlying assumption that the area
outside of the frame behaves on average as the area inside the sampling frame.
In 2018, the same samples were used as selections for the survey of 2015, totalling 84
segments. Due to budget constraints, in 2017, only half of this number were sampled,
however taken from the same sample set (see Myanmar Opium Survey 2017).
Table 8: Sample size allocation in 2018
Number of geo‐ Number of geo‐
Region Sample size 2017 Sample size 2018
strata 2017 strata 2018
East Shan 14 30 7 15
South Shan 16 30 8 15
North Shan 8 16 4 8
Kachin 8 8 4 4
Total 46 84 23 42
Since the same samples are used in 2015 and 2018, the 2015 selection method is explained.
Firstly, the frame was separated by region. Here, each segment had to be assigned to exactly
one per region: if the majority of the risk area is within that region, the segment was assigned
to that region. Therefore, regional boundaries were in some sense generalized to fit the 5x5
km grid. Secondly, each sub frame (region) was divided into compact geographical strata of
approximately equal area. In former surveys the definition of the strata was done manually
but a clustering algorithm (“k‐means”) in the statistical software R30 package spcosa was
applied in the 2014 Survey. In each stratum, two sampling locations were selected by simple
random sampling. This sampling method provides a geographically well distributed sample
and allowed the variance (uncertainty) to be estimated in an unbiased manner. See for more
details the Myanmar Opium Survey of 2015.31
30
http://www.r‐project.org/ and package http://cran.r‐project.org/web/packages/spcosa/index.html
31
https://www.unodc.org/documents/crop‐monitoring/sea/Southeast_Asia_Opium_Survey_2015_web.pdf
35Myanmar Opium Survey 2018 Map 6: Sampling frame and selected samples, 2018 Ground truth data collection The opium poppy planted area estimation was conducted in collaboration with the Remote Sensing and GIS Section of the Forest Department, Ministry of Natural Resources and Environmental Conservation. Each year, field teams organized by the Department carried out ground truthing at the selected sample locations. In the 2018 survey, three teams organized by the Department carried out ground data collection in South Shan, East Shan and North Shan. All teams, each comprising two surveyors from the Forest Department and one officer from the local drug enforcement police, visited selected satellite sample sites during 36
Myanmar Opium Survey 2018

the period of January to March 2018. A dedicated team, led by UNODC national staff, in
collaboration with a CCDAC officer, conducted monitoring of the ground verification activities.
            “Ground‐truthing” teams in North, East and South Shan.

The ground verification teams visited selected sites with printouts of the satellite images (see
Map 7). Once they reached the area represented in each single scene, they annotated the
printouts with the land use classes and relative boundaries proceeding with specific transect
itineraries. They collected GPS coordinates taking field photos from 30 selected satellite image
sites in Shan state. Back in the office, poppy fields were visually interpreted by a UNODC
national expert from the Myanmar office. The results were assessed, and quality‐control
checks were applied by international experts at UNODC Headquarters, Vienna.

Table 9:    Ground truth data collection
                                                                No. of                              VHR
                                     No. of                                             No. of
 Survey                                         Segment        segment      Ground                images
            Satellite image VHR   segments in                                         segments
  Year                                            size          visited     truth %               area sq.
                                     Shan                                             in Kachin
                                                            (groundtruth)                           km
  2007     Ikonos                     22          8x8            17          77%                   2,816
  2008     Ikonos                     28          8x8            19          68%                   3,584
  2009     Ikonos                     40          8x8            34          85%                   5,120
  2010     GeoEye, WorldView          40        6.5 x 6.5        32          80%         3         3,634
  2011     WorldView, QuickBird       51          6x6            40          78%         3         3,888
  2012     GeoEye, WorldView          58          5x5            47          81%         8         3,300
  2013     GeoEye, WorldView          66          5x5            46          70%         8         3,700
           GeoEye, WorldView,
  2014
           QuickBird                  76          5x5            49          64%         8         4,200
  2015     Pleiades                   76          5x5            47          62%         8         4,200
  2016     No survey                  ‐‐           ‐‐            ‐‐           ‐‐         ‐‐          ‐‐
  2017     Pleiades                   38          5x5            3            8%         8         4,200
  2018     Pleiades                   76          5x5            30          39%         8         4,200

                                                                                                    37
Myanmar Opium Survey 2018 Map 7: Field verification status of the survey with satellite images, 2018 38
Myanmar Opium Survey 2018
Target area selection and interpretation
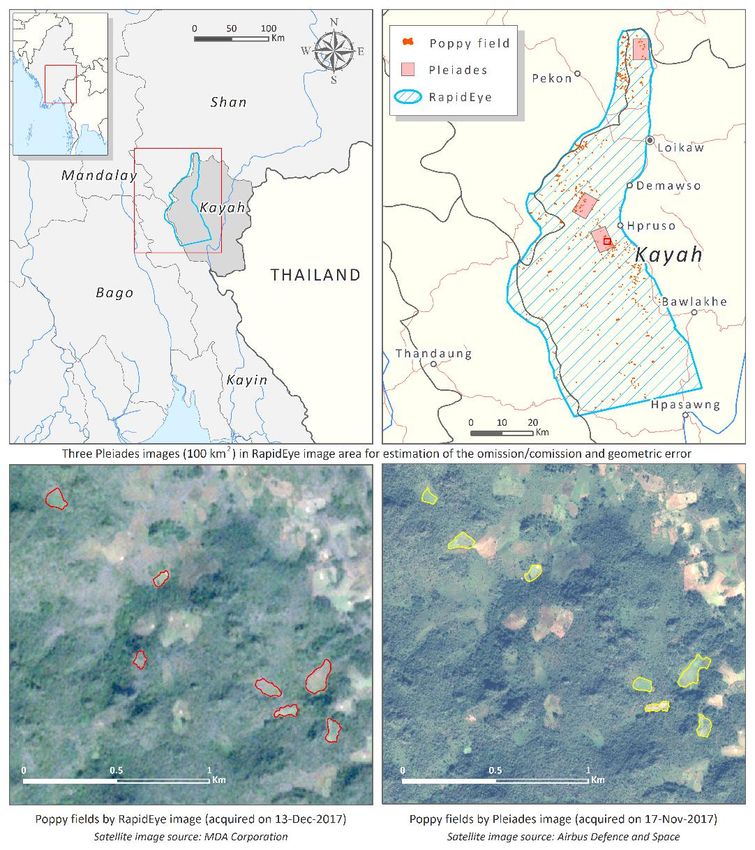
The area estimates for Tanai area in Kachin, the northern part of Chin and the northern part
of Kayah were based on a so‐called target approach.32 These areas were fully covered by high
resolution (HR) satellite imagery (Rapideye). In addition to the HR images, very high‐resolution
images were acquired33 (Map 7), which allowed for an estimation of the omission/commission
and geometric errors that stem from the use of lower resolution imagery.
To that end, the area was first interpreted on the lower resolution imagery and then on the
very high‐resolution images, which are closer to the true area. The difference between the
areas was used to calculate a correction factor that was applied subsequently to the estimates
interpreted with the HR images (Table 10).34
Poppy fields in two different satellite images, Pleiades and RapidEye
32
The target areas were defined based on information on poppy cultivation from previous surveys. Three VHR images were
acquired for Kayah and four for Chin.
33
In 2018, very high‐resolution images were acquired for Kayah and Chin. Tanai region was corrected with the 2017 correction
factor.
34
95% confidence intervals for each targeted area were calculated assuming a t‐student distribution and two degrees of freedom.
See https://www.itl.nist.gov/div898/handbook/mpc/section5/mpc552.htm for further information on the method to calculate
the standard deviation.
39Myanmar Opium Survey 2018
Satellite image processing
Back in the office, the collected data were used as reference information to visually identify
poppy fields. This task was conducted by a UNODC national expert in the Myanmar office, with
extensive experience in poppy interpretations.
The classification procedure of the very‐high resolution images is illustrated in the following
flow chart. Before the interpretation phase starts, imagery undergoes some pre‐processing
steps. The main and most important is the pan‐sharpening of the Pleiades multi‐spectral
bands with the panchromatic band, as a result showing a VHR image with the resolution of
the panchromatic band (50 cm). This is a fundamental step to better discriminate poppy fields
from other landcover classes. In addition, visual enhancement procedures are applied if
needed.
Satellite image processing flowchart
Sampling
Very high resolution Very high resolution
images images
Ground truth
Visual interpretation
data
Suspicious poppy fields
pre-harvest
Historical data on
poppy growing locations Visual overlay
and decision
Pansharpened real color
very high resolution images
Classified sample
area with opium
The satellite image interpretation was done in a visual manner. The ground truth data,
historical ground truth data, data collected from the yield measurements and eradication
were used as reference material in the interpretation process. In visual interpretation,
accuracy and precision of the result vary with the experience and the skills of those doing the
interpretation. Therefore interpretation keys (decision rules) were used that bring the
interpreters to a comparable level of knowledge, experience and notion of the topic. The
40You can also read