Midlothian Council Employment Land Audit 2021
←
→
Page content transcription
If your browser does not render page correctly, please read the page content below
0   Midlothian Employment Land Audit 2021

Midlothian Council
Employment Land Audit - 2021

     Contents
1   Midlothian Employment Land Audit 2021

    Contents

    1 – Introduction ......................................................................................3
    2 – Audit Content ....................................................................................4
      2.1 – Overview .....................................................................................4
      2.2 – Utility Provision .............................................................................4
      2.3 – Mobile Phone Coverage ....................................................................4
      2.4 – Broadband Coverage .......................................................................5
      2.5     – Transport & Site Accessibility .........................................................5
      2.6 – Site Visits ....................................................................................6
    3 – Planning Policy Context ........................................................................7
      3.1 – Overview .....................................................................................7
      3.2 – Economic Strategy..........................................................................7
      3.3 – National and Strategic Policy .............................................................8
      3.4 – Midlothian Local Development Plan .....................................................9
    4 – The Local Economic and Employment Context ........................................... 10
      4.1 – Midlothian Labour Market Data ........................................................ 10
      4.2 – Commuting to and from Midlothian ................................................... 13
    5 – Employment Land Supply Summary ........................................................ 16
      5.1 – Supply Breakdown ........................................................................ 16
      5.2 – Land Supply Summary by Settlement ................................................. 17
      5.3 - ELA Data Spreadsheet ................................................................... 19
      5.4 - Supply Updates Since the Last ELA Publication...................................... 23
    6 – Individual Site Summaries .................................................................... 27
      6.1 – Hopefield .................................................................................. 27
      6.2 - Sherwood Industrial Estate ............................................................. 28
      6.3 – Whitehill Business Centre ............................................................... 29
      6.4 – Grannies Park ............................................................................. 30
      6.5 – Thornybank Industrial Estate ........................................................... 31
      6.6 – Hardengreen Industrial Estate .......................................................... 32
      6.7 – Salter’s Park Extension and Salter’s Park ............................................ 33
      6.8 – Sheriffhall South .......................................................................... 34
      6.9 – Easthouses Industrial Estate ............................................................ 35
      6.10 – Redheugh ................................................................................. 36
      6.11 – Straiton ................................................................................... 37
      6.12 – Engine Road .............................................................................. 38
      6.13 – Ashgrove .................................................................................. 39
      6.14 – Edgefield Industrial Estate ............................................................ 40
2   Midlothian Employment Land Audit 2021

      6.15 – Pentland Industrial Estate ............................................................. 41
      6.16 – Ashgrove North .......................................................................... 42
      6.17 – Bilston Glen .............................................................................. 43
      6.18 – West Straiton ............................................................................ 44
      6.19 – Mayfield Industrial Estate.............................................................. 45
      6.20 – Lady Victoria Business Centre ......................................................... 46
      6.21 – Stobhill Road ............................................................................. 47
      6.22 – Butlerfield Industrial Estate ........................................................... 48
      6.23 – Eastfield Farm Road Industrial Estate ............................................... 49
      6.24 – Eastfield Industrial Estate ............................................................. 50
      6.25 – Gorton Road ............................................................................. 51
      6.26 – Oatslie Expansion and Oatslie ......................................................... 52
      6.27 – Hunter’s Yard ............................................................................ 53
      6.28 – Whitehill Mains .......................................................................... 54
      6.29 – Shawfair Park Extension and Shawfair Park ........................................ 55
      6.30 – Millerhill/Monktonhall .................................................................. 56
      6.31 – Polton House ............................................................................. 57
      6.32 – Eldin ....................................................................................... 58
      6.33 – Dalhousie Business Park ................................................................ 59
      6.34 – Newbattle Abbey Annex ............................................................... 60
      6.35 – Pentland Studios (South) ............................................................... 61
    7 – Individual Site Summaries – Midlothian Science Zone Sites ............................. 62
      7.1 – Gowkley Moss South ...................................................................... 62
      7.2 – Technopole North West ................................................................. 63
      7.3 – Midlothian Innovation Centre ........................................................... 64
      7.4 – Easter Bush South ........................................................................ 65
      7.5 – Easter Bush North ........................................................................ 66
      7.6 – Easter Bush ................................................................................ 67
      7.7 – New Milton................................................................................. 68
      7.8 – Pentland Science Park ................................................................... 69
      7.9 – Gowkley Moss North ...................................................................... 70
      7.10 – Gowkley Moss ............................................................................ 71
      7.11 – Edinburgh Technopole.................................................................. 72
    Appendices ......................................................................................... 73
      Appendix 1 – Glossary & Abbreviations ...................................................... 73
      Appendix 2 – Links to Additional Resources ................................................. 74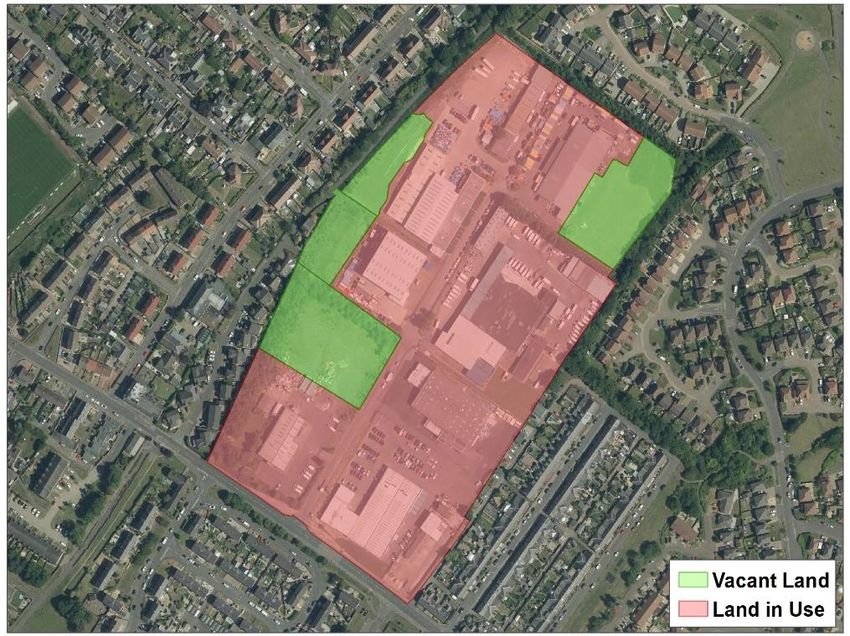
3 Midlothian Employment Land Audit 2021
1 – Introduction
1.1 This Employment Land Audit (ELA) is the culmination of work undertaken in early
2021 to provide an up-to-date baseline on the supply and availability of employment
land in Midlothian. It has several purposes, which are based on direction provided by
Scottish Planning Policy (SPP). These include monitoring the supply, quality, planning
status and use of employment land and identifying the volume and locations of
immediately developable and constrained sites. The audit will also be used to inform
policy decisions made in future local development plans.
1.2 This audit involved gathering and reviewing a range of data, including:
Secondary data from utilities companies to determine the provision of
services to employment land sites;
Site assessments to consider site access, vacant plots and recording
neighbouring land uses; and
Council service information including on active travel, public transport and
land ownership.
1.3 This audit builds on the work undertaken in preparing its predecessors in 2018
and 2020, which were developed in collaboration between the Council’s Planning and
Economic Development teams. This approach gave the dual benefits of informing
development plan preparation and policy monitoring as well as providing important
marketing information to assist development and investment enquiries. Moving forward,
the audit will also help to provide an informed picture of the employment land situation
in Midlothian.
1.4 The audit gives a comprehensive view of the range and choice of sites which
make up the employment land supply and will be a valuable source of information to
businesses, developers and other organisations with an interest in economic land in
Midlothian.
This document is designed to be read in conjunction with an accompanying
online map.
Planning application reference numbers are listed regularly in this document.
Users can look them up at the Council’s Planning and Building Standards Portal
Business Gateway offers expert help and support to new and existing businesses
in Midlothian. Information and contact details are available from their website.
Information on commercial and industrial property for sale or lease in Midlothian
can be on the Council’s website.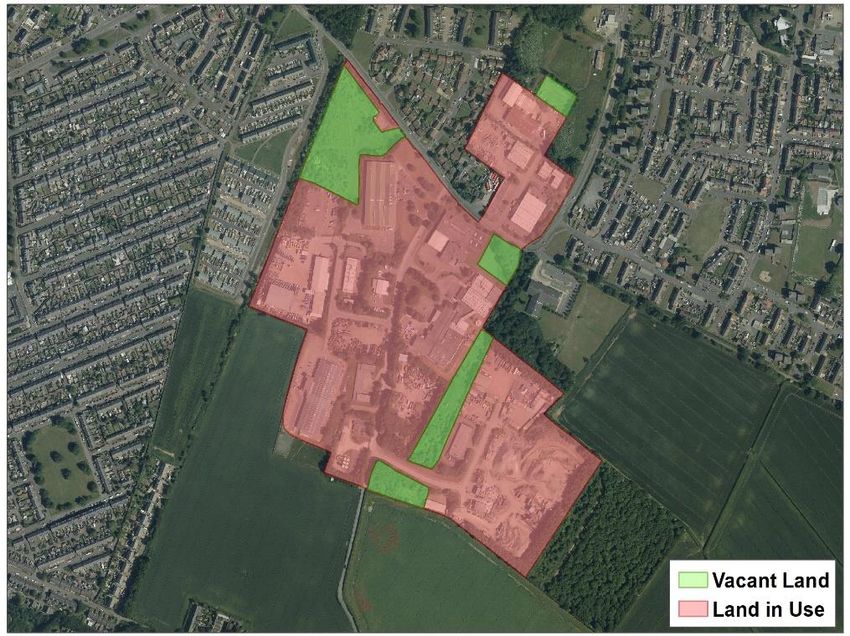
4   Midlothian Employment Land Audit 2021

    2 – Audit Content

    2.1 – Overview

    2.1.1 A primary goal of this ELA is to assess the status and availability of each economic
    land allocation in Midlothian with respect to various criteria that enable or constrain
    development to some degree. These include, amongst others, the provision of utilities
    to sites, communications connections and transport considerations. These factors are
    recorded in the sites spreadsheet (section 5.3) using various ratings criteria and sections
    2.2 to 2.6 below outline the process for sourcing and recording this data.

    2.2 – Utility Provision

    2.2.1 The Utility Map Viewer tool from Scottish Power Energy Networks was used to
    determine the status of electricity provision to the ELA sites. This provided details on
    whether the sites had a connection at all, the proximity of any connection, its voltage
    level, whether it was in the form of an underground cable or an overhead line and
    whether any existing infrastructure might impede development.

    2.2.2 For gas supplies, GIS shape files of the employment sites were overlain with other
    GIS maps showing low, medium and high-pressure gas pipes. Notes were taken on the
    type of connection to each site, its proximity to the site and whether any existing
    infrastructure might impede development.

    2.2.3 Scottish Water’s Utility Map Viewer was used to determine the nature of sites’
    connections to the water and wastewater networks. Scottish Water were also consulted
    regarding the capacity at water and wastewater treatment works and also whether
    there were any issues regarding the location of their assets that might influence
    proposals at the ELA sites.

    2.2.4 When this information was recorded for each location, the sites were reviewed
    and then rated on a scale of green, yellow, amber or red, depending on the availability
    of all the various services to them, the proximity of possible connection points and any
    existing on-site infrastructure that would potentially influence development layouts or
    require relocation.

    2.3 – Mobile Phone Coverage

    2.3.1 Information on mobile phone coverage at the ELA sites is based on data recorded
    using Ofgem’s mobile phone coverage checker. This provides ratings of voice and data
    coverage both indoors and outdoors and for 4G and non-4G services for any UK postcode.

    2.3.2 A map of the ELA sites was overlain with a GIS map of the postcode units in
    Midlothian to find out which postcode(s) were located within which site. These were
    then entered in the coverage checker webpage and ratings were recorded depending on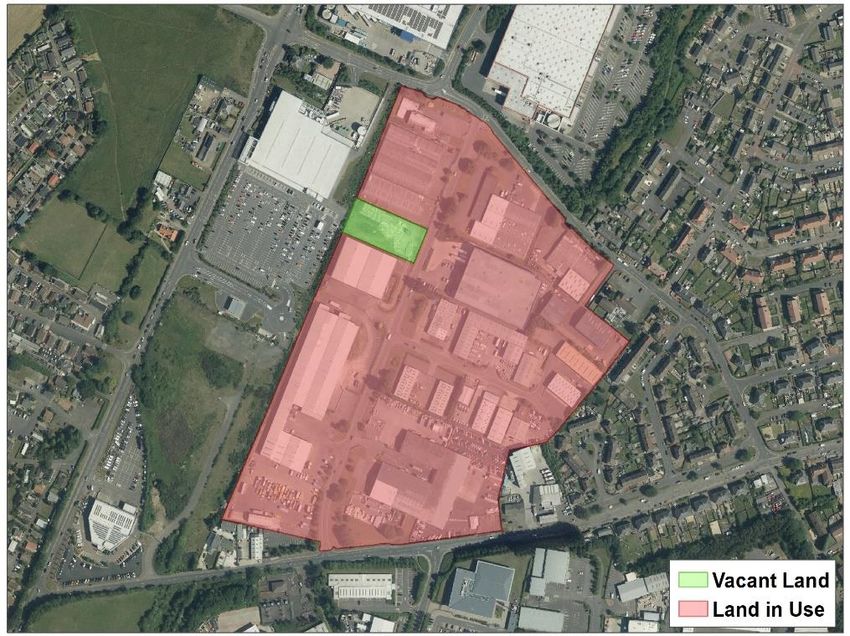
5 Midlothian Employment Land Audit 2021
whether mobile phone signals were good, mixed or unavailable at the sites. This was
repeated in relation to each of the UK’s four network operators (EE, O2, Three and
Vodafone) and the quality of coverage was summarised in the form of a percentage
score: the higher the score, the better the overall coverage. Within the accompanying
audit spreadsheet, cells containing scores are also colour coded from red (poor
coverage) to green (excellent coverage) to assist in visually comparing signal quality
across sites.
2.4 – Broadband Coverage
2.4.1 To determine the quality of broadband coverage to economic land allocations,
Ofgem’s broadband coverage checker was used in a similar manner to their mobile
phone coverage checker. This involved the relevant postcodes being entered into the
tool and noting the speed and availability of both standard and superfast broadband.
Speeds recorded are an average of the highest available download and highest available
upload rates at all of the postcode units within which economic allocations are found.
These range from a minimum of 0.63 megabits per second (Mbps) to a maximum of
17.50Mbps in the case of standard broadband and 25.50 to 50Mbps for superfast
broadband (where available). Speeds are indicated relative to each other within the
spreadsheet summary (section 5.3) using red to green colour coding. Availability of both
types of service are recorded as either ‘good’, ‘average’ or ‘none’.
2.4.2 It should also be noted that ultrafast broadband is available in some locations in
Midlothian. This service has download speeds of greater than 300Mbps (which compares
to speeds of less than 30Mbps in the case of standard broadband and speeds of between
30Mbps and 300Mbps for superfast broadband).
2.4.3 All the relevant postcode units in employment sites were also entered into the
Ofcom coverage tool to check for the availability and speed of ultrafast broadband. This
showed that such services are not available in the vast majority of cases in Midlothian
and for this reason, details of ultrafast speeds and coverage are not included in the
spreadsheet of section 5.3. Readers can however use the coverage checker if they are
interested in obtaining further details.
2.5 – Transport & Site Accessibility
2.5.1 SPP (paragraph 101) indicates that employment allocations should consider their
‘accessibility to transport networks by walking, cycling and public transport and their
integration with and access to existing transport networks’. Midlothian Council’s
Transport Team were consulted to provide information on transport-related
employment site issues. This involved:
Reviewing the maps from the Council’s Active Travel Strategy and rating each of
the sites in terms of opportunities for active travel to and from them. This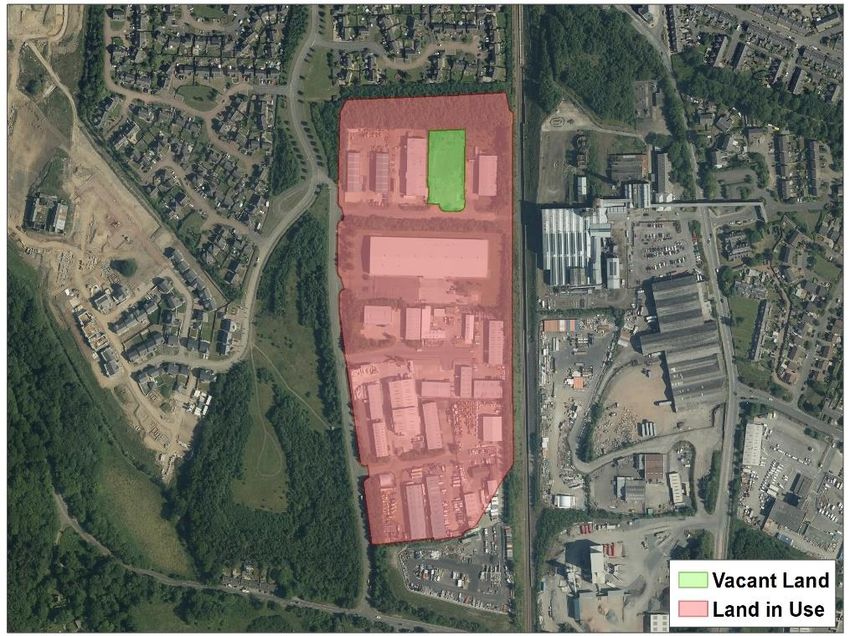
6 Midlothian Employment Land Audit 2021
considered their proximity to footpaths, cycle routes and also residential areas.
Ratings took into account both existing and planned future active travel
infrastructure;
Rating each of the sites in terms of their integration with and access to road
networks. This considered their proximity to A roads, B roads, the trunk road
network and ease of site access; and
Reviewing each of the sites in terms of the quality of bus services available to
and from them. This considered the distance of the sites to nearby bus stops, the
frequency of services at these stops and the choice of location that users could
travel from/to.
2.6 – Site Visits
2.6.1 Site visits were undertaken in early 2021. Data was recorded on standardised
forms to ensure consistency in the categories of information recorded. These topics
included topography, neighbouring land uses, access issues and general site notes. Maps
were also provided to allow vacant land to be marked.
2.6.2 Visits were supplemented by prior desk-based research on issues such as
reviewing sites for recent planning applications and inspecting aerial photographs.
Where relevant, other colleagues in the Planning Team were consulted to provide
additional information on employment sites.
7 Midlothian Employment Land Audit 2021
3 – Planning Policy Context
3.1 – Overview
3.1.1 The Council aims to support Midlothian’s growing economy by creating quality
and sustainable locations for development. The allocation and promotion of
employment land forms a crucial element in supporting and expanding economic
opportunities, alongside other complementary services, such as Business Gateway.
3.1.2 Policies relating to employment land are set out in a number of documents
produced by the Scottish Government, the Strategic Development Plan (SDP) Authority
and Midlothian Council.
3.2 – Economic Strategy
3.2.1 The Scottish Government produced Scotland’s Economic Strategy in 2015. It aims
to deliver sustainable economic growth, with four priorities identified to encourage this:
Investment - investing in our people, infrastructure and assets;
Innovation – supporting the development of highly-innovative businesses and
encouraging more of the country’s business base to engage in research and
development;
Inclusive growth - promoting a labour market which provides sustainable and
well-paid jobs while seeking a more equal growth distribution across the country;
and
Internationalisation - supporting Scotland’s exporters to expand their presence
and grow into new markets, enhancing Scotland’s international brand.
3.2.2 In December 2019, Midlothian Council updated its Economic Growth Strategy,
which sets out the economic development vision and key priorities for Midlothian over
the 2020 to 2025 period. It aims to align with the Scottish Government’s Economic
Strategy. It is also set in the context of the Council’s Single Midlothian Plan, whose
vision is ‘Midlothian – a great place to grow’ and which has three key priorities – reducing
inequalities in learning, health and economic circumstances. The vision in the Council’s
Economic Growth Strategy itself is:
‘For Midlothian to be a recognised area in which to live, work and do business; an
economy that is sustainable, inclusive, ambitious and internationally-recognisable as
home to world-leading clusters of science, innovation and tourism offers from which
all our citizens can benefit’.
3.2.3 To achieve this vision, and following consultation carried out during the
development of the Strategy, a series of strategic priorities were identified:
To integrate Midlothian with the regional economy and promote the region
internationally;
8 Midlothian Employment Land Audit 2021
To improve the skills landscape;
To increase economic participation;
To build on the success of Midlothian’s key sectors;
To improve the vibrancy of our town centres and make them more
environmentally-friendly; and
To accelerate growth through infrastructure upgrades.
3.2.4 The Strategy also identifies the current position regarding progress against these
priorities as well as specific actions that will help achieve them and how movement
towards fulfilling them will be measured.
3.2.5 The Strategy will build on the work done to support its predecessor, 2014’s
‘Ambitious Midlothian: Economic Recovery Plan’. For example, progress made included
support from Business Gateway, agreement of the Edinburgh & South East Scotland City
Region Deal, infrastructure projects actively being progressed and money being secured
for extensive environmental improvements in Penicuik and Gorebridge. Another major
boost was the opening of Borders Rail in late-2015 which was accompanied by a
campaign highlighting opportunities for locations near its stations. A number of
businesses also benefitted from the enhanced rates of public funding available through
the Regional Selective Assistance discretionary grant scheme.
3.3 – National and Strategic Policy
3.3.1 Scottish Planning Policy (SPP) is the main national policy document for planning
matters. It sets out the key principles in relation to the allocation and monitoring of
economic land. These include:
Promoting business and industrial development that increases economic activity
while safeguarding and enhancing the natural and built environments;
Allocating sites that provide for a diverse range of needs of different sectors and
sizes of business and that also provide flexibility to accommodate changing
circumstances; and
Giving due weight to the net economic benefit of proposed developments.
3.3.2 SPP also outlines a number of measures that assist in ensuring the effective
delivery of economic sites. These include:
Ensuring that development plans align with local economic strategies;
Ensuring that LDPs allocate a range of sites for business; and
Recommending that Employment Land Audits are completed regularly and take
account of issues such as the location, size, planning status and existing use of
sites as well as neighbouring land uses and any significant land use constraints,
such as contamination or subsidence.
9 Midlothian Employment Land Audit 2021
3.3.3 The SDP for Edinburgh and South East Scotland outlines the planning policy
position for the Edinburgh City Region. It recognises the benefits to the regional
economy of key employment sectors which, for Midlothian, include life & animal
sciences, construction, tourism, education and the public sector. To this end, it supports
the development of a range of marketable sites in terms of size and quality and it set a
requirement that Midlothian allocate an additional 129ha of employment land.
3.4 – Midlothian Local Development Plan
3.4.1 The Midlothian Local Development Plan (MLDP) was adopted in late-2017. It seeks
to ensure a readily available supply of land for economic development and to offer a
range and choice of sites and locations to support economic growth. Given the scale of
current and future economic growth coupled with the reliance on commuting outwith
Midlothian, a key part of the plan is to promote local employment opportunities.
3.4.2 In order to achieve these aims, the MLDP makes use of a number of approaches:
Additional sites have been allocated as required by the SDP, with particular
emphasis on providing more land at the Midlothian Science Zone (MSZ);
Sites have been expanded where there was potential to create employment
locations of a suitable scale to be of strategic importance to the market; and
A limited number of less effective sites with little prospect of development
were deallocated and their loss was compensated for by reallocating land
elsewhere.
The purpose of such measures was to improve the range of employment sites and
opportunities that the land supply provides.10 Midlothian Employment Land Audit 2021
4 – The Local Economic and Employment Context
4.1 – Midlothian Labour Market Data
4.1.1 Labour market data is an important part of business development and investment
decisions. It is also relevant to the development plan process and context for this audit.
This section focuses on such matters and the figures in it are taken from Office for
National Statistics (ONS) ‘Labour Market Profiles’. Their contents vary in terms of what
time period the data applies to, meaning that they only partially reflect changes in the
labour market brought about by the coronavirus pandemic.
4.1.2 Midlothian has a population of around 92,500. This is an increase of
approximately 10,000 over the last decade. The working age population (16 – 64 years
old) is 57,100 or 62% of the total population, which is a slightly lower proportion than is
seen nationally (64%). Of these people, 46,700 are economically active and 45,900 are
in employment. Midlothian compares favourably with the Scottish averages in these
respects:
81% of working age people in Midlothian are economically active (compared to
76% in Scotland as a whole); and
80% of working age people in Midlothian are in employment (compared to 74%
across Scotland).
4.1.3 Midlothian’s workforce is larger than the number of jobs that are available within
the Council area. The latest figures (from 2019) show that there are around 35,000 jobs
available in district, implying that many people who live in Midlothian work elsewhere
in Scotland (also see section 4.2).
4.1.4 The availability of jobs within the area compared to the size of the working age
population is reflected in ‘job density’ figures. This is the ratio of the total number of
jobs in an area to the working age population - where it is above one, this indicates that
there are more jobs available locally than the workforce can fill. Midlothian’s job
density is 0.62, compared to 0.82 for Scotland nationally, meaning that there are fewer
jobs available for residents here than there typically are in other local authorities. There
are also less full-time jobs in Midlothian (64.5% of all jobs) than the Scottish average
(66.3%) and employees in these jobs tend to earn less than workers elsewhere in
Scotland, as shown below.
Table 1 – Comparisons of pay rates between Midlothian and Scotland.
Midlothian Scotland
Median gross weekly full-time pay £552.60 £592.70
Median hourly pay
£14.38 £15.50
(excluding overtime)11 Midlothian Employment Land Audit 2021
4.1.5 Beyond the overall number of Midlothian’s residents that are in work and what
they earn, ONS provide details of their occupations too. This is reflected in the next two
tables. Immediately below is a breakdown of Midlothian’s 46,000 workforce according
to the Standard Occupation Classification (SOC), which also gives descriptions of the
types of job within each of its four categories. After that, table 3 provides a breakdown
of jobs based in Midlothian by type of industry. Other ONS figures show that the size of
businesses in Midlothian in terms of the number of staff they employ are comparable to
the Scotland-wide averages.
Table 2 – Employment by occupation in Midlothian and Scotland.
Midlothian Scotland
SOC Group and Categories
(%) (%)
SOC 2010 major group 1 - 3 48.2 46.4
1 – Managers, directors and senior officials 10.1 9.2
2 – Professional occupations 23.8 22.7
3 – Associate professional & technical 14.0 14.4
SOC 2010 major group 4 - 5 16.1 19.4
4 – Administrative & secretarial 7.9 9.5
5 – Skilled trades occupations 8.1 9.8
SOC 2010 major group 6 - 7 22.6 18.1
6 – Caring, leisure and other service occupations 13.5 10.1
7 – Sales and customer service occupations 8.9 8.0
SOC 2010 major group 8 - 9 13.1 16.1
8 – Process plant & machine operatives 5.4 6.0
9 – Elementary occupations 7.6 10.112 Midlothian Employment Land Audit 2021
Table 3 – Breakdown of jobs in Midlothian and Scotland by type of industry.
Midlothian Scotland
Industry
(%) (%)
Mining and quarrying 0.1 1.1
Manufacturing 7.3 6.8
Water supply, sewerage, waste
0.6 0.8
management and remediation activities
Construction 8.1 5.5
Wholesale and retail trade, repair of
19.4 13.5
motor vehicles and motorcycles
Transportation and storage 2.3 4.2
Accommodation and food service
5.6 8.3
activities
Information and communication 2.6 3.4
Financial and insurance activities 0.7 3.4
Real estate activities 1.5 1.5
Professional, scientific and technical
9.7 7.2
activities
Administrative and support service
6.5 8.2
activities
Public administration and defence,
7.3 6.3
compulsory social security
Education 11.3 8.3
Human health and social work activities 11.3 16.0
Arts, entertainment and recreation 2.6 2.8
Other service activities 1.9 1.7
4.1.6 The occupations of Midlothian’s workforce will be influenced by the
qualifications they hold, and the following data shows the qualifications obtained by
Midlothian’s residents by National Vocational Qualification (NVQ) level. These levels
comprise the following categories:
NVQ 1 equivalent - e.g. fewer than 5 GCSEs at grades A-C, foundation GNVQ, NVQ
1, intermediate 1 national qualification (Scotland) or equivalent;
NVQ 2 equivalent - e.g. 5 or more GCSEs at grades A-C, intermediate GNVQ, NVQ
2, intermediate 2 national qualification (Scotland) or equivalent;
NVQ 3 equivalent - e.g. 2 or more A levels, advanced GNVQ, NVQ 3, 2 or more
higher or advanced higher national qualifications (Scotland) or equivalent; and
NVQ 4 equivalent and above - e.g. HND, Degree and Higher Degree level
qualifications or equivalent.13 Midlothian Employment Land Audit 2021
Table 4 – Comparison of qualifications held by workers in Midlothian and Scotland.
Midlothian Midlothian Scotland
Level of Qualification
(Number) (%) (%)
NVQ4 and above 24,200 42.9 45.3
NVQ3 and above 34,100 60.5 60.8
NVQ2 and above 43,300 76.7 75.6
NVQ1 and above 47,400 84.1 83.5
Other qualifications 3,700 6.5 6.7
No qualifications 5,300 9.4 9.8
4.2 – Commuting to and from Midlothian
4.2.1 A fuller picture of the economic and employment context in Midlothian is gained
by considering the labour market information from section 4.1 alongside data on the
travel movements of people within that labour market. Note that these observations
are from data generated before the coronavirus pandemic.
4.2.2 Commuting information relating to Midlothian can be obtained from Transport
Scotland’s annual ‘Transport and Travel in Scotland’ (TATIS) datasets, which include a
question on why people make particular journeys. In 2014, 16% of people from the
Midlothian sub-sample listed commuting as their ‘main purpose of travel’, while in 2019
this figure had increased to 19% (although the figure for 2018 was 22%). This is a
continuation of a trend seen between the 2001 and 2011 Censuses where the number of
journeys to workplaces in Midlothian increased by 7%. It also fits with TATIS observations
of lower numbers of people in Midlothian working from home in 2019 compared to
previous years and an increasing percentage of people from Midlothian using the car or
van as their usual method of travelling to work; this is up from 55% to 62% from 2014 to
2019. Put together, this means that both more commuting journeys are being made and
that the car is increasingly utilised for them.
4.2.3 Figures 1 to 4 consider the origins and destinations of the workforce over the last
two censuses. Figures 1 and 2 show a reduction in the level of self-containment between
2001 and 2011: the portion of Midlothian’s residents that also worked in Midlothian fell
from 45.5% to 42.4%. The two charts also show that Edinburgh is the main destination
for Midlothian’s residents, more than Midlothian itself.
4.2.4 While these conclusions are drawn from censuses and are therefore reliable in
terms of sample coverage, it should also be borne in mind that they are now several
years old. More recent data on such travel patterns can however be obtained from TATIS
2019. It contains information on sources and destinations of journeys, though its findings
come with the caveat that it combines statistics for Midlothian with East and West
Lothian too. Its travel diary data shows that the portion of journeys originating in the
Lothians and ending in Edinburgh has fallen slightly in the years leading up to 2019.14 Midlothian Employment Land Audit 2021
While this does not exactly match the findings of the 2001 and 2011 Censuses, when
considered alongside them it suggests a relatively static picture of commuting patterns
from Midlothian to Edinburgh over at least the last decade.
7.8
46.7
45.5
Edinburgh
Midlothian (includes those who mainly work at home)
Rest of Scotland, UK and overseas/offshore
Figure 1 – Where people who live in Midlothian work (2001, %). Source: 2001 Census.
10.1
47.5
42.4
Edinburgh
Midlothian (includes those mainly working at home)
Rest of Scotland, UK and overseas/offshore
Figure 2 – Where people who live in Midlothian work (2011, %). Source: 2011 Census.
4.2.5 Figures 3 and 4 meanwhile show a large increase in the share of Midlothian’s jobs
occupied by people from outside the area. This may reflect a positive story of Midlothian
residents becoming more skilled and the Midlothian economy containing more higher-15 Midlothian Employment Land Audit 2021
skilled jobs: higher-skilled workers generally travel further to work. Nearly 60% of jobs
in Midlothian in 2011 were taken by Midlothian residents; a fall from nearly 70% in 2001.
4.2.6 Census data shows that the portion of employees who work in Midlothian but that
live in Edinburgh increased from 16.4% to 19.5% from 2001 to 2011. It may be that this
increase has since stalled though, as TATIS travel diary data has found that the portion
of journeys to the Lothians (including Midlothian) that originate in Edinburgh has fallen
over the last decade.
14.6 16.4
69.0
Edinburgh
Midlothian (includes those who mainly work at home)
Rest of Scotland/ UK
Figure 3 – Where people who work in Midlothian live (2001, %). Source: 2001 Census.
22.2 19.5
58.3
Edinburgh
Midlothian (includes those mainly working at home)
Rest of Scotland/UK
Figure 4 – Where people who work in Midlothian live (2011, %). Source: 2011 Census.16 Midlothian Employment Land Audit 2021
5 – Employment Land Supply Summary
5.1 – Supply Breakdown
5.1.1 There are a number of ways that the employment land supply can be used to
assess whether it is meeting the needs of Midlothian’s employers and developers. This
section of the ELA disaggregates the supply into different categories to provide
information to such users of the audit. This approach also allows an assessment of
whether the Council is fulfilling its obligations to support business and employment land
uses as specified in Scottish Planning Policy. It refers to the need for the planning system
to ‘[meet] the diverse needs of the different sectors and sizes of business which are
important to the plan area’. Taking this into account, section 5 breaks down the overall
supply in terms of factors such as site locations and appropriate use classes.
5.1.2 The employment land situation in Midlothian can be categorised as follows:
Immediately available land: 18 sites with a combined total of 134ha of gross
vacant land;
Land with minor constraints: 19 sites with a combined total of 152ha of gross
vacant land;
Land with major constraints: 7 sites with a combined total of 52ha of gross
vacant land; and
Fully occupied sites: 5 locations with a gross site area of 25ha.
5.1.3 In accordance with directions from Scottish Planning Policy, Midlothian’s
employment land supply consists of a range of sites in respect of providing for
business/office (class 4), general industry (class 5) and storage and distribution (class 6)
uses. This is shown in table 5. Although it may appear as if there are few locations
allocated for storage and distribution uses, it should be borne in mind that these are
large sites that are relatively free of constraints. Locations that comprise the ‘other’
category below include the film studio site at Loanhead but are predominantly those
allocated at the MSZ. This is a place that is of special importance for biotechnology and
research & development purposes and so is distinguished from class 4, 5 and 6 sites both
below and in the detailed spreadsheet in section 5.3.
Table 5 – Employment land supply breakdown by land use class.
Suitable Land Number Gross Site Gross Vacant
Use Class of Sites Area (ha) Land (ha)
Class 4 37 452.41 260.95
Class 5 29 360.93 183.35
Class 6 3 93.03 59.61
Other (all) 13 266.58 155.87
Other (MSZ only) 10 121.94 53.04
Note: the total number of sites and their combined area do not equal the figures from elsewhere in
this document because sites are typically allocated for more than one land use class.17 Midlothian Employment Land Audit 2021
5.1.4 SPP specifically refers to meeting the needs of different sizes of businesses, and
the land supply in Midlothian caters sufficiently well for different scales of employer
(table 6). There is also further flexibility in the supply owing to the fact that smaller
plots are available at larger sites, for example as is currently advertised at site e32
(Sheriffhall South, near Dalkeith).
Table 6 – Employment land supply breakdown by site size.
Site Size Number of Sites Gross Site Area (ha)
< 2 ha 8 11.62
2 – 5 ha 8 29.20
5.1 – 10 ha 15 112.10
> 10 ha 18 446.93
Totals 49 599.85
5.2 – Land Supply Summary by Settlement
5.2.1 The previous section provided an overview of the employment land supply in
Midlothian as a whole. This component supplements that by providing a breakdown
across Midlothian’s various settlements. At this level, it can be seen that there is a range
of vacant sites across the county (table 7). Similar observations can be made regarding
the provision of land that is already available for development or that which could
become marketable in the short to medium term (table 8). In contrast, a smaller
component of economic land in Midlothian is subject to major constraints and in these
cases alternative, more readily available sites can be found within or in close proximity
to the same settlement. The exception is Newtongrange, where nearly all the available
land has major constraints. This, however, is due to the Stobhill Road and Lady Victoria
sites being included in the redevelopment masterplan for the area, which will see the
re-allocation of some land for business and industrial uses in future.18 Midlothian Employment Land Audit 2021
Table 7 – Employment land supply breakdown by settlement.
Number Gross Site Gross Vacant
Settlement
of Sites Area (ha) Land (ha)
Bonnyrigg* 4 20.57 6.68
Dalkeith* 8 75.01 56.16
Easthouses 1 1.83 0.03
Gorebridge 1 9.76 9.76
Loanhead* 10 152.33 89.70
Mayfield 1 23.81 3.11
Newtongrange 3 25.79 7.67
Penicuik 2 6.99 0.13
MSZ 11 124.70 53.16
Rosewell 1 1.83 1.31
Roslin 2 10.29 10.29
Shawfair/Danderhall 5 146.94 99.69
Totals 49 599.85 337.69
Note: * indicates that this settlement’s figures include both committed/allocated sites and also
other economic sites with planning support.
Table 8 – Employment land supply breakdown by settlement and availability.
Gross Gross Vacant Gross Vacant
Immediately Land with Land with
Number
Settlement Available Minor Major
of Sites
Vacant Land Constraints Constraints
(ha) (ha) (ha)
Bonnyrigg* 4 4.92 1.49 0.27
Dalkeith* 8 17.69 21.57 16.90
Easthouses 1 0.03 0.00 0.00
Gorebridge 1 0.00 9.76 0.00
Loanhead* 10 20.38 45.65 23.67
Mayfield 1 0.00 3.11 0.00
Newtongrange 3 0.35 0.00 7.32
Penicuik 2 0.00 0.13 0.00
MSZ 11 28.12 22.74 2.30
Rosewell 1 1.31 0.00 0.00
Roslin 2 0.00 10.29 0.00
Shawfair/Danderhall 5 60.98 37.32 1.39
Totals 49 133.78 152.06 51.85
Note: * indicates that this settlement’s figures include both committed/allocated sites and also other
economic sites with planning support. Settlements may also have sites that are fully occupied (and
such cases are not counted in the figures above).19 Midlothian Employment Land Audit 2021
5.3 - ELA Data Spreadsheet
5.3.1 The data in sections 5.1 and 5.2 above is a summation of the more detailed site-
specific information contained within the ELA spreadsheet on the following pages. It is
structured into two parts. The first consists of committed/allocated economic sites
which is split alphabetically by settlement across two pages: one for Bonnyrigg to
Loanhead and the other for Mayfield to Shawfair/Danderhall.
5.3.2 The third page of the spreadsheet lists other economic sites with planning
support but mainly focuses on those at the MSZ. It is primarily dedicated towards
bioscience research and development and the health of the sector there is locally,
strategically, nationally and internationally important. It is therefore a priority of the
MLDP to protect and promote growth there and those with further interest in the MSZ
are directed towards the plan (particularly page 23) and the Bush Framework Masterplan
for more information (see Appendix 2 for a link).
5.3.3 Within the following spreadsheets, sites are listed from left to right in order of
size (by gross site area). Footnotes are provided beneath to clarify the ratings used for
various criteria. Readers are encouraged to view the information in the spreadsheets
alongside these notes. The spreadsheets also include a measure of the area of net vacant
land, to provide an indication of the amount of land available after enabling
infrastructure and landscaping is taken into account. Net vacant land is calculated as
80% of the gross vacant land figure.Settlement Bonnyrigg Dalkeith Easthouses Gorebridge Loanhead
Sherwood Whitehill Business Thornybank Hardengreen Salter's Park Easthouses Edgefield Pentland
Site Name Hopefield Grannies Park Salter's Park Sheriffhall South Redheugh Straiton Engine Road Ashgrove Ashgrove North Bilston Glen West Straiton
Industrial Estate Centre Industrial Estate Industrial Estate Extension Industrial Estate Industrial Estate Industrial Estate
Grid Reference NT 31015 63861 NT 31378 65040 NT 35092 66729 NT 33049 67531 NT 34621 67514 NT 32478 66003 NT 35002 68428 NT 34742 68580 NT 31677 67510 NT 34656 65829 NT 33326 62885 NT 27426 66187 NT 28351 65737 NT 28239 66500 NT 28191 66235 NT 27031 65436 NT 27789 66702 NT 27086 65089 NT 26738 66280
Greenfield/Brownfield (G/B) G B B B B Mixed G G G B G G B G B B G B Mixed
Geographical
Information Gross Site Area (ha) 4.92 7.86 0.64 1.91 3.96 9.05 16.90 17.79 18.37 1.83 9.76 1.94 3.47 5.71 7.97 11.02 15.72 26.41 51.44
Gross Vacant Land (ha) 4.92 1.49 0.64 0.83 0.00 1.40 16.90 17.79 16.29 0.03 9.76 1.23 0.00 5.32 0.36 0.29 14.40 0.37 42.66
Net Vacant Land (ha) 3.94 1.19 0.51 0.66 0.00 1.12 13.52 14.23 13.03 0.02 7.81 0.98 0.00 4.26 0.29 0.23 11.52 0.30 34.13
MLDP MLDP Site Reference e16 e15 e12 e13 e10 e11 Ec2 e14 e32 e18 e22 e7 e6 e33 e5 e4 Ec4 e3 Ec3
Considerations Development Statement (MLDP Page) 99 N/A N/A N/A N/A 93 93 93 93 N/A 118 N/A N/A 129 N/A N/A 130 N/A 130 & 132
Class 4 - Business/Office -
Suitable Land Class 5 - General Industrial - - - - - - -
Use Class(es) Class 6 - Storage & Distribution - - - - - - - - - - - - - - - - -
1
Other - - - - - - - - - - - - - - - - - -
Neighbouring Land Use Classes 9 9 9 9 1, 3, 9 9, 10 10 9, 10 1, 3, 4, 7, 11 9 1, 5, 9, 10 1, 9 1, 5, 9, 10 4, 5, 9 5, 9, 10 1, 4, 5, 9 1, 3, 6, 9 4, 5, 9 1, 9
EE 90% 98% 100% 96% 100% 93% 79% 81% 84% 84% 88% 82% 100% 96% 88% 96% 93% 98% 93%
Mobile Phone O2 100% 98% 100% 100% 100% 100% 100% 100% 100% 100% 100% 100% 100% 100% 100% 97% 96% 100% 100%
Coverage2, 3 Vodafone 100% 98% 100% 100% 100% 100% 100% 94% 100% 100% 100% 100% 100% 100% 100% 100% 96% 100% 100%
Three 83% 93% 83% 100% 100% 87% 79% 83% 94% 100% 97% 78% 100% 89% 83% 73% 94% 81% 91%
4
Standard Speed (Mbps) 2.3 5.8 2.3 7.8 4.5 9.0 17.5 14.3 11.0 1.9 10.3 6.8 8.5 10.7 3.4 7.4 12.0 8.1 8.7
Broadband Standard Availability5 Good Good Good Good Good Average Good Good Good Good Good Good Good Good Good Good Good Good Good
Coverage Superfast Speed (Mbps)6 50.0 49.7 26.5 50.0 - 46.0 50.0 48.0 30.0 50.0 50.0 50.0 50.0 50.0 50.0 48.8 50.0 47.8 31.8
Superfast Availability5 Good Good Good Good None Good Average Average Average Good Average Good Average Average Good Good Average Good Good
7
Active Travel Opportunities 75% 51% 37% 31% 66% 85% 35% 35% 58% 52% 34% 58% 45% 69% 69% 45% 75% 58% 29%
8
Roads & Access
Topography & Ground Conditions9
Constraints 10
Bus Service Quality 56% 78% 44% 89% 89% 89% 56% 56% 100% 100% 56% 89% 78% 44% 56% 89% 44% 56% 89%
11
Utilities
12
Ownership -
Fully Occupied - - - - - - - - - - - - - - - - -
Availability
Immediately Available - - - - - - - - - - -
Constrained (Minor) - - - - - - - - - - -
Constrained (Major) - - - - - - - - - - - - - - - - - -
1 Suitable uses: these are mainly knowledge-based industry & related manufacturing, research & development or biotechnology uses. See the MLDP for full details of sites with ticks against the 'other' category for their suitable use classes, particularly for sites Ec3, Mx1 and e25.
2 All other mobile phone providers use the infrastructure of these four networks.
3 Mobile phone coverage ratings are expressed as a percentage with higher numbers meaning better coverage. Cells are colour-coded from red (poor coverage) to green (excellent coverage) to assist in visually comparing signal quality across sites. Scores refer to a combination of both 4G and non-4G mobile technology.
4 Cells are colour-coded according to speed from red (slow) to green (fast). The maximum standard broadband speed for a site is 17.5Mbps.
5 Availability of both standard and superfast broadband is rated as either 'good', 'average' or 'none'.
6 Cells are colour-coded according to speed from red (slow) to green (fast). The maximum superfast broadband speed for a site is 50Mbps.
7 Scores are expressed as a percentage with higher numbers meaning more active travel opportunities. Cells are also colour-coded from red (few opportunities) to green (many opportunities).
8 Sites are rated either green, amber or red depending on their proximity to A and B roads, trunk roads and ease of site access.
9 Green (flat site, no known ground condition issues), amber (moderate gradient on parts or all of the site, possible ground condition issues), red (steep slope on some or much of the site, known ground condition issues).
10 Bus service ratings are scored as a percentage with higher numbers meaning better service. Cells are also colour-coded from red (poor) service to green (good service) to assist in visually comparing service quality across sites.
11 Rated on a scale of green, yellow, amber or red depending on the availability of services, proximity of possible connection points and existing on-site infrastructure potentially influencing development layout or requiring relocation.Settlement Mayfield Newtongrange Penicuik Rosewell Roslin Shawfair/Danderhall
Mayfield Lady Victoria Butlerfield Eastfield Farm Rd. Eastfield Shawfair Park Millerhill /
Site Name Stobhill Road Gorton Road Oatslie Expansion Oatslie Hunter's Yard Whitehill Mains Shawfair Park
Industrial Estate Business Centre Industrial Estate Industrial Estate Industrial Estate Extension Monktonhall
Grid Reference NT 34244 64268 NT 33327 63444 NT 33686 63312 NT 33097 63627 NT 23777 61081 NT 23889 60889 NT 28532 62812 NT 26242 63156 NT 26047 63241 NT 30516 70277 NT 31719 71354 NT 31730 68406 NT 31446 68778 NT 32408 70388
Greenfield/Brownfield (G/B) B B Mixed B B B G G G B G G G B
Geographical
Information Gross Site Area (ha) 23.81 8.39 8.69 8.71 0.60 6.39 1.83 4.67 5.62 1.39 18.72 20.57 36.73 69.53
Gross Vacant Land (ha) 3.11 1.46 5.86 0.35 0.00 0.13 1.31 4.67 5.62 1.39 18.52 18.80 24.48 36.50
Net Vacant Land (ha) 2.49 1.17 4.69 0.28 0.00 0.10 1.05 3.74 4.50 1.11 14.82 15.04 19.58 29.20
MLDP MLDP Site Reference e17 e20 e21 e19 e2 e1 e24 Ec5 e34 e28 e26 Ec1 e27 e25
Considerations Development Statement (MLDP Page) N/A N/A 111 N/A N/A N/A 123 145 144 84 84 87 85 84 & 161
Class 4 - Business/Office
Suitable Land Class 5 - General Industrial -
Use Class(es) Class 6 - Storage & Distribution - - - - - - - - - - - - -
Other1 - - - - - - - - - - - - -
Neighbouring Land Use Classes 2, 9 1, 3, 4, 5, 6, 9, 10 3, 4, 5, 6, 9 2, 4, 5, 9, 10 3, 9, SG 1, 2, 3, 5, 9, 10 9 9 9 6 1, 6 3, 9 1, 2, 3, 9 9
EE 100% 81% 83% 85% 100% 96% 83% 88% 88% 88% 100% 78% 83% 80%
Mobile Phone O2 100% 96% 100% 100% 100% 100% 100% 83% 83% 100% 100% 78% 83% 83%
Coverage2, 3 Vodafone 100% 96% 100% 100% 88% 98% 100% 100% 100% 100% 100% 78% 83% 83%
Three 100% 90% 92% 83% 100% 96% 73% 83% 83% 83% 92% 60% 74% 73%
4
Standard Speed (Mbps) 17.0 12.3 9.0 6.1 8.5 9.5 0.6 14.5 14.5 1.2 3.6 6.0 3.9 6.7
Broadband Standard Availability5 Average Average Average Good Good Good Good Good Good Good Average Good Good Good
Coverage Superfast Speed (Mbps)
6
49.3 50.0 38.5 46.8 50.0 50.0 49.8 - - 28.0 40.5 - 33.5 -
Superfast Availability5 Good Average Good Good Good Good Good None None Good Average None Average None
7
Active Travel Opportunities 49% 45% 20% 45% 35% 43% 54% 43% 43% 29% 28% 45% 74% 26%
8
Roads & Access
Constraints Topography & Ground Conditions9
10
Bus Service Quality 56% 89% 100% 67% 100% 78% 33% 78% 89% 67% 67% 89% 89% 0%
Utilities11
12
Ownership - - - - -
Fully Occupied - - - - - - - - - - - - -
Availability
Immediately Available - - - - - - - - - -
Constrained (Minor) - - - - - - - -
Constrained (Major) - - - - - - - - - - -
1 Suitable uses: these are mainly knowledge-based industry & related manufacturing, research & development or biotechnology uses. See the MLDP for full details of sites with ticks against the 'other' category for their suitable use classes, particularly for sites Ec3, Mx1 and e25.
2 All other mobile phone providers use the infrastructure of these four networks.
3 Mobile phone coverage ratings are expressed as a percentage with higher numbers meaning better coverage. Cells are colour-coded from red (poor coverage) to green (excellent coverage) to assist in visually comparing signal quality across sites. Scores refer to a combination of both 4G and non-4G mobile technology.
4 Cells are colour-coded according to speed from red (slow) to green (fast). The maximum standard broadband speed for a site is 17.5Mbps.
5 Availability of both standard and superfast broadband is rated as either 'good', 'average' or 'none'.
6 Cells are colour-coded according to speed from red (slow) to green (fast). The maximum superfast broadband speed for a site is 50Mbps.
7 Scores are expressed as a percentage with higher numbers meaning more active travel opportunities. Cells are also colour-coded from red (few opportunities) to green (many opportunities).
8 Sites are rated either green, amber or red depending on their proximity to A and B roads, trunk roads and ease of site access.
9 Green (flat site, no known ground condition issues), amber (moderate gradient on parts or all of the site, possible ground condition issues), red (steep slope on some or much of the site, known ground condition issues).
10 Bus service ratings are scored as a percentage with higher numbers meaning better service. Cells are also colour-coded from red (poor) service to green (good service) to assist in visually comparing service quality across sites.
11 Rated on a scale of green, yellow, amber or red depending on the availability of services, proximity of possible connection points and existing on-site infrastructure potentially influencing development layout or requiring relocation.Settlement Other Economic Sites With Planning Support Midlothian Science Zone
Dalhousie Newbattle Abbey Pentland Studios Gowkley Moss Technopole North Midlothian Pentland Science Gowkley Moss Edinburgh
Site Name Polton House Eldin Easter Bush South Easter Bush North Easter Bush New Milton Gowkley Moss
Business Park Annex (South) South West Innovation Centre Park North Technopole
Grid Reference NT 29870 65162 NT 28414 66644 NT 31921 63733 NT 33380 66285 NT 26366 65805 NT 25675 63444 NT 24328 63741 NT 25351 64469 NT 25406 63871 NT 25375 64302 NT 25258 64052 NT 25177 62871 NT 25309 63184 NT 25719 64020 NT 25593 63651 NT 24847 63453
Greenfield/Brownfield (G/B) B B B B G G G B G G Mixed G Mixed G Mixed Mixed
Geographical
Information Gross Site Area (ha) 1.48 4.98 6.31 6.39 23.67 2.14 2.30 2.76 5.83 6.39 9.03 10.12 10.20 10.48 15.43 50.02
Gross Vacant Land (ha) 0.27 1.40 0.00 2.31 23.67 2.14 2.30 0.12 2.73 5.59 7.23 10.12 0.00 10.48 4.81 7.64
Net Vacant Land (ha) 0.22 1.12 0.00 1.85 18.94 1.71 1.84 0.10 2.18 4.47 5.78 8.10 0.00 8.38 3.85 6.11
MLDP MLDP Site Reference e30 e31 e29 None Mx1 b8 Bt3 b4 Bt2 Bt1 b6 b9 b1 b7 b3 b2
Considerations Development Statement (MLDP Page) N/A N/A N/A N/A 130 & 132 137 139 N/A 138 138 136 137 N/A 137 N/A N/A
Class 4 - Business/Office - - - - - - - - - - -
Suitable Land Class 5 - General Industrial - - - - - - - - - - - -
Use Class(es) Class 6 - Storage & Distribution - - - - - - - - - - - - - - - -
-
1
Other - - - -
Neighbouring Land Use Classes 9 4, 5 - 9, 10 5, 9 3, 4, 9 4, 5 10 4 4, 9 4 4, 9 4 4, 9 4 4
EE 100% 94% 92% 79% 97% 79% 79% 88% 94% 88% 88% 78% 79% 100% 86% 78%
Mobile Phone O2 100% 100% 83% 100% 100% 100% 92% 100% 100% 100% 100% 93% 83% 100% 94% 88%
2, 3
Coverage Vodafone 100% 100% 100% 100% 100% 100% 94% 100% 100% 100% 100% 100% 100% 100% 100% 94%
Three 100% 94% 92% 83% 80% 79% 81% 79% 81% 79% 79% 84% 79% 88% 82% 77%
Standard Speed (Mbps)4 1.2 5.7 15.5 15.5 10.5 7.5 3.6 16.5 10.5 16.5 16.5 10.9 8.5 4.5 6.8 5.1
Broadband Standard Availability5 Good Good Good Good Good Good Good Good Good Good Good Good Good Good Good Good
Coverage Superfast Speed (Mbps)6 50.0 50.0 25.5 50.0 42.8 - - 50.0 50.0 50.0 50.0 31.3 42.0 - 42.0 42.0
Superfast Availability5 Good Average Average Average Average None None Average Average Average Average Average Average None Average Average
7
Active Travel Opportunities 25% 45% 9% 46% 14% 40% 25% 54% 25% 54% 54% 51% 60% 69% 69% 29%
8
Roads & Access
Topography & Ground Conditions9
Constraints 10
Bus Service Quality 78% 44% 33% 11% 89% 100% 56% 89% 67% 78% 67% 56% 78% 89% 89% 67%
11
Utilities
12
Ownership - - - - - -
Fully Occupied - - - - - - - - - - - - - -
Availability
Immediately Available - - - - - - - - - -
Constrained (Minor) - - - - - - - - - - -
Constrained (Major) - - - - - - - - - - - - -
1 Suitable uses: these are mainly knowledge-based industry & related manufacturing, research & development or biotechnology uses. See the MLDP for full details of sites with ticks against the 'other' category for their suitable use classes, particularly for sites Ec3, Mx1 and e25.
2 All other mobile phone providers use the infrastructure of these four networks.
3 Mobile phone coverage ratings are expressed as a percentage with higher numbers meaning better coverage. Cells are colour-coded from red (poor coverage) to green (excellent coverage) to assist in visually comparing signal quality across sites. Scores refer to a combination of both 4G and non-4G mobile technology.
4 Cells are colour-coded according to speed from red (slow) to green (fast). The maximum standard broadband speed for a site is 17.5Mbps.
5 Availability of both standard and superfast broadband is rated as either 'good', 'average' or 'none'.
6 Cells are colour-coded according to speed from red (slow) to green (fast). The maximum superfast broadband speed for a site is 50Mbps.
7 Scores are expressed as a percentage with higher numbers meaning more active travel opportunities. Cells are also colour-coded from red (few opportunities) to green (many opportunities).
8 Sites are rated either green, amber or red depending on their proximity to A and B roads, trunk roads and ease of site access.
9 Green (flat site, no known ground condition issues), amber (moderate gradient on parts or all of the site, possible ground condition issues), red (steep slope on some or much of the site, known ground condition issues).
10 Bus service ratings are scored as a percentage with higher numbers meaning better service. Cells are also colour-coded from red (poor) service to green (good service) to assist in visually comparing service quality across sites.
11 Rated on a scale of green, yellow, amber or red depending on the availability of services, proximity of possible connection points and existing on-site infrastructure potentially influencing development layout or requiring relocation.23 Midlothian Employment Land Audit 2021
5.4 - Supply Updates Since the Last ELA Publication
5.4.1 Midlothian Council’s previous ELA was published in March 2020. This section summarises changes that have taken place across
the various sites that comprise the land supply since then. This begins with table 9, which summarises applications which have been
consented over this period and whether they will contribute to future take-up or lead to losses in the employment land supply, if
constructed. Measuring take-up as land removed from the supply due to work starting on site, there has been 0.59ha of take-up since
the publication of the last audit. There has also been 0.39ha of losses (due to a SUDS pond being constructed on site Bt2 – Easter Bush
South).
5.4.2 Two further tables follow the summary below of newly-consented applications: table 10 lists applications which have been
refused, withdrawn or have expired since the last ELA while table 11 shows applications which are currently pending for sites in the
employment land supply as of March 2021. It is also worth noting that in late 2020 details of a pre-application consultation for a
development partially on site Ec3, West Straiton, were submitted to the Council (reference 20/00803/PAC). This proposes a mixed use
development including business and employment uses (class 4,5 and 6), residential, hotel, residential institutions, and ancillary uses
including retail, financial and professional services, food and drink, non-residential institutions, assembly and leisure and other
infrastructure including a park and ride. It covers most of the north of site Ec3, together with unallocated adjacent land.
Table 9 – Consented planning applications for employment land sites since the last ELA (March 2020).
Area of
Site Name (& Application Land Take-Up
Proposal Description of Proposal
Reference) Reference(s) or Loss?
(ha)
Hardengreen Industrial
20/00443/DPP 0.04 Change of use from industrial unit (class 5) to judo studio (class 11). N/A
Estate (e11)
Edgefield Industrial Partial change of use from storage and distribution (class 6) to allow
20/00083/DPP 0.40 N/A
Estate (e5) use of part of the building for general industry (class 5).
19/00997/DPP Erection of an ancillary storage building and formation of concrete
Edgefield Industrial
& 0.03 plinth and raised platform for car parking. Both applications are for Take-up
Estate (e5)
20/00068/DPP the same property.
Pentland Industrial
20/00218/DPP 0.10 Alterations to an existing industrial unit. N/A
Estate (e4)You can also read