Genome-wide analysis of H3.3 dissociation reveals high nucleosome turnover at distal regulatory regions of embryonic stem cells
←
→
Page content transcription
If your browser does not render page correctly, please read the page content below
Ha et al. Epigenetics & Chromatin 2014, 7:38
http://www.epigeneticsandchromatin.com/content/7/1/38

 RESEARCH                                                                                                                                         Open Access

Genome-wide analysis of H3.3 dissociation reveals
high nucleosome turnover at distal regulatory
regions of embryonic stem cells
Misook Ha1*†, Daniel C Kraushaar2† and Keji Zhao2

  Abstract
  Background: The histone variant H3.3 plays a critical role in maintaining the pluripotency of embryonic stem cells
  (ESCs) by regulating gene expression programs important for lineage specification. H3.3 is deposited by various
  chaperones at regulatory sites, gene bodies, and certain heterochromatic sites such as telomeres and centromeres.
  Using Tet-inhibited expression of epitope-tagged H3.3 combined with ChIP-Seq we undertook genome-wide
  measurements of H3.3 dissociation rates across the ESC genome and examined the relationship between
  H3.3-nucleosome turnover and ESC-specific transcription factors, chromatin modifiers, and epigenetic marks.
  Results: Our comprehensive analysis of H3.3 dissociation rates revealed distinct H3.3 dissociation dynamics at
  various functional chromatin domains. At transcription start sites, H3.3 dissociates rapidly with the highest rate
  at nucleosome-depleted regions (NDRs) just upstream of Pol II binding, followed by low H3.3 dissociation rates
  across gene bodies. H3.3 turnover at transcription start sites, gene bodies, and transcription end sites was positively
  correlated with transcriptional activity.
  H3.3 is found decorated with various histone modifications that regulate transcription and maintain chromatin
  integrity. We find greatly varying H3.3 dissociation rates across various histone modification domains: high dissociation
  rates at active histone marks and low dissociation rates at heterochromatic marks. Well- defined zones of high
  H3.3-nucleosome turnover were detected at binding sites of ESC-specific pluripotency factors and chromatin remodelers,
  suggesting an important role for H3.3 in facilitating protein binding. Among transcription factor binding sites we
  detected higher H3.3 turnover at distal cis-acting sites compared to proximal genic transcription factor binding sites.
  Our results imply that fast H3.3 dissociation is a hallmark of interactions between DNA and transcriptional regulators.
  Conclusion: Our study demonstrates that H3.3 turnover and nucleosome stability vary greatly across the chromatin
  landscape of embryonic stem cells. The presence of high H3.3 turnover at RNA Pol II binding sites at extragenic regions
  as well as at transcription start and end sites of genes, suggests a specific role for H3.3 in transcriptional initiation and
  termination. On the other hand, the presence of well-defined zones of high H3.3 dissociation at transcription factor
  and chromatin remodeler binding sites point to a broader role in facilitating accessibility.
  Keywords: Histone variant, H3.3 dissociation, Nucleosome stability, Genome-wide chromatin dynamics

* Correspondence: misook.ha@gmail.com
†
 Equal contributors
1
 Samsung Advanced Institute of Technology, Samsung Electronics
Corporation, Yongin-Si 446-712, Gyeonggi-Do, South Korea
Full list of author information is available at the end of the article

                                           © 2014 Ha et al.; licensee BioMed Central. This is an Open Access article distributed under the terms of the Creative Commons
                                           Attribution License (http://creativecommons.org/licenses/by/4.0), which permits unrestricted use, distribution, and
                                           reproduction in any medium, provided the original work is properly credited. The Creative Commons Public Domain
                                           Dedication waiver (http://creativecommons.org/publicdomain/zero/1.0/) applies to the data made available in this article,
                                           unless otherwise stated.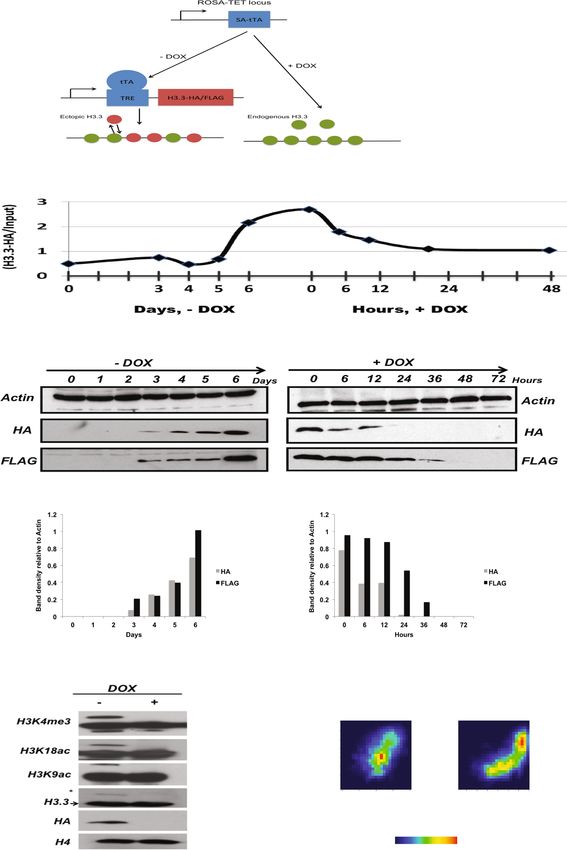
Ha et al. Epigenetics & Chromatin 2014, 7:38                                                                   Page 2 of 14
http://www.epigeneticsandchromatin.com/content/7/1/38

Background                                                    chromatin configuration with a large number of bivalent
In eukaryotes, genomic DNA is packaged as chromatin,          genes that are marked by both active and repressive
a complex of DNA, proteins, and RNAs. The basic unit of       marks, which resolve upon lineage commitment [14-16].
chromatin is the nucleosome, which consists of 147 bp         Unlike in differentiated mammalian cells, where the pat-
DNA wrapped around histone proteins. Incorporation of         tern of H3.3 enrichment is associated primarily with gene
histone variants into chromatin critically influences the     activity, H3.3 is detected at numerous promoters of in-
properties of nucleosomes that play important roles in        active genes in ESCs underlining once more the unique
regulating transcription and epigenetic memory. Among         chromatin state of ESCs [1]. Furthermore the ESC chro-
three major histone H3 variants, H3.1, H3.2, and H3.3,        matin displays a hyper-dynamic state in which chromatin
H3.3 marks important DNase I hypersensitive cis-regula-       components including histones and even heterochromatic
tory elements including promoters, enhancers, and insula-     proteins exhibit rapid exchange compared to differenti-
tors [1-4]. Different from canonical histone H3, which is     ated somatic cells [17]. Hence understanding the histone
expressed in S-phase and is incorporated into chromatin       dynamics of ESCs not only on a global but also a genome-
during DNA replication, H3.3 can be incorporated into         wide scale is of utmost interest.
chromatin independent of DNA replication [3,5]. The              Genome-wide histone turnover has traditionally been
incorporation of histone variants is tightly regulated by     studied using inducible expression systems that include
histone chaperones. The H3.3-specific chaperones Atrx-        epitope-tagged histones or, alternatively, metabolically
Daxx and HIRA deposit H3.3 primarily at telomeres and         labeled histones that are immuno-precipitated by ChIP
non-heterochromatic regions, respectively [1,6,7].            and subsequently subjected to deep sequencing techniques.
   H3.3 plays important regulatory roles in both transcrip-   TET-inducible histone expression combined with ChIP-Seq
tional activation and repression. Upon gene activation,       typically result in initial increases, followed by decreases
H3.3 is incorporated into transcription start sites (TSSs)    in read density over many genomic regions due to read
and coding regions of genes, where it continues to be         coverage limitations [13,18,19]. Therefore, calculations of
deposited even when transcription ceases [8,9].               turnover with linear regression models are inevitably diffi-
   Histone marks that are associated with gene activation,    cult to perform when induction systems are utilized.
such as acetylation marks and H3K4me3, are typically             In this study, we set out to examine histone dynamics
found on H3.3 whereas marks associated with gene              by measuring the dissociation rates of previously incorpo-
silencing such as H3K27me3 and H3K9me3 are predom-            rated histones. To this end, we generated a Tet-OFF ESC
inantly found on H3.1 and H3.2 [10]. The precise mech-        line that expresses HA/FLAG-tagged H3.3 and allowed us
anism by which H3.3 promotes gene activation is not           to track the dissociation of H3.3 upon TET-induced inhib-
known but may involve the destabilization of the nucleo-      ition of H3.3 expression. Using an analytical approach that
some particle upon incorporation [2,11]. On the other         quantifies the dissociation rates of H3.3 in high resolution,
hand, H3.3 facilitates the recruitment of Polycomb pro-       we find that the H3.3 dissociation rate from chromatin
teins in ESCs and establishment of H3K27me3 domains           varies distinctly across the ESC genome.
that are associated with gene silencing [11]. Moreover,          Our analyses identified distinct dynamics of H3.3 as
H3.3 is required for heterochromatin formation at peri-       they relate to transcriptional regulation and heterochro-
centromeric regions and telomeres in mouse embryonic          matin integrity. Transcription initiation and end sites are
stem cells [7,12].                                            marked by very high dissociation rates of H3.3, that cor-
   Histone and nucleosome turnover have been studied          relate well with gene activity. In contrast, inside coding
extensively in yeast, where a single histone variant H3.3     regions H3.3 equilibrium levels are low and display low
is expressed. More recently, we reported genome-wide          turnover. H3.3 dissociation rates were found to differ
histone H3.3 turnover in mouse embryonic fibroblasts          greatly depending on post-translational modifications
and showed that the dynamics of histone turnover              with higher dissociation rates associated with active
appear to be largely conserved among eukaryotes [13].         marks and lower rates at heterochromatic marks. On the
Our results revealed three major categories of H3.3           other hand, binding sites of pluripotency factors and
nucleosome turnover: rapid turnover at enhancers and          chromatin remodelers were marked by invariably high
promoters, intermediate turnover at gene bodies, and          turnover rates. Surprisingly, we found that distant-acting
slow turnover at heterochromatic regions. However, the        regulatory sites are dynamically regulated by higher rates
H3.3 turnover was inferred from the incorporation rate        of H3.3 dissociation than we found at proximal regulatory
of newly synthesized H3.3 and the dissociation of H3.3        sites. Therefore we conclude that distinct H3.3 turnover
from chromatin has not been directly observed.                rates provide a molecular mechanism to accommodate
   Embryonic stem cells (ESCs) are characterized by their     chromatin architecture, transcription as well as accessibil-
pluripotent differentiation capacity that is manifested       ity of ESC specific transcription factors and chromatin
by a unique chromatin structure. ESCs carry an open           remodelers.
Ha et al. Epigenetics & Chromatin 2014, 7:38                                                                      Page 3 of 14
http://www.epigeneticsandchromatin.com/content/7/1/38

Results                                                          Measurements of dissociation rates were highly repro-
Genome-wide measurement of H3.3 dissociation rates             ducible between replicate experiments at high resolution
with a ‘TET-OFF’ ESC line                                      (10 bp) (Pearson’s correlation coefficient (PCC) = 0.712, P
To measure dissociation rates of H3.3, we utilized a           value = 0, df = 6836487) (Figure 1E). We further examined
TET-repressible ESC line, ES(MC1R(20)), with the ex-           the overall relationship between H3.3 dissociation rates
pression cassette integrated at the ROSA26 locus [20].         and equilibrium enrichment levels. Among loci signifi-
We transfected MC1R ESCs with HA/FLAG-tagged                   cantly enriched with HA-H3.3, H3.3 dissociation rates
H3.3 controlled by tetracycline response elements. ESCs        were significantly correlated with equilibrium levels of
that were routinely cultured in the absence of DOX were        H3.3 (PCC, λout vs. λequil. = 0.61, P value = 0, df = 6836487)
exposed to DOX-containing medium in order to inhibit           (Figure 1F), suggesting that H3.3 deposition and high
HA-H3.3 expression and to measure H3.3 dissociation            nucleosome dissociation are intrinsically linked.
rates (λout) (Figure 1A). This ectopic expression system
was combined with ChIP-Seq to measure HA-H3.3 dis-             High H3.3 dissociation rates mark RNA Pol II bound sites
sociation from chromatin over time. The HA-H3.3 ESC            of transcription
line maintained high alkaline phosphatase activity and a       Next, we examined whether H3.3 dissociation rates are
dome-shaped colony morphology on both gelatin-coated           affected by gene transcription levels. Based on our RNA-
dishes and feeder cells, which was not affected by tagged      Seq data derived from undifferentiated HA-H3.3 ESCs,
H3.3 expression in the absence of DOX. In addition, ESC        we categorized genes according to their transcription levels.
clones formed alkaline phosphatase positive colonies from      At transcription start and end sites, H3.3 dissociation rates
single cells and were similar in size between cells that       and equilibrium levels were positively correlated with
expressed HA-H3.3 and those that did not, suggesting           transcription levels (Figure 2). These findings suggest that
that transgene expression did not interfere with ESC self-     the rapid dissociation of H3.3 is associated with efficient
renewal and proliferation (Additional file 1: Figure S1 A).    transcription initiation and termination. We detected
Furthermore, HA-H3.3 ESC maintained their pluripotent          significant albeit low enrichment of H3.3 at TSSs of silent
state as demonstrated by the high expression of the pluri-     genes. This suggests that once H3.3 is incorporated at
potency genes Oct4, Nanog and Sox2, which became               silenced genes, it is stably maintained and shows low
downregulated upon embryoid body (EB) differentiation          dissociation rates. At the TSS of actively transcribed
(Additional file 1: Figures S1 B and C). At the same time,     genes, H3.3 deposition is associated with high dissociation
markers of the endoderm and mesoderm lineages,                 rates and suggests that rapid H3.3 turnover facilitates the
Sox17 and Kdr, respectively, were robustly upregulated         transcription process.
during EB formation in the presence and absence of                Within coding regions, both H3.3 enrichment and dis-
DOX (Additional file 1: Figure S1 D).                          sociation rates are significantly correlated with transcription
   ESCs that had been routinely cultured in the presence       levels, which further supports the idea that both H3.3
of DOX displayed upregulation of HA-H3.3 over several          deposition and dissociation are a direct function of Pol
days following removal of DOX. ESC cultures that had           II- dependent transcription. However, the relative rate of
not been previously exposed to DOX, expressed steady-          dissociation was substantially lower within gene bodies as
state levels of HA-H3.3 (time point 0 h, λequ). Addition of    compared to TSSs and transcription end sites (TESs),
DOX resulted in the rapid downregulation of HA-H3.3            suggesting that distinct modes of H3.3 deposition and
after 6 h and HA-H3.3 levels continued to decline over a       eviction exist at coding regions and transcription start
time course of 48 h (Figures 1B and C). Immunoblotting         and end sites.
against H3.3 revealed that transgenic H3.3 was expressed          H3.3 equilibrium levels and dissociation rates were
at low levels compared to endogenous H3.3 and that             equal at exon-intron junctions relative to other regions
C-terminus HA and FLAG tags did not interfere with             within the coding region and therefore H3.3 exchange
posttranslational modification of H3.3 (Figure 1D).            may not be involved in splicing processes.
   To analyze H3.3-nucleosome dynamics at any given locus         Extragenic transcription by RNA Pol II generates vari-
we measured dissociation rates (λout) as the change of reads   ous types of short and long non-coding RNAs. Seventy
from time point 0 h to time point 6 h. We validated the        percent of non-coding RNAs are represented by short
ChIP-Seq read enrichment and decline of HA-H3.3 at two         enhancer-derived RNAs (eRNAs) that are transcribed in
control regions by ChIP-PCR. ChIP-Seq profiles revealed        both directions [21,22]. At genes, RNA Pol II generates
high enrichment of HA-H3.3 at the 3’UTR of Rps19 and           transcripts in one direction. On transcription initiation,
depletion of HA-H3.3 at an intergenic region on chromo-        Pol II-associated factors create a transcription bubble
some 8. ChIP-PCR experiments confirmed enrichment at           and the synthesis of 25 nt RNA facilitates the transition
Rps19, which declined over the time course of DOX              into a stable elongation complex [23]. To investigate the
addition (Additional file 2: Figure S2).                       relationship between RNA Pol II elongation and H3.3
Ha et al. Epigenetics & Chromatin 2014, 7:38            Page 4 of 14
http://www.epigeneticsandchromatin.com/content/7/1/38

 Figure 1 (See legend on next page.)
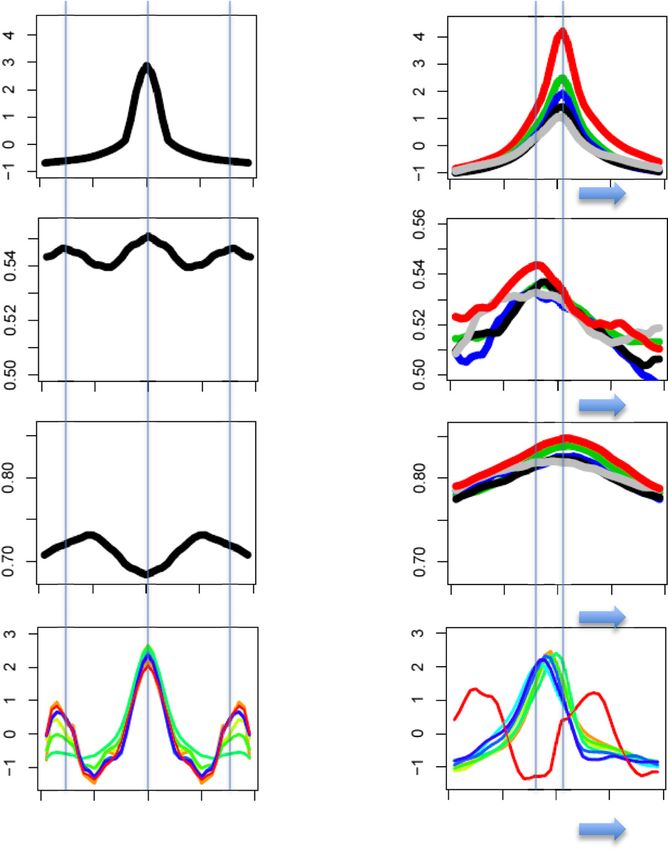
Ha et al. Epigenetics & Chromatin 2014, 7:38                                                                                                         Page 5 of 14
http://www.epigeneticsandchromatin.com/content/7/1/38

 (See figure on previous page.)
 Figure 1 Experimental design to measure genome-wide dissociation rates of newly synthesized H3.3-HA in mouse embryonic stem cells.
 (A) Schematic of TET-repressible HA-H3.3 expression system. Green and red circles represent endogenous and newly synthesized H3.3, respectively.
 Ectopically expressed HA-H3.3 incorporates into chromatin over time and reaches an equilibrium level before addition of doxycycline inhibits HA-H3.3
 expression. Upon inhibition of its expression, HA-H3.3 dissociates from chromatin over time. (B) Average enrichment of HA-H3.3 ChIP-Seq reads over
 time. ESCs were cultured for multiple passages with 2 ug/mL DOX before DOX was removed and HA-H3.3 expression induced over a time course of
 6 days. ESCs routinely cultured without DOX were exposed to 2 μg/mL DOX to inhibit HA-H3.3 expression. Steady-state levels of HA-H3.3 enrichment
 (tpnt. 0 h) decline over a time course of 48 h. Horizontal axis depicts time in days during induction of HA-H3.3 expression (− DOX condition) and time
 in hours during repression (+ DOX condition) of HA-H3.3 expression. (C) Time course western blots showing expression of HA-H3.3 during induction
 and inhibition of HA-H3.3 expression. ESCs were treated with or without 2 μg/mL DOX. Densitometry was calculated using the Image J software
 package. (D) Western blot showing comparison between endogenous H3.3 and ectopic HA-H3.3 expression. The asterisk marks transgenic HA-H3.3;
 the arrow marks endogenous H3.3. (E) Density blot showing the correlation of HA-H3.3 dissociation rates measured in 10 bp windows between two
 biological replicate experiments. The color represents number of 10 bp windows with highest points (red) and lowest points (dark blue). Pearson’s
 correlation coefficient (PCC) between two H3.3 dissociation rates is 0.71, P value = 0, df = 6836487. (F) H3.3 dissociation rates are highly correlated with its
 equilibrium levels. Density blot showing correlation between H3.3 dissociation rates and H3.3 equilibrium levels. PCC = 0.61, df = 6836487, P value = 0.

turnover, we separately measured H3.3 eviction and                                 termination factors and result in short transcripts at enhan-
steady-state levels of H3.3 at RNA Pol II peaks in genic                           cer elements and thereby ultimately define transcription
regions and outside of genes. Outside of known transcribed                         end sites outside of genes.
genes, Pol II binding sites are marked by high dissociation                          Within a 10 kbp interval of the genic region, the highest
rates and low enrichment levels of H3.3 nucleosomes. In                            Pol II peaks are detected within a 1 kbp region around
addition, these binding sites are flanked by high peaks of                         TSSs and are positively correlated with gene expression
H3.3 dissociation and enrichment levels (Figure 3A). The                           levels. We then compared our measurements of H3.3 dis-
deposition of H3.3 at adjacent regions of RNA Pol II bind-                         sociation with RNA Pol II enrichment across the direction
ing sites may impede Pol II or accommodate the binding of                          of transcription. The highest enrichment levels of H3.3

 Figure 2 H3.3 dissociation rates are positively correlated with gene activity. RNA-Seq data were used to group genes according to transcription
 levels based on their FPKM values into Top 10% (>30 FPKM) and Top 20% (10 to 30 FPKM), medium (3 to 10 FPKM) and low (1 to 3 FPKM) and silent
 (
Ha et al. Epigenetics & Chromatin 2014, 7:38                                                                                                  Page 6 of 14
http://www.epigeneticsandchromatin.com/content/7/1/38

 Figure 3 High H3.3 dissociation rates mark RNA Pol II binding sites. (A) H3.3 dissociation rates and equilibrium levels were measured at
 non-genic Pol II binding sites. Green, red, and blue colored ovals indicate Pol II binding, dissociating, and incorporating H3.3 nucleosomes at the
 sites. Pol II, CHD7, p300, HDAC1, HDAC2, LSD1, Mi2b, REST, and CoREST enrichment (indicated on the right of the figure) was mapped from published
 ChIP-Seq data (see Materials and Methods). The enrichment levels of RNA Pol II and individual chromatin remodelers were standardized to yield a
 distribution with mean = 0 and variance = 1 using ChIP-Seq read numbers. All plots are calculated by averaging values of the 100 bp sliding windows
 of the corresponding loci. (B) H3.3 dissociation rates and equilibrium levels at genic Pol II peaks. RNA-Seq libraries were used to group genes according
 to their transcription levels based on their FPKM values as indicated on the right. Blue arrows indicate the direction of transcription.

around Pol II binding sites are measured exactly at the                        results suggest that H3.3 deposition as well as H3.3 turn-
binding peak of RNA Pol II. Interestingly, the peak of high-                   over are important spatial determinants of RNA Pol II-
est dissociation occurred around 50 to 100 bp upstream                         dependent transcription and directionality.
of the TSSs, which is typically nucleosome-depleted and
located between the −1 and +1 nucleosome (Figure 3B).                          H3.3 turnover associated with histone modifications and
   NuRD (nucleosome remodeling and histone deacetylase)                        regulatory sites
is a complex of ATP-dependent chromatin remodelers, his-                       Histone modifications
tone methylases, demetylases, and deacetylases [24]. The                       H3.3 is a carrier of various post-translational histone
NuRD subunits include CHD proteins, Mi-2b, HDAC1,                              modifications that influence gene transcription. To test
HDAC2, and LSD1. Examination of NuRD subunit binding                           if histone modifications affect nucleosome stability, we
around RNA Pol II peaks show that NuRD components are                          examined H3.3 dissociation rates at sites of several his-
highly associated with regions of high H3.3 dissociation                       tone modification domains.
(Figures 3A and B). Hence, NuRD nucleosome remodeling                             We detected the highest levels of H3.3 deposition at
may directly destabilize H3.3 nucleosomes at transcription                     sites associated with active histone marks including
start sites but further investigation is needed. All of these                  H3K4me1, H3K4me3, H3K9ac, and H3K27ac (Figure 4A).
Ha et al. Epigenetics & Chromatin 2014, 7:38 Page 7 of 14
http://www.epigeneticsandchromatin.com/content/7/1/38
C RNA PolII H3K9ac H3K36me3 H3K27ac H3K4me1 H3K27me3
5 0 5 5 0 5 5 0 5 5 0 5 5 0 5 5 0 5
5 0 5 5 0 5 5 0 5 5 0 5 5 0 5 5 0 5
Distance to the peak center (kbp)
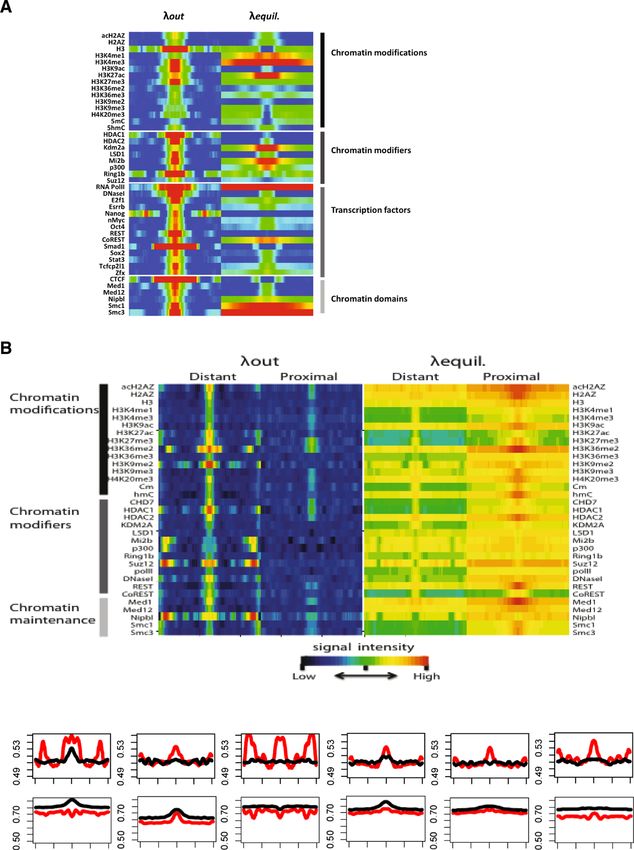
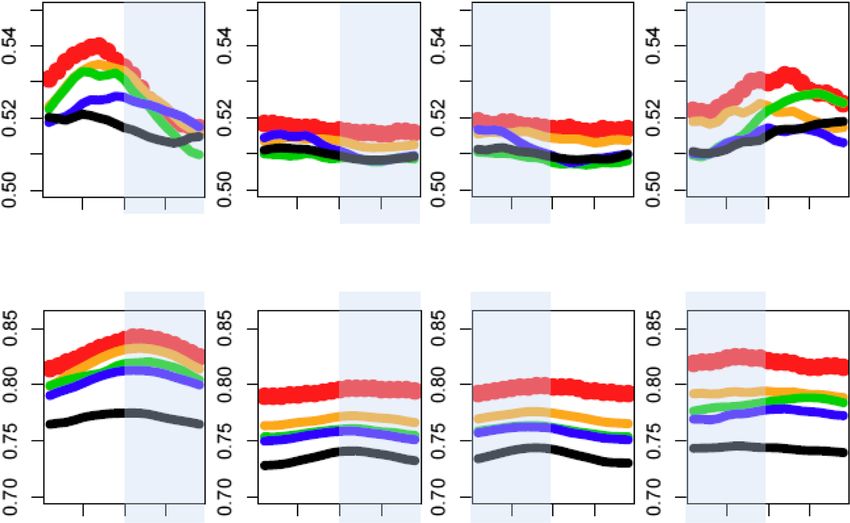
Figure 4 (See legend on next page.)Ha et al. Epigenetics & Chromatin 2014, 7:38 Page 8 of 14 http://www.epigeneticsandchromatin.com/content/7/1/38 (See figure on previous page.) Figure 4 H3.3 dissociation at regulatory elements of mouse embryonic stem cells. (A) Heatmap illustrating the dissociation rates and equilibrium levels of H3.3 around chromatin modifications and protein binding sites. Average H3.3 dissociation rates and equilibrium levels within 10 kbp regions around sites of histone modifications and binding factors are represented with a color gradient (Red: high; Blue: low). (B) High H3.3 dissociation rates mark distal regulatory regions. Comparison of H3.3 dissociation rates between gene proximal and distal regulatory sites. Heatmaps showing dissociation rates and equilibrium levels of HA-H3.3 at genic and inter-genic regulatory sites. Protein binding sites located within 5 kbp of known transcripts and coding regions were considered proximal (genic) and those outside were considered distal (inter-genic). (C) Comparison of H3.3 dissociation rates at chromatin modification peaks between genic and inter-genic sites. Red and black lines denote inter-genic and genic values respectively H3.3 dissociation rates varied greatly among histone Pluripotency factors, chromatin remodelers, and chromatin modifications: we measured the highest dissociation rates organizers at euchromatic marks such as H3K4me3, H3K9ac, and ESC-specific pluripotency factor binding sites including H3K27ac. Moderate H3.3 dissociation rates were recorded those of Nanog, Smad1, Oct4, E2F1, Esrrb, Stat3, Tcfcp2l1, at sites associated with H3K4me1 and H3K36me2/3. Only and Zfx all display high H3.3 dissociation rates with low low H3.3 dissociation rates and low H3.3 equilibrium to moderate enrichment of H3.3 in the equilibrium state levels were measured at sites of heterochromatic histone (Figure 4A), suggesting that rapid H3.3-nucleosome turn- modifications such as H3K9me2/3 and H4K20me3. Des- over is a feature of transcription factor binding sites. pite being associated with gene repression, we found At the binding sites of chromatin remodelers and his- H3K27me3 islands as well as binding sites of H3K27 tone modifiers, such as HDAC1/2, Ezh2, LSD1, REST, methyltransferases (Ring1b, Suz12) to be sites of high CoREST, Suz12, Mi2b, and p300, various levels of H3.3 H3.3 dissociation rates. Hence, although silent genes are were detected with the highest deposition of H3.3 at generally found to carry low H3.3 dissociation rates, those Mi2b, Kdm2a, and p300 sites. Regardless of H3.3 equi- marked by H3K27me3 exhibited exceptionally high H3.3 librium levels, H3.3 dissociation rates were found to be dissociation rates. invariably high compared to low H3.3 turnover at regions In gene bodies, both H3.3 enrichment and turnover flanking binding sites of chromatin remodelers. The acetyl are lower than at TSSs and TESs. H3K36 methylation is transferase p300 adds H3K27ac at active enhancers. enriched in gene bodies and displays low dissociation Combined with p300 we found high levels of H3.3 rates as well as low equilibrium levels of H3.3. The result incorporation at chromatin regions with enhancer marks is consistent with the role of H3K36 methylation in including H3K27ac and H3K4me1, demonstrating that high nucleosome stabilization and inhibition of cryptic tran- H3.3 dissociation is a hallmark of enhancers. Kdm2a is H3 scription [25,26]. demethylase and specifically demethylates H3K36me1 and Heterochromatic chromatin that contains 5mC, H3K9me H3K36me2 associated with centromeres where it represses 2/me3, H4K20me3 generally displays low H3.3 dissociation transcription of small non-coding RNAs that are encoded rates implying high chromatin stability (Figure 4A). Com- by clusters of satellite repeats at the centromere [31]. parison of H3.3 dissociation rates at sites enriched with Hence, the low H3.3 dissociation that we typically detected 5mC and 5hmC sites shows that both equilibrium and at heterochromatin may increase when chromatin binding dissociation rates of H3.3 are significantly higher at 5hmC needs to be accommodated. Another example of this peaks (Figure 4A). 5hmC is generated by the activity of unusually high H3.3 dissociation rate in heterochromatin is TET dioxygenases and is enriched in highly transcribed found at binding sites of the cohesin proteins Smc1/3. genes, Polycomb bound promoters and distal cis-regulatory Smc1/3 are implicated in sister chromatin cohesion and elements [27,28]. Our observations suggest that cytosine their binding sites contained high and broad islands of conversion from 5mC to 5hmC is accompanied by an H3.3 that exhibit high H3.3 turnover. In general, we increase in deposition of H3.3 that undergoes rapid find differential H3.3 dissociation rates at histone modifi- nucleosome exchange. The H2A variant H2A.Z has been cations and invariably high turnover at binding sites of demonstrated to be important for ESC pluripotency and transcription factors, chromatin remodelers, and chroma- nucleosome stability [2,29,30]. We found strong overlap tin organizers. between H2A.Z and H3.3 in line with the reports that have detected both variants combined together in nucleosomes. H3.3 dissociation is higher at distal regions than at Interestingly, we find lower stability in the acetylated form proximal promoters of H2A.Z compared to pan H2A.Z (Figure 4A), suggesting The histone variant H3.3 is deposited at gene promoters that the acetylated orm of H2A.Z induces lower nucleo- and also at genic and intergenic enhancers. We therefore some stability when paired with H3.3. examined whether general trends of dissociation pertain
Ha et al. Epigenetics & Chromatin 2014, 7:38 Page 9 of 14
http://www.epigeneticsandchromatin.com/content/7/1/38
to H3.3 that is detected at genic regions compared to region showed a higher (more than two-fold) enrich-
H3.3 that is detected at distal intergenic regions. ment than the other repeat elements. Specifically, the
To this end, we separately measured H3.3 dissociation number of Klf4, Esrrb, STAT3, Oct4, and Sox2 binding
rates and equilibrium levels at chromatin modification sites are 14.3%, 10.3%, 10.3%, 7.3%, and 7.8%, respectively,
and protein binding sites within and outside 5 kbp regions and only 2.1%, 4.8%, 4.6%, 2.8%, 3.2%, respectively, in
of annotated genes. Surprisingly, we find that both H3.3 other non-genic repeat elements (Figure 5B). The data
dynamics and equilibrium levels are dramatically different show that higher dissociation rates of H3.3 in satellite re-
between genic and intergenic regions. At distal regulatory peat elements outside the coding region may result from
regions that are marked by histone modifications and or facilitate interactions between DNA and protein fac-
transcription factors, H3.3 steady-state levels are sub- tors. These results further support our conclusion that
stantially higher in proximal regions compared to distal high H3.3 turnover marks active interactions between
regions. H3.3 dissociation rates on the other hand, are DNA and protein factors. Furthermore, satellite repeat el-
significantly higher at distal binding sites (Figures 4B ements were shown to contain distant regulatory elements
and C). For example, outside of coding regions, H3K36 that further diversify the ESC regulatory network.
methylation is associated with high H3.3 turnover contrary
to low H3.3 dynamics inside of coding regions. The results Discussion
further support that high H3.3 dynamics are associated Histone variants have received great attention due to
with the regulation of interactions between proteins and their important roles in transcriptional regulation. Yet,
DNA segments, and also suggest that promoters may main- despite the availability of genome-wide maps for most
tain a slower H3.3 nucleosome exchange to accommodate histone variants, their dynamics of deposition and eviction
the process of transcription and/or the assembly of the are not fully understood. Embryonic stem cells (ESCs) are
bulky transcription machinery may slow down the histone characterized by their pluripotent differentiation capacity
exchange. that is manifested by a unique hyper-dynamic chromatin
architecture [17]. The histone variant H3.3 is present at
H3.3 dissociation dynamics at repeat elements many regulatory sites in the ESC genome and is important
A number of transcription factors utilize repeat elements for the establishment of Polycomb-mediated H3K27
as a major source of binding sites [32]. Therefore, we methylation [11]. Here we provide not only genome-wide
examined H3.3 dissociation rates and equilibrium levels steady-state levels of H3.3 but also direct measurements
within various repeat elements. We further tested if the of H3.3 dissociation rates from chromatin in mouse ESCs.
H3.3 dissociation rates in repeat elements are affected Our study of H3.3 dissociation allowed us to infer import-
by their proximity to coding regions and transcription ant genome-wide trends of H3.3 turnover at chromatin
factor binding. Repeat elements that fall into coding features that are present in all mammalian cell types but
regions and those that do not were separately analyzed: also sites that are bound by ESC specific factors. We find
repeat elements detected within 2 kb of a known tran- high H3.3 dissociation rates at RNA Pol II bound genic
script were treated as ‘genic’ repeats, others as ‘non-genic’. and extragenic sites and lower dissociation rates within
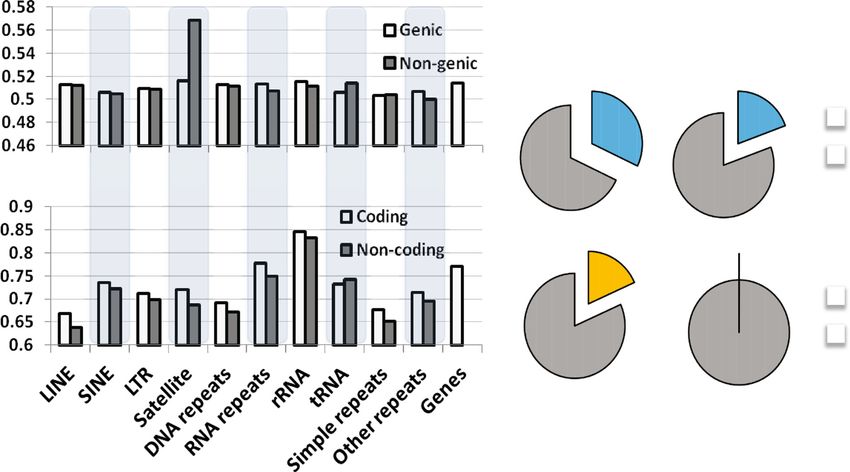
Satellite repeat elements located outside of genic regions gene bodies. Histone H3.3 dissociation was variable
show a significantly higher dissociation rate of H3.3 than among histone modification domains with high H3.3
other repeat elements (statistical test) (Figure 5A). We dissociation at active histone marks and low dissociation
examined whether the observed differential H3.3 dis- at heterochromatic marks. Pluripotency factor and chro-
sociation rates among repeat elements are affected by matin enzyme binding sites were marked by invariably
the binding of transcription factors. We utilized Nanog, high H3.3 dissociation. Interestingly, distal enhancer sites
Oct4, Klf4, E2d1, Esrrb, STAT3, Smad1, Sox2, Tcfcp2l1, exhibited higher H3.3 turnover than gene-proximal regu-
and n-Myc ChIP-Seq data generated from mESCs to latory sites. These novel results demonstrate that H3.3
identify their binding sites within repeat elements. Among nucleosome exchange is likely an important factor that
repeat elements, with the exception of satellite repeat functions in regulating transcriptional processes, DNA
elements in the non-coding region, 19% of elements are accessibility, and chromatin integrity.
bound by at least one ESC-specific transcription factor
(Nanog, Oct4, Klf4, E2d1, Esrrb, STAT3, Smad1, Sox2, H3.3 dissociation and transcription
Tcfcp2l1, and n-Myc). Among 2,610 satellite repeat Active gene promoters have a highly phased structure of
elements located in the non-coding region, 32%, or 835, nucleosomes that are dynamically exchanged to allow
elements are significantly enriched with transcription assembly of the transcriptional machinery [33]. Nucleo-
factor binding (Chi-squared = 206,110.5, degree of free- somes are evicted upon transcription of chromatin and
dom = 1, P valueHa et al. Epigenetics & Chromatin 2014, 7:38 Page 10 of 14 http://www.epigeneticsandchromatin.com/content/7/1/38 Figure 5 Satellite repeats outside of genic regions exhibit high H3.3 dissociation rates and are enriched with transcription factor binding sites. (A) H3.3 dissociation rates and equilibrium levels in various genic (white bars) and inter-genic (gray bars) repeat elements. (B) ChIP-Seq data (see Materials and methods) were used to map transcription factor and CTCF enrichment within various repeat elements. Pie charts depict comparisons of transcription factors and CTCF binding sites between satellite and other repeat elements located outside the genic regions. II-mediated transcription and is executed in a gap-filling positioning and exchange [37,38]. Chromatin remodelers fashion [34]. When H3.3 dissociation was examined at have an ATPase domain that can utilize the energy of coding regions, we found lower H3.3 dissociation within ATP to slide nucleosomes laterally or eject them entirely. gene bodies than at promoters and 3’ ends of genes. This Our observations that that localized regions of high H3.3 phenomenon has been reported from yeasts and other at RNA Pol II binding sites coincide with binding sites of mammalian cells, and increased nucleosome stability NuRD complex components implies that this class of within coding region has been proposed as a mechanism chromatin remodelers may directly influence the eviction to prevent cryptic transcription [13,18]. In contrast, high of nucleosomes at TSSs. H3.3 dissociation at promoters and transcription end sites Unexpectedly, we found that non-genic regions of may facilitate transcription initiation and cessation. We highly dynamic H3.3 within 1 kbp from the nearest Pol II found that both equilibrium levels as well as dissociation binding site overlap tightly with chromatin remodelers. rates within TSSs, coding region, and TESs are directly The presence of H3.3 at these RNA Pol II flanking sites is correlated with gene activity. Hence, nucleosome depos- curious and may mark TESs of non-coding RNAs. ition and eviction may to a great extent be a function of H3.3 is a carrier of various histone modifications, but is transcription and be dependent on binding and activity of mostly modified with active histone modifications [10]. In Pol II and the transcriptional machinery. We detected line with our previous study, we find high dissociation highest dissociation of H3.3 nucleosomes 50 to 100 bp associated with active histone marks and low dissociation upstream of the RNA Pol II binding peak and peaks of of H3.3 at sites marked by heterochromatic marks. The dissociation overlapped tightly with binding of chroma- implications for the observations are two-fold. First, histone tin remodelers. Gene promoters carry a remarkably modifications themselves may determine histone stability. conserved and uniform nucleosome organization with Histone acetylation, for instance, may through charge well-localized −1 and +1 nucleosomes that flank so-called neutralization, disrupt DNA-histone interactions [39]. Sec- nucleosome-depleted regions (NDRs) just upstream of the ond, heterochromatin is composed of inherently stable nu- TSSs. This pattern has been described in yeast, flies, and cleosomes that are exchanged only at a slow rate. However, humans [33,35,36]. Hence, our mapping of H3.3 dissoci- even heterochromatic sites displayed localized zones of ation rates across promoters suggests that NDRs are in high H3.3 dissociation when chromatin accessibility must fact localized zones of extremely high H3.3 turnover. Both be accommodated for instance at centromeres bound by cis and trans factors are thought to determine nucleosome chromatin remodelers such as Kdm2a or cohesin proteins.
Ha et al. Epigenetics & Chromatin 2014, 7:38                                                                      Page 11 of 14
http://www.epigeneticsandchromatin.com/content/7/1/38

   Our analysis of binding sites of ESC specific factors,         turnover, suggesting that both histone modifications and
chromatin remodelers, and structural chromatin organizers         protein-DNA interactions are important determinants of
revealed that, regardless of H3.3 equilibrium levels, H3.3        nucleosome turnover. Distal regulatory sites are featured
dissociation is invariably high at protein factor binding sites   by higher turnover than gene proximal sites suggesting
and drops sharply where these factors are absent. Hence,          that the chromatin of enhancers must be kept in a highly
high H3.3 dissociation is a better predictor of protein factor    dynamic state in order to facilitate cell type specific gene
binding than is H3.3 enrichment. At satellite repeats we          activation.
detected substantially higher H3.3 dissociation than we did
at other repeat elements. The elevated H3.3 dissociation          Methods
was correlated with a substantially higher proportion of          Generation, culture, and differentiation of HA-H3.3 ESC line
pluripotency factor binding within satellite repeats. Hence,      ES(MC1R(20)) cells were a kind gift from Minoru Ko.
the binding of ESC specific factors appears to be a strong        The plvx-Tight-Puro-HA/FLAG H3.3 expression construct
determinant of H3.3-nucleosome turnover in ESCs. Nucle-           was generated as described in [13]. Lentiviral particles were
osomes are generally thought to impede transcription factor       packaged in 293 T cells with the psPAX2 packaging
binding to their DNA motives, although some pioneer               plasmid. Subsequently, we transduced ES(MC1R(20))
factors may bind directly to nucleosomes [40-43]. Hence,          cells and drug-selected with puromycin for stable inte-
high H3.3 turnover may either be a prerequisite for tran-         gration. ESCs were cultured as in [45]. Briefly ESCs were
scription factor binding or be a consequence of sterical          maintained in medium consisting of Dulbecco’s modified
displacement by transcription factors that compete with           Eagle’s medium (Hyclone) supplemented with 10% fetal
nucleosomes for binding sites.                                    bovine serum (FBS), 10% knockout serum replacement
   Interestingly, we found higher H3.3 dissociation rates at      (Invitrogen), L-glutamine, 100 units/mL penicillin, 100 μg/
distal non-genic sites compared to proximal sites around          mL streptomycin, 0.1 mM beta-mercaptoethanol at 37°C
TSSs. At the same time, equilibrium levels of H3.3 were           under 5% CO2, supplemented with 1,000 units/mL
higher at proximal H3.3 sites when compared to distal             leukemia inhibitory factor (LIF) (ESGRO, Chemicon). For
H3.3 sites.                                                       differentiation into embryoid bodies (EBs), ESCs were
   Lower H3.3 turnover at genic regions may partially be          trypsinized and transferred to ultra-low attachment plates
explained by gene body H3.3, which is typically exchanged         into 15% FBS containing medium without the addition of
at a low rate. Yet, several marks and protein factor binding      LIF and medium was changed every second day.
sites that are not associated with gene bodies also display
higher H3.3-nucleosome turnover at distal sites compared          Alkaline phosphatase assay
to nucleosomes at proximal sites. Higher distal H3.3 turn-        ESC cultures were seeded at clonal density and cultured
over may result from H3.3-H4 tetramer splitting events,           for 5 days in ES medium (+/−2 μg/mL DOX), or directly
which have been reported at higher rates from enhancers           fixed when cultured on feeder cells. Cells were washed,
compared to non-enhancers [44].                                   fixed in 4% paraformaldehyde and tested for alkaline
   In summary, our analysis of equilibrium levels and dis-        phosphatase (AP) activity using an AP kit (Millipore).
sociation rates in mouse ESCs revealed different modes of
H3.3 deposition and turnover that pertain to their pluripo-       Quantitative PCR analysis
tency. We detected differential trends of H3.3-nucleosome         Total RNA was isolated using the RNeasy kit (Quiagen)
turnover as they relate to Pol II-dependent transcription,        and cDNA was made from 1 μg of total RNA using the
pluripotency factor binding, and proximity to genes.              SuperScript III First-Strand Synthesis System (Invitrogen).
                                                                  RT-PCR was performed with the following Taqman probes:
Conclusion                                                        Gapdh, Mm03302249; Oct4, Mm03053917; Nanog, Mm0
In this study, we utilized a TET-OFF ESC line to measure          1617763; Sox2, Mm00488369; AFP, Mm00431715; Sox17,
dissociation rates of H3.3 nucleosomes upon inhibition of         and Mm00488363.
epitope-tagged H3.3 expression. Genome-wide analyses
revealed differential H3.3 turnover at functionally distinct      Western blotting
genomic regions. High H3.3 turnover was associated with           Cells were lysed with RIPA buffer, and whole-cell lysates
genic and extragenic sites of Pol II binding sites. At genic      were resolved on SDS-PAGE, transferred onto nitrocellu-
sites H3.3 turnover was directly correlated with gene             lose membranes, and blotted with anti-HA (Roche, Basel,
activity suggesting that H3.3 displacement and deposition         Switzerland), anti-FLAG (M2, Sigma, St. Louis, MO, USA)
may be direct functions of transcription. Pluripotency            antibodies at 1:1,000. For anti-H3.3 western blotting,
factor binding sites as well as binding sites of chromatin        histones were isolated by acid extraction as described in
enzymes displayed high H3.3 turnover even when present            [46] prior to immunoblotting with an anti-H3.3 antibody
at heterochromatic sites, which typically feature slow H3.3       (Abcam, ab62642, Cambridge, UK). The anti-H3.3 antibody
Ha et al. Epigenetics & Chromatin 2014, 7:38 Page 12 of 14
http://www.epigeneticsandchromatin.com/content/7/1/38
recognizes serine 31 of H3.3, which is not present on either For our analysis of H3.3 dissociation rates and equilib-
H3.1 or H3.2, but cross-reactivity with other histone vari- rium levels, we only considered genomic regions that show
ants has not been tested experimentally (Abcam). significant enrichment of HA-H3.3 at 0 h of the ‘TET-OFF’
time course and day 6 of the TET-ON time course.
Time course and ChIP The H3.3 dissociation rate, λ’out was calculated following
For ‘TET-OFF’ experiments, ESCs were cultured over sev- an exponential decay equation:
eral passages (weeks) on feeder cells in the absence of DOX
dN ðt Þ
and were subsequently passaged onto feeder-free plates ¼ −λ0out N ðt Þ
prior to the inhibition of HA-H3.3 expression. To repress dt 0
N ðt Þ ¼ N ðt−1Þe−λout Δt
HA/FLAG-H3.3 expression we treated cells with 2 μg/mL
1 Nðt−1Þ
doxycycline hyclate before crosslinking with formaldehyde λ0out ¼ log
Δt NðtÞ
at various time points. ChIP experiments were performed
as described previously with an antibody against HA [47]. Where, N(t) is amount of H3.3 in a chromatin at time
ChIP-PCR validation was carried out with Rps19 primers t in TET-OFF experiment.
(Forward: TTGTCCTCAAGACACCAGTGGAGCT, Re- We estimated the H3.3 dissociation rates for any given
verse: ATCTGCTCAACCGCACTTGG) and with Ichr.8 locus by counting the number of HA-H3.3 nucleosomes
primers (Forward: AAGGGGCCTCTGCTTAAAAA, Re- mapped at 0 h and 6 h following inhibition of HA-H3.3
verse: AGAGCTCCATGGCAGGTAGA). expression. To calculate the relative H3.3 dissociation
rates at a locus i (λ’out,i), we used the following logistic
Deep sequencing library construction equation to scale dissociation rates to values from 0 to 1:
In order to correlate HA/FLAG-H3.3 stability with the pres-
ence of histone modifications and/or gene expression levels, N i ð0hÞ
λ0out; i ¼ log
we constructed ChIP-Seq libraries for H2A.Z, H3K4me1, N i ð6hÞ
H3K4me3, H3K9ac, H3K27me3, and RNA-Seq libraries. 1 1 N i ð0hÞ
λout; i ¼ ¼ ¼
For RNA-Seq library construction, poly-adenylated RNA 1þe −λ0out; i N i ð0hÞ N i ð0hÞ þ N i ð6hÞ
1þ
was isolated from 5 ug of total RNA isolated from undiffer- N i ð6hÞ
entiated ESCs cultured on gelatin-coated plates, using the
Dynabeads mRNA Direct kit (Invitrogen). Double-stranded Ni(0 h) : the number of HA-H3.3 dyads mapped to
cDNA was generated with the Double-stranded cDNA locus i at 6 h after inhibition of H3.3-HA expression.
synthesis kit (Invitrogen), sonicated, and subsequently Ni(6 h) : the number of HA-H3.3 dyads mapped to
processed exactly like ChIP DNA. locus i at 6 h after inhibition of H3.3-HA expression.
ChIP material was blunt-ended and phosphorylated Equilibrium levels of HA-H3.3 at any given locus was
with the End-it-Repair kit (EPICENTRE). Illumina gen- estimated from the enrichment of HA-H3.3 at 0 h of
ome sequencing adaptors were ligated with T4 DNA ligase TET-OFF experiments.
(New England Biolabs) after addition of adenosine nucleo- N i ð0hÞ
tides, using exo-Klenow. Samples were PCR amplified λequil:; i ¼
N i ð0hÞ þ I i ð0hÞ
with multiplexed Illumina genomic DNA sequencing
primers. PCR products (250 to 450 bp in size) were gel Ni(0 h) : the number of HA-H3.3 dyads mapped to
purified and submitted for Illumina deep sequencing. locus i at 0 h after inhibition of HA-H3.3 expression.
Ii(0 h) : the number of nucleosome dyads mapped to
Calculation of H3.3 dissociation rates and equilibrium levels locus i from input DNA sequencing at 0 h after inhib-
ChIP-Seq reads were mapped to the mouse reference ition of HA-H3.3 expression.
genome (mm9) by perfect and unique matching without
allowing any mismatch or gap. The reads were then Identification of transcription factor binding sites and
extended to 150 bp from their 5’ end. We applied a chromatin modification peaks
modified average low pass filter for deconvolution of Transcription factor ChIP-Seq for Nanog, Oct4, Sox2,
noisy blurred images. The normalized H3.3 level at a Smad1, E2F1, Tcfcp2I1, CTCF, Zfx, STAT3, KLF4, Esrrb,
250 bp window is a linear combination of the number of n-Myc, p300 in mESC were obtained from Chen et al.
the HA-H3.3 nucleosomes at the site and the number of (GSE11431) [48]. H3, H4K20me3 H3K9me3, H3K36me3
HA-H3.3 nucleosomes in the two adjacent 250 bp- ChIP-Seq in mES were obtained from Mikkelsen et al.
length windows. In the linear combination, the number (GSE12241) [15]. KDM2A ChIP-Seq in mESC is obtained
of HA-H3.3 nucleosomes at the center is weighted 1 and from Blackledge et al. (GSE21202) [31]. SUZ12, EZH2,
the number of HA-H3.3 nucleosomes in the two neigh- RING1B ChIP-Seq in mESC were obtained from Ku et al.
borhoods at both ends is weighted 0.5. (GSE13084) [49]. Med12, Smc1/2/3 Med1, Nipbl, CTCFHa et al. Epigenetics & Chromatin 2014, 7:38 Page 13 of 14
http://www.epigeneticsandchromatin.com/content/7/1/38
ChIP-Seq in mESC were obtained from Kagey et al. [50]. for analysis of expression of pluripotency factors (Oct4, Nanog, Sox2) as well
HDAC1, HDAC2, LSD1, REST (transcription repressor of as differentiation markers (Sox17, Kdr).
neuronal genes in non-neuronal cells), COREST, Mi2b Additional file 2: Figure S2. (A) ChIP-Seq profiles of two control regions:
ChIP-Seq were obtained from Whyte et al. (GSE27844) Rps19 (positive) and Intergenic Chr.8 (negative) over a 48-h time course after
inhibition of HA-H3.3 expression. (B) HA-H3.3 ESCs were crosslinked at
[51]. LMR/UMR/FMR sites in mESC were obtained from various time points after DOX addition and ChIP-PCR validation was
Stadler et al. [52]. DNaseI hypersensitive sites in mESC performed with primers spanning the region highlighted in red.
were obtained from the Encode project.
The raw ChIP-Seq data in SRA format were trans- Abbreviations
formed into fastq files and mapped to the reference BP: Base pair; ChIP: Chromain immunoprecipitation; DOX: Doxycycline;
EB: Embryoid body; ESC: Embryonic stem cell; HA: Hemagglutinin;
genome (mm9). The 30 to 50 bp sequences from the MEF: Mouse embryonic fibroblast; Pol: Polymerase; TES: Transcription end
ChIP-Seq data were mapped to the mouse reference site; TET: Tetracycline; TSS: Transcription start site.
genome (mm9) by perfect and unique matching with-
Competing interests
out allowing any mismatch or gap. The reads were then The authors declare that they have no competing interests.
extended to 150 bp from their 5’ end.
Authors’ contributions
MH participated in the design of the study, carried out the data analysis and
Analysis of RNA-Seq data drafted the manuscript. DK participated in the design of the study, carried
The RNA-Seq analysis was performed using the Tuxedo out experiments, and drafted the manuscript. KZ conceived the study,
software package with default settings. RNA-Seq reads participated in its design and coordination, and helped to draft the
manuscript. All authors read and approved the final manuscript.
were mapped to the mouse genome (NCBI37/mm9) using
Bowtie2. Tophat with default settings was used to detect Acknowledgements
splice sites. The Cufflinks software package was used to We thank the NHLBI DNA Sequencing Core facility for sequencing the
ChIP-Seq and RNA-Seq libraries. The work was supported by the Division of
assemble transcripts based on the Refseq mRNA sequence Intramural Research, NHLBI, NIH, USA.
database (mm9). A total of 48,228 transcripts were de-
tected from two RNA-Seq replicate experiments and their Author details
1
Samsung Advanced Institute of Technology, Samsung Electronics
mean values were used for further analysis. Transcripts Corporation, Yongin-Si 446-712, Gyeonggi-Do, South Korea. 2Systems Biology
were sorted according to their FPKM (fragments per kilo- Center, National Heart, Lung, and Blood Institute, NIH, Bethesda, MD 20892,
base of exon model per million mapped fragments). The USA.
‘top 10%’ (4,867) of transcripts was defined as having Received: 2 October 2014 Accepted: 27 November 2014
expression levels greater than 30 FPKM, the ‘top 20%’ Published: 20 December 2014
(4,568) greater than 10 FPKM and less than 30 FPKM,
References
‘medium’ (5,849) between 3 and 10 FPKM, ‘low’ (4,441) 1. Goldberg AD, Banaszynski LA, Noh KM, Lewis PW, Elsaesser SJ, Stadler S,
between 1 and 3 FPKM. Silenced transcripts were defined Dewell S, Law M, Guo X, Li X, Wen D, Chapgier A, DeKelver RC, Miller JC,
as having expression levels between 0 and 1 FPKM. Lee YL, Boydston EA, Holmes MC, Gregory PD, Greally JM, Rafii S, Yang C,
Scambler PJ, Garrick D, Gibbons RJ, Higgs DR, Cristea IM, Urnov FD, Zheng D,
Allis CD: Distinct factors control histone variant H3.3 localization at specific
Statistical tests genomic regions. Cell 2010, 140:678–691.
2. Jin C, Felsenfeld G: Nucleosome stability mediated by histone variants
All statistical tests were performed using the R, stat H3.3 and H2A.Z. Genes Dev 2007, 21:1519–1529.
package. To test the significance of Pearson correlation 3. Ahmad K, Henikoff S: The histone variant H3.3 marks active chromatin by
coefficients, we used the cor.test() in the R stat package. replication-independent nucleosome assembly. Mol Cell 2002, 9:1191–1200.
4. McKittrick E, Gafken PR, Ahmad K, Henikoff S: Histone H3.3 is enriched in
To test the significance of enrichment and depletion, we covalent modifications associated with active chromatin. Proc Natl Acad
performed a Chi-squared test using the chisq.test() in Sci U S A 2004, 101:1525–1530.
the R stat package. 5. Ray-Gallet D, Quivy JP, Scamps C, Martini EM, Lipinski M, Almouzni G: HIRA
is critical for a nucleosome assembly pathway independent of DNA
synthesis. Mol Cell 2002, 9:1091–1100.
Data availability 6. Elsaesser SJ, Goldberg AD, Allis CD: New functions for an old variant: no
Our ChIP-Seq and RNA-Seq data sets have been deposited substitute for histone H3.3. Curr Opin Genet Dev 2010, 20:110–117.
7. Wong LH, McGhie JD, Sim M, Anderson MA, Ahn S, Hannan RD, George AJ,
in the Gene Expression Omnibus data base with accession Morgan KA, Mann JR, Choo KH: ATRX interacts with H3.3 in maintaining
number GSE63641. telomere structural integrity in pluripotent embryonic stem cells.
Genome Res 2010, 20:351–360.
8. Schwartz BE, Ahmad K: Transcriptional activation triggers deposition and
Additional files removal of the histone variant H3.3. Genes Dev 2005, 19:804–814.
9. Tamura T, Smith M, Kanno T, Dasenbrock H, Nishiyama A, Ozato K:
Additional file 1: Figure S1. (A) HA-H3.3 ESCs were cultured on feeder Inducible deposition of the histone variant H3.3 in interferon-stimulated
cells (upper panel) and cultured for 3 days or seeded at clonal density and genes. J Biol Chem 2009, 284:12217–12225.
grown for 5 days (lower two panels) with and without DOX prior to alkaline 10. Hake SB, Garcia BA, Duncan EM, Kauer M, Dellaire G, Shabanowitz J, Bazett-Jones
DP, Allis CD, Hunt DF: Expression patterns and post-translational modifications
phosphatase staining. (B) Total RNA was isolated from undifferentiated
HA-H3.3 ESCs and from day 8 EBs. Quantitative PCR analysis was performed associated with mammalian histone H3 variants. J Biol Chem 2006,
281:559–568.Ha et al. Epigenetics & Chromatin 2014, 7:38 Page 14 of 14
http://www.epigeneticsandchromatin.com/content/7/1/38
11. Banaszynski LA, Wen D, Dewell S, Whitcomb SJ, Lin M, Diaz N, Elsasser SJ, 31. Blackledge NP, Zhou JC, Tolstorukov MY, Farcas AM, Park PJ, Klose RJ: CpG
Chapgier A, Goldberg AD, Canaani E, Rafii S, Zheng D, Allis CD: Hira-dependent islands recruit a histone H3 lysine 36 demethylase. Mol Cell 2010, 38:179–190.
histone H3.3 deposition facilitates PRC2 recruitment at developmental loci in 32. Kunarso G, Chia NY, Jeyakani J, Hwang C, Lu X, Chan YS, Ng HH, Bourque G:
ES cells. Cell 2013, 155:107–120. Transposable elements have rewired the core regulatory network of
12. Santenard A, Ziegler-Birling C, Koch M, Tora L, Bannister AJ, Torres-Padilla ME: human embryonic stem cells. Nat Genet 2010, 42:631–634.
Heterochromatin formation in the mouse embryo requires critical residues 33. Schones DE, Cui K, Cuddapah S, Roh TY, Barski A, Wang Z, Wei G, Zhao K:
of the histone variant H3.3. Nat Cell Biol 2010, 12:853–862. Dynamic regulation of nucleosome positioning in the human genome.
13. Kraushaar DC, Jin W, Maunakea A, Abraham B, Ha M, Zhao K: Genome-wide Cell 2008, 132:887–898.
incorporation dynamics reveal distinct categories of turnover for the 34. Ray-Gallet D, Woolfe A, Vassias I, Pellentz C, Lacoste N, Puri A, Schultz DC,
histone variant H3.3. Genome Biol 2013, 14:R121. Pchelintsev NA, Adams PD, Jansen LE, Almouzni G: Dynamics of histone H3
14. Boyer LA, Plath K, Zeitlinger J, Brambrink T, Medeiros LA, Lee TI, Levine SS, deposition in vivo reveal a nucleosome gap-filling mechanism for H3.3
Wernig M, Tajonar A, Ray MK, Bell GW, Otte AP, Vidal M, Gifford DK, Young to maintain chromatin integrity. Mol Cell 2011, 44:928–941.
RA, Jaenisch R: Polycomb complexes repress developmental regulators in 35. Mavrich TN, Jiang C, Ioshikhes IP, Li X, Venters BJ, Zanton SJ, Tomsho LP, Qi
murine embryonic stem cells. Nature 2006, 441:349–353. J, Glaser RL, Schuster SC, Gilmour DS, Albert I, Pugh BF: Nucleosome
15. Mikkelsen TS, Ku M, Jaffe DB, Issac B, Lieberman E, Giannoukos G, Alvarez P, organization in the Drosophila genome. Nature 2008, 453:358–362.
Brockman W, Kim TK, Koche RP, Lee W, Mendenhall E, O’Donovan A, Presser 36. Kaplan N, Moore IK, Fondufe-Mittendorf Y, Gossett AJ, Tillo D, Field Y, LeProust
A, Russ C, Xie X, Meissner A, Wernig M, Jaenisch R, Nusbaum C, Lander ES, EM, Hughes TR, Lieb JD, Widom J, Segal E: The DNA-encoded nucleosome
Bernstein BE: Genome-wide maps of chromatin state in pluripotent and organization of a eukaryotic genome. Nature 2009, 458:362–366.
lineage-committed cells. Nature 2007, 448:553–560. 37. Radman-Livaja M, Rando OJ: Nucleosome positioning: how is it established,
16. Kraushaar DC, Zhao K: The epigenomics of embryonic stem cell and why does it matter? Dev Biol 2010, 339:258–266.
differentiation. Int J Biol Sci 2013, 9:1134–1144. 38. Huang C, Zhu B: H3.3 turnover: a mechanism to poise chromatin for
17. Meshorer E, Yellajoshula D, George E, Scambler PJ, Brown DT, Misteli T: transcription, or a response to open chromatin? Bioessays 2014, 36:579–584.
Hyperdynamic plasticity of chromatin proteins in pluripotent embryonic 39. Shogren-Knaak M, Ishii H, Sun JM, Pazin MJ, Davie JR, Peterson CL: Histone
stem cells. Dev Cell 2006, 10:105–116. H4-K16 acetylation controls chromatin structure and protein interactions.
18. Dion MF, Kaplan T, Kim M, Buratowski S, Friedman N, Rando OJ: Dynamics of Science 2006, 311:844–847.
replication-independent histone turnover in budding yeast. Science 2007, 40. Svaren J, Horz W: Transcription factors vs nucleosomes: regulation of the
315:1405–1408. PHO5 promoter in yeast. Trends Biochem Sci 1997, 22:93–97.
19. Deal RB, Henikoff JG, Henikoff S: Genome-wide kinetics of nucleosome 41. Boeger H, Griesenbeck J, Strattan JS, Kornberg RD: Removal of promoter
turnover determined by metabolic labeling of histones. Science 2010, nucleosomes by disassembly rather than sliding in vivo. Mol Cell 2004,
328:1161–1164. 14:667–673.
20. Nishiyama A, Xin L, Sharov AA, Thomas M, Mowrer G, Meyers E, Piao Y, Mehta S, 42. Zaret KS, Caravaca JM, Tulin A, Sekiya T: Nuclear mobility and mitotic
Yee S, Nakatake Y, Stagg C, Sharova L, Correa-Cerro LS, Bassey U, Hoang H, Kim E, chromosome binding: similarities between pioneer transcription factor FoxA
Tapnio R, Qian Y, Dudekula D, Zalman M, Li M, Falco G, Yang HT, Lee SL, Monti and linker histone H1. Cold Spring Harb Symp Quant Biol 2010, 75:219–226.
M, Stanghellini I, Islam MN, Nagaraja R, Goldberg I, Wang W, et al: Uncovering 43. Ballare C, Castellano G, Gaveglia L, Althammer S, Gonzalez-Vallinas J, Eyras E,
early response of gene regulatory networks in ESCs by systematic induction Le Dily F, Zaurin R, Soronellas D, Vicent GP, Beato M: Nucleosome-driven
of transcription factors. Cell Stem Cell 2009, 5:420–433. transcription factor binding and gene regulation. Mol Cell 2013, 49:67–79.
21. De Santa F, Barozzi I, Mietton F, Ghisletti S, Polletti S, Tusi BK, Muller H, 44. Huang C, Zhang Z, Xu M, Li Y, Li Z, Ma Y, Cai T, Zhu B: H3.3–H4 tetramer
Ragoussis J, Wei CL, Natoli G: A large fraction of extragenic RNA pol II splitting events feature cell-type specific enhancers. PLoS Genet 2013,
transcription sites overlap enhancers. PLoS Biol 2010, 8:e1000384. 9:e1003558.
22. Kim TK, Hemberg M, Gray JM, Costa AM, Bear DM, Wu J, Harmin DA, 45. Kraushaar DC, Yamaguchi Y, Wang L: Heparan sulfate is required for embryonic
Laptewicz M, Barbara-Haley K, Kuersten S, Markenscoff-Papadimitriou E, Kuhl stem cells to exit from self-renewal. J Biol Chem 2010, 285:5907–5916.
D, Bito H, Worley PF, Kreiman G, Greenberg ME: Widespread transcription 46. Shechter D, Dormann HL, Allis CD, Hake SB: Extraction, purification and
at neuronal activity-regulated enhancers. Nature 2010, 465:182–187. analysis of histones. Nat Protoc 2007, 2:1445–1457.
23. Murakami K, Elmlund H, Kalisman N, Bushnell DA, Adams CM, Azubel M, 47. Barski A, Cuddapah S, Cui K, Roh TY, Schones DE, Wang Z, Wei G, Chepelev I,
Elmlund D, Levi-Kalisman Y, Liu X, Gibbons BJ, Levitt M, Kornberg RD: Zhao K: High-resolution profiling of histone methylations in the human
Architecture of an RNA polymerase II transcription pre-initiation complex. genome. Cell 2007, 129:823–837.
Science 2013, 342:1238724. 48. Chen X, Xu H, Yuan P, Fang F, Huss M, Vega VB, Wong E, Orlov YL, Zhang
W, Jiang J, Loh YH, Yeo HC, Yeo ZX, Narang V, Govindarajan KR, Leong B,
24. Lai AY, Wade PA: Cancer biology and NuRD: a multifaceted chromatin
Shahab A, Ruan Y, Bourque G, Sung WK, Clarke ND, Wei CL, Ng HH:
remodelling complex. Nat Rev Cancer 2011, 11:588–596.
Integration of external signaling pathways with the core transcriptional
25. Kizer KO, Phatnani HP, Shibata Y, Hall H, Greenleaf AL, Strahl BD: A novel
network in embryonic stem cells. Cell 2008, 133:1106–1117.
domain in Set2 mediates RNA polymerase II interaction and couples
49. Ku M, Koche RP, Rheinbay E, Mendenhall EM, Endoh M, Mikkelsen TS, Presser
histone H3 K36 methylation with transcript elongation. Mol Cell Biol 2005,
A, Nusbaum C, Xie X, Chi AS, Adli M, Kasif S, Ptaszek LM, Cowan CA, Lander ES,
25:3305–3316.
Koseki H, Bernstein BE: Genomewide analysis of PRC1 and PRC2 occupancy
26. Li B, Jackson J, Simon MD, Fleharty B, Gogol M, Seidel C, Workman JL,
identifies two classes of bivalent domains. PLoS Genet 2008, 4:e1000242.
Shilatifard A: Histone H3 lysine 36 dimethylation (H3K36me2) is sufficient
50. Kagey MH, Newman JJ, Bilodeau S, Zhan Y, Orlando DA, van Berkum NL,
to recruit the Rpd3s histone deacetylase complex and to repress
Ebmeier CC, Goossens J, Rahl PB, Levine SS, Taatjes DJ, Dekker J, Young RA:
spurious transcription. J Biol Chem 2009, 284:7970–7976.
Mediator and cohesin connect gene expression and chromatin
27. Yamaguchi S, Hong K, Liu R, Inoue A, Shen L, Zhang K, Zhang Y: Dynamics
architecture. Nature 2010, 467:430–435.
of 5-methylcytosine and 5-hydroxymethylcytosine during germ cell
51. Whyte WA, Bilodeau S, Orlando DA, Hoke HA, Frampton GM, Foster CT,
reprogramming. Cell Res 2013, 23:329–339.
Cowley SM, Young RA: Enhancer decommissioning by LSD1 during
28. Xu Y, Wu F, Tan L, Kong L, Xiong L, Deng J, Barbera AJ, Zheng L, Zhang H,
embryonic stem cell differentiation. Nature 2012, 482:221–225.
Huang S, Min J, Nicholson T, Chen T, Xu G, Shi Y, Zhang K, Shi YG:
52. Stadler MB, Murr R, Burger L, Ivanek R, Lienert F, Scholer A, van Nimwegen E,
Genome-wide regulation of 5hmC, 5mC, and gene expression by Tet1
Wirbelauer C, Oakeley EJ, Gaidatzis D, Tiwari VK, Schubeler D: DNA-binding
hydroxylase in mouse embryonic stem cells. Mol Cell 2011, 42:451–464.
factors shape the mouse methylome at distal regulatory regions. Nature
29. Hu G, Cui K, Northrup D, Liu C, Wang C, Tang Q, Ge K, Levens D, Crane-Robinson 2011, 480:490–495.
C, Zhao K: H2A.Z facilitates access of active and repressive complexes to
chromatin in embryonic stem cell self-renewal and differentiation. Cell Stem
doi:10.1186/1756-8935-7-38
Cell 2013, 12:180–192.
Cite this article as: Ha et al.: Genome-wide analysis of H3.3 dissociation
30. Li Z, Gadue P, Chen K, Jiao Y, Tuteja G, Schug J, Li W, Kaestner KH: Foxa2 reveals high nucleosome turnover at distal regulatory regions of embryonic
and H2A.Z mediate nucleosome depletion during embryonic stem cell stem cells. Epigenetics & Chromatin 2014 7:38.
differentiation. Cell 2012, 151:1608–1616.You can also read