Regional Income Disparities and Convergence Clubs in Indonesia: New District-Level Evidence 2000-2017
←
→
Page content transcription
If your browser does not render page correctly, please read the page content below
Munich Personal RePEc Archive

Regional Income Disparities and
Convergence Clubs in Indonesia: New
District-Level Evidence 2000-2017

Aginta, Harry and Gunawan, Anang Budi and Mendez,
Carlos

March 2020

Online at https://mpra.ub.uni-muenchen.de/104264/
MPRA Paper No. 104264, posted 30 Nov 2020 05:25 UTC
Regional Income Disparities and
         Convergence Clubs in Indonesia:
           New District-Level Evidence

                 Harry Aginta ∗                   Anang Gunawan
              Nagoya University                 Nagoya University

                                 Carlos Mendez
                               Nagoya University
                                 November 20, 2020

                                       Abstract
         This paper aims to re-examine the regional convergence hypothesis
      on income in Indonesia over the 2000-2017 period. By applying a
      non-linear dynamic factor model, this paper tests the club
      convergence hypothesis using a novel dataset of income at the district
      level.   The results show significant five convergence clubs in
      Indonesian districts’ income dynamics, implying the persistence of
      income disparity problems across districts even after implementing
      the decentralization policy. The subsequent analysis reveals two
      appealing features regarding the convergence clubs. First, districts
      belonging to the same province tend to be in the same club, and
      second, districts with specific characteristics (i.e., big cities or natural
      resources-rich regions) dominate the highest income club. Overall, our
      findings suggest some insightful policy implications, including the
      importance of differentiated development policies across convergence
      clubs and inter-provincial development strategies.

      Keywords: Regional inequality, Convergence, Indonesia

      JEL Codes: O40, O47, R10, R11

∗
    Corresponding author: aginta.harry@c.mbox.nagoya-u.ac.jp
2 REGIONAL INCOME DISPARITIES AND CONVERGENCE CLUBS IN INDONESIA
1. Introduction
There is a growing recognition that reducing income inequality fosters
sustainable development. Specifically, lower levels of income inequality not
only prevent social conflict, but they are also a prerequisite for achieving
social justice. On the other aspects, some studies also find that income
inequality negatively affects economic growth (Barro, 2008; Ostry et al.,
2014; van der Weide and Milanovic, 2018). Moreover, widening income
inequality gives significant implications for economic growth as well as
macroeconomic stability (Dabla-Norris et al., 2015).
As one of the most heterogeneous countries in the world, Indonesia
consists of hundreds of ethnic groups with many different cultures and
religious beliefs spreading throughout the world’s largest archipelago. In
economic terms, the country has been experiencing high regional
inequality that persist since its independence. The inequality is shown by
the most developed region, particularly in Java and Sumatra islands with
capital intensive processing industries and the isolated regions that are
barely connected to few regions (Hill, 1991). Therefore, one of the main
challenges in Indonesia’s development context is how to reduce regional
inequality and foster regional convergence (Mishra, 2009).
The concern about regional inequality became greater when the
decentralization policy was implemented in 2000 (Nasution, 2016; Mahi,
2016). The worry seems to be reasonable since the decentralization process
in Indonesia was implemented without much preparation, in the sense that
it was not accompanied by adequate institutional capacity or skilled
officials at the local level (Brodjonegoro, 2004; Nasution, 2016). Some
studies even argue that decentralization contributes to the negative growth
of investment (Brodjonegoro, 2004; Tijaja and Faisal, 2014) owing to
increased policy inconsistency and business uncertainty at the regionalNEW DISTRICT-LEVEL EVIDENCE 3 level. Motivated by the limited research and an inconclusive answer about the effect of decentralization on the regional income disparity dynamics, this paper studies the evolution of regional income disparities and prospects for convergence across 514 districts of Indonesia over the 2000-2017 period. This study focuses on the period after the year 2000 because it corresponds to the beginning of Indonesia’s decentralization era. In this era, the state budget is allocated to regions, both to provincial and municipal governments. However, the expected outcome from the decentralizing policy in reducing regional inequality has yet to be seen clearly, partly due to the diverse growth barriers and economic preconditions in each region. Hence, identifying groups of regions facing similar challenges is of particular relevance concerning the formulation of policies aiming to reduce regional disparities. In brief, the results of this paper show that Indonesian districts form five convergence clubs, implying that the growth of income per capita in 514 districts can be clustered into five common trends. This study also finds a ”catching-up effect” within each club where the initially poor districts tend to grow faster than the initially rich districts. Further analysis reveals two appealing features about the convergence clubs. First, districts belonging to the same province tend to be in the same convergence club. Second, the highest income club is dominated by districts with specific characteristics such as big capital cities or resources-rich regions. Furthermore, the implementation of classical convergence tests provides supplementary evidence about convergence speed within each club. This paper contributes to the regional convergence literature in three following ways. First, it is based on a convergence framework that emphasizes the role of regional heterogeneity and the potential existence of multiple convergence clubs. The results of club convergence analysis are
4   REGIONAL INCOME DISPARITIES AND CONVERGENCE CLUBS IN INDONESIA

complemented by two classical tests of convergence,             which are
implemented for each identified club. Second, the analysis is based on a
newly constructed dataset of per-capita income that covers 514 Indonesian
districts over the 2000-2017 period. This granular perspective opens the
possibility of identifying new patterns, which may remain hidden when
using province-level data. Finally, we extend our analysis by applying a
classical convergence test for all convergence clubs to inform the
convergence patterns.
    The remainder of this paper is organized as follows. Section 2 discusses
the related literature about regional disparities and convergence in
Indonesia. Section 3 explains our research methodology, while section 4
presents the data and some stylized facts. The results of the formation of
convergence clubs are presented in Section 5.      Section 6 discusses the
results in the context of classical convergence indicators, the spatial
distribution of the clubs, and policy issues. Finally, Section 7 closes the
paper with concluding remarks.

2. Related literature

2.1 Regional income disparities in Indonesia

A large body of research has been conducted to analyze economic disparity
among regions in Indonesia.      Most of the studies argue that the large
socio-economic disparities among regions in Indonesia are due to larger
unequal economic activities, public infrastructure availability as well as
resource    endowment     (Esmara,    1975;   Akita,   1988;   Garcia   and
Soelistianingsih, 1998; Hill et al., 2008). One of the pioneers of regional
income disparities analysis in Indonesia at the provincial level was
conducted by Esmara (1975).      He studies the inequality of Indonesian
NEW DISTRICT-LEVEL EVIDENCE 5 economic development during 1970’s by analyzing per capita Gross Domestic Product (GDP) without mining sector. The study finds that non-mining per capita income differed by a factor of 12 between the highest and the lowest income region. Using Williamson Index, Akita and Lukman (1995) argue that regional inequality at the provincial level, measured by GDP per capita, had decreased during 1975-1992. However, using non-mining GDP per capita, the regional inequality in the same period remained relatively stagnant. Using a more extended period, Akita et al. (2011) examine the inter-provincial regional income disparities over the 1983-2004 period. The study indicates a large regional gap among the main islands in Indonesia. In addition, they also find large disparities across districts within provinces in the islands. Moving to the different levels of observation, Tadjoeddin et al. (2001) analyze the regional inequality at the district level by examining the Theil and Gini coefficients of GDP per capita from 1993 to 1998. The study shows that regional disparities in Indonesia are stable at the district level during the period of analysis. Similarly, the study of Hill et al. (2008) finds that regional disparities remained relatively unchanged during 1993-1998. However, when oil and gas GDP per capita is excluded from the analysis, the regional inequality kept increasing slightly until 1998. In the context of the post-Asian Financial Crisis (AFC) 1997/98 era, Aritenang (2014) argues that the implementation of the decentralization policy has been considered to increase regional disparities. According to the decentralization law, districts with abundant natural resources earn a higher share of revenue than their provincial government and their peers in the same province. Therefore, a natural resources-rich district receives a higher revenue share and tends to grow faster. In the end, this might increase disparities among districts.
6       REGIONAL INCOME DISPARITIES AND CONVERGENCE CLUBS IN INDONESIA

2.2 Regional income convergence

A central prediction of the standard neoclassical growth model is that
under common preferences and technologies, economies would tend to
converge to a common long-run equilibrium (Barro and Sala-I-Martin,
1992; Mankiw et al., 1992; Islam, 2003; Barro and Sala-I-Martin, 2004).1
There is a large literature that aims to test this prediction both across and
within countries.       Compared to national economies, the administrative
regions within a country are more likely to share common preferences,
technologies, and institutions.             Thus, empirically testing for income
convergence across regions within a country has become a central topic in
the regional growth literature.
        The seminal contributions of Barro (1991) and Barro and Sala-I-Martin
(1992) document regional income convergence across the states in the
United States, the prefectures of Japan, and the subnational regions of
Europe. Interestingly, in all these cases, regions appear to be converging at
a similar speed: 2% per year. These convergence dynamics imply that
regional differences within each country would be halved in about 35 years
(Abreu et al., 2005). These results have triggered a large empirical literature
that aims to test the regional convergence hypothesis (Sala-I-Martin, 1996a;
Magrini, 2004, 2009). From a methodological perspective, most papers
evaluate convergence using two complementary analyses.                        On the one
hand, an analysis of sigma (σ) convergence evaluates whether the income
dispersion decreases over time.             On the other, an analysis of beta (β)

    1
    Although the original conception of the Solow growth model aims to explain the
evolution of a single economy over time, its convergence prediction has been empirically
tested across multiple countries, regions, industries, and firms. As a result, the convergence
hypothesis has been studied from multiple perspectives. The recent work of Johnson and
Papageorgiou (2020) provides a survey of the cross-country convergence literature. Magrini
(2004) provides a survey of the regional convergence literature. The work of Rodrik (2013) is
one of the most influential papers in the industrial convergence literature, and the work of
Bahar (2018) evaluates convergence across firms.
NEW DISTRICT-LEVEL EVIDENCE 7 convergence evaluates whether initially poor economies grow faster than initially rich regions. These two analyses are also related in the sense that beta convergence is necessary but not sufficient for sigma convergence (Sala-I-Martin, 1996a). More recently, the convergence literature has been shifting its focus from the classical emphasis on average behavior and common long-run equilibrium to a new emphasis on heterogeneous behavior and multiple equilibria (Apergis et al., 2010; Bartkowska and Riedl, 2005; Zhang et al., 2019). This approach emphasizes the notion that, even within countries, there could be persistent differences in endowments, preferences, and technologies. As such, regional economies may not smoothly converge to a unique long-run equilibrium, but instead, multiple convergence clubs may characterize the regional economic system. 2.3 Regional income convergence in Indonesia Many scholars have conducted studies on inequality at the regional level in Indonesia using various convergence frameworks (see Table 1). Garcia and Soelistianingsih (1998) employ beta convergence method to investigate the existence of convergence in income per capita across provinces during 1975-1993. The study shows that regional income disparities tend to converge, and it may take between thirty to forty years to reduce income differences by half. However, Hill et al. (2008) argue that the results of convergence by Garcia and Soelistianingsih (1998) are sensitive to the period analyzed and the unstable performance of the oil and gas sector. Also, the study of Hill et al. (2008) shows that during the financial crisis and its aftermath, that is from 1997 to 2002, there was no significant convergence at the regional level. Similarly, using conventional estimation of sigma and beta convergence, Tirtosuharto (2013) does not find regional
8       REGIONAL INCOME DISPARITIES AND CONVERGENCE CLUBS IN INDONESIA

convergence during the Asian financial crisis, the recovery period, and the
beginning of the decentralization era.
        At the district level, the study by Akita (2002) shows a similar conclusion
that regional income inequality increased during 1993-1997. This result
does not contradict other studies at the provincial level since it shows that
inequality increased among certain districts within some provinces. In
addition, Akita et al. (2011) show that when the Asian financial crisis hit in
1997, regional inequality has declined since some big cities were hit harder
than less developed districts. However, during the recovery period, regional
inequality increased again until 2004 and remained uncertain afterwards.
        Analysis at the district level has also been conducted by Aritenang (2014)
using exploratory analysis, Spatial Autoregressive (SAR) Lag Model, and
Spatial Error Model (SEM) to capture the spatial effects. By considering the
role of the neighborhood, the study finds that the convergence rate is
higher throughout the decentralization era.                A similar approach was
conducted by Vidyattama (2013). However, the result of the study indicates
inconclusive finding on convergence. The Williamson index measurement
shows slight increases, although insignificant, while the beta convergence
estimates reveal convergence at both the district and the provincial levels
during 1999-2008.          In addition, the study needs a longer period of
observation since the overall trend of convergence is still very weak.
        Another recent study was conducted by Kurniawan et al. (2019) by
applying club convergence analysis on provincial dataset from 1969 to
2012.        In their study, some missing data at the provincial level are
interpolated in order to build a balanced panel dataset. The results show
two convergence clubs in terms of all investigated variables.2                  Using a
similar method, Mendez and Kataoka (2020) examine the disparities in

    2
    The study examines the dynamics of four socio-economic indicators: per capita gross
regional product, the Gini coefficient, the school enrolment rate, and the fertility rate.
NEW DISTRICT-LEVEL EVIDENCE 9
Table 1: Studies on per capita income convergence in Indonesia
Author(s) Observation Methods Findings
(26 provinces)
Garcia and Absolute and Results: Absolute convergence;
1975-1993
Soelistianingsih conditional beta conditional convergence
1980-1993
(1998) convergence increases convergence speed.
1983-1993
(27 provinces
Results: Convergence at province
and Williamson’s
and no convergence at district level.
303 districts) weighted coefficient of
Akita (2002) The mining sector matters and
1975-1983 variation (CVw)
income inequality at the district
1983-1993 and Theil index
level increases in1993-1997.
1993-1999
Results: Convergence before the
Asian Financial Crisis (AFC) 1997
Unconditional
Hill et al. (26 provinces) and no convergence after the AFC.
and conditional
(2008) 1975-2004 The speed of convergence declines
beta convergence
along with the decreasing in the
mining sector.
Results: Convergence before
the AFC 1997 and no convergence
Akita et al. (26 provinces) Bi-dimensional after the AFC. The convergence
(2011) 1983-2004 decomposition before the AFC is due to poorer
performance of the resource-rich
provinces.
(26 provinces) Sigma convergence Results: No sigma convergence,
Tirtosuharto
1997-2000 and unconditional beta convergence in 1997-2000 and
(2013)
2001-2012 beta convergence no beta convergence in 2001-2012.
(26 provinces Unconditional beta Results: Insignificant convergence in
Vidyattama and convergence, Spatial income per capita and significant
(2013) 294 districts) Autoregressive Lag, convergence in HDI at both province
1999-2008 and Spatial Error Model and district levels.
(292 districts) Spatial autocorrelation,
Results: Strong evidence of spatial
Aritenang 1994-2004 Spatial Error Model, and
autocorrelation, the convergence rate
(2014) 1994-2000 Spatial Autoregressive
is higher during decentralization.
2001-2004 Lag Model
Kurniawan et al. (33 provinces) Results: Two convergence clubs in
Club convergence
(2019) 1969-2012 four socio-economic indicators.
Results: Two convergence clubs in
Mendez and labor productivity, four clubs in
(26 provinces)
Kataoka Club convergence physical capital, two clubs in human
1999-2010
(2020) capital, and unique convergence club
in efficiency.
Source: Authors’ documentation from many sources.10 REGIONAL INCOME DISPARITIES AND CONVERGENCE CLUBS IN INDONESIA labor productivity, capital accumulation, and efficiency across 26 provinces from 1990 to 2010. The study finds that labor productivity, physical capital, and human capital are characterized by two, four, and two convergence clubs, respectively. Meanwhile, a unique convergence club is found to be related to the efficiency variable. The study suggests the importance of capital accumulation and efficiency improvements in promoting productivity growth as well as reducing the disparities among regions in Indonesia. 3. Methodology 3.1 Classical beta and sigma convergence The most common method of convergence analysis is mainly based on classical models such as namely sigma convergence and beta convergence (Bernard and Durlauf, 1995; Hobijn and Franses, 2000; Phillips and Sul, 2007). Sigma convergence refers to the decreasing in growth dispersion (in most cases, the growth of income per capita) across countries or regions over time. Differently, beta convergence is seen in negative correlation between the initial level of income capita and its growth. Implicitly, this means that low-income countries tend to grow relatively faster than high-income countries and thus are able to catch up (Barro, 1991; Barro and Sala-I-Martin, 1992). The concept of beta convergence can be differentiated into absolute and conditional convergence (Islam, 1995, 2003; Mankiw et al., 1992; Sala-I-Martin, 1996b). On one side, absolute beta convergence assumes that countries will approach a particular common steady-state growth path over time, given the variability in the initial condition of each country. On the other side, the notion of conditional beta convergence implies
NEW DISTRICT-LEVEL EVIDENCE                         11

convergence occurs towards different paths of steady-state growth given
the assumption that countries have distinctive characteristics, such as
accumulation in human and physical capital, institution, economic and
political system, and other factors affecting economic growth.           Many
researchers find that the dispersion of income per capita across economies
follows the patterns of clusters rather than the direction of a common
growth path (Quah, 1996; Phillips and Sul, 2009; Basile, 2009). This is not
only true for largely diversified cases such as cross country analysis, but this
trend has also been observed in more integrated economies like those in
Western Europe (Corrado et al., 2005).
   Some studies also started to find convergence patterns across countries,
regions, industries, etc., when analyzing socio-economic variables (Barro,
1991; Barro and Sala-I-Martin, 1992). According to Barro and Sala-I-Martin
(1992), this convergence pattern can be generalized as follows:

                              yiT     [1 − e−βT ]
               (1/T ) · log       =α−             · log(yi0 ) + wi,0T        (1)
                              yi0         T

where y is the analyzed variable, i represents a region, 0 and T are the initial
and final times, β is known as the speed of convergence, α includes
unobserved parameters including the steady-state and wi,0T is the error
term.    Referring to equation (1), if there are robust signs of beta
convergence, then a different parameter known as the ”half-life” can be
defined as follows:
                                                   log2
                                  half · lif e =                             (2)
                                                     β
This parameter indicates the time required for the average region to reduce
the gap between its initial and the final equilibrium state by half.
12 REGIONAL INCOME DISPARITIES AND CONVERGENCE CLUBS IN INDONESIA
3.2 Relative convergence test
Phillips and Sul (2007) develop log t convergence test, an innovative
method to investigate the existence of multiple convergence clubs based on
a clustering algorithm. This method is favorable because of its superiority
in the sense that it allows the time series not to be co-integrated, thus
allowing individual observation to be transitionally divergent (Bartkowska
and Riedl, 2005). The method also concludes that the absence of
co-integration in respective time series does not necessarily deny the
existence of convergence (Phillips and Sul, 2007). Due to its advantages,
numerous researchers have utilized this approach with applications in
convergence analysis on various economic indicators such as per capita
income, financial development, and energy.
The relative convergence test suggested by Phillips and Sul (2007, 2009)
is based on the decomposition of the panel-data variable of interest in the
following way:
yit = git + ait (3)
where git is a systematic component and ait is a transitory component.
To separate common from idiosyncratic components, equation 3 can be
transformed with a time-varying factor as follows:
git + ait
yit = µt = δit µt (4)
µt
where δit contains error term and unit-specific component and thus
represents an idiosyncratic element that varies over time, and µt is a
common component.
To be more specific, the transition path of an observed economy
towards its own equilibrium growth path is explained by δit , while µt depicts
a hypothesized equilibrium growth path that is common to all economies.NEW DISTRICT-LEVEL EVIDENCE 13
Equation 4 is therefore a dynamic factor model containing a factor loading
coefficient δit that represents the idiosyncratic distance between a common
trending behavior, µt , and the dependent variable, yit . Furthermore, to
characterize the dynamics of the idiosyncratic component, δit , Phillips and
Sul (2007) propose the following semi-parametric specification:
σi ξit
δit = δi + (5)
log (t) tα
where δi represents the heterogeneity of each economy but constant over
time, ξit is a weakly time-dependent process with mean 0 and variance 1
across economies. Under the condition given in equation 5, convergence
occurs when all economies move to the same transition path as such,
lim δit = δ and α ≥ 0 (6)
t→∞
In order to estimate the transition coefficient δit , Phillips and Sul (2007)
construct a relative transition parameter, hit , as
yit δit
hit = 1
PN = 1
PN (7)
N i=1 yit N i=1 δit
where the common component, µt in equation 4 is eliminated by dividing
the independent variable, yit , with the panel average. Thus, hit represents
the transition path of economy i against the level of cross-sectional average,
implying the calculation of individual economic behaviors relative to other
economies. Then, hit converges to unity, that is hit → 1, when t → ∞.
Later, the notion of convergence can be transformed into the following
equation that describes the cross-sectional variance of hit ,
N
1 X
Ht = (hit − 1)2 → 0 (8)
N i=114 REGIONAL INCOME DISPARITIES AND CONVERGENCE CLUBS IN INDONESIA
where the cross-sectional variance converges to zero, Ht → 0.
The null hypothesis in equation 6 is verified in counter to the alternative
hypothesis HA : δi 6= δ for all i or α ≥ 0. Finally, Phillips and Sul (2007)
empirically evaluate this null hypothesis by using the following log t
regression model:
H1
log Ht
− 2 log{log(t)} = a + b log(t) + εt
(9)
for t = [rT ], [rT ] + 1, . . . , T with r > 0
where rT is the initial observation in the regression, which implies that the
first fraction of the data (that is, r) is discarded.
Based on Monte Carlo experiments, Phillips and Sul (2007) suggest
applying r = 0.3 when the sample is small or moderate T ≤ 50. A fairly
conventional inferential procedure is also suggested for equation 9. To be
more specific, a one-sided t test with heteroskedasticity-autocorrelation
consistent (HAC) standard errors is used. In this setting, the null hypothesis
of convergence is rejected when the t-statistics (tb̂ ) is smaller than -1.65.
3.3 Clustering algorithm
Even though the null hypothesis of overall convergence in the full sample is
rejected, it does not necessarily mean that the convergence in the
subsample of the panel is not present. Therefore, following Phillips and Sul
(2007), we exploit the feature of the model in equation 7 to reveal the
presence of multiple convergence clubs in subsample. For that purpose, we
use an innovative data-driven algorithm developed by Phillips and Sul
(2009), which can be summarized in the following four steps:
1. Ordering : Sample units (districts) are arranged in a decreasing order
according to their observation in the last period. In this paper, theNEW DISTRICT-LEVEL EVIDENCE 15
ordering is conducted using the average of the last 13 .
2. Constructing the core group: A core group of sample units (districts) is
identified based on the first k unit of the panel data set (2 ≤ k ≤ N ).
If the tb̂ of the k unit is larger than -1.65, the core group formation is
established. If the tb̂ in the first k unit is smaller than -1.65, the first
unit is dropped, and then the log t test for the next units is conducted.
The step is continued until the tb̂ of the pair units is larger than -1.65.
If there are no pairs of units showing tb̂ larger than -1.65 in the entire
sample, it can be concluded that there are no convergence clubs in the
panel.
3. Deciding club membership: Sample units (districts) not belonging to
the core group are re-evaluated once at a time with log t regression.
A new group is formed when the tb̂ is larger than -1.65. Otherwise, if
the additional units give a result that tb̂ is smaller than -1.65, then the
convergence club only consists of the core group.
4. Iteration and stopping rule: The log t regression is applied for the
remaining sample units (districts). If the process shows the rejection
of the null hypothesis of convergence, steps 1 to 3 are performed
again. The remaining sample units (districts) are labeled as divergent
if no core group is found, and the algorithm stops.
The representation of the relative transition curve for different
economies in the club convergence framework can be illustrated in Figure
1. The figure clearly shows that the transition curves for different regions
form a funnel. The four regions, which are region A, B, C, and D, differ in
their initial conditions as well as in their transition paths. However, region A
and region B’s relative transition curve converge into the same value, which
is Club 1. In comparison, region C and region D are characterized by16 REGIONAL INCOME DISPARITIES AND CONVERGENCE CLUBS IN INDONESIA
Region A
h1 Club 1
Region B
Cross-sectional average
Region C
h2
Club 2
Region D
1 t time
Figure 1: An illustration of transition paths and convergence clubs
medium and low initial conditions, consecutively reflecting a typical
developing region with a slow growth rate and a poor region that grows
rapidly. With time, the transition path of both regions converge into Club 2.
4. Data and stylized facts
4.1 Data construction
This study uses annual GDP per capita at the district level from 2000 to
2017. However, not all of the data are available for every year in each
district. In addition, there are some missing observations caused by the
splitting up of new districts during the decentralization period. Since the
club convergence test of Phillips and Sul (2007) requires balanced panel
data, we constructed a balanced panel dataset of 514 districts by solving theNEW DISTRICT-LEVEL EVIDENCE 17
missing observations through interpolation/imputation.3 Similar with the
study of Kurniawan et al. (2019), the imputation process in our study was
conducted using a linear regression method with the year and reference
districts as candidates of regressors. Hence, since we only predicted the
missing values from its trend, it would not significantly alter the
convergence results.4 Table 2 shows the descriptive statistics of the dataset.
Table 2: Descriptive statistics
Mean Standard deviation Max/Min
2000 2017 2000/2017 2000 2017 2000/2017 2000 2017
GDP per capita (in thousand IDR) 25,032 36,041 0.69 62,172 42,823 1.45 465.40 105.05
Log of GDP per capita 9.57 10.20 0.94 0.81 0.67 1.20 1.81 1.56
Trend log of GDP per capita 9.57 10.20 0.94 0.81 0.68 1.20 1.81 1.56
Relative trend of log GDP per capita 1.00 1.00 1.00 0.08 0.07 1.28 1.81 1.55
As mentioned in the methodology, we transformed the GDP per capita
data into a log form. Like common macroeconomic data, the GDP per
capita has two prominent features, which are long-run growth trends in
aggregate and a cyclical component that represents fluctuations in the
shorter periods, known as the business cycles. When analyzing business
cycles in observed data by regression or filtering, it is necessary to isolate
the cyclical component from the trend (Phillips and Shi, 2019). Therefore,
following Uhlig and Ravn (2002), we filtered the GDP per capita series using
Hodrick-Prescott (HP) filter technique with smoothing parameter (λ)
equals to 6.25.
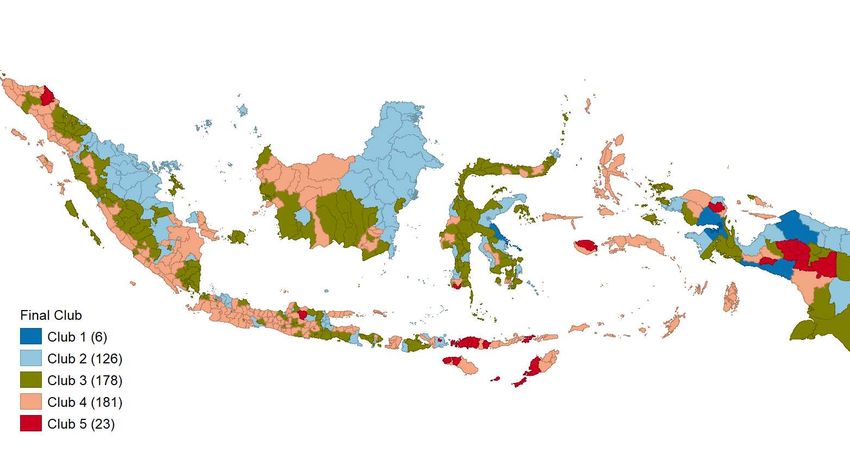
3
We combined actual data of the new districts and the reference districts and compared
them to ensure that measurement error caused by the interpolation is minimum. Details of
this interpolation process are provided in Appendix A.
4
For the robustness check of our interpolation results, we implemented sigma and
beta convergence tests using the number of districts in the year 2000 (342 districts). As
reported in Appendix E, we found no significant difference in sigma and beta convergence
coefficients between the full sample of 514 districts and the smaller number of districts.18 REGIONAL INCOME DISPARITIES AND CONVERGENCE CLUBS IN INDONESIA
4.2 Stylized facts on regional disparities in Indonesia
This subsection illustrates how income disparities across districts in
Indonesia have evolved over time. Figure 2 measures regional disparities as
the standard deviation of the log of GDP per capita. This measurement
approach is commonly used in the regional growth literature and is
generally referred to as the study of sigma convergence (Barro and
Sala-I-Martin, 1992; Magrini, 2004; Sala-I-Martin, 1996b). A process of
sigma convergence occurs when regional disparities decrease over time.
Figure 2 highlights this process by pointing out that the standard deviation
of the log of GDP per capita has been systematically decreasing over the
2000-2017 period.
.8
SD of Log GDP per capita
.75
.7
.65
2000 2005 2010 2015 2020
Figure 2: Evolution of regional disparities: Sigma convergence approach
Notes: GDP refers to the district-level gross domestic product, and it is measured based
on constant prices of 2010. The source of the data is the Central Bureau of Statistics of
Indonesia and interpolation results.
We also show the process where the initially poor regions are catching
up and growing faster than initially rich regions. This catching-up process is
largely documented in the economic growth literature and is referred to asNEW DISTRICT-LEVEL EVIDENCE 19
the study of beta convergence (Barro and Sala-I-Martin, 1992; Magrini, 2004;
Sala-I-Martin, 1996b). Figure 3 highlights this process by pointing out that
regions with a low GDP per capita in 2000 have grown faster than initially
rich regions over the 2000-2017 period. Interestingly, the richest regions in
1990 experienced large negative growth rates in subsequent years. Thus, the
(beta) convergence process is arising not only because of the faster growth of
the poorest regions but also because of a systematic reduction in the income
of the richest regions.
2
Growth Rate 2000-2017
1
0
-1
-2
8 10 12 14
Log GDP per capita in 2000
Figure 3: Evolution of regional disparities: Beta convergence approach
Notes: GDP refers to the district-level gross domestic product, and it is measured based
on constant prices of 2010. The source of the data is the Central Bureau of Statistics of
Indonesia and interpolation results.
By construction, the summary statistics of sigma and beta convergence
only describe the behavior of an average or representative economy
(Magrini, 2004). They fail to describe more complex convergence dynamics
that could occur beyond the mean of the income distribution. They also fail
to accommodate the notions of multiple equilibria and convergence clubs,
which could arise when the regions’ performance is highly heterogeneous.20 REGIONAL INCOME DISPARITIES AND CONVERGENCE CLUBS IN INDONESIA
In Indonesia’s context, a high degree of regional heterogeneity has been
previously documented using province-level data. Moreover, it has been
argued that only focusing on average patterns is likely to be incomplete at
best or misleading at worst (Mendez and Kataoka, 2020). In an attempt to
start documenting the degree of regional heterogeneity using district-level
data of recent years, Figures 4 and 5 show the evolution of regional
disparities beyond the scope of the average or median district.
Figure 4 shows how the quantiles of the distribution have evolved over
time. Panel (a) indicates that when we evaluate the regional dynamics of
GDP per capita, within any logarithm transformation, regional disparities
have been increasing over time. Increasing disparities are evident not only
when we measure the gap between the quantile 95 and quantile 5, but also
when we measure the gap between the quantile 75 and 25. In the statistics
literature, this latter gap is referred to as the interquartile range (IQR) and is
commonly used as a dispersion statistic that is robust to extreme values.5
Panels (b) and (c) indicate that the logarithm version of GDP per capita
shows less diverging dynamics. Despite of this transformation, the IQR,
which encompasses half of the entire distribution, shows very little signs of
regional convergence. Panel (d) normalizes the trend of log GDP by the
cross-sectional mean of each year. This transformation helps to remove the
common increasing trends observed in panels (b) and (c). Based on this
transformation, regional disparities have been evolving differently within
the income distribution. Most of the reduction in the disparities arises from
the tails of this distribution, particularly the upper tail. In contrast,
disparities around the center of the distribution show little change. The size
of the IQR has been almost constant over the entire 2000-2017 period.
Figure 5 provides a more detailed perspective on the dynamics reported
5
In the convergence literature, the IQR is also used to study sigma convergence (Mendez-
Guerra, 2018).NEW DISTRICT-LEVEL EVIDENCE 21
11.5
75000 11.0
Log of GDP per capita
Quantile Quantile
GDP per capita
q95 10.5 q95
50000 q75 q75
10.0
q50 q50
q25 9.5 q25
25000 q05 q05
9.0
8.5
2000 2005 2010 2015 2000 2005 2010 2015
(a) GDP per capita (b) Log GDP per capita
11.5
Relative Trend Log of GDP per capita
1.15
Trend Log of GDP per capita
11.0
Quantile 1.10 Quantile
10.5 q95 q95
1.05
q75 q75
10.0
q50 q50
1.00
9.5 q25 q25
q05 q05
0.95
9.0
0.90
8.5
2000 2005 2010 2015 2000 2005 2010 2015
(c) Trend log GDP per capita (d) Relative trend log GDP per capita
Figure 4: Evolution of regional disparities: Distributional quantile approach
Notes: GDP refers to the district-level gross domestic product, and it is measured based
on constant prices of 2010. The source of the data is the Central Bureau of Statistics of
Indonesia and interpolation results.22 REGIONAL INCOME DISPARITIES AND CONVERGENCE CLUBS IN INDONESIA
1.4
Relative Trend Log GDP per capita
1.2
1
.8
2000 2005 2010 2015 2020
Figure 5: Evolution of regional disparities: Relative convergence approach
Notes: GDP refers to the district-level gross domestic product, and it is measured based
on constant prices of 2010. The source of the data is the Central Bureau of Statistics of
Indonesia and interpolation results.NEW DISTRICT-LEVEL EVIDENCE 23
in Figure 4d. Instead of just displaying five hypothetical regions, Figure 5
shows the actual dynamics of all regions.6 Its main finding is consistent
with that of Figure 4; that is, the process of regional convergence is not
homogeneous across the distribution of districts. Regions at the top of the
distribution are converging faster than those at the bottom. Regions around
the middle of the distribution show little progress in the reduction of
regional disparities.
5. Results
5.1 Relative convergence test
After applying the log t test to the income per capita data across 514
Indonesian districts over the 2000-2017 period, we were able to reject the
null hypothesis of overall convergence at the 5% significant level, where b̂ is
significantly < 0 and tb̂ is −22.28 (see Table 3). This implies that
convergence for all districts is not present, indicating that the income
growth process of 514 Indonesian districts from 2000 to 2017 does not show
a single equilibrium steady-state. This finding is consistent with the
empirical evidence documented in the study of Hill et al. (2008), where no
significant convergence was observed after the 1997/98 Asian financial
crisis period, as opposed to significant convergence before the crisis.7 Our
finding also supports the study of Tirtosuharto (2013), who concludes the
lack of regional convergence for the period from 2003 to 2012 following
economic recovery from the Asian financial crisis and the beginning of the
6
As regions can change their ranking in the income distribution, the quantiles of Figure
4 do not necessarily track the performance of a unique region over time.
7
The study of Hill et al. (2008) shows the variability in the pace of beta convergence
across subperiod during 1975-2002; 2% during the oil boom (1975-81), 2.8% in the era of
major policy reforms (1981-86), 1.7% for the period 1986-92 as the export-oriented reforms
took place, 1% during the 1990s, and no convergence in the crisis and post-crisis period.24 REGIONAL INCOME DISPARITIES AND CONVERGENCE CLUBS IN INDONESIA
decentralization era.
Table 3: Global convergence test
Coefficient Standard Error t-statistic
log(t) -0.52 0.02 -22.28
Note: The null hypothesis of convergence is rejected when
the t-statistic is less than -1.65.
This lack of overall convergence also entails policy implications related
to the implementation of the decentralization policy in Indonesia after the
crisis. As pointed out by Azis (2008) and Nasution (2016), by and large, the
performance of regional growth after the decentralization has been
unsatisfying. One of the major causes of this unexpected outcome is the
variability in the capacity of regional institutions and local leaders to
leverage local resources, in addition to counterproductive policies issued by
local governments (e.g., imposing hidden fees, allocating funds to
unnecessary projects), and inflexible and over-regulated national policies.
Therefore, to avoid potential detrimental effect of decentralization on
regional disparities, in particular developing countries like Indonesia, the
regional government is required to improve the quality of institutional
factors such as accountability, people’s empowerment as well as
redistribution capacity (Azis, 2008; Rodriguez-Pose and Ezcurra, 2010).
5.2 Clustering algorithm and convergence clubs
Although overall convergence across Indonesian districts does not prevail,
the log t test brings the possibility to observe the existence of several
convergence clusters, as explained in Section 3.3. Therefore, we applied theNEW DISTRICT-LEVEL EVIDENCE 25
test procedure to investigate convergence clubs. As shown in Table 4, we
found five significant initial clubs.8 The first convergence club consists of 6
districts; the second club consists of 126 districts; the third club consists of
178 districts; the fourth club contains 181 districts, and the fifth club
consists of 23 districts. The rows correspond to the fitted coefficients and
t-statistic in each club.
The order of the convergence clubs is sorted from the districts with the
highest to the lowest GDP per capita, that is, Club 1 refers to the highest
GDP per capita group and Club 5 displays the lowest GDP per capita group.
The result of this club convergence test implies that the development of
income per capita in 514 Indonesian districts can be grouped into five
common trends during 2000-2017.
Table 4: Local convergence test
Club1 Club2 Club3 Club4 Club5
Coefficient 0.42 -0.08 0.37 -0.04 0.49
t-statistic 4.97 -1.52 5.26 -1.60 6.55
N. of regions 6 126 178 181 23
Note: The null hypothesis of convergence is rejected when the t-
statistic is less than -1.65.
Then, following Phillips and Sul (2009), we checked the possibility of
whether any of those identified clubs can be merged to form larger
convergence clubs.9 As shown in Table 5, the club merging test result
suggests that the convergence hypothesis is rejected (b̂ is significantly < 0
and tb̂ is smaller than -1.65). Hence, the initial five clubs are confirmed as
8
See Appendix B for complete members of each club.
9
The clubs merging steps are outlined in Appendix C.26 REGIONAL INCOME DISPARITIES AND CONVERGENCE CLUBS IN INDONESIA
the final convergence clubs.
Table 5: Clubs merging test
Club1+2 Club2+3 Club3+4 Club4+5
Coefficient -0.14 -0.27 -0.30 -0.20
t-statistic -3.08 -6.99 -15.44 -9.52
Note: The null hypothesis of convergence is rejected when the t-
statistic is less than -1.65.
Furthermore, measuring the gap between clubs is also useful to
understand the income disparities among convergence clubs. For this
purpose, we show the mean per capita income of each club in the second
column of Table 6. The statistics suggest that the gap of income per capita
between clubs is arguably large, particularly between Club 1 and Club 2,
where the average income per capita of districts in Club 1 is IDR 231
million, about four times larger than that in Club 2. This implies that Club 2
has very little progress in catching up with Club 1. Table 6 also reflects
severe income inequality problems among districts in Indonesia, where the
average income per capita in the last club is only about 3% of the that in the
first club.NEW DISTRICT-LEVEL EVIDENCE 27
Table 6: Characteristics of the clubs 2000-2017
Mean Std. Deviation Min Max
Club 1 231,289 196,580 7,058 932,664
Club 2 56,961 58,557 7,718 658,303
Club 3 20,090 12,178 3,402 304,400
Club 4 13,469 7.952 4,005 194,717
Club 5 7,549 5.959 2,004 59,292
Note: The income per capita data is in a thousand IDR.
Figure 6 shows the transition paths of members in each club by
comparing income per capita of each district (in log form) relative to clubs’
average. All five clubs exhibit different convergence behaviors and
transition paths within the club, depending on each district’s initial
conditions and development process. We also capture one asymmetric
transition pattern within the club. On the one hand, some districts with a
higher level of income at the initial period experience a sufficiently large
income reduction at the final period and move downwards to the club’s
average level. Most of these districts are those relying on natural resources
(e.g., mining and natural gas processing) such as Mimika (Club 1), Bontang
(Club 2), Lhokseumawe (Club 3), Aceh Utara (Club 4), and Aceh Timur
(Club 5). The last three districts also suffer from prolonged security issues
that led to the Martial Law enactment in 2003, followed by the Tsunami
disaster in 2004. On the other hand, none of the districts with a lower
income level at the initial period record significant improvement. This
asymmetrical pattern implies that the convergence process within clubs
(particularly Club 4 and 5) is influenced by the depleting income in28 REGIONAL INCOME DISPARITIES AND CONVERGENCE CLUBS IN INDONESIA wealthier districts. Similar to Figure 4d, in Figure 7 we plot the transition paths of clubs over time. However, instead of using the absolute income per capita (in log form) on Y axes, in Figure 7 we compare the transition of clubs relative to the cross-sectional average of all clubs. The parallel pattern of the clubs’ transition path indicates that the clubs do not converge over time. Even though Club 3 appears to slightly close its gap to Club 2, the transition path of the other clubs reflects prolonged and stable dispersion between clubs, where Club 4 and 5 are systematically below the average, while Club 1 and 2 are consistently above the average.
NEW DISTRICT-LEVEL EVIDENCE                                         29

                                        Club 1                                             Club 2
     Log GDP per capita

                                                          Log GDP per capita
                          1.4                                                  1.4
       Relative Trend

                                                            Relative Trend
                          1.2                                                  1.2

                           1                                                    1

                           .8                                                   .8
                             2000 2005 2010 2015 2020                             2000 2005 2010 2015 2020

                                        Club 3                                             Club 4
     Log GDP per capita

                                                          Log GDP per capita
                          1.4                                                  1.4
       Relative Trend

                                                            Relative Trend

                          1.2                                                  1.2

                           1                                                    1

                           .8                                                   .8
                             2000 2005 2010 2015 2020                             2000 2005 2010 2015 2020

                                        Club 5
     Log GDP per capita

                          1.4
       Relative Trend

                          1.2

                           1

                           .8
                             2000 2005 2010 2015 2020

                                Figure 6: Convergence clubs and transition paths

Notes: GDP refers to the district-level gross domestic product, and it is measured based
on constant prices of 2010. The source of the data is the Central Bureau of Statistics of
Indonesia and interpolation results.
30 REGIONAL INCOME DISPARITIES AND CONVERGENCE CLUBS IN INDONESIA
1.2
Relative Trend Log GDP per capita
1.1
1 Club = 1
Club = 2
Club = 3
Club = 4
.9 Club = 5
2000 2005 2010 2015 2020
Figure 7: Convergence clubs trends
Notes: GDP refers to the district-level gross domestic product, and it is measured based
on constant prices of 2010. The source of the data is the Central Bureau of Statistics of
Indonesia and interpolation results.
5.3 Sensitivity to the trend estimation
We also implemented the log t test by using the smoothing parameter (λ) of
Hodrick-Prescott (HP) filter equals to 400, which is used in the study of
Phillips and Sul (2007). Similar to the results discussed in the previous
section, the existence of global convergence is rejected at the 5% significant
level (b̂ is significantly < 0 and tb̂ is −23.02). Then we proceeded with the
club convergence test by following the same procedures discussed in
Section 3.3. We found twelve convergence clubs initially. Next, we applied
the merging test procedure to investigate whether any of those initial
subgroups can be merged to form convergence clubs with a larger number
of members.
As a result, we also found five final significant convergence clubs. TheNEW DISTRICT-LEVEL EVIDENCE 31
Table 7: Characteristics of the clubs, 2000-2017 (Trend parameter 400)
Mean Std. Deviation Min Max
Club 1 198,036 166,863 7,058 932,664
Club 2 50.595 39,595 3,531 417,149
Club 3 20,534 12,502 2,102 304,400
Club 4 11,825 3,505 4,292 59,292
Club 5 5,809 1,746 2,004 10,376
Note: The income per capita data is in a thousand IDR.
first and second initial clubs merge into first convergence club with 14
members while the third initial club becomes the second club with 106
members. Next, the third new club is formed by the fourth, fifth, and sixth
initial clubs with 240 members and becomes the largest final club (47% of
the total number of districts). Next, the fourth final club is constructed by
clubs 7, 8, 9, 10, and 11 of the initial clubs with 132 members. Finally, the
twelfth (the last) initial club stays unmerged with 22 members (details of
results are presented in Appendix D). Consistent with the previous analysis,
the statistics shown in Table 7 also imply a huge income gap among clubs.
Referring to the average of per capita income in all clubs, one may quickly
capture that the biggest income gap lies between Club 1 and Club 2, while
the income gap between districts in lower clubs (Club 4 and Club 5) is
much smaller.32 REGIONAL INCOME DISPARITIES AND CONVERGENCE CLUBS IN INDONESIA 6. Discussion 6.1 Convergence within clubs This section evaluates the convergence patterns within each club using the classical frameworks of sigma and beta convergence. Figure 8 shows the evolution of the standard deviation of the log of GDP per capita for each club. All sub-figures share the same axes in order to facilitate comparability between clubs. Consistent with Figure 6, there is a stronger process of convergence within clubs than between clubs. In particular, the districts of Club 1 (see Appendix B for a detailed list) show the largest reduction in regional disparities. Although the other clubs start from lower levels of disparities, they show relatively less progress over time. Figure 9 shows the negative relationship between the initial level of income and its subsequent growth rate. Within each club, initially poor regions are growing faster than initially rich ones. Thus, a process of beta convergence is also taking place within each club. Compared to the global convergence process suggested by Figure 3, the slope of each convergence club is steeper. This difference suggests that the (local) speed of convergence within each club is faster than that of the global process. Table 8 provides further details about beta convergence within each club. Again, relative to the global fit (Figure 3), the fit of the local models is higher. The R-squared ranges from 0.64 in Club 5 to 0.86 in Club 1. The districts belong to Club 3 converge at the highest speed (5.3% per year). Thus, it is expected that disparities within Club 3 would be reduced by half in just under 13 years. This fast local convergence contrasts with the global model, which predicts that disparities would be halved in 42 years.
NEW DISTRICT-LEVEL EVIDENCE                                  33

                                 Club 1                                       Club 2
                       2                                            2
      SD Log GDP pc

                                                   SD Log GDP pc
                      1.5                                          1.5

                       1                                            1

                       .5                                           .5

                       0                                            0
                        2000 2005 2010 2015 2020                     2000 2005 2010 2015 2020

                                 Club 3                                       Club 4
                       2                                            2
      SD Log GDP pc

                                                   SD Log GDP pc
                      1.5                                          1.5

                       1                                            1

                       .5                                           .5

                       0                                            0
                        2000 2005 2010 2015 2020                     2000 2005 2010 2015 2020

                                 Club 5
                       2
      SD Log GDP pc

                      1.5

                       1

                       .5

                       0
                        2000 2005 2010 2015 2020

Figure 8: Evolution of disparities within clubs: Sigma convergence approach

Notes: GDP refers to the district-level gross domestic product, and it is measured based
on constant prices of 2010. The source of the data is the Central Bureau of Statistics of
Indonesia and interpolation results.
34 REGIONAL INCOME DISPARITIES AND CONVERGENCE CLUBS IN INDONESIA
Club 1 Club 2
2 2
Growth 2000-2017
Growth 2000-2017
1 1
0 0
-1 -1
-2 -2
8 10 12 14 8 10 12 14
Log GDP pc in 2000 Log GDP pc in 2000
Club 3 Club 4
2 2
Growth 2000-2017
Growth 2000-2017
1 1
0 0
-1 -1
-2 -2
8 10 12 14 8 10 12 14
Log GDP pc in 2000 Log GDP pc in 2000
Club 5
2
Growth 2000-2017
1
0
-1
-2
8 10 12 14
Log GDP pc in 2000
Figure 9: Evolution of disparities within clubs: Beta convergence approach
Notes: GDP refers to the district-level gross domestic product, and it is measured based
on constant prices of 2010. The source of the data is the Central Bureau of Statistics of
Indonesia and interpolation results.NEW DISTRICT-LEVEL EVIDENCE 35
Table 8: Evolution of disparities within clubs: Beta convergence approach
Beta Convergence Half-life R-square
coefficient speed in years
Club 1 -0,54∗∗∗ 0,046 15,09 0,86
Club 2 -0,43∗∗∗ 0,032 21,14 0,74
Club 3 -0,59∗∗∗ 0,053 12,98 0,83
Club 4 -0,51∗∗∗ 0,042 16,36 0,69
Club 5 -0,52∗∗∗ 0,043 15,05 0,64
6.2 Geographical distribution of the convergence clubs
Now, we provide a geographical view of club membership as seen in Figure
10. A few regularities are visible from the map. First, the province effect is
notably obvious; districts belonging to the same province tend to be in the
same club (Barro, 1991; Quah, 1996). This pattern applies almost to all
clubs. For example, districts in provinces of East Kalimantan and Riau tend
to be grouped in Club 2. Similarly, Aceh, West Sumatra, West Kalimantan,
and Central Kalimantan also show comparable pattern where most of the
districts in these provinces are clustered in Club 3, and mostly the districts
in Maluku and Nusa Tenggara provinces dominate Club 4 and Club 5. More
surprisingly, districts belonging to the same club also tend to be
geographically close. To put it another way, the clubs seem to be spatially
concentrated. This could indicate some spatial agglomeration effects
(Martin and Ottaviano, 2001) driven by factors like spatial externalities or
spillovers (Quah, 1996).
Second, the distribution of clubs is also related to the spatial
distribution, implying the prolonged existence of classical regional36 REGIONAL INCOME DISPARITIES AND CONVERGENCE CLUBS IN INDONESIA
Figure 10: Spatial distribution of the convergence clubs
development problem in Indonesia; that is, the eastern regions of the
archipelago are still lagged in development. It can be seen from the
membership of the fifth club where out of 23 members, 21 districts are
located in the eastern provinces of Indonesia, i.e., South Sulawesi, Nusa
Tenggara, and Papua.
6.3 Policy implications
The difference in the progress of inter-regional development is natural. It is
related to the variation in potential that each region has, both natural
resources and geographical location. In addition, variation in the regional
ability to manage their resources and potential are also factors that
differentiate the success rate of development in each region. Despite the
Indonesian economy’s ability to maintain robust economic growth after the
Asian financial crisis in 1997/98, the persistent income gap between regions
still becomes one of major problems that could potentially be a source of a
worse complication in the future. Not only could trigger social disputeNEW DISTRICT-LEVEL EVIDENCE 37 stemmed from the perception of injustice among fellow communities, regional income inequality could also pose downside risks to the national economic growth. To reduce regional income inequality, the Indonesian government needs to have a clear and accurate picture of regional imbalances among regions. In this context, the results of this study suggest that the growth path of income per capita among 514 Indonesian districts during the period of 2000-2017 does not converge to the same steady-state level. Similar to Kurniawan et al. (2019), this finding implies the absence of global convergence of income per capita among Indonesian regions. Instead, the growth process of Indonesian districts constitutes five local convergence clubs. Interestingly, there is distinct characteristic across clubs, in particular between the highest income club (Club 1) and the lowest one (Club 5). At one end, Club 1 is dominated by regions with typical characteristics, i.e., big cities or natural resources-rich regions like Central Jakarta (the central district of the nation’s capital city), Kediri (the largest national tobacco producer), Morowali (the location of recently developing nickel-based industrial park), Membramo Raya, Mimika and Teluk Bintuni (the natural resources-rich districts in the coastal area of Papua island, respectively). While at the other end, Club 5 predominantly consists of districts that have long been struggling with poverty issues. In addition, the income gap among these five clubs is also considerably large, suggesting that the potential regional development policies might be different across clubs. For example, the development policies for districts in Club 1 might be directed to seeking new sources of growth to avoid income stagnation. Meanwhile, the majority of districts in Club 2, 3, and 4 could focus their program on developing the middle-sized cities and more programs on improving connectivity. Differently, policies on basic infrastructures and public
You can also read