COWICHAN VALLEY REGIONAL DISTRICT - Climate Projections for
←
→
Page content transcription
If your browser does not render page correctly, please read the page content below
RUNNING HEAD

Climate Projections for the
COWICHAN VALLEY
REGIONAL DISTRICT

                              Climate Projections for the Cowichan Valley Regional District		i
Acknowledgements
This work was developed as a collaboration                 PHASE 1 TECHNICAL COMMITTEE
between the CVRD and regional stakeholders, as
                                                           Hamid Hatami, CVRD
represented in the Phase 1 Technical Committee. The        Mike Tippett, CVRD
Phase 1 Technical Committee met over six months            Kate Miller, CVRD
to review climate projections for the region, discuss      Conrad Cowan, CVRD
regional impacts of the projections, and identify          Amy Melmock, CVRD
recommendations for Phase 2 of this project. This          Keith Lawrence, CVRD
report and process has also benefited from a variety       Jeff Moore, CVRD
of external partners including Lillian Zaremba with        Sybille Sanderson, CVRD
Metro Vancouver and Amanda Broad at the Capital            Craig Sutherland, Kerr Wood Leidal
Regional District. Together the work of our combined       Tom Rutherford, Cowichan Watershed Board
local governments will ensure we build on each other’s     Ken Epps, Island Timberlands
successes.                                                 Dominico Iannidinardo, TimberWest
                                                           Chris Cole, TimberWest
Contributing authors to this report include Trevor         Lisa Brinkman, Town of Ladysmith
                                                           Sharon Horsburgh, Regional District of Nanaimo
Murdock and Stephen Sobie from the Pacific Climate
                                                           Natalie Anderson, Cowichan Tribes
Impacts Consortium (PCIC), who provided regional
                                                           Summer Goulden, Social Planning Cowichan
downscaled climate projections at locally relevant
                                                           Michelle Staples, Social Planning Cowichan
scales, Kate Miller from the Cowichan Valley Regional
                                                           Lynne Magee, VIHA
District, who acted as the project manager, and Gillian
                                                           Jade Yehia, VIHA
Aubie Vines from Pinna Sustainability, who served as       Stacey Sowa, VIHA
the workshop facilitator and lead writer of this report.   Ian Foss, EMBC
                                                           Cathy LeBlanc, MCSCD
CITE REPORT AS:                                            Pat Lapcevic, FLNRO
Cowichan Valley Regional District. (2017). Climate         Derek Masselink, MOA
Projections for the Cowichan Valley Regional District.     Trevor Murdock, PCIC
46 pgs.                                                    Brian Branting, SD 79
                                                           Bruce Fraser
                                                           Bruce Sampson
                                                           Scott Aikenhead
                                                           Jane Kilthei
                                                           Goetz Schuerholz

                                                                                                                                                                          ii
                                                                                                            Climate Projections for the Cowichan Valley Regional District
RUNNING HEAD

Executive Summary

T    emperatures in the Cowichan Valley are
     warming. Global climate models project an
increase in annual average temperature of almost
                                                    inform regional risk assessment, decision-
                                                    making, and planning in the Cowichan Valley
                                                    region, with a goal of improving resilience to
                                                                                                       Global climate models project
3°C in our region by the 2050s. While that may      climate change. For this reason, this report       an increase in annual average
seem like a small change, it is comparable to the   focusses on the business-as-usual emissions        temperature of almost 3°C in our
difference between the warmest and coldest
years of the past. The purpose of this report is
                                                    scenario and the 2050s timeframe. By the end
                                                    of the 21st century, projected warming and
                                                                                                       region by the 2050s.
to quantify, with the most robust projections       associated impacts are even larger. In addition,
possible, the related climate impacts (including    the amount of warming by that time depends
changes to climate extremes) associated with        more highly on the quantity of greenhouse gases
warming. This climate information will then         emitted in the meantime.

                                                                                                                                                                             iii
                                                                                                               Climate Projections for the Cowichan Valley Regional District
EXECUTIVE SUMMARY

NEW NORMAL COWICHAN
The Cowichan Valley Regional District
                                                  Projections
(CVRD) is currently working on New Normal
                                                  As our climate warms, our region can expect
Cowichan: a multi-phased project to take
                                                  more than a doubling in the number of summer
action on climate change. This work involves
                                                  days above 25°C, from an average of 16 days
4 phases:
                                                  per year to 39 days per year. The 1-in-20 hottest
Phase 1: Climate Projections and                  temperature is projected to increase from 33°C
         Impacts Analysis
                                                  to 37°C by the 2050s. This projected warming
Phase 2: Vulnerability and Risk Assessments       has implications for future water and cooling
Phase 3: Adaptation and Mitigation Strategy       demands, and translates into changes that are
Phase 4: Implementation of the Strategy           important to our ecosystems, watersheds, and
                                                  communities, including an overall 28% increase
This report completes the Phase 1 climate         in the length of the growing season and a 49%
projections and impacts analysis to support       increase in growing degree days regionally.
the next two phases of the planning process,      Warmer winters mean the region will experience
by providing climate projections for the region   a 63% decrease in the number of frost days and
that illustrate the dramatic changes we can       heating demand will decrease overall, although
expect in years to come. The projections for

                                                                                                                                                                           ROGER WILES
                                                  both high and low temperature extremes are still
the Cowichan Valley are based on highest
                                                  possible in a less stable climate.
resolution information about future climate
available for our region: daily climate model     A modest 5% increase in annual precipitation is
projections from Global Climate Models,           projected in our region by the 2050s. Projections    Most of the projected climate changes
statistically downscaled to 10 km resolution,     indicate that fall will see the greatest increase    described in this report will be felt more or
and then elevation corrected using historical     in precipitation. This precipitation is expected     less uniformly throughout the region. Certain
gridded climatology at 800 m resolution.          during increasingly extreme events, with about       impacts, however, may differ substantially
This report also identifies high-level impacts    30% more precipitation on very wet days (95th        between low-lying developed areas (where
for our region, and sets the stage for further    percentile wettest days indicator) and 65% more      the majority of the population is situated),
exploration planning and prioritization           on extremely wet days (99th percentile wettest       the water supply areas, and the west coast. A
in Phase 2. In addition to the projections        days indicator). Despite the projected increased     sub-regional analysis has been undertaken for
presented here, ongoing work to project           intensity of wet events, the amount of rain in       each of those areas to assist in local planning
future sea level rise and increases to water
                                                  summer is expected to decrease by 17%, and the       initiatives. Past precipitation values are generally
levels are being completed and will be
                                                  duration of dry spells will be lengthened by about   wetter in the water supply watersheds and west
presented in a separate document.
                                                  20%, from 22 consecutive days to 26 days.            coast watersheds, while past temperatures are

                                                                                                                                                                                    iv
                                                                                                                      Climate Projections for the Cowichan Valley Regional District
EXECUTIVE SUMMARY
generally warmer in the developed areas. This is
important for temperature indicators like frost
Early Recommendations
days, which illustrate that in the future, only the
highest elevations in our region will experience
The technical committee has offered the following
early recommendations to be considered as the
Identify and map areas affected by increased
climate sensitivity (flooding, erosion,
temperatures below freezing. Outcomes from
region continues to prepare and take action on landslides) to assist in identifying specific risks.
the sub-regional analysis also indicate the wettest
areas in the mountains of the west coast will
climate change adaptation. Detailed analysis and
structured recommendations will follow as a part Conduct a regional, engineering-based
analysis of infrastructure risks to inform asset
become even wetter, and warmer temperatures
of the overall adaptation planning exercise.
will cause more precipitation to fall as rain. April management.
1 snowpack depth is projected to decrease by
85% by the 2050s.
Take a “no-regrets” approach when planning Develop IDF curves that reflect climate
projections for engineering decision making
for adaptation, as the time for action is now.
Utilize existing projections in all master
related to infrastructure.
Regional Collaboration planning processes. Incorporate APEG BC recommendations for
Establish stretch goals and visions in Regional
additional tolerances above projections.
Preparing for the changes ahead will require Cowichan 2050 planning process to ensure Develop
zones.
sea level rise land use management
provincial and regional governments, local that adaptation is not an automatic fallback
authorities, and agencies to work together in position.
Recognize the rural nature of the region and
developing a local, regional, and bioregional
approach. Emergency preparedness and
Incorporate projections and impacts into all how this can affect the services provided.
management will be an increasingly important
engineering and water security planning.
Work in partnerships with other levels
issue in the planning and delivery of services, Conduct additional analysis of drought-related
indicators to more fully understand specific
of government to address infrastructure
shortages/deficiencies.
programs, and infrastructure. The public will also
need to be informed and supported through the
impacts to soil, water supply, and ecosystem
health at the landscape level.
Conduct a full risk assessment of policy and
infrastructure in partnership with other levels
range of changes.
Develop long-term community water security of government.
plans and update watershed strategies with
climate projections to address future conflicts
Communicate long-term projections to
the general community, stakeholders, and
over water use. partners, along with other relevant projections
Develop an integrated hydrological monitoring
and climate network.
concerning sea level rise and forestry http://
www.genetics.forestry.ubc.ca/cfcg/BEM.html.
v
Climate Projections for the Cowichan Valley Regional District
Table of Contents
Acknowledgements .  .  .  .  .  .  .  .  .  .  .  .  .  .  .  .  .  .  .  .  .  .  .  .  .  .  .  .  .  .  .  .  . ii

Executive Summary .  .  .  .  .  .  .  .  .  .  .  .  .  .  .  .  .  .  .  .  .  .  .  .  .  .  .  .  .  .  .  . iii
         Projections. . . . . . . . . . . . . . . . . . . . . . . . . . . . . . . . . . . . . . . . . . . . . iv
         Regional Collaboration . . . . . . . . . . . . . . . . . . . . . . . . . . . . . . .  v
         Early Recommendations. . . . . . . . . . . . . . . . . . . . . . . . . . . . . .  v

Introduction .  .  .  .  .  .  .  .  .  .  .  .  .  .  .  .  .  .  .  .  .  .  .  .  .  .  .  .  .  .  .  .  .  .  .  .  .  .  .  .  .  .  .  . 1

Methodology                                         .  .  .  .  .  .  .  .  .  .  .  .  .  .  .  .  .  .  .  .  .  .  .  .  .  .  .  .  .  .  .  .  .  .  .  .  .  .  .  .   3
         Climate Scenario Selection . . . . . . . . . . . . . . . . . . . . . . . . . . .                                                                                    3
         Climate Model Selection. . . . . . . . . . . . . . . . . . . . . . . . . . . . . .                                                                                  4
         Indicator Derivation . . . . . . . . . . . . . . . . . . . . . . . . . . . . . . . . . .                                                                            5
         Sub-Regional Analysis . . . . . . . . . . . . . . . . . . . . . . . . . . . . . . . .                                                                               6
         How to Read Figures. . . . . . . . . . . . . . . . . . . . . . . . . . . . . . . . . .                                                                              7

General Climate Projections.  .  .  .  .  .  .  .  .  .  .  .  .  .  .  .  .  .  .  .  . 8                                                                                       Summer Temperature Indicators .  .  .  .  .  .  .  .  .  .  . 21                                               Regional Impacts .  .  .  .  .  .  .  .  .  .  .  .  .  .  .  .  .  .  .  .  .  .  .  .  .  .  .  .  .  .  .  .  .  .  . 38
         Warmer Temperatures . . . . . . . . . . . . . . . . . . . . . . . . . . . . . . . . 9                                                                                       Summer Days. . . . . . . . . . . . . . . . . . . . . . . . . . . . . . . . . . . . . . . .  22                    Ecosystems and Biodiversity. . . . . . . . . . . . . . . . . . . . . . . .  39
         Seasonal Variability in Temperature. . . . . . . . . . . . . . . .  12                                                                                                      Hottest Day. . . . . . . . . . . . . . . . . . . . . . . . . . . . . . . . . . . . . . . . . .  23                Watershed and Groundwater Health . . . . . . . . . . . . .  40
         Wetter Winters, Drier Summers . . . . . . . . . . . . . . . . . . .  13                                                                                                     1-in-20 Hottest Day . . . . . . . . . . . . . . . . . . . . . . . . . . . . . . . .  24                           Health and Well-Being . . . . . . . . . . . . . . . . . . . . . . . . . . . . .  41
         Seasonal Variablility in Precipitation . . . . . . . . . . . . . . .  16                                                                                                    Cooling Degree Days . . . . . . . . . . . . . . . . . . . . . . . . . . . . . . .  25                             Infrastructure . . . . . . . . . . . . . . . . . . . . . . . . . . . . . . . . . . . . . . . .  42
                                                                                                                                                                                     Growing Season Length. . . . . . . . . . . . . . . . . . . . . . . . . . . .  27                                  Economic Development . . . . . . . . . . . . . . . . . . . . . . . . . . .  44
Precipitation Indicators. .  .  .  .  .  .  .  .  .  .  .  .  .  .  .  .  .  .  .  .  .  .  .  .  . 17
                                                                                                                                                                                     Growing Degree Days . . . . . . . . . . . . . . . . . . . . . . . . . . . . . .  29                               Bioregional Carrying Capacity . . . . . . . . . . . . . . . . . . . . .  46
         Dry Spells . . . . . . . . . . . . . . . . . . . . . . . . . . . . . . . . . . . . . . . . . . . .  18
         Single-Day Maximum. . . . . . . . . . . . . . . . . . . . . . . . . . . . . . .  18                                                                                     Winter Temperature Indicators.  .  .  .  .  .  .  .  .  .  .  .  .  . 30
         5-Day Maximum . . . . . . . . . . . . . . . . . . . . . . . . . . . . . . . . . . . .  18                                                                                   Warmest Winter Day. . . . . . . . . . . . . . . . . . . . . . . . . . . . . . . .  30
         95th-Percentile Wettest Days . . . . . . . . . . . . . . . . . . . . . .  19                                                                                                Coldest Winter Night . . . . . . . . . . . . . . . . . . . . . . . . . . . . . . .  31
         99th-Percentile Wettest Days . . . . . . . . . . . . . . . . . . . . . .  19                                                                                                1-in-20 Coldest Night . . . . . . . . . . . . . . . . . . . . . . . . . . . . . .  32
         1-in-20 Wettest Day . . . . . . . . . . . . . . . . . . . . . . . . . . . . . . . .  20                                                                                     Heating Degree Days . . . . . . . . . . . . . . . . . . . . . . . . . . . . . . .  32
                                                                                                                                                                                     Frost Days. . . . . . . . . . . . . . . . . . . . . . . . . . . . . . . . . . . . . . . . . . . .  34
                                                                                                                                                                                     Ice Days . . . . . . . . . . . . . . . . . . . . . . . . . . . . . . . . . . . . . . . . . . . . . .  36

                                                                                                                                                                                                                                                                                                                                                                                                  vi
                                                                                                                                                                                                                                                                                                                                    Climate Projections for the Cowichan Valley Regional District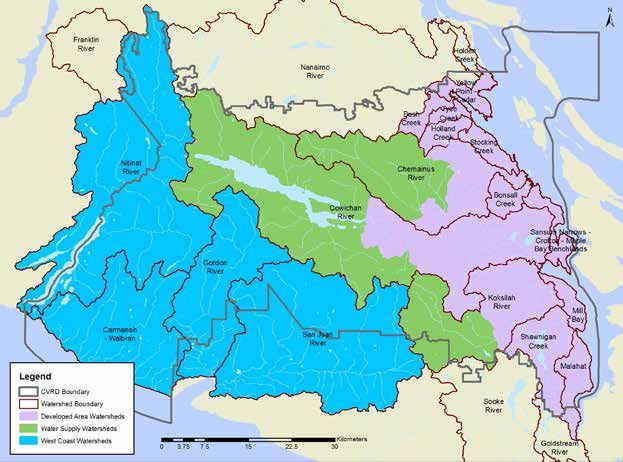
Introduction
T     he impacts of climate change are becoming
      increasingly evident and are challenging all
levels of government to develop more resilient
communities. Ensuring our region is as prepared
as possible is critical to maintaining community
well-being, environmental health, and a vibrant
local economy over the long term. The 2014–
2018 Cowichan Valley Regional District (CVRD)
Corporate Strategic Plan has set a mandate
to understand our region’s climate risks and
to complete adaptation plans that strengthen
resilience, reduce risks, and take advantage of
potentially emerging opportunities.

The first step towards planning is understanding
what changes are projected for our region and
beginning to build relationships between the
community and government to improve our
ability to adapt to changes ahead. To support
this, the Pacific Climate Impacts Consortium
(PCIC) has worked with the CVRD and a multi-
stakeholder team to produce high-resolution
regional projections to understand how the           understand and prepare for the changes ahead.
climate in our region may change by the 2050s
and 2080s. This report presents information on
                                                     New approaches to infrastructure, planning          The first step towards planning is
                                                     processes, and other regional management,
temperature, precipitation, and related extreme      require long timelines to change, and this report   understanding what changes are
indicators that, taken together, tell a story of
how our climate is expected to change over time.
                                                     gives decision makers a clear sign that action      projected for our region.
                                                     is required today to adapt and mitigate further
High-level comments on the possible impacts          impacts.
of these changes are also presented as a first
step in working collaboratively as a region to

                                                                                                                                                                                1
                                                                                                                  Climate Projections for the Cowichan Valley Regional District
INTRODUCTION

This report offers a general description of our
changing climate, followed by an expanded
section on precipitation, summer temperatures,
and winter temperatures. Each section includes
a description of each indicator, along with a
summary of the future projected climate. Cases
where the results for a particular sub-regional
indicator vary substantially from the regional
average are noted in the analysis. The second
chapter of this report provides a brief narrative
describing how these changes could impact
our region. These impact themes are broken
into the Natural Environment and the Human
Environment.

Sea level rise impacts are addressed by utilizing
different sea level rise scenarios (1m, 2m, and
3m) along the regions east coast. This work will
contribute to and be included in the next phase
of the overall “New Normal Cowichan” climate
adaption process using detailed coastal mapping.

Information provided in this document is not
intended to serve as design guidelines for future
planning. Rather it is intended to describe a
                                                    This report offers a general description of our changing climate,
probable future and enable our region’s planners,
engineers, policy makers, and community             followed by an expanded section on precipitation, summer temperatures,
decision makers to make better-informed             and winter temperatures.
decisions on how to plan for and adapt to
changes ahead.

                                                                                                                                                                   2
                                                                                                     Climate Projections for the Cowichan Valley Regional District
Methodology
Climate Scenario Selection

V    arious future trajectories of greenhouse
     gas (GHG) emissions are possible, and
depend directly on global political initiatives
                                                       In general terms, RCP8.5 corresponds to
                                                       “business as usual” GHG emissions for the
                                                       remainder of the century. The RCP4.5 “medium
                                                                                                            To date, public policy continues to reflect
                                                                                                            the RCP8.5 pathway, even though recent
                                                                                                            aspirational goals, including the 2015 COP21
and socio-economic changes that will occur             stabilization” scenario represents mitigation        Paris Agreement, correspond with RCP2.6. It
over the coming years. This report presents the        efforts that result in about half of the emissions   is prudent to plan for an RCP8.5 future until
internationally recognized roughly “business           compared to the RCP8.5 scenario. Substantial         global mitigation actions begin to catch up with
as usual” GHG emissions scenario, known as             and sustained reductions in GHG emissions—for        commitments.
Representative Concentration Pathway 8.5               example, extensive adoption of biofuels and
(RCP8.5). Additional information from lower            vegetarianism, along with carbon capture and
emissions scenarios (RCP4.5 and RCP2.6) is             storage—would be required to achieve RCP2.6,
available for sensitivity analysis and to illustrate   which is the only pathway that would keep
the relationship between adaptation and GHG            global warming below 2°C above pre-industrial
emissions reductions (by request).                     temperatures. The projected global temperature
                                                       change for each pathway is illustrated below.

                                                                                                                   Climate Projections for the Cowichan Valley Regional District REPORT   3
METHODOLOGY

  Representative Concentration
  Pathways (RCPs)
  RCPs describe potential 21st century
  scenarios of GHG emissions, atmospheric
  GHG concentrations, aerosols, and land
  use. These RCPs are used for making
  projections, and are based on the factors
  that drive anthropogenic GHG emissions:
  population size, economic activity, lifestyle,
  energy use, land use patterns, technology
  adoption, and climate policy. Each of the
                                                   Figure 1: Emissions Scenarios Figure S SPM.6(a) from IPCC’s Climate Change 2014 Synthesis Report shows
  RCPs directly relates to the choices made by     modeled global average surface temperature change relative to 1986-2005. The mean of the projections (lines)
  global society.                                  and a measure of uncertainty (shading) are shown for RCP8.5 (red) and RCP2.6 (blue). The number of climate
                                                   models used to calculate the mean is indicated.

Climate Model Selection
Many different, highly sophisticated models are    The results in this report are based on a subset of
used to simulate how the earth’s climate will      climate models selected from the Coupled Model             It is best practice to apply an
respond to changes in GHG concentrations,
each with different strengths and weaknesses.
                                                   Intercomparison Project 5 (CMIP5). The CMIP5
                                                   climate models were first screened according to
                                                                                                              “ensemble” approach that
To manage the uncertainty associated with          their ability to replicate historical data, and from       uses several models to describe
modelling, it is best practice to apply an
“ensemble” approach that uses several models
                                                   them, the ensemble of 12 models was chosen to              the bounds of projected
                                                   provide the widest range of projected change for
to describe the bounds of projected climate        a set of climate parameters.                               climate change.
change.

                                                                                                                                                                                         4
                                                                                                                           Climate Projections for the Cowichan Valley Regional District
METHODOLOGY
Indicator Derivation
The historical baseline period used for all
indicators in the report is 1971–2000. Values
are averaged over this 30-year period to smooth
out annual variability. The future projections are
for the 2020s, 2050s (which is an average of
modelled values over the 2041–2070 period),
and 2080s (averaged over the 2071–2100
period). The three RCP scenarios have somewhat
similar GHG concentrations in the 2050s, but
diverge considerably by the 2080s. Indicators of
climate change take a similar divergent pattern
by the 2080s.
Figure 2: Example of Improved Resolution from Downscaling Climate Models Climatalogical
precipitation for the 1971–2000 period as simulated by the GFDL model, and after applying BCCAQ.
Many of the indicators of extreme events used
in this report are derived using the definitions
Information from the large-scale global climate recommended by the Expert Team on Climate
Acronyms
models was translated into predictions at local Change Detection and Indices (ETCCDI), known
ANUSPLIN Australian National scales using a procedure called downscaling. as the CLIMDEX indices. The indicator names
University Spline
The model projections were downscaled to a used in this report have been translated into
BCCAQ Bias Correction/Constructed 10 km grid by making use of a historical daily plain language. Some indicators are defined by
Analogues with Quantile mapping
time series (ANUSPLIN) in conjunction with the ETCCDI on a monthly basis only, such as TXx
reordering
climate model projections. BCCAQ statistical (monthly maximum daytime high temperature).
CMIP5 Coupled Model Intercomparison
downscaling was used, which is a hybrid climate In some cases, we consider seasonal and annual
Project 5
analogue/quantile mapping method. Daily versions of CLIMDEX indices by taking the
ETCCDI Expert Team on Climate Change
Detection and Indices
temperature and precipitation observations and corresponding maximum (or minimum) from the
future projections at 10 km resolution were then highest (or lowest) month in that season or year.
GFDL Geophysical Fluid Dynamics
Laboratory draped over an 800 m grid (PRISM) of 1971– The values given as projected changes for the
2000 average temperature or precipitation to 2050s and 2080s in this report are the average
GHG Greenhouse Gas
generate high-resolution maps. values across all 12 models.
IPCC Intergovernmental Panel on
Climate Change
5
Climate Projections for the Cowichan Valley Regional DistrictMETHODOLOGY
Sub-Regional Analysis
The higher elevations and rain shadow effect
from the mountainous regions result in
considerable variation in climatic conditions
across our region. For example, the west coast of
the region receives over three times the annual
precipitation compared to the east coast. In order
to account for sub-regional variation in climate
change, projections for the various indicators
have been summarized both for the region as a
whole and for three sub-regions. Cases where the
results for a particular indicator vary substantially
from the regional average are noted in the
analysis. These sub-regions were defined using
watershed and sub-watershed boundaries to
reflect efforts at watershed-based planning within
the region. The three sub-regions are defined as
follows (also see Figure 3: Sub-Regions):
Developed Area: This sub-region includes
the smaller, eastward-flowing watersheds and
coastal benchland areas in which the majority
of the region’s population is located. For the
Figure 3: Subregions
larger Cowichan, Chemainus, and Koksilah
River watersheds, only the lower sub-basins are West Coast Watersheds: This sub-region a much finer scale. Differences in hydrological,
included in this sub-region. includes the very wet, west-flowing watersheds, ecological, social, and other conditions at a
which include a mix of parks and resource lands. watershed or sub-watershed level will play a
Water Supply Watersheds: This sub-region
significant role in determining the extent and
includes the upper portion of the sub-basins for While this work provides projections at the nature of the impacts of the projected climate
the Cowichan, Koksilah, and Chemainus River regional and sub-regional level, future work will change and the appropriate adaptations to those
watersheds and consists mainly of resource lands need to consider the impacts of projected climate impacts over time.
within the privately managed forest landbase. change and the responses to those impacts at
6
Climate Projections for the Cowichan Valley Regional DistrictMETHODOLOGY
How to Read Figures
The following methods were used when
developing the values shown in the tables, maps,
This report provides several box-and-whisker
plots to illustrate year-to-year and model-
and plots in this report: to-model variability over time. The diagram
below illustrates how these plots are to be
Values for each time period (past, 2050s, and
2080s) are averaged over each 30-year period.
interpreted.
The 30-year period used to calculate past
values is 1971–2000; the 2050s refer to 2041–
2070, and the 2080s refer to 2071–2100.
Seasons are presented as winter (December- Values in the tables (averages, ranges,
percentiles, etc.) are provided for the region
January-February), spring (March-April-
May), summer (June-July-August), and fall as a whole, as well as for the sub-regional
(September-October-November). geographies where relevant.
Inchange
tables throughout the document, projected Maps show only the average values of the
model ensemble. Maps are provided in the
is given for the average of the model
ensemble along with the range (10th to 90th body of the report when they add meaning to
percentile) of the model ensemble. The 10th to data interpretation, with additional maps for
90th percentile range describes the uncertainty remaining indicators presented in Appendix 2.
among the models and natural climate For the 1-in-20 events described in this report,
the “5% chance of occurrence” is based on
variability.
an average over each 30-year period. This
means that, since climate change will occur
throughout that time, there is slightly less than
a 5% chance of such an event occurring at
the beginning of the period and more than
5% chance at the end of the period, with an
average 5% chance per year over the period.
7
Climate Projections for the Cowichan Valley Regional DistrictGeneral Climate Projections
T he Cowichan Valley Regional District is
already seeing the impacts of climate change
and can expect to see increased changes and
interrelationships in the years to come. At a
broad level, this will mean the following physical
changes:
Warmer temperatures
Longer dry spells in summer months
More precipitation in fall, winter, and spring
A decrease in snowpack
More intense extreme events
These changes will not always happen
consistently over the region or over time
because seasonal and annual variations will
occur. For most variables, projected change
A Note on Interpretation
appears somewhat different from the past by the
2050s, and by the 2080s, projections indicate This report tells the story of how we can managers may find it appropriate to consider
substantial changes, resulting in a very different expect temperature and precipitation to 90th percentile values when planning critical
climate than in the Cowichan region of today. change in the Cowichan Valley region. When infrastructure investments.
This is particularly true for the temperature- reviewing the data provided in the tables
and figures below, it is important to note the • For some indicators, values for specific
related variables.
following: geographic areas may be more appropriate
This section of the report presents general than the regional or sub-regional averages
projections for our region, and is followed by • The 10th to 90th percentile values projected presented in the tables. These values can be
sections with more detailed climate indicators, by the ensemble models are important obtained by looking at the maps presented in
including indices of extremes for precipitation, for adaptation planning, as they take into the report body or utilizing the associated GIS
summer temperatures, and winter temperatures. account the range of uncertainty when files.
Each section includes a definition of the indicator projecting future climate change. Risk
and a summary of projected values.
8
Climate Projections for the Cowichan Valley Regional DistrictGENERAL CLIMATE PROJECTIONS
Warmer Temperatures
ABOUT THIS INDICATOR table 1: REGIONAL AVERAGE DAYTIME HIGH TEMPERATURE
Daytime high and nighttime low are averaged Past (°C) 2050s Change (°C) 2080s Change (°C)
over each month, each season, or annually in the
Average (Range) Average (Range)
tables and plots below.
Winter 5 2.4 (1.3 to 3.3) 4.4 (2.6 to 6.4)
PROJECTIONS Spring 11 2.7 (1.5 to 4.6) 4.3 (2.7 to 7.1)
All models project that daytime high and Summer 20 3.2 (1.9 to 4.2) 5.2 (3.6 to 7.0)
nighttime low temperatures will rise. While
Fall 13 2.6 (1.3 to 3.8) 4.2 (2.8 to 5.8)
temperature can be expected to increase year
round, the greatest increases will occur in the Annual 12 2.7 (1.4 to 4.0) 4.5 (2.9 to 6.2)
summer months. By the 2050s, daytime high
temperatures will be substantially warmer (an table 2: REGIONAL AVERAGE NIGHTTIME LOW TEMPERATURE
increase of 3.2°C on average) in summer. By the
Past (°C) 2050s Change (°C) 2080s Change (°C)
2080s, we can expect summer daytime highs to
increase by over 5°C. Average (Range) Average (Range)
Winter -1 2.6 (1.6 to 3.2) 4.4 (3.2 to 5.3)
Nighttime lows are also projected to warm by
almost 3°C in all seasons by the 2050s. In winter, Spring 2 2.5 (1.7 to 3.6) 4.1 (2.8 to 5.8)
this will mean an average low of 2°C by the Summer 9 2.8 (1.7 to 4.0) 4.7 (3.4 to 6.5)
2050s, compared to an average low of -0.6°C in Fall 5 2.6 (1.6 to 3.7) 4.2 (2.8 to 5.6)
the past, increasing to about 4°C by the 2080s.
Summer nighttime lows are also projected to Annual 4 2.6 (1.6 to 3.6) 4.3 (3.0 to 5.8)
increase dramatically, from 9°C in the past to
over 14°C by the 2080s. Similar changes are also
Maps indicate that warming is expected to be
seen in each of the three sub-regions.
relatively uniform throughout the region, with
the most warming expected in the valleys and
low-lying areas. In the past, the average winter
nighttime low temperature was below freezing.
In future, only the highest elevations will
experience nighttime lows below freezing.
9
Climate Projections for the Cowichan Valley Regional DistrictGENERAL CLIMATE PROJECTIONS
Warmer Temperatures, Continued
Figure 4: Summer Average Daytime High Temperature – Past Figure 5: Summer Average Daytime High Temperature – Future (2050s)
Warming is expected to be relatively uniform
throughout the region, with the most warming
expected in the valleys and low-lying areas.
10
Climate Projections for the Cowichan Valley Regional DistrictGENERAL CLIMATE PROJECTIONS
Warmer Temperatures, Continued
Figure 6: Winter Average Nighttime Low Temperature – Past Figure 7: Winter Average Nighttime Low Temperature – Future (2050s)
In the past, the average winter nighttime low
temperature was below freezing. In future, only the
highest elevations will experience nighttime lows
below freezing.
11
Climate Projections for the Cowichan Valley Regional DistrictGENERAL CLIMATE PROJECTIONS
Seasonal Variability
in Temperature
The box-and-whisker plots of monthly daytime
high and nighttime low temperatures provide
a comparison of the year-to-year variability in
future to that experienced in the past. This shows
that the new normal for the region may be very
unlike the past.
The daytime high temperature plot shows that
the median daytime high in the 2080s are
projected to be hotter than the 90th percentile
of warm days in the past in many months and Figure 8: Monthly Daytime High Temperature – Past, 2050s, and 2080s
Boxes from left to right in each month indicate past, 2050s, 2080s.
even by the 2050s in some months, with the
most notable changes projected for July, August,
and September. In the 2080s, most September
temperatures can be expected to be hotter than
past August temperatures. In the 2080s, January
daytime highs are projected to be generally
warmer than past March temperatures.
NOTE:
Further explanation of how to read
the box-and-whisker plots is provided
on page 7 under Methodology.
Figure 9: Monthly Nighttime Low Temperature – Past, 2050s, and 2080s
Boxes from left to right in each month indicate past, 2050s, 2080s.
12
Climate Projections for the Cowichan Valley Regional DistrictGENERAL CLIMATE PROJECTIONS
Wetter Winters, Drier Summers
ABOUT THIS INDICATOR
Total precipitation is all precipitation summed
over a month, season, or year, including rain
and snow water equivalent. This is a high-level
indicator of how precipitation patterns can
expect to change.
PROJECTIONS
Projections indicate that our region will
experience a modest increase in total annual
precipitation of 5% by the 2050s and 11% by
the 2080s. While these increases alone are not
a dramatic departure from the past, the increase
in precipitation is expected to be distributed
unevenly over the seasons and among extreme
events.
Most rain in our region falls over the winter
months, and this is projected to continue to
occur in the future. The largest percentage table 3: TOTAL PRECIPITATION OVER SEASONS IN A YEAR
increase in rainfall is expected to occur in the 2050s Percent Change 2080s Percent Change
fall season, increasing 11% by the 2050s, and 2050s 2080s (%) (%)
Past (mm)
19% by the 2080s. Models indicate winter and (mm) (mm)
Average (Range) Average (Range)
spring precipitation will both increase as well.
Summer, already our region’s driest season, may Winter 818 856 932 5 (-2 to 11) 14 (2 to 26)
experience a decline of 17% by the 2050s, and a Spring 413 433 442 5 (-6 to 13) 7 (-5 to 17)
decline of 26% by the 2080s. While the models
Summer 158 131 117 -17 (-41 to 2) -26 (-49 to -6)
indicate a range of possible change, they mostly
agree about the direction of change for each Fall 612 676 727 11 (-3 to 25) 19 (6 to 38)
season. Annual 2028 2124 2250 5 (1 to 10) 11 (2 to 16)
13
Climate Projections for the Cowichan Valley Regional DistrictGENERAL CLIMATE PROJECTIONS
Wetter Winters, Drier Summers, Continued
The main distinction between the regional and will look like winter precipitation in the West
sub-regional numbers is that the baselines for Coast Watersheds today. This is important when
precipitation are different. The seasonal percent planning for stormwater management and flood
changes are similar throughout the region. control.
By the 2080s, summer precipitation in the The maps on the following pages show the
Water Supply Watersheds are expected to be amount of precipitation projected, and indicate
similar to summer precipitation in the Developed that the wetter areas are expected to experience
Area today. Conversely, by the 2080s, winter the largest increases in precipitation.
precipitation in the Water Supply Watersheds
table 4: SUB-REGIONAL SEASONAL PRECIPITATION
Developed Area Water Supply Watersheds West Coast Watersheds
Past 2050s Change 2080s Change Past 2050s Change 2080s Change Past 2050s Change 2080s Change
(mm) (mm) (mm) (mm) (mm) (mm) (mm) (mm) (mm)
Winter 612 27 88 857 40 119 968 47 136
(-14 to 68) (12 to 163) (-21 to 93) (17 to 221) (-24 to 101) (20 to 248)
Spring 279 16 24 435 21 31 506 23 33
(-17 to 40) (-11 to 60) (-25 to 55) (-19 to 76) (-27 to 63) (-27 to 81)
Summer 109 -20 -29 169 -30 -45 186 -31 -47
(-44 to 3) (-56 to -5) (-67 to 3) (-84 to -12) (-74 to 6) (-91 to -11)
Fall 429 48 89 649 67 121 736 75 134
(-20 to 11) (32 to 174) (-20 to 158) (40 to 236) (-19 to 181) (46 to 258)
Annual 1514 74 179 2126 102 234 2403 115 257
(-10 to 148) (42 to 264) (11 to 220) (53 to 333) (20 to 262) (52 to 358)
14
Climate Projections for the Cowichan Valley Regional DistrictGENERAL CLIMATE PROJECTIONS
Wetter Winters, Drier Summers, continued
Figure 10: Fall Precipitation – Past Figure 11: Fall Precipitation – Future (2050s)
Wetter areas are expected to experience the largest
increases in precipitation.
15
Climate Projections for the Cowichan Valley Regional DistrictGENERAL CLIMATE PROJECTIONS
Seasonal Variablility
in Precipitation
When examining monthly precipitation values
in the plot below, we see that the increases
within a season are not uniform across months.
For example October, November, and December
show the largest precipitation increases in
both absolute and relative terms. The plot also
indicates the potential for drier summer months
in the future. September is projected to get drier
over time, extending the dry season into fall.
The models illustrate that we can expect more
precipitation in the already wet seasons, less
precipitation in already dry summers, and Figure 12: Monthly Total Precipitation – Past, 2050s, and 2080s
considerably more rain falling in some years, Boxes from left to right in each month indicate past, 2050s, 2080s. Further explanation of how to read
while other years will experience droughts. the box-and-whisker plots is provided above in the Methodology section (page 7).
In southwestern BC, year-to-year precipitation
variability is modulated by the Pacific Decadal The range of the natural variability of PDO and period for all 12 models. As natural variability
Oscillation (PDO), which has varied between ENSO cycles is comparable to the projected will still exist in future and projected changes
warm and cool phases a few times over the last changes due to climate change. Because are superimposed on variability, individual
century. As well, the El Niño-Southern Oscillation future projections are based on 12 model runs, precipitation events that are more intense than
(ENSO) varies between three phases: neutral the values in the tables approximate average those experienced in the past are expected to
years, El Niño events that typically mean a conditions in terms of natural variability. occur.
warmer and drier winter and spring, and La Niña
events that are cooler and wetter. To illustrate the influence of year-to-
year variability (including ENSO and PDO
contributions) on precipitation, the box and
whisker plots below show, for each month of the
year, the distribution of values in each 30-year
16
Climate Projections for the Cowichan Valley Regional DistrictPrecipitation Indicators
O ur region’s drinking water, as well as
water for industry and agriculture, comes
from a variety of sources including lakes, rivers,
and groundwater. Some utilities in the region
have reservoirs, but these are small and have
limited capacity for additional storage. Changes
in precipitation patterns will have impacts
on surface water availability, lake and river
system levels, and ultimately on groundwater
resources. Changes in precipitation will also have
impacts on water quality, both in winter due to
increasing sedimentation, and in summer due
to algal events driven by water temperature and
levels.
The majority of the region outside of municipal
boundaries relies on natural drainage
infrastructure (wetlands, watercourses, and
floodplains) to withstand extreme weather
events. The region’s network of roads and
drainage systems, operated by the provincial
Ministry of Transportation and Infrastructure and
the municipalities, was designed to withstand to see longer and more intense storm events
past rainfall patterns. As the climate warms, coming off the Pacific in the future. During these We can expect to see longer and
more moisture is held in the atmosphere and events, new thresholds for extreme weather
released during precipitation events, resulting events are likely to challenge the capacity of the
more intense storm events coming
in more intense future storm events. Also, with regional sewerage and drainage infrastructure off the Pacific in the future.
changing global climate patterns, weather currently in place1.
systems like atmospheric rivers are likely to
stall on the coast and, when combined with an
increased precipitation intensity, we can expect 1 For more information, see: https://www.pacificclimate.org/sites/default/files/publications/Atmospheric%20Report%20Final%20Revised.pdf
17
Climate Projections for the Cowichan Valley Regional DistrictPRECIPITATION INDICATORS
Dry Spells Single-Day Maximum 5-Day Maximum
ABOUT THIS INDICATOR ABOUT THIS INDICATOR ABOUT THIS INDICATOR
Dry spells is a measure of the number of Single-day maximum precipitation describes the 5-day maximum precipitation describes the
consecutive days where daily precipitation is largest amount of rain that falls on any single day largest amount of rain that falls over a period of
less than 1 mm. The value denotes the longest in the year. 5 consecutive days in the year.
stretch of dry days in a year, typically in summer.
This indicator reflects times of the year when PROJECTIONS PROJECTIONS
watersheds/water resources are not recharged by As noted previously in the General Climate Again, as noted earlier, a modest increase (5%)
rainfall. Projections section, a modest increase (5%) in in total annual precipitation is expected by the
total annual precipitation is expected by the 2050s, with models projecting the increase
PROJECTIONS
2050s. Models project that the increase will be will be concentrated into the wettest days. The
The past average longest period of consecutive concentrated into the wettest days. The wettest amount of rain in the wettest 5-day period is
days without rain (under 1 mm) in our region is single day of the year is expected to see 17% projected to increase by 10% by the 2050s,
22 days. Dry spells on average are expected to more rain by the 2050s, and 30% more by the and 23% by the 2080s. Sub-regional percent
increase to 26 days by the 2050s, and 29 days 2080s. The percent changes are similar across changes are in line with the regional projections.
by the 2080s. Sub-regional trends align with the sub-regions. Like the general precipitation
regional trends. numbers, the baseline values for single-day
maximum precipitation in the sub-regions are
different, while the future percent changes are in
line with regional averages.
table 5: ANNUAL DRY SPELLS
Past 2050s 2080s 2050s Percent Change (%) 2080s Percent Change (%)
(days) (days) (days) Average (Range) Average (Range)
Dry spell duration 22 26 29 20 (4 to 36) 32 (16 to 48)
18
Climate Projections for the Cowichan Valley Regional DistrictPRECIPITATION INDICATORS
95th-Percentile Wettest Days table 6: EXTREME PRECIPITATION
2050s Percent Change (%) 2080s Percent Change (%)
ABOUT THIS INDICATOR Past (mm)
Average (Range) Average (Range)
The 95th-percentile wettest days precipitation
indicator points to the total amount of rain that Single-day maximum
75 17 (4 to 28) 30 (10 to 40)
falls on the wettest days of the year, specifically precipitation
on days when precipitation exceeds a threshold Five-day maximum
set by the annual 95th percentile of wet days 177 10 (3 to 20) 23 (8 to 33)
precipitation
during the baseline period (1971–2000). This
95th-percentile wettest
measure indicates how much total annual 448 30 (9 to 57) 57 (36 to 81)
days precipitation
precipitation falls during these heavy events,
which is a combination of both how often these 99th-percentile wettest
134 65 (26 to 107) 120 (59 to 161)
events occur and the size of these events. days precipitation
PROJECTIONS 1-in-20 wettest day 112 30 (11 to 45) 39 (22 to 57)
The wettest periods in our region are projected
to become wetter. The wettest days that
exceed the baseline 95th-percentile threshold
are projected to produce 30% more rain by the
99th-Percentile Wettest Days
2050s, and 57% more rain by the 2080s. Most
ABOUT THIS INDICATOR PROJECTIONS
of this increase in rain is due to those heavy rain
days becoming more frequent in the future. The 99th-percentile wettest days precipitation More precipitation is expected to fall during
Sub-regional percent changes are in line with the indicator points to the total amount of rain that the 99th-percentile wettest days extreme storm
regional projections. falls on the wettest days of the year, specifically events in the future. Larger 99th-percentile
on days when precipitation exceeds a threshold wettest days events could mean up to 65%
set by the annual 99th percentile of wet days more rain by the 2050s, and 120% by the
during the baseline period (1971–2000). This 2080s. These projected large increases mean
measure indicates how much total annual that we can expect more frequent and more
precipitation falls during these heavy events, intense storms in the future, with more rain
which is a combination of both how often these falling during extreme downpours. Sub-regional
events occur and the size of these events. percentile changes are in line with the regional
projections.
19
Climate Projections for the Cowichan Valley Regional DistrictPRECIPITATION INDICATORS
1-in-20 Wettest Day
ABOUT THIS INDICATOR PROJECTIONS
The 1-in-20 wettest day is the day so wet that it More precipitation is expected to fall during the
has only a 1-in-20 chance of occurring in a given 1-in-20 (or 5% chance) wettest day extreme
year. That is, there is a 5% chance in any year storm events in the future. 1-in-20 wettest
that a 1-day rainfall event of this magnitude will day events could be about 30% more intense
occur. This indicator is useful when planning for by the 2050s, and almost 40% by the 2080s.
future infrastructure and forest production. Sub-regional projections indicate that the wetter
areas will become increasingly wetter over time,
and indicate we should expect year-to-year
variability in precipitation levels.
table 7: EXTREME PRECIPITATION IN THE SUB-REGIONS
Developed Area Water Supply Watersheds West Coast Watersheds
Past 2050s 2080s Past 2050s 2080s Past 2050s 2080s
(mm) Change Change (mm) Change Change (mm) Change Change
(mm) (mm) (mm) (mm) (mm) (mm)
Single-day maximum 61 10 18 79 14 24 87 15 25
precipitation (2 to 19) (6 to 28) (2 to 24) (8 to 35) (4 to 26) (11 to 34)
Five-day maximum 139 14 33 186 20 43 206 22 45
precipitation (5 to 29) (8 to 47) (4 to 37) (14 to 60) (7 to 38) (11 to 34)
329 96 193 471 139 265 536 158 297
95th-percentile wettest
days precipitation (16 to 185) (129 to 277) (44 to 263) (168 to 371) (54 to 296) (2015 to 410)
99th-percentile wettest 100 63 123 141 87 166 158 101 183
days precipitation (26 to 105) (59 to 182) (38 to 144) (92 to 219) (50 to 163) (107 to 231)
1-in-20 wettest day 95 23 34 118 38 49 128 42 48
precipitation (8 to 41) (13 to 52) (11 to 59) (27 to 70) (21 to 60) (30 to 69)
20
Climate Projections for the Cowichan Valley Regional DistrictSummer Temperature Indicators
T he downscaled outputs from the climate
models project warming in average summer
(June-July-August) daytime high temperatures.
PROJECTIONS
In the past, our region experienced 16 “summer
23 summer days in the past. By the 2050s, 54
summer days a year are projected, and 78 by
days” a year, and we can expect significantly the 2080s. This marks a significant change from
While warmer temperatures may have benefits the past.
more in the future. Models project more than
and be welcomed in some ways, they will also
need careful consideration when planning for a double the number of summer days by the
The map for summer days included below shows
growing population in the region. Descriptions 2050s, and more than triple by the 2080s. This that the number of hot days are projected to be
of these indicators are offered below, and means that future summers may have 39 days highest in the eastern reaches of our region, with
values for these projections are given in Table 8: above 25°C by the 2050s, and 59 days by the the greatest changes in the Developed Area with
Hot Summer Indicators. Sub-regional numbers 2080s. The Developed Area, where the majority the most population that already experiences
illustrate that temperatures are generally warmer of the population is concentrated, experienced warmer temperatures.
in the Developed Areas, and cooler in the West
Coast Watersheds, while projected changes are
relatively uniform across the region. Sub-regional
values are given in Table 9: Hot Summers in the Figure 13:
Sub-Regions. These indicators are useful when Annual Summer
planning for agriculture, and for understanding Days – 2050s
how ecological systems will change over time,
including fish productivity and plant growth.
Summer Days
ABOUT THIS INDICATOR
Summer days tells us how many days reach
temperatures over 25°C in any one year. This
measure indicates how often we can expect
“summer weather” to occur in the future.
21
Climate Projections for the Cowichan Valley Regional DistrictSUMMER TEMPERATURE INDICATORS
Summer Temperature Indicators
table 8: HOT SUMMER INDICATORS – REGIONAL AVERAGES
2050s Change (days) 2080s Change (days)
Past (days) 2050s (days) 2080s (days)
Average (Range) Average (Range)
Summer days
16 39 59 23 (15 to 32) 43 (28 to 62)
(# of days >25°C)
2050s Change (°C) 2080s Change (°C)
Past (°C) 2050s (°C) 2080s (°C)
Average (Range) Average (Range)
Hottest daytime high (°C) 30 33 35 3.3 (2.0 to 4.0) 5.5 (3.9 to 7.2)
1-in-20 hottest daytime high (°C) 33 37 39 4.1 (2.6 to 5.2) 6.0 (4.1 to 7.9)
table 9: HOT SUMMERS IN THE SUB-REGIONS
Developed Area Water Supply Watersheds West Coast Watersheds
Past 2050s 2080s Past 2050s 2080s Past 2050s 2080s
(days) Change Change (days) Change Change (days) Change Change
(days) (days) (days) (days) (days) (days)
Summer days 23 31 55 16 21 40 10 18 36
(# of days >25°C) (19 to 42) (35 to 78) (13 to 30) (27 to 57) (11 to 26) (25 to 48)
Past (°C) 2050s 2080s Past (°C) 2050s 2080s Past (°C) 2050s 2080s
Change Change Change Change Change Change
(°C) (°C) (°C) (°C) (°C) (°C)
Hottest daytime 31 3.5 5.7 30 3.3 5.5 29 3.1 5.2
high (°C) (2.2 to 4.4) (3.9 to 7.7) (2.0 to 4.0 (3.9 to 7.3) (1.9 to 3.6) (3.8 to 6.7)
34 4.3 6.3 33 4.2 6.0 33 3.8 5.6
1-in-20 hottest
daytime high (°C) (2.6 to 5.8) (4.3 to 8.6) (2.8 to 5.3) (4.3 to 8.1) (2.5 to 4.7) (3.8 to 7.0)
22
Climate Projections for the Cowichan Valley Regional DistrictSUMMER TEMPERATURE INDICATORS
Hottest Day
ABOUT THIS INDICATOR
Hottest day refers to the highest daytime high
temperature of the year, usually experienced
during the summer months. The maximum for
each year is an indicator of extreme temperatures
and is averaged over a 30-year period.
PROJECTIONS
The past hottest day temperature was 30°C
for the region. We can expect increases to
over 33°C by the 2050s, and almost 36°C by
the 2080s. Like summer days (shown above)
the highest increases can be expected in our
region’s Developed Area. An increase in hottest
day temperatures is projected to cause up
to one week of tropical nights (nights when
temperatures do not decrease below 25°C) in the
future. These warming trends are similar in the
sub-regions.
Figure 14: Annual Hottest Days – 2050s
23
Climate Projections for the Cowichan Valley Regional DistrictSUMMER TEMPERATURE INDICATORS
1-in-20 Hottest Day
ABOUT THIS INDICATOR
1-in-20 hottest day refers to the day so hot that
it has only a one-in-twenty chance of occurring
in a given year. That is, there is a 5% chance
in any year that temperatures could reach this
magnitude.
PROJECTIONS
As temperatures warm, so will extreme heat
events. Our past 1-in-20 hottest day temperature
is about 33°C. By the 2050s we can expect
this value to increase to over 37°C, and to over
39°C by the 2080s. In low-lying areas where
the population is centered, like Duncan the past
event is about 34°C and we can expect 1-in-20
hottest day temperatures to rise by 4°C to 38°C
by the 2050s, and to over 40°C by the 2080s.
This is a significant departure from what the
region is accustomed to experiencing.
The 1-in-20 hottest day temperatures are
projected to affect the entire region, and like
other hot summer indicators, are mostly likely to
affect valleys and eastern reaches. Figure 15: 1-in-20 Hottest Day – 2050s
24
Climate Projections for the Cowichan Valley Regional DistrictSUMMER TEMPERATURE INDICATORS
Cooling Degree Days
ABOUT THIS INDICATOR table 10: COOLING DEGREE DAYS
Cooling degree days refers to the number 2050s Percent Change 2080s Percent Change
of degrees that a day’s average temperature Past 2050s 2080s (%) (%)
is above 18°C, and is used to estimate the (degree (degree (degree
days) days) days) Average (Range) Average (Range)
use of air conditioning to cool buildings. To
determine the number of cooling degree days in
a month, the number of degrees that the daily Region 28 136 272 387 (213 to 575) 868 (512 to 1387)
temperature is over 18°C for each day is added
to give a total value.
Developed
47 208 387 342 (198 to 515) 720 (439 to 1172)
Area
PROJECTIONS
Historically there has been very little demand
for cooling in the Developed Area of our region.
This is reflected in the baseline average of 47
cooling degree days in the past. In the future
Historically there has been very little demand for cooling in the
it is projected that there will be an over 300% Developed Area of our region. The large relative increases are
increase in cooling degree days by the 2050s,
partly due to a low historical baseline.
and an over 700% increase by the 2080s. The
large relative increases are partly due to a low
historical baseline.
25
Climate Projections for the Cowichan Valley Regional DistrictSUMMER TEMPERATURE INDICATORS
Cooling Degree Days, Continued
Figure 16: Cooling Degree Days – Past Figure 17: Cooling Degree Days – 2050s
Cooling degree days refers to the number of degrees that
a day’s average temperature is above 18°C, and is used to
estimate the use of air conditioning to cool buildings.
26
Climate Projections for the Cowichan Valley Regional DistrictSUMMER TEMPERATURE INDICATORS
Growing Season Length
ABOUT THIS INDICATOR table 11: GROWING SEASON LENGTH
Growing season length is an annual measure
that counts the number of days between the Past 2050s 2080s 2050s Change (days) 2080s Change (days)
first span of at least six days with a daily average (days) (days) (days)
temperature greater than 5°C and the first span Average (Range) Average (Range)
after July 1 of six days with temperature less
than 5°C. It indicates the length of the growing Region 237 303 337 66 (46 to 80) 100 (85 to 113)
season for typical plants or crops.
Developed
PROJECTIONS 262 322 349 60 (47 to 71) 87 (78 to 94)
Area
In the past, our region had an average of 237
days in the growing season. We can expect 66 Water
days will be added to the growing season by Supply 218 287 328 69 (46 to 86) 110 (89 to 126)
Watersheds
the 2050s, and 100 days by the 2080s, resulting
in nearly a year-round growing season of 337
West Coast
days on average. In forest ecosystems at higher 232 301 337 69 (49 to 85) 105 (92 to 118)
Watersheds
elevations, the growing season will lengthen
by more days as higher temperatures creep up
the mountains and more days tip over the 5°C
threshold. By the 2080s, we will see a growing-
season length at higher elevations similar to that
projected for the Developed Area (337 days and
349 days respectively).
27
Climate Projections for the Cowichan Valley Regional DistrictSUMMER TEMPERATURE INDICATORS
Growing Season Length, Continued
Figure 18: Growing Season Length – Past Figure 19: Growing Season Length – 2050s
We can expect 66 days will be added to the growing
season by the 2050s, and 100 days by the 2080s.
28
Climate Projections for the Cowichan Valley Regional DistrictSUMMER TEMPERATURE INDICATORS
Growing Degree Days table 12: GROWING DEGREE DAYS
2050s Percent Change 2080s Percent Change
Past 2050s 2080s
ABOUT THIS INDICATOR (%) (%)
(degree (degree (degree
Growing degree days are a measure of heat days) days) days) Average (Range) Average (Range)
accumulation that is useful for agriculture and
horticulture. Growing degree days are calculated Region 1505 2238 2807 49 (26 to 74) 85.3 (53 to 121)
by how much warmer daily temperatures are
Developed
compared to a base temperature of 5°C (note: 1772 2588 3177 46 (25 to 69) 79.4 (48 to 113)
Area
5°C is used for this report, though different
Water
base temperatures may be used for different
Supply 1380 2074 2605 51 (26 to 78) 88.8 (54 to 127)
crops). For example, if a day had an average Watersheds
temperature of 11°C, that day would have a
value of 6 growing degree days. Annual growing West Coast
1384 2079 2611 50 (28 to 77) 88.8 (55 to 126)
Watersheds
degree days are the total of adding this for
each day of the year. This measure is useful for
determining future agricultural opportunities,
and to understand drivers of change in ecological
Figure 20:
systems, for example fish productivity. Growing Degree
Days – Anomaly
PROJECTIONS
In the past, there were 1505 growing degree
days on average in our region. Projections
indicate increases in growing degree days
throughout the region. By the 2050s, we can
expect 49% more growing degree days, and
85% more growing degree days by the 2080s.
Similar to the growing season length, trends
in the sub-regions are in line with regional
projections, with slightly more increases in higher
elevations.
29
Climate Projections for the Cowichan Valley Regional DistrictWinter Temperature
Indicators
F uture climate projections suggest our region
can expect to see warmer winter months.
These indicators provide insight into the “new
normal” for winter temperatures in our region,
and are useful when trying to determine how
local ecological systems will change over time.
Warmest Winter Day
ABOUT THIS INDICATOR
Warmest winter day is the highest temperature
recorded during the winter months, in an
average year. This indicator is helpful to
understand winter temperature trends when
considered in combination with the coldest
winter night temperatures below. table 13: WARMER WINTER TEMPERATURES
PROJECTIONS 2050s Change (°C) 2080s Change (°C)
Past 2050s 2080s
By the 2050s, we can expect to see the warmest (°C) (°C) (°C) Average (Range) Average (Range)
winter temperature to rise from 12°C to about
14°C. This value may increase to about 17°C by Warmest
12 14 17 2.7 (0.2 to 5.2) 5.2 (1.8 to 10.3)
the 2080s (projections range from 14°C to 22°C, winter day
depending on the model). Sub-regional trends
Coldest
are similar to regional trends. -10 -6 -3 4.1 (2.3 to 5.7) 6.7 (4.8 to 7.9)
winter night
1-in-20
-17 -13 -10 3.8 (1.8 to 5.5) 6.5 (4.5 to 7.9)
coldest night
30
Climate Projections for the Cowichan Valley Regional DistrictYou can also read