Flood Management Strategy Port Phillip and Westernport - Melbourne Water
←
→
Page content transcription
If your browser does not render page correctly, please read the page content below
Flood Management Strategy Port Phillip and Westernport
This strategy reflects the work
and expertise of floodplain
managers across the region.
Melbourne Water prepared
this strategy with governance
and oversight from a Project
Control Board representing
key stakeholders.

ACKNOWLEDGEMENTS
Our Flood Strategy Project Control Board included representatives from:

Bureau of Meteorology                                       Insurance Council of Australia
City of Kingston                                            Melbourne Water
City of Melbourne                                           Metropolitan Planning Authority
City West Water                                             Municipal Association of Victoria
Department of Environment, Land, Water and Planning         South East Water
Department of Health and Human Services                     Victoria State Emergency Service
Emergency Management Victoria                               Wyndham City Council

Melbourne Water thanks these organisations for their involvement; it means we now share a vision
and an understanding of the challenges facing our region and the best ways to address them.

Cover: Wayne Hawkins/Fairfax Syndication
Contents
PREFACE                                                 2   SECTION 4 Actions                                                       22
                                                            Understanding the risk and sharing information                          22
EXECUTIVE SUMMARY                                      3
                                                            Taking action to manage current and future risks                        30
SECTION 1 Introduction                                 5    Working together to improve our effectiveness                           41
Why we need a flood strategy                            5
                                                            SECTION 5 Delivering this strategy                                      45
The focus of this flood management strategy             6
                                                            Endorsement and participation                                           46
About the Port Phillip and Westernport region           7
                                                            Implementation                                                          46
The impact of floods                                   10
                                                            APPENDIX 1 Flood management roles                                       48
SECTION 2 Managing flooding in our region              13
Who participates in floodplain management?             13   GLOSSARY                                                                50
Policies and strategies influencing flood management   15   Acronyms                                                                53
How flooding is managed                                16
                                                            BIBLIOGRAPHY                                                            53
SECTION 3 A shared vision for Port Phillip
and Westernport                                        17
Key performance indicators                             18

                                                                         Flood Management Strategy – Port Phillip and Westernport    1
Preface

Melbourne Water prepared this strategy by consulting widely with those involved in delivering flood
management, and people affected by floods. Consultation included discussions and workshops with many
stakeholders including state government departments, councils, emergency services, and communities.

This strategy reflects the effort and activities of all organisations contributing to floodplain management
across the region. Throughout this strategy, ‘we’ refers to all relevant flood management agencies, including
those who help to manage floods through policy, urban planning and development, emergency response,
and water management activities.

Most government organisations with a role in flood management for the Port Phillip and Westernport region
have contributed their expertise through research and consultation, and development of the draft and
final strategy. They will be invited to contribute to implementing this strategy, and monitoring its progress.

Urban growth and climate change will increase flood risks facing the region.

      Research                   Draft
        and                     Strategy                    FINAL
                                                          STRATEGY   Implementation
    consultation              consultation

2      Flood Management Strategy – Port Phillip and Westernport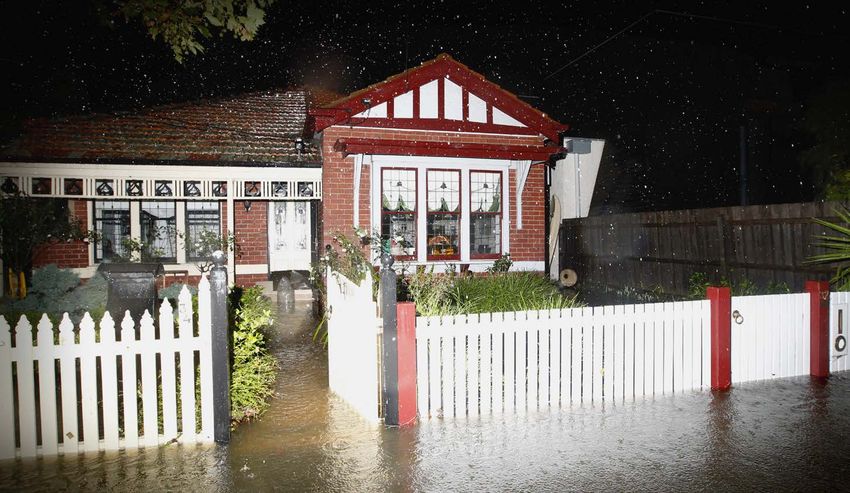
Flooded road, Narre Warren
Image by David Dashwood

Executive summary

A new strategy                                                                   Flooding in our region
This strategy builds on many years of flood management                           The Port Phillip and Westernport region houses approximately
experience, to improve how we manage and reduce flood                            4 million people, and the population is expected to almost
risks across Port Phillip and Westernport. It is aligned with                    double in size by 2050.
the Victorian Floodplain Management Strategy, emergency
                                                                                 The region is unique in Victoria for the large number of
management arrangements and planning policy.
                                                                                 organisations that have flood and drainage responsibilities.
Through this strategy we will continue building our collective                   Approximately 232,000 properties are estimated to be at risk of
knowledge and capability, drawing on a wide range of flood                       flooding (with at least a 1% chance per year). The annual average
management approaches to better address community                                damage caused by flooding is estimated to be $399 million.
concerns, minimise the effects of floods, and manage the
challenges of urban growth and climate change. Through                           As well as being our most expensive natural disaster,
this work we can make an important contribution to the                           flooding creates serious hazards for some communities.
liveability of our region.                                                       Climate scientists project that the intensity of heavy rainfall
                                                                                 events will increase and that the sea level will continue to rise,
                                                                                 increasing the severity and regularity of flood events1. Climate
                                                                                 change increases the challenges we face in managing flood
                                                                                 risk in the region.

1. CSIRO and Bureau of Meteorology Climate Change in Australia Projections Cluster Report – Southern Slopes, 2015.

                                                                                                  Flood Management Strategy – Port Phillip and Westernport   3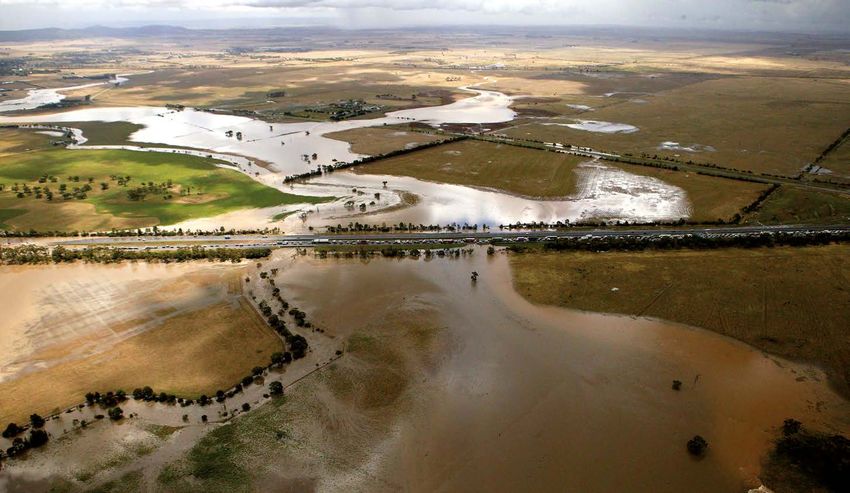
New directions                                                    Three key objectives and a program of actions are set out to
                                                                  deliver the vision and address the challenges and opportunities
Through delivering flood management services, and through         for our region:
consultation to develop this strategy, we have identified key
challenges and opportunities for our region. This strategy        OBJECTIVE 1    The right information is available at the
outlines improvements we will make to meet them:                  right time to people who need it.

• A
   better understanding of the impact of climate change is       Activities to deliver objective 1 include:
  essential to planning ahead. We must use this information       • D
                                                                     eveloping a better understanding of flood risks by updating
  to inform the decisions we make and support our adaptation        our flood mapping and risk assessment approaches, and
  planning. We will work together to produce the right              improving opportunities for the community to help set
  information for all decision makers and consider it in            flood management priorities
  our flood risk management activities.
                                                                  • S haring information and skills to better enable all flood
• W
   e recognise that flooding cannot be physically ‘fixed’ or        managers to be as effective as possible
  removed entirely; in many locations the cost of works would
  be far greater than the value of the properties they would      • E ngaging communities and building their awareness to
  protect. Therefore we will continue working to manage the          support resilience and preparedness, and reduce the
  risk, and to reduce the consequences of floods when they           consequences of floods.
  do happen.
                                                                  OBJECTIVE 2 Flood risks are addressed to reduce impact and
• T
   here are many different ways to reduce and manage flood
                                                                  get the best social, economic and environmental outcomes.
  risks, from education to urban planning, insurance, flood
  warning systems and sometimes structural measures.              Activities to deliver objective 2 include:
  Finding the right mix of flood management solutions for
  each location is essential. Increasing opportunities for        • M
                                                                     anaging existing flood risks using a wide range of
  community and stakeholder input will help us to identify          management approaches to address the issues of most
  the issues of most concern, and develop appropriate               concern to communities, and to reduce the consequences
  solutions for each area.                                          when a flood does occur

• M
   anaging urban growth and development well is critical to      • M
                                                                     anaging urban development and growth to avoid new
  avoid creating new risks. By improving how we manage extra        risks in known floodplains, and manage new urban
  stormwater from new developments and urban consolidation,         stormwater runoff
  we will help avoid new risks while also achieving other         • B
                                                                     uilding our understanding of how climate change will affect
  benefits for the region.                                          flooding, and ensuring the best-available information is used
• M
   any organisations contribute to flood risk management           to support good decisions and adaptation planning.
  through their work in urban planning, managing drainage
  and civil infrastructure, planning for coasts and open space,   OBJECTIVE 3 Land, water and emergency agencies work
  and responding to emergencies. By ensuring the right            together to manage flooding effectively.
  information is available to everyone and improving              Activities to deliver objective 3 include:
  coordination, we can improve the effectiveness of
  all these activities.                                           • C
                                                                     larifying roles, responsibilities and accountabilities within
                                                                    the Port Phillip and Westernport region to support effective
How we will deliver flood                                           service delivery in the region
management services                                               • C
                                                                     oordinating activity and management approaches across
This strategy sets out a shared vision for flood                    waterways, water supply systems and catchments.
management in the region:
                                                                  Delivering the strategy
“Together we are aware, responsive
                                                                  Melbourne Water and the many contributing organisations
 and resilient. Communities, business                             will deliver the actions and outcomes set out in this strategy.
 and government understand flooding,
                                                                  Governance and implementation plans will be developed to
 plan for challenges, and take action                             support ongoing oversight by key stakeholders and to support
 to manage risks.”                                                monitoring, reporting and review activities.

4    Flood Management Strategy – Port Phillip and Westernport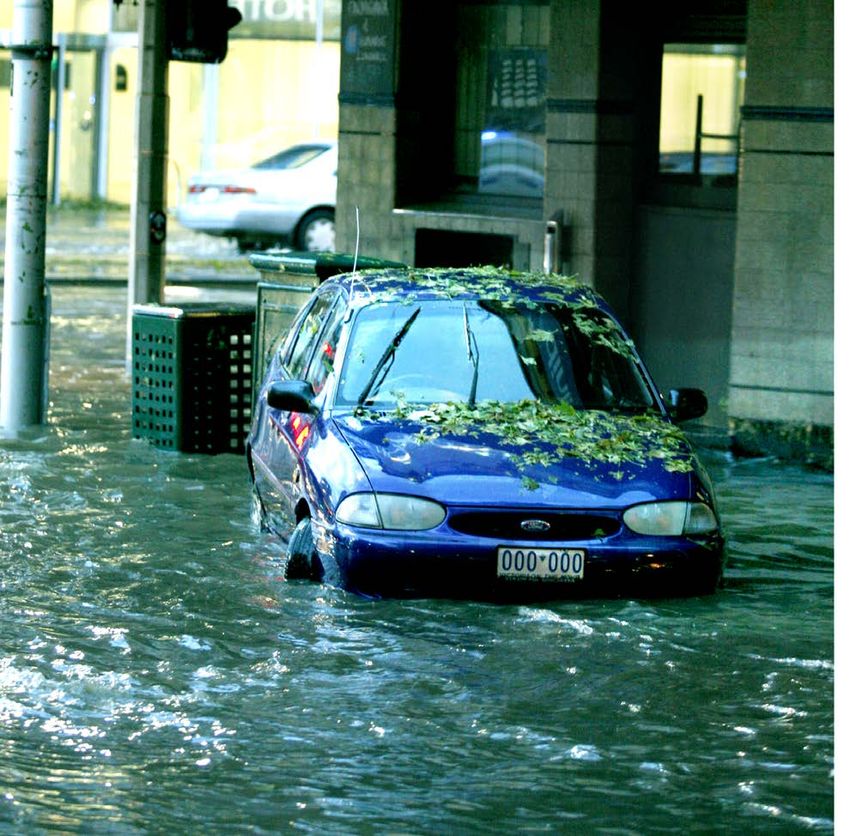
Floodwater is dangerous – never drive, walk or ride through floodwater.

SECTION 1
Introduction
This section outlines the impact of flooding in our region, and the scope of this strategy.

Why we need a flood strategy
Flooding is natural and inevitable. Like fire and other natural hazards, it is a part of the
Australian landscape. Climate change will increase flood risks.
Floods are a natural occurrence in the Port Phillip and                   It sets out a vision for flood management across Port Phillip
Westernport region. We can’t stop them happening,                         and Westernport, and creates a framework to help guide the
but we can plan for and manage the risk, and reduce                       work of the many organisations who participate in preventing
the consequences.                                                         or managing flood risks to deliver on this vision.

This strategy sets out how we will work to understand,                    This strategy is part of the Victorian ‘all hazards, all agencies’
avoid and reduce flood risks, and how we can support flood                approach to emergency risk assessment, prevention,
emergency preparation and response, across the region.                    preparedness, response and recovery.

                                                                                         Flood Management Strategy – Port Phillip and Westernport   5
The focus of this flood management strategy
    The focus of this strategy is the prevention and preparation aspects of flood management (highlighted in blue in the
    diagram below). This work supports flood emergency response and recovery activities.

    Flood management: prevention, response and recovery

                                                                     RESPONSE
                                                                 Personal response plans
                                                                      Sandbagging
                                                                       Monitoring
                                                                       Evacuation

                                            Warnings                                      Temporary
                                          Information                                  accommodation
                                           Education                                    Relief centres
                                                                      Planning
                                                                    Preparedness
                                                                       Training
                                                                 Community awareness
                                                                       Funding
                                                                      Advocacy
                    PREVENTION                                                                  RECOVERY
                      Urban planning                                  Insurance                   Community
                Legislation and regulation                            Rebuilding               support programs
                    Land use controls                              Community action               Counselling
                     Structural works                                Restoration                Personal support
                   Asset management                                   Advocacy                    Material aid

    Flood prevention and preparation activities help reduce the impact of floods, and in some places, the likelihood.
    They also support emergency response and recovery activities.

    (There is more information about the activities contributing to prevention, response and recovery throughout
    this document. Appendix 1 shows a summary of flood management roles).

6     Flood Management Strategy – Port Phillip and Westernport
SECTION 1

About the Port Phillip and Westernport region                    It is estimated that approximately 232,000 properties have
                                                                 at least a 1% chance of flooding in any given year. The annual
Our region covers approximately 13,000 square                    average damage caused by floods in our region is estimated to
                                                                 be approximately $399 million (you will find more information
kilometres, extending from high in the Yarra
                                                                 about the number of properties at risk on page 10).
Ranges to the east, to Ballan in the west, to
                                                                 The consequences of floods are serious for people living in
Kinglake in the north, and south to include                      affected areas, and can have major economic repercussions
Mornington Peninsula, and Phillip and                            for the state. As the region continues to grow, we need to
French Islands.                                                  manage the risks to avoid new or increased hazards to people,
                                                                 and minimise property and environmental damage, economic
                                                                 costs, and disruption to communities.
Our region is home to over four million people. It is densely
covered with homes, businesses, farms and infrastructure.        Our region is unique in Victoria because of the many
                                                                 different organisations that work together to manage flood
The region’s population is expected to almost double by 2050.2   risks: 38 councils, water authorities, policy and urban planning
This means that floods have the potential to affect a great      organisations, and emergency response and recovery agencies.
number of people and assets.
                                                                 2. Plan Melbourne 2013, Victoria in Future 2014.

     The Port Phillip and
     Westernport Region
     The region includes five
     major river basins: the
     Werribee, Maribyrnong and
     Yarra rivers, Dandenong
     Creek, and the Westernport
     river systems. These river
     basins make up most of the
     catchments of Port Phillip
     and Westernport Bays.
     Legend:
         Major waterway
         Region
         Established urban area
         Growth corridors

                                                                                  Flood Management Strategy – Port Phillip and Westernport   7
A short history of flooding in the                               Drainage systems built as part of early developments were
Port Phillip and Westernport Region                              not designed to hold the volumes of water we now know
                                                                 can flow through our landscape. When there is more runoff
Floods are a part of the natural water cycle and have always     than underground drains can carry, water can overflow onto
occurred in our region. Urban and agricultural development has   surrounding land, flooding roads and properties. Where
changed the landscape, affecting how water moves through         development has occurred without appropriate overland
catchments, and placing people and buildings in the path         flood pathways, new drainage or flood management
of floodwaters.                                                  infrastructure can be very expensive to retrofit.
Aboriginal inhabitants of our region harvested food and other    Urban development standards for flooding were improved
resources from waterways and floodplains. Floodplains retain     in the 1970s when new suburbs were required to provide
important cultural significance.                                 space for floodwaters to be stored and space to flow overland.
                                                                 Suburbs developed since then have a much lower risk of
Because of their fertile soils and access to water and rivers,
                                                                 flood damage.
later European settlement and urban development often
occurred on floodplains.                                         The history of the Port Phillip and Westernport region has
                                                                 been marked by many serious and damaging floods. In some
This has placed buildings and people in the path of flooding.
                                                                 locations small, frequent flooding causes significant local
We have also increased the volume of floodwater by clearing
                                                                 damage, inconvenience and disruption.
forests and developing land; water now flows more swiftly
off the surface of cleared and paved landscapes, instead of      Approaches like stormwater capture and integrated water
filtering into soils. This increases flooding along waterways    management (IWM) will enhance our ability to respond to
and on low-lying land.                                           climate change.

Yarra river in flood, Southbank
Image by Nicole Garmston/Newspix

8    Flood Management Strategy – Port Phillip and Westernport
SECTION 1
HISTORY OF FLOODING
This diagram shows a number of key flood events throughout Melbourne’s history. There are more recent events
included because flood records have become more accurate over the past few decades.
Port Phillip and Westernport Flooding
1891 1972
1934
1974
Melbourne: Elizabeth St,
The Great Melbourne CBD:
Flood Across the 78.5 mm of rain Maribyrnong
Yarra catchment: in 1 hour River:
over 200 mm of
110 mm of rain
rain in 48 hours
in 48 hours
1983 1996
1994
Werribee: Bunyip:
60 mm of rain 42 mm of rain
in 24 hours St Kilda
in 24 hours
Marina: highest
tide reading
of 1.29 m
2004 2006
2003
2005
Darebin, Eastern and Northcote
Banyule, north-eastern and Coburg:
Whitehorse and Melbourne
suburbs: severe region: up to 75.2 mm of rain
Manningham: localised storms in 30 minutes
106.5 mm of rain 125 mm of rain
in 2.5 hours in 24 hours;
widespread
riverine flooding
2012
2011 2014
Koo Wee Rup:
80 mm of rain
Melbourne CBD, St Kilda Marina:
over 2 days
Elwood, Werribee second-highest
and Bunyip regions: tide reading of
up to 150 mm of 1.28 m
rain in 14 hours
Flood Management Strategy – Port Phillip and Westernport 9The impact of floods The annual average damage (AAD) costs of flooding in the Port
Phillip and Westernport region are estimated to be approximately
Floods are dangerous to people. Drownings and injuries $399 million. Insurance industry information indicates that
can occur, and floodwaters can become contaminated with floods are our most expensive natural hazard.
sewage and other pollutants that pose health risks to people.
More properties will be affected in the future if flood patterns
It is estimated that there are approximately 232,000 properties change as a result of predicted climate change or unmanaged
across the region that have at least a 1% chance of flooding urban growth.
in any given year.3 It is estimated that approximately 50,000
buildings have at least a 1% chance of flooding above floor
level in any given year.4
Estimating annual average damage (AAD)
The estimated annual average damage cost across the Port Phillip and Westernport Region is $399 million.
This AAD estimate includes damage to residential and commercial buildings and properties, damage to roads,
and some of the broader economic consequences of floods.
Coastal flooding, environmental damage, some agricultural damage and the intangible personal effects of
flooding are not directly included in this figure because accurate dollar values cannot be easily determined.
Extremely rare, very large floods, extreme damage
$36
Major flooding, extensive damage
The area under the curve represents annual average damage
Damage ($)
$118 $245
Moderate flooding, damage is more widespread
Minor floods, some
local damage
Legend: Annual Exceedance Probability (%)
Local drains
LESS THAN 1% 5% 10% 15% 20% 25% OCCURS
Regional drains 1% CHANCE EVERY
PER YEAR YEAR
Waterways
Annual average damage ($ millions)
Annual average damage is calculated for all flooding across the region. The pie chart shows the estimated
contribution of flooding along waterways and drainage systems.
The area chart shows the estimated contribution to annual average damage by large, infrequent floods and smaller,
frequent floods. The area in blue is the total estimated damage in any given year. (Note that the annual average
damage calculation does not include intangible effects such as stress).
3. This estimate has been developed using existing and extrapolated data. Existing data included mapping of 1% Annual Exceedance Probability (AEP) flood
extents (that is, a flood with a 1% chance of occurring in any given year) along waterways and regional drainage systems, and mapping of local drainage
systems where available. This data was then used to make estimates of the number of properties likely to be affected in areas that are yet to be mapped
for flooding. It will be revised as more data is collected over time.
4. This estimate has been developed using existing and extrapolated data. Floor level data has been gathered through surveys of building floor levels in some
flood mapped areas. This information has been extrapolated to estimate the number of floors that may be affected on all properties where flooding may
occur. This estimate will be revised as more data is collected over time.
10 Flood Management Strategy – Port Phillip and WesternportSECTION 1
Major floods can cause significant damage because floodwaters vehicles, and the loss of pets and possessions of personal
can be deep, fast moving and widespread. Flooding deep enough value, were the most serious negative consequences.
to cover ground floors can cause extensive damage to buildings
and public infrastructure over large areas; however, such large Floods can also damage the natural environment, causing
events are typically quite rare. erosion, pollution, and ecological losses to waterways,
wetlands and natural floodplains. Such damage may take far
Smaller, more frequent floods do not generally cause such longer to repair than damage to buildings and infrastructure
widespread physical impacts, but the cumulative cost of and in some cases it is permanent. Environmental damage
repeated local damage, disruption and social effects (such may cause further recreational and economic effects such
as emotional stress) can be significant where they occur. as damage to fisheries.
The personal and social costs of flooding are difficult to In some areas, floodwaters have environmental benefits; for
quantify in monetary terms, but should not be overlooked. example, providing natural seasonal changes in streamflow,
Those who have experienced floods report that the long-term replenishing water to natural wetlands and floodplains, and
stress and disruption arising from damage to homes and supporting native vegetation.
Mapped flooding in Port Phillip and Westernport
This diagram shows Melbourne Water flood mapping for areas with a 1% chance of Legend:
flooding in any given year. (It does not include flood mapping by other authorities). Stormwater flooding
Riverine flooding
Coastal flooding
Established urban area
Growth corridors
Flood Management Strategy – Port Phillip and Westernport 11What happens when it floods
Flooding is a part of the natural environment.
We can’t stop it, but we can manage the risk.
Natural Floodplain –
Flooding can benefit natural
landscapes.
Riverine flooding occurs
where we’ve built in natural
floodplains – when rainfall
exceeds the capacity of a river
or creek it overflows onto the
surrounding land.
Flooding can happen in places you
might not expect. Overland flooding
happens when rainfall exceeds the
capacity of our drains and pipes.
Flooding is a risk to safety.
It can damage homes, causing
stress and personal loss.
Very high tides caused by
Flooding costs everyone and not just financially. storms can result in coastal
Even if you aren’t flooded, public transport and flooding. Climate change
roads can be blocked, stopping people getting could make this worse.
where they need to go. Flooding can cause
damage to workplaces, businesses and public
infrastructure. These issues have broad
economic impacts.
The Port Phillip and Westernport region is at risk of flooding and if we don’t continue to
manage these risks it could get worse. Within our region we know of approximately
232,000 properties at risk of flooding. Flooding is our most expensive natural hazard.
Floodwaters flow from the top of the catchment down into floodplains and waterway systems to the bays. On the way, they
affect people and properties.
12 Flood Management Strategy – Port Phillip and WesternportFlooded house, Elwood
Image by Paul Loughnan/Newspix
SECTION 2
Managing flooding in our region
Although we cannot stop floods occurring altogether, we can work to reduce the likelihood
in some locations, and to minimise the impact of flooding by being well prepared and ready
to manage the consequences. We can also plan ahead to understand, adapt to, or avoid
future risks.
Who participates in floodplain management?
Many organisations have a role in preparing for and managing Urban planning, development, and land and waterway
flood risks, including activities in prevention, preparation, managers have a role in helping to reduce the impacts of
response and recovery. floods by preserving natural floodplains and ensuring new
development doesn’t make flooding worse. Managers of local
Melbourne Water is the designated floodplain manager and regional infrastructure, including drains and roads, ensure
for the region. Melbourne Water develops flood information systems are designed and maintained to carry away most
for use by all organisations with a role in flood management, stormwater safely, without damage to properties. Emergency
to help reduce the likelihood and consequences of floods. response and recovery organisations respond to floods,
Melbourne Water also leads projects to address existing and helping to reduce safety risks to people and damage to
future flood risks across the region. Many other organisations property, and to clean up and repair damage.
lead projects to better understand and reduce flood risks
within their areas of operation.
Flood Management Strategy – Port Phillip and Westernport 13Summary of activities and responsibilities Victorian State Government departments and agencies
• S et policies, guidelines and standards for floodplain
Melbourne Water (regional drainage and floodplain
management, urban planning and development, and
management authority)
water resource management
• C
oordinates planning and delivery of flood management
• Support recovery from floods.
and drainage services across the region
• U
ndertakes catchment and coastal flood modelling
Emergency services agencies
and mapping
• Lead emergency preparation and response
• P rovides flood advice for new land use and development
as a Referral Authority • Deliver community awareness and education programs.
• Contributes information to warning services
Federal Government organisations
• Manages waterways • S et national policies and guidelines for flood and
• C
ontributes to development and use of integrated emergency management
water management (IWM) knowledge and tools • C
oordinate national research and data on a range
• Undertakes technical research. of flooding, weather and climate change issues
• Contribute to delivery of warning services
The 38 councils in the region
• C
ontribute funding to flood prevention and
• Manage local municipal planning schemes and policies recovery activities.
• Manage local drainage systems
• S upport local flood planning and coordinate local Communities, individuals and businesses
emergency planning • R
esponsible for understanding personal and local risks,
• Support development of local community resilience and being prepared for floods
• S upport implementation of state policies and regional • C
an contribute to development of local flood management
strategies through local flood management activities projects and plans.
• Can develop local water management strategies and plans.
Retail water authorities
• Manage urban water supply and sewage services
• Undertake technical research
• D
evelop and implement IWM infrastructure and tools
with other stakeholders.
Melbourne Water retarding basin holding floodwater, Narre Warren South
Image by David Dashwood
14 Flood Management Strategy – Port Phillip and WesternportState • Victorian Climate • Water supply policy and • Victorian Floodplain • Victorian Emergency
Change Adaption Plan IWM policies and plans Management Strategy Management Framework
• Victorian Waterway • State Flood
Implementation
Management Strategy Emergency Plan
SECTION 2
Regional • Plan Melbourne • Regional Healthy • Regional Flood • Central Flood
Waterways and Management Emergency Plan
Stormwater Strategies Strategy
Local • Precinct Structure Plans • Municipal water • Municipal Flood • Municipal Emergency
• Municipal Planning strategies Management Plans Management Plans
Policies (where applicable)
Policies and strategies influencing flood management
This strategy sits within a framework of related policies and strategies that work together to help prevent and manage flooding,
and support response and recovery. Many organisations are involved in delivering these policies and strategies.
Flood management and related policies and strategies:
LAND & WATER & FLOODPLAIN EMERGENCY
INFRASTRUCTURE WATERWAYS MANAGEMENT MANAGEMENT
State • Victorian Climate Change • Water supply policy and • Victorian Floodplain • Victorian Emergency
Adaption Plan IWM policies and plans Management Strategy Management Strategic
• Victorian Coastal • Victorian Waterway Action Plan
Implementation
Strategy Management Strategy
Regional • Plan Melbourne • Regional Healthy • Flood Management • Central Region Flood
• Central Regional Waterways and Strategy – Port Phillip Emergency Plan
Coastal Plan Stormwater Strategies and Westernport
Local • Precinct structure plans • Municipal water strategies • Municipal flood • Municipal flood
• Municipal planning policies (where applicable) management plans emergency plans
A VICSES worker exits a flooded underground car park, St Kilda
Image by James Croucher/Newspix
Flood Management Strategy – Port Phillip and Westernport 15How flooding is managed
Flood risks across the Port Phillip and Westernport region are managed according to national and state best practice standards
and guidelines.5
The flood management process in Port Phillip and Westernport
COLLABORATE AND CONSULT
Work with stakeholders to gather information, understand needs across the region, and improve processes for flood management
UNDERSTAND THE RISK OF FLOODS
Model and map floods and assess the risks they could pose Share information with those who need it
Engage communities to understand risk
MANAGE CURRENT AND FUTURE RISKS
Manage the flood risks we face now, focusing first on areas Avoid new risks by managing new urban development
where risks are most serious, and on activities that provide appropriately
good value for money
Plan ahead to understand and prepare for future risks
Build community resilience
Managing flood risks
• More people and • Climate change
NATURAL WATER CYCLES buildings in floodplains (more intense rainfall
Rain enters a catchment and moves • More hard surfaces and sea level rise)
through as groundwater and surface (reduced infiltration) • Erosion
runoff. Water flows into waterways
and can cause floods. FACTORS INCREASING FLOODING AND DAMAGE
FACTORS DECREASING FLOODING AND DAMAGE
Human activity
changes the landscape and • Knowing where • Reducing risks
creates flood risk where: floods occur - Control and capture
floodwaters
• Ensuring buildings
Hard paving and roofs and infrastructure are
- Allow more water
increase the speed and designed for safety
to filter into soil
volume of surface run-off • Managing risks
• Understanding how
People, buildings and farms - Plan for emergencies
landscape and climate
are placed in the path of change could affect floods - Community resilience
floodwaters - Insurance
5. Best practice and standards for our region are set out in the Draft Victorian Floodplain Management Strategy, 2015 and Managing the Floodplain: a guide to
best-practice flood risk management in Australia, 2013.
16 Flood Management Strategy – Port Phillip and WesternportSECTION 3
A shared vision for Port Phillip
and Westernport
This section outlines the vision and direction for flood management, progress we have made, and how we will build on past
achievements to continue providing effective flood management services to the community.
The following table sets out our shared vision, the supporting objectives and the detailed outcomes that will be delivered.
On the following page is an outline of the key performance indicators that will be used to track our progress against the vision,
objectives and outcomes.
Together we are aware, responsive and resilient. Communities,
VISION business and government understand flooding, plan for
challenges, and take action to manage risks.
OBJECTIVE 1 OBJECTIVE 2 OBJECTIVE 3
The right information is Flood risks are addressed to Land, water and emergency
available at the right time to reduce impacts and get the agencies work together to
people who need it. best social, economic and manage flooding effectively.
environmental outcomes.
OUTCOMES
• F lood data and risk information • F lood risk management programs • O
ngoing floodplain management
is produced and shared to meet and solutions are delivered for the activities are supported by clear
Port Phillip and Westernport best value, focusing on highest- roles and responsibilities.
priorities and needs. priority areas first.
• L and, water and emergency
• F lood decision makers have • F uture risks are identified and planning activities are well
up-to-date information, and the included in flood management coordinated to help reduce and
skills and capacity they need to planning. manage risks more effectively.
be effective. • N
ew developments and suburbs
• C
ommunities understand their are well planned, to avoid
flood risks and how they can increases in flood risk.
manage them. • U
rban growth is consistent with
state government policies and
strategies.
• R
isks associated with climate
change and urban development
are planned for and managed.
Flood Management Strategy – Port Phillip and Westernport 17Key performance indicators
We have developed key performance indicators (KPIs) to track the progress of the strategy. While each indicator has a primary
relationship with one objective, they work together to track how implementation of the overall strategy is delivering the vision.
The performance indicators in this strategy will be used to track progress over the five years to 2021.
The objectives and desired performance against each key indicator will be delivered through the contributions of all
participating organisations.
Objectives:
1. The right information is available at the right time 2. Flood risks are addressed to 3. Land, water and emergency
to people who need it. reduce impacts and get the agencies work together to
best social, economic and manage flooding and improve
environmental outcomes. effectiveness.
Key performance indicators (all relative to 2015 baselines)
By 2021
1. A 100% increase in the number of catchments 3. A 20% reduction in 4. A 100% increase in number
that are flood mapped to understand current flood effects. of areas for which there are
and future risks. collaboratively developed
Reduced flood effects will plans for flood management.
To meet this KPI, mapping will be: be measured against data
• Completed for the whole of the catchment and models of possible social,
• Completed to agreed standards economic and environmental
• Delivered for priority catchments impacts.
• Made publicly available.
2. A 40% increase in the number of people, directly
affected by flooding, who are aware of their risk.
Long term outcomes
These indicators measure progress toward the long This indicator measures progress This indicator measures progress
term outcome of ensuring that flood managers and toward the long term outcome toward the long term outcome
communities understand the risk of floods across the of reducing the negative effects of continuous and active
region, and can use this information in decision making. of floods as far as is practicably collaboration and joint problem
Good public awareness of flood risk is an essential possible. solving across the region.
first step toward preparedness and resilience.
Melbourne Water’s component of key performance indicators
1. A
100% increase in number of catchments 3. A 15% reduction in 4. Lead collaborative
that are flood mapped by Melbourne Water flood effects, achieved by development of 50% of
or in partnership with councils, to understand implementing Melbourne new flood management
current and future risks. Water programs and projects. options and delivery plans
for the region.
To meet this KPI, mapping will be:
• Completed for the whole of the catchment
• Completed to agreed standards
• Delivered for priority catchments
• Made publicly available.
2. A 20% increase in the number of people, directly
affected by flooding, who are aware of their risk.
The Melbourne Water component of these KPIs has been determined using feedback obtained through the development of this strategy and Melbourne Water’s
Price Submission. More information on these KPIs (including baselines and key assumptions) is included in the Measuring our Progress fact sheet, available at
www.melbournewater.com.au.
18 Flood Management Strategy – Port Phillip and WesternportSECTION 3
Progress so far Flood and drainage infrastructure
Flood and drainage infrastructure has been maintained, and
This strategy builds on a long history of flood and drainage in some locations upgraded to ensure it stores and removes
management and investments by Melbourne Water, councils, stormwater that would otherwise cause flooding. New flood
the Victoria State Emergency Service (VICSES) and others. and drainage infrastructure has been constructed in new
The 2007 Port Phillip and Westernport Flood Management and subdivisions to ensure they are protected from floods and
Drainage strategy (the 2007 strategy) was the first comprehensive to avoid increased flood levels downstream.
flood management strategy for the region. Through delivery
of the 2007 strategy, a strong foundation of flood data, Expanded network of streamflow gauges and flood
decision making processes and collaborative planning has warning services
been established. (This progress is outlined below). A flood warning service is provided on major waterways through
the work of BoM, VICSES and Melbourne Water. New rapid
Understanding the risk of floods warning services are being piloted in several locations at risk
of serious flash flooding. Warning services rely on a network
Improved knowledge
of streamflow gauges, flood models, weather and rainfall
A Melbourne Water program of flood modelling and mapping
forecasts, and warning message development and
has produced information about where floods could occur for
dissemination services.
much of the region. Flood maps are shared with government
agencies to support urban development and emergency
planning. Flood information about individual properties is Managing new development
shared when land is bought and sold, and on request. Melbourne Water and councils have worked together to
include information about flooding along waterways and
A standardised Flood Risk Assessment Framework (FRAF) major drainage systems in most planning schemes across the
for the region was developed in 2010. This enables the safety, region. Several councils have now also included information
social and economic impacts of floods to be quantified and about flooding along local drainage infrastructure in planning
understood in a systematic way. schemes, and some have included coastal inundation mapping.
Ongoing urban development and climate change could (More information about flood information in planning schemes
increase the likelihood and extent of floods in the future. is included in the Flood Information and Planning Schemes
Research and modelling is being undertaken to better fact sheet available at www.melbournewater.com.au).
understand and help manage these issues. Technical flood information is provided to councils to support
appropriate development on flood prone land. Information and
Improved community education, awareness strategic flood planning for growth corridor catchments is
and preparedness provided to the Metropolitan Planning Authority (MPA) to
VICSES, Melbourne Water and councils have delivered support appropriate greenfield development.
broad community flood education programs to 12,000 at-risk
households. Knowledge gained from delivering and evaluating Improving collaboration
these programs will be used to develop new education
Flood management plans
campaigns on flood risks and how to prepare for them.
Flood management plans and flood emergency plans have
been developed for each local municipality, documenting the
Managing flood risks most important flood issues, challenges and risks in each
Reduction in ‘intolerable’ flooding area, and setting out activities required to help address them.
Major drainage upgrades, warning and education programs
Developing these plans has enabled local and state
have been delivered to reduce flood risks. These programs
government organisations to share information and better
have been directed primarily towards locations where flood
understand respective priorities and investment programs.
risks were determined as ‘intolerable’. They have reduced
intolerable risks by 10% over each of the previous five-year
Melbourne Water financial planning periods. (Intolerable risk Improved collaboration
has been defined as catchments rated as having an ‘extreme’ A number of collaborative projects have been delivered over
risk using the FRAF. More information is included in the the past eight years, including research projects, trials and
following sections and the Risk Assessment fact sheet, joint flood risk reduction projects.
available at www.melbournewater.com.au).
Flood Management Strategy – Port Phillip and Westernport 19Key challenges and opportunities More collaborative decision making
Melbourne Water and other flood managers regularly
The experience and working relationships developed through
make decisions about where to undertake flood modelling
delivering the 2007 strategy have highlighted challenges and
and mapping, and where and how to invest in flood risk
opportunities to improve how we manage floods and plan for
management.
the future.
The processes and tools used to make these decisions will be
Getting the best outcomes from our investments updated and expanded to better enable input by all stakeholders
including communities, and to make the best use of the
Melbourne Water and councils have delivered a number of
increasing quantity and quality of information available.
programs and projects to reduce the risk of flooding. These
have included several significant infrastructure upgrades. Improvements to decision making processes outlined in the
actions in this strategy include:
Major infrastructure projects have been targeted at areas with
‘extreme’ risk (assessed using the Melbourne Water Flood Risk • U
pdates to the way stakeholder input is used to prioritise
Assessment Framework),6 and designed to benefit as many flood mapping projects
people as possible; however, they are generally very expensive. • U
pdated risk assessment tools to better understand the
In many places where flood risks are very high, the cost of impact of localised flooding
infrastructure works would likely outweigh the benefits they
• Improved processes to understand all benefits and costs
provide. Reducing flood risks cost-effectively, and within the
when developing best-fit solutions
timeframes expected by the community, is a significant challenge.
• Improved community input to option development and
To continue reducing risks across the region, with the resources choosing the right solutions.
available, we will consider all possible tools to manage floods
and reduce consequences. We will also continue working to build
6. M
ore information on the Flood Risk Assessment Framework is available
community resilience. (You will find more about these challenges in Section 4 and in the Flood Risk Assessment fact sheet, available at
and how we can meet them, next, and in Section 4). www.melbournewater.com.au.
The flood management decision making framework
More information and data will be used to inform the process
(e.g. local floods, community needs, costs and benefits and climate change)
Prioritise Assess Identify
and complete flood effects Prioritise Develop best-fit Implementation
mapping and risks locations options solution
Community and government input helps inform each step
This diagram shows the decision making framework outlined in this strategy, and how improved information will
be included.
20 Flood Management Strategy – Port Phillip and WesternportSECTION 3
Whole of catchment flood management Current risk assessment and investment frameworks are
focused on very large floods. Targeting risk management
Flooding can be increased or reduced by new land use and efforts more broadly to include areas of most concern to
development occurring across catchments when they affect communities (for example, by addressing more frequent
the volume and flow of stormwater. floods where the consequences are serious), will help
to ensure all stakeholder priorities are being addressed.
Managing floods across a whole catchment could include
It may help to manage the intangible consequences of
activities such as:
flooding as well as managing direct damage costs.
• M
anaging all urban development (including consolidation),
to ensure any extra runoff is appropriately treated
Climate change
• U
sing integrated water management approaches that better
link management of stormwater runoff to management of Climate change is expected to increase flood
other water services.
risks due to more frequent intense rainstorms,
These approaches may enable more efficient or effective and rising sea levels.
management of current and future flood risks, and better
overall community outcomes in the long term. (You will Some progress has been made toward understanding the
find more about these approaches on page 23). effects of climate change on flooding. Improved climate
change projections for our region can continue to build
our understanding of the likely impacts.
Managing all types of floods
Though the precise impacts in each location are still uncertain,
Though large, infrequent floods are expected to cause
flood managers can use the information we do have to start
widespread direct damage to buildings and infrastructure,
planning ahead now. By planning early, we can help communities
smaller and more frequent floods can also have serious
reduce or adapt to risks at the lowest possible cost.
impacts including some direct damage, disruption, and
intangible consequences such as stress.
Types of flooding and common terms:
MINOR FLOOD MAJOR FLOOD
Happens more frequently (smaller) Happens rarely (bigger)
Stormwater flooding
Riverine flooding
Coastal flooding
Some damage and disruption Widespread damage and disruption
This strategy focuses on all floods that have serious consequences for the community.
Flood Management Strategy – Port Phillip and Westernport 21Disruption caused by flooding, Princes Highway near Pakenham
Image by Ian Currie/Newspix
SECTION 4
Actions
This section outlines the actions required to deliver the vision and objectives of this strategy and to make progress against the
key performance indicators.
You will see that all the actions have a lead or several leading organisations, and most have some participants providing support
or input. (You will find more on these terms in the Glossary).
Understanding the risk and sharing information
OBJECTIVE 1 This covers:
The right information is available at • Understanding risks – flood mapping and risk assessments
• Sharing information and skills
the right time to people who need it.
• Engaging communities to build resilience and preparedness.
Key performance indicators:
1. A 100% increase in the number To meet this KPI, mapping will be: 2. A 40% increase in the number
of catchments that are flood • Completed for the whole of the catchment of people, directly affected by
mapped to understand current • Completed to agreed standards flooding, who are aware of
and future risks. • Delivered for priority catchments their risk.
• Made publicly available.
22 Flood Management Strategy – Port Phillip and WesternportSECTION 4
Understanding the risk
The following discussion and actions
are relevant to the flood mapping and Prioritise Assess
Prioritise Develop
Identify
and complete flood effects best-fit Implementation
assessing flood risk stages of the mapping and risks locations options solution
decision making framework.
The first step to managing floods is to We need further mapping to fill gaps and to update
older information.
understand where floods could happen,
and what the impacts could be. Mapping New mapping should be undertaken and verified using:
and risk assessments are used to • A
whole catchment approach, considering all parts
of the drainage system and all waterways together
understand these issues.
• Up-to-date landscape and drainage system data
Flood mapping • Data from actual floods where available.
Potential flooding is modelled and mapped to understand Risk assessment
where floodwaters are likely to collect and flow across the
landscape, how fast they might rise and fall, and how often. Risk is the combination of the likelihood and consequence
of flooding.9
Flood mapping has been undertaken across growth corridor
catchments, along most waterways and drainage systems Risk is calculated for each catchment by combining the
managed by Melbourne Water, and along some drainage likelihood of flooding and information about the local
systems managed by councils. Approximately 75% of consequences of floods using the Melbourne Water FRAF.
catchments across the region have some degree of flood (You will find more information about risk assessments
mapping completed.7 in the Flood Risk Assessment fact sheet, available at
www.melbournewater.com.au).
Because standards and technologies have been improving
over time, more recent mapping provides greater accuracy Risk calculations enable us to prioritise investment, and
and more detail, including a greater range of extents for understand how much various flood management measures
different magnitudes of flooding. may reduce risks. Detailed risk assessments have been
completed in catchments where mapping is available. Flood
Melbourne Water’s flood mapping activity has generally risks are currently assessed at a catchment or sub-catchment
focused on locations where urban development is expected to scale. They generally include a large land area and many
take place, or areas where flooding causes significant damage individual properties.
or disruption. Flood mapping has also been undertaken by
some councils to identify where flooding could occur in the We need a new tool and processes to better quantify impacts
upper reaches of local catchments. of local-scale floods (for example, an area consisting of a few
properties) to ensure all scales of flooding are well understood,
Much of the flood mapping undertaken to date has focused and considered together. A recent review of the existing FRAF
on assets owned by a particular agency, and does not consider has provided many recommendations that can be considered
the whole catchment. Collaborative whole of catchment flood in updating processes and the development of a new tool.
mapping will be more accurate and efficient, and will support
improved outcomes and decision making in the long term.
Whole of catchment mapping should be undertaken 7. T
he region is divided into approximately 950 small catchments for the
purpose of understanding and managing flooding. These small catchments
whenever possible. can then be grouped to understand flooding across a large catchment, such
as the Maribyrnong river basin.
The State Government Future Coasts program has mapped 8. The Victorian Coastal Inundation Dataset, produced through the
coastal flood risks from storm tides and future sea level government’s Future Coasts program, models and maps current and
possible future coastal flooding. Melbourne Water has also completed
rise for the whole Port Phillip and Westernport coastline.8 additional coastal flood mapping for Port Phillip and Westernport.
(You will find more information about understanding future 9. Managing the Floodplain: a guide to best-practice flood risk management
coastal risks on pages 39–40). in Australia, 2013.
Flood Management Strategy – Port Phillip and Westernport 23Update mapping guidelines and complete priority mapping and risk assessment
This includes updating standards and guidelines for the Port Phillip and Westernport region, and understanding what level
of information is required in different locations. New mapping and risk assessment projects will be prioritised to address
the most urgent information gaps first.
Action Lead Key participants
1.1 R
eview and update flood modelling and mapping guidelines and MW BoM, Councils, DELWP, VICSES, and
processes for our region, in alignment with state and national other regional and technical authorities
standards, and in consultation with stakeholders (considering as required
whole of catchment mapping approaches where possible).
1.2 U
pdate flood risk assessment tools to better understand MW BoM, Councils, DELWP, VICSES, and
impacts in areas where localised flooding occurs, in other regional and technical authorities
consultation with stakeholders. as required
1.3 D
evelop new tools to prioritise locations for mapping, and MW Councils, DELWP, MAV, MPA, VICSES
for risk assessment, in consultation with stakeholders.
1.4 Identify and deliver priority flood mapping and risk assessment MW Councils, MPA, VICSES
projects for the region, in collaboration with stakeholders, and
share outcomes (considering whole of catchment mapping
approaches where possible).
1.5 Identify local flood mapping and risk assessment priorities, and Councils Councils, MPA, VICSES, MW
contribute to project delivery, in partnership with Melbourne
Water where possible.
(Information sharing is an essential aspect of these processes. You will find actions on information sharing on page 27.
Climate change is an important issue to consider in new regional guidelines. You will find more information on climate
change and mapping on pages 39–40).
Queen’s Bridge during the Great Flood 1891
24 Flood Management Strategy – Port Phillip and WesternportSECTION 4
Collect full and up-to-date data on existing drainage and flood assets and land
Current and more comprehensive data is needed to inform ongoing asset management, and to underpin all flood
management decisions.
Records of drainage infrastructure were not always kept during the early development of our region, leading to gaps
in our knowledge now.
Action Lead
2.1 Continue and enhance the collection of flood, drainage and land asset For assets under each agency’s control:
information to inform management programs for: • Melbourne Water
• Regional flood and drainage assets and waterways • Councils
• Retail water authorities
• Local flood and drainage assets
• Retail water authority assets.
Learn from floods
Gathering information about floods when they do occur allows flood models and maps to be checked against real data,
and supports ongoing improvement of emergency response and management processes. We need ongoing information
gathering by all participating authorities to keep data up to date.
Action Lead Key participants
3.1 R
eview what data is being collected by different organisations during and MW Councils, MAV,
after floods, and identify further opportunities to collect and share data. VICSES
3.2 C
ontinue collecting information during and after floods to assist with For assets and
mapping, better decision making, and improving emergency response. issues relevant
to agency:
• BoM
• Councils
• MW
• VICSES
Outcome:
Flood data and risk information will be produced and shared to meet priorities and needs for the region.
Flood Management Strategy – Port Phillip and Westernport 25Sharing information and skills
The following discussion and actions
are relevant to all steps of the flood
Prioritise Assess Identify
management process; in particular, and complete flood effects Prioritise
locations
Develop
options
best-fit Implementation
mapping and risks solution
flood mapping, risk assessment and
developing flood solutions.
It takes the actions of many stakeholders • M
elbourne Water provision of flood mapping information
to the Victorian Flood Database
to manage existing flood risks, provide
• O
ngoing flood information updates from Melbourne Water
for appropriate urban planning, prepare for to VICSES
emergencies and educate communities. All • Flood warning systems
require access to good quality information to • Emergency planning processes
inform flood management decision making. • P roject-based information sharing between Melbourne
Water, councils, BoM, and VICSES and other organisations
Critical infrastructure and service providers require detailed (such as VicRoads and community groups)
flood information to enable them to design and provide • D
evelopment advice to landowners and planning
resilient services. permit referrals
Up-to-date information can also help insurance companies • S tatutory processes such as including flood maps in
to understand true risks, enabling appropriate insurance planning schemes
policy pricing. • P roviding property information statements and flood
level advice
Sharing information • U
rban growth planning processes such as Developer
Services Schemes for greenfield areas
State government departments, councils, and emergency
services share and use flood mapping and risk information • P rovision of flood mapping to the insurance industry
to support flood risk reduction activities and to plan for through the Insurance Council of Australia (ICA)
flood emergencies. • During coastal hazard and vulnerability assessments.
Information is currently shared through many
channels including: Continued information sharing is essential, and there are
opportunities to improve current processes.
• A
nnual flood map updates for councils provided by
Melbourne Water Data is produced and stored in a range of qualities and formats
• A
sset data information sharing between drainage and that may not always be easily shared across different systems.
infrastructure managers Some information could be shared more rapidly or regularly,
• C
ollaborative development of Local Flood Management such as updated flood maps, and works and investment
and Flood Emergency Plans planning by owners of interconnecting drainage assets.
• O
ngoing knowledge sharing and capacity building programs
run by government and research organisations
• F lood information included in municipal planning schemes
and policies
26 Flood Management Strategy – Port Phillip and WesternportYou can also read


