Making Every Drop Count - Micro-Level Water Demand Accounting Challenges and Way Forward - Chaya Ravishankar Sunil Nautiyal S Manasi - Institute ...
←
→
Page content transcription
If your browser does not render page correctly, please read the page content below
Making Every Drop Count –
Micro-Level Water Demand
Accounting Challenges and
Way Forward

Chaya Ravishankar
Sunil Nautiyal
S Manasi
ISBN 978-81-7791-280-7

©   2018, Copyright Reserved
    The Institute for Social and Economic Change,
    Bangalore

Institute for Social and Economic Change (ISEC) is engaged in interdisciplinary research
in analytical and applied areas of the social sciences, encompassing diverse aspects of
development. ISEC works with central, state and local governments as well as international
agencies by undertaking systematic studies of resource potential, identifying factors
influencing growth and examining measures for reducing poverty. The thrust areas of
research include state and local economic policies, issues relating to sociological and
demographic transition, environmental issues and fiscal, administrative and political
decentralization and governance. It pursues fruitful contacts with other institutions and
scholars devoted to social science research through collaborative research programmes,
seminars, etc.
The Working Paper Series provides an opportunity for ISEC faculty, visiting fellows and
PhD scholars to discuss their ideas and research work before publication and to get
feedback from their peer group. Papers selected for publication in the series present
empirical analyses and generally deal with wider issues of public policy at a sectoral,
regional or national level. These working papers undergo review but typically do not
present final research results, and constitute works in progress.

Working Paper Series Editor: Marchang Reimeingam
MAKING EVERY DROP COUNT – MICRO-LEVEL WATER DEMAND
ACCOUNTING CHALLENGES AND WAY FORWARD
Chaya Ravishankar∗, Sunil Nautiyal** and S Manasi***
Abstract
In peri-urban areas, lack of piped water supply and sewerage system has led to excessive
groundwater abstraction, resulting in the proliferation of private water tanker business and
unmanaged wastewater flows. To have efficient water supply and wastewater management in
these data-constrained groundwater dependent communities, which do not have either metered
connections or formal water supply, the paper addresses the question on how to quantify water
demand for consumptive and non-consumptive uses through a typical qualitative/ observational
primary survey method. Such surveys are scarce in literatures. The present study was conducted
in Bellandur, a 26.4-sq km peri-urban ward of Bangalore city. With 11% growth in population in
the last decade, it uses nearly 38% of its water demand for non-consumptive purposes. At
present, 60% of the demand of the sampled size is being met through borewells and 35%
through tankers. The remaining 5% get their water through a metered piped system. The
findings of this study will aid water utility boards like Bangalore Water Supply and Sewerage
Board (BWSSB) to put in place resilient planning and maximize the benefits out of water supply
schemes by efficient allocation of water.
Introduction
Groundwater forms 97 percent of world’s readily available fresh water resource. Its volume ranges from
7 to 23 million km3, which is a guesstimate (Kundzewicz & Doell, 2008). Groundwater is the major
source for 2 billion people around the world across rural, urban, industrial and irrigation sectors (Water
& Sanitation Programme). An estimated 269 million urban dwellers depend on wells as their principal
source of drinking water (Grönwall et al, 2010). In fact, more than half of the world’s megacities
(metropolitan areas with more than 10 million inhabitants) depend on groundwater, in the sense that it
constitutes at least a quarter of these cities’ water supply (Morris et al, 2003). Urbanization is
contributing to rapid development of peripheral areas of cities, which is taking away access to water for
peri-urban residents, both in terms of quality and quantity. The urban areas depend on groundwater
directly for a wide variety of purposes and it is very difficult to get a general trend of the varied patterns
(Grönwall et al, 2010) as the growing urban peripheries have unregulated abstraction of groundwater
through their own borewells, and water utility providers are also encouraging and providing borewells as
they are unable to make investments in piped water supply. This has not only reduced groundwater
∗
Doctoral fellow, Centre of Ecological Economics and Natural Resources (CEENR), ISEC, Bangalore. E-mail:
chaya.ravi84@gmail.com
**
Professor, Centre of Ecological Economics and Natural Resources (CEENR), ISEC, Bangalore. E-mail:
nautiyal_sunil@rediffmail.com
***
Associate Professor, Centre for Urban Affairs (CRUA), ISEC, Bangalore. E-mail: manasi@isec.ac.in
We are grateful to Prof M V Nadkarni, Prof Kala S Sridhar, Retd Eng. M N Thippeswamy (BWSSB) and Prof
Srikantaswamy from the University of Mysore; Panel experts Dr Barun Deb Pal, Prof Pramod Kumar and Prof N
Sivanna for their valuable comments and support. The authors also thank the anonymous referees for their
suggestions and comments. Based on the comments and suggestions, the paper has been revised. The usual
disclaimer, however, remains.
1resources but also created a new market, making groundwater a priced commodity. As a result, there is
a lucrative business in water and mafia groups are thriving (Morris et al, 2003).
Studies (Drangert, 1993; Kenway et al, 2011) favour demand side water management as
against supply side approach to help in sustainable water resource management. In industrialized
countries, several meta analyses have examined the determinants of household water demand (White
et al, 2002; Mehta & Yates, 2012) but such analysis for developing countries is complicated due to their
dependency on a wide variety of water sources. It is estimated that India uses 230–250 cubic
kilometers of groundwater each year, or about one-quarter of the global groundwater usage — more
than the United States and China combined. More than 60 per cent of irrigated agriculture and 85 per
cent of domestic water use now depend on groundwater (Biswas, 2012).
The purpose of this study is to investigate different end uses of water on a temporal and
spatial scale in the basic administrative unit of a ward for planning water supply sources by employing
the fit-for-purpose water use concept. This study is carried out in a region where there is absolutely no
account of how much water is used and consumed, and the situation is similar in most urban
peripheries where no piped water supply infrastructure and sewerage exist.
Therefore, three objectives were laid out to understand the structure and functional attributes
of groundwater flows by considering one peri-urban ward as one system boundary. The objectives are
as follows:
1. Identify the present patterns of groundwater use and quantify the demand of unaccounted uses
2. Develop0 a better understanding of challenges for accounting non-consumptive uses
3. Suggest priority areas for intervention and alternatives for improving allocative efficiency.
Research Gap
Although some analyses of household water demand in developing countries had been done in 1970s
(Katzman, 1977; Howe & Linaweaver, 1967), they are still limited in number. Such analyses are difficult
to perform as conditions surrounding water access vary across households, and the sources of supply
are different, with characteristics and levels of services too differing (price, distance to the source,
quality, reliability etc.). Besides, they also require a socio-ecological approach, specifically in regard to
groundwater usage in urban ecosystems.
While models predicting or forecasting the demand of municipal water use have been brought
out, field level investigations of water usage based on socio-cultural attributes have not been carried
out. Keeping the research gaps in view, this study helps us in understanding the present patterns of
water use in the study area, which is linked to multiple stakeholders or users in a diverse socio-cultural
setup.
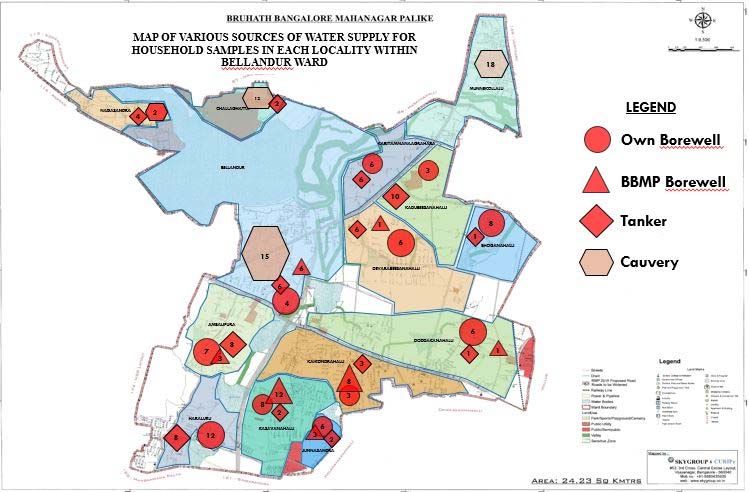
Description of Study Area
The study area Bellandur (Figure 1) is the second largest ward in Bangalore spanning an area of
approximately 26.4 sq km. This ward falls under the administrative jurisdiction of BBMP (Bruhat
Bangalore Mahangara Palike), which is a local body governing the peri-urban expansion of Bangalore.
The salient features of this ward are many in terms of administration, water supply and socio-economic
2characteristics. The ward gets its name Bellandur from one of the localities out of the 14, of which 10
were under the Gram Panchayath until 2005. They were later included under the urban local body after
declaring some portion of this ward as a Special Economic Zone (SEZ). The SEZ development in 4
localities of this ward and its location there formed a bridge or connectivity to two other major IT hubs,
namely Whitefield and Electronic city, which paved the way for the drastic development of residential
and commercial establishments. With respect to source of water supply, the localities of Challaghatta,
Munnekollal, Bellandur and Belur Nagasandra have piped water supply with the source being Cauvery.
Only 984 connections are metered by BWSSB, and these connections account for 5% of the entire
ward’s water requirement. Although a gram panchayath (village council), Bellandur demanded piped
supply of Cauvery water in 1990s and got metered connections. The remaining 10 localities are entirely
dependent on borewells. The borewells are drilled by the residents and in some places where these had
gone dry, BBMP has drilled borewells and residents have taken connections from it.
Figure 1: Location Map of Study Area Showing Sample Distribution Based on Various
Sources of Supply
Source: BBMP 2015
Methodology and Conceptual Framework
This paper applies the principles of a tightly coupled socio-ecological system (Ostrom, 2009), and the
first step in implementing this approach in the water sector is the construction of the city’s “system
boundary” ( Kenway et al, 2011). Here, Bellandur ward is the system boundary. Several authors note
the importance of the “system boundary” to arrive at research conclusions (French & Geldermann,
2005; Satterthwaite, 2008). System boundary definition is a critical first step in modelling analysis.
3Withou
ut knowing the
e boundary, it would be impo
ossible to know
w which factorss should be inccluded in, or
ded from, the analysis. The term boundarry unequivocallly influences d
exclud decisions of th
he apparent
“best” option (Satterthwaite, 2008
8), and suggessts that most large cities have three or fo
our different
boundaries: (i) the core; (ii) the contiguous bu
uilt-up area; (iii) the metrop
politan area; and
a (iv) the
ded planning region. He po
extend oints out that our current lo
oose definition
n of cities leads to great
difficulty in comparin
ng basic param
meters. Even so undamental as the urban pop
omething as fu pulation can
vary by
b several millio
on depending on
o the definitio
ons adopted. The
T ward considered here falls under the
extend
ded planning re
egion outside the city, i.e. the
e urban periphe
eral region. Witthin this system
m boundary,
we have considered the groundwatter resource flo
ow in 3 stagess using the Sysstem of Environ
nmental and
g (SEEA)
Economic Accounting
1.. From the en
nvironment to the
t economic e
entity
2.. Within the economic
e entitiies and
3.. From the ecconomy, back to
t the environm
ment
Figure 2: Conceptual Framew
work for Wate
er Demand Es
stimation (de
erived by the Author)
Flow
ws from th
he Environ
nment
Groundwaater resourcee
Flows within
w the Economy and betwe
een the ecconomies
Househollds supplying to co
onstruction activity. Treated Tankers purcchasing from
m STPs discharged to agricultural/ vaacant lands
water from borewells an
nd supplying
Flows from
m the econo
omy to the environment
e t
Septtic system, greyy water flowing through open storm waterr drains.
Overlaand flow.
Figure 2 is the conceptual frameworkk developed fo
or the ward, which
w is consid
dered as an
economic entity to accommodate
a a decentralized system for water
w management. Then th
he matrix of
flows of water in th
he economy frrom ground wa
ater abstractio
on to householld and comme
ercial usage,
mption and disscharge to treattment systemss, and return to
consum o the environment will help uss distinguish
water usage versus water consum
mption. The diffference betwee
en water supply and water use
u will give
ater consumptiion. This waterr use, henceforrth termed as non-consumptive use, is for non-potable
the wa
purposses. Urban run
noff to lakes, precipitation,
p evvaporation and
d lakes are nott considered. Within
W water
4accounting, the interest lies in linking the abstraction and use of water in physical terms with the
estimates of output and the total final consumption of households.
The residential demand consists of two components, indoor usage and outdoor usage. The
variables largely considered to reflect outside characteristics are irrigable area per dwelling unit and
garden size (Nieswiadomy & Molina, 1989). There is also a third major unaccounted component
prevalent in the Indian context, which is the overflow of Over Head Tank (OHT).
Demographic and household data were collected from the households, and this data included
information on household size, dwelling type, vehicles owned, method of water storage and presence of
OHT.
This research is based on primary survey of the study area carried out from February 2015 to
June 2015. Questionnaires were used to assess the water consumption patterns related to socio-
economic attributes. The determination of sampling size for the implementation of research was based
on the commonly utilized statistical equation (Walpole & Myers, 1985). The degree of confidence (% of
people who can answer our questions with utmost confidence) was considered to be approximately
90%. An acceptable error of approximately 4-5% was considered to be appropriate for this
computation.
The minimum required sampling size can be determined using the following equation:
N = ((Z(1-α/2) x S)/e)2
Where,
N = Sampling size (minimum required)
Z(1-α/2) = Number of units of standard deviation from a normal distribution curve based on
degree of confidence.
For a degree of confidence of 90%, the value of Z from standard normal cumulative
probability table is 1.96 (area under the Z-curve is 0.950).
S = Standard deviation. A standard value of 0.5 is considered when true population is
unknown.
e = Acceptable error considered for questions answered by the respondents.
Keeping the degree of confidence at 90% and an acceptable error of 4%, the minimum
required sampling size is 275. The study area is of a heterogeneous nature in terms of land use type
and sources of water supply. Hence, the sample size was increased to 350. However, practical
considerations of time and budget limited the sample size to 350 across 14 localities. Out of the 350
samples, based on land use type classified in Table 1, the number of residential sample size was 285
while the commercial sample size was 65.
Water Demand Calculation
To get the actual water demand for the sample, we need accurate measurements of flow and quality
determinants for single or small numbers of dwelling units, but this is difficult due to the intermittent
nature of flows at source. The demand was therefore calculated based on respondents’ information on
different sources of supply they use. These were as follows:
51. Own borewell/ BBMP borewell: Number of times motor is being switched on per day and their OHT
size or sump size. The reasoning behind this is that the motor is switched on every time the OHT is
emptied. So, the volume used up by the residents of a house with a household size of X to empty
an OHT of Y litres capacity and switching on motor ‘N’ number of times = N * Y.
a. If they did not have any OHT, information on their storage method and the containers they
used to store was sought. The size of the container was noted and the number of times they
fill or empty the container per day was used to calculate the total daily usage/ demand.
2. For respondents who depended exclusively on tankers, the number of loads they purchased per
week was used to calculate the demand.
3. Respondents with Cauvery connections were asked to give their monthly water bill and also their
OHT capacity, and the number of times they switched on the motor was used to calculate the
demand.
4. Target respondents with mixed sources were asked about hours of supply of Cauvery water or
borewell water and the frequency of purchase of tanker water.
Table 1: Sample Size Distribution in the Study Area
Land Use Types Percentage distribution Sample size
Individual homes 57% 162
Residential Apartments 27% 77
PG 15% 44
IT 8% 5
Recreational Centre/ Malls 3% 2
Slum 3% 2
Commercial
Shops 58% 38
Hospitals 9% 6
Hotels 22% 14
Source: BBMP Property Tax collected for the year 2015
Challenges for Water Demand Estimation
While capturing the heterogeneity among these categories of supply and land use, five major challenges
were observed, which were related to lack of metered connections, different sources of supply, land use
classification, present water demand and water use behavior.
Lack of Metered Connections
The meters are provided by BWSSB to the users of Cauvery water supply. This piped water supply is
metered only for 5% of the ward’s water requirement. The split up is given in Table 2. These 984
connections are provided by BWSSB. There are also some apartments and gated communities which
have installed meters to monitor individual consumption and charge accordingly for the water purchased
through tankers at high prices.
As we can plan only what we know, the rest of the ward’s water supply and demand details
had to be collected only through a physical survey.
6Table 2: Billed water connections in Bellandur ward
Land use types No of connections
Residential 904
High-rise apartments 35
Commercial 45
Total 984
Source: BWSSB 2015
Sources of Supply
In the study area, most of the households have access to various modes of water supply, which is
mainly ground water abstracted from own borewells or through connections to BBMP borewells or
obtained through water tankers. Surface water sources, mainly from Cauvery, is provided by BWSSB to
four localities, namely Kempapura/Challaghatta, Bellandur and Munnekollal. Only one public stand post
is seen in Kaikondrahalli, which caters to the backward community residing there for the past three
decades. Though this ward is primarily dependent on groundwater through borewells, we have accounts
on the number of borewells in the ward only in regard to those dug by BBMP and not the individual
private owners. The BBMP/ BWSSB have currently made it mandatory to register the borewell
information, a process which is still in progress. In the results below we will see how many respondents
have their own borewells.
Table 3 shows that the ward has 74 functional borewells out of the 100 that have been sunk
by BBMP. BBMP has the records on the number of borewells installed but they have not been
monitoring the yield or the number of connections per borewell.
Table 4 shows that the major source of supply to the ward is through tankers, which is 32%
of residential demand, followed by own borewells supplying 21% of residential demand.
Table 3: Availability of Borewells in the Study Area
Functional No. of Dry
Sl. No Name of the localities Total
Borewells Borewells
1 Ambalipura 8 2 10
2 Kaikondrahalli 3 3
3 Kasavanahalli 7 7
4 Doddakanahalli 15 5 20
5 Devarabeesanahalli 15 7 22
6 Harlur 6 3 9
7 Boganahalli 4 3 7
8 Kadubeesanahalli 8 1 9
9 KariyammaAgrahara 6 2 8
10 Junnsandra 2 3 5
Total 74 26 100
Source: BBMP Bellandur ward office.
7Groundwater cannot be easily observed and measured, like other subsoil assets. The depth of
water table can be measured and this is sometimes used in lieu of actual volume. Tracking the depth of
water tables does not give information if the aquifer is being replenished naturally at the rate that water
is being extracted from it without knowing the volume of the aquifer. However, this gives only a partial
understanding of the rate at which the asset might be depleted.
Table 4: Distribution of Sample Based on Source of Supply
Source of supply Residential Commercial
Borewell 21% 4%
Cauvery 13% 4%
BBMP Borewell 16% 2%
Tanker 32% 9%
Source: Author’s survey
Land Use Type
We can still account for unmetered and different sources of supply but the third interlinking factor is the
land use classification. The source of supply and the water demand varies with different land use types
and allocating land use to certain classifications raises an array of classification problems in peri-urban
areas.
i. For residential land, the major problem relates to the treatment of retail activity within
residential neighbourhoods.
ii. Users from different industries may occupy different floors of an office building or the ground
floor of residential buildings may house retail space, which is common in the study area. For
offices, we assumed a uniform land use per employee and considered the National Building
Code (NBC) 2005 to assess water quantity.
iii. For public services and social/ cultural/ medical categories, rough estimates of land use type by
each activity were considered.
This procedure, though approximate, is a reasonable way to allocate data in order to make
initial estimates, and they provide an interesting way to understand water use pattern or demand for
each category.
The predominant land use type in one locality may not be the same for the other. Table 5
indicates predominant land use type in each locality. This helped in assessing the socio-economic
characteristics of each locality. For example, Devarabeesanahalli and Kadubeesanahalli are major
Special Economic Zones having IT parks. The residential samples from these localities are of high
income group and variations in water usage pattern were observed.
8Table 5: Percentage Distribution of Sample across the Localities Based on Predominant
Land Use Pattern
Number of Number of
Sl. Localities Within Household Commercial
Predominant Land Use Type
No. Bellandur Ward samples (% samples (%
of total) of total)
1 Ambalipura Residential & Commercial 23 (8%) 6 (9%)
2 Bellandur Slums, Residential & Commercial 39 (14%) 10 (15%)
3 Bhoganahalli Residential & Commercial 12 (4%) 4 (6%)
4 Challaghatta Residential & Commercial 14 (5%) 3 (5%)
5 Devarabesanahalli SEZ area (IT parks) & Residential 15 (5%) 4 (6%)
6 Doddakanahalli Residential & Commercial 16 (6%) 4 (6%)
7 Haraluru Residential 26 (9%) 4 (6%)
8 Junnasandra Residential 19 (7%) 3 (5%)
9 Kadubeesanahalli SEZ area (IT parks) & Residential 17 (6%) 5 (8%)
10 Kaikondrahalli Residential & Commercial 20 (7%) 5 (8%)
11 Kariamma Agrahara Paying Guest Accommodations 17 (6%) 2 (3%)
12 Kasavanahalli Residential & Commercial 38 (13%) 7 (11%)
13 Munnekollalu Paying Guest Accommodations 22 (8%) 7 (11%)
14 Nagasandra Residential & Commercial 7 (2%) 1 (2%)
Total Sample 350 285 65
Source: Author’s survey from BBMP Property Tax data for 2015
Water Demand Based on Land Use Type
Table 6: Actual Water Demand for Various Land Use Patterns in the Surveyed Sample
Water Water Commercial Water Demand (lpd)
Demand for Demand for
S.
Localities Individual apartments
No. IT Shops Hospitals Hotels
homes (litres (litres per
per day) day, Lpd)
1 Ambalipura 15625 794,500 990 48780
2 Bellandur 26375 901,600 1490 8500 3500
3 Bhoganahalli 8850 614,600 890
4 Challaghatta 10315 380,800 770
5 Devarabeesanahalli 13300 422,100 855000 150 157500
6 Doddakanahalli 6885 1,338,400 675000 900
7 Haraluru 15870 423,500 840 21000
8 Junnasandra 10825 226,100 270
9 Kadubeesanahalli 12875 333,900 315000 1150 36000
10 Kaikondrahalli 12500 942,900 590 22100 25500
Kariammana
11 8855 237,300 18000 0
Agrahara
12 Kasavanahalli 18050 1,947,400 1490 7000
13 Munnekollal 22970 176,400 1400 450000 9750
14 Nagasandra 4885 24,500 60
Total 1,88,210 87,64,000 18,63,000 10,990 6,38,100 1,51,530
Source: Author’s Calculation
9Table 6 shows that approximately 7% (0.18 million litres per day or MLD) demand for water is
coming from individual homes alone while apartments are consuming approximately 8.7 MLD.
Commercial establishments (including IT parks, shops and hotels) are consuming approximately 71% (2
MLD) through supply from tankers as they get very limited quantity through borewells, which cannot
supply their large demand. Hotels alone require approximately 6% (0.15 MLD), which is again sourced
from borewells and tankers. From the survey, we find that the average actual demand per day per
person is 235 litres, which is a little more than the prescribed 200 lpcd used for estimation as per
Central Public Health Environmental Engineering organization (CPHEEO) norms.
Water Demand in Apartments
As per the National Building code 2005, water requirement for apartments is taken as 150 lpcd and
Table 7 shows that there are 42,526 flats, which require 31.9 MLD of water per day. During the survey,
it was observed that not all apartments are 100% dependent on tanker supply. Individual apartments
had groundwater wells which catered to some percentage of the actual demand while the balance was
being met by tankers with varying capacities. Generally, for the sampled apartments within each
locality, tankers with capacities 6000 litres and 12,000 litres were observed and recorded during the
survey. The average tanker capacity was determined based on these two tanker volumes and the
number of apartments sampled within each locality, to arrive at a figure close to the accurate water
demand met by tankers alone. This average tanker capacity was multiplied by the supply gap
encountered due to insufficient supply from groundwater wells to arrive at the approximate total
number of tankers required/supplying water to all the existing apartments in each locality within
Bellandur ward.
Table 7: Actual water demand for apartments sampled in the ward and number of tankers
Sample Size Water Demand Approx. No. of
Localities within % of Demand
Water to be Met by Tankers in the
Bellandur Ward Met by Tankers
Demand (lpd) Tankers Sample Size
Ambalipura 794,500 364,563 46% 32
Bellandur 901,600 343,500 38% 30
Bhoganahalli 614,600 274,125 45% 25
Challaghatta 380,800 28,500 7% 3
Devarabeesanahalli 422,100 197,813 47% 16
Doddakanahalli 1,338,400 528,500 39% 46
Haraluru 423,500 110,688 26% 12
Junnasandra 226,100 64,913 29% 11
Kadubeesanahalli 333,900 120,688 36% 13
Kaikondrahalli 942,900 435,313 46% 38
Kariammana Agrahara 237,300 65,213 27% 9
Kasavanahalli 1,947,400 968,663 50% 92
Munnekollal 176,400 46,138 26% 8
Nagasandra 24,500 2,500 10% 1
Source: Author’s construction based on survey
10We see thatt for apartmentts 40% to 50%
% is supplied by
y tankers, but IT
I and shops have
h 90% of
their water
w supplied by tankers.
Present Water Demand
Calcula
ating the prese
ent water dem
mand using pop
pulation data was
w considered
d as an option,, and it was
found that BBMP and
d BWSSB do no
ot have comple
ete population records of the Bellandur ward
d. There is a
huge data
d gap as Ce
ensus 2011 give
es a population BMP, on the otther hand, has tax data for
n of 80,180. BB
househ
holds and com
mmercial/retail establishmentss which have paid property taxes and the
e associated
popula
ation (as per BBMP
B records) for the year 2015 was 79,4
431. However,, this data can
nnot help in
popula
ation assessme
ent completelyy since severa
al properties/e
establishments are under certain
c legal
obligattions such as tax
t liabilities an
nd hence the d
data available with BBMP ma
ay not be authe
entic. Based
on a discussion
d with
h BBMP, a scale up coefficien
nt of 20% hass been conside
ered to accountt for lack of
supporting data and this is factored
d into the popu
ulation estimation.
ure 3: Population Projectio
Figu on of Belland
dur Ward 2001 – 2051
ce: Census 201
Sourc 10
From Censu
us 2001 to Census 2011 we
w see a popu
ulation growth
h rate of 11%
% and using
standa
ard projection methods,
m we can
c observe tha
at in 2051 Bella
andur ward will have a population of 1.5
lakh (F wth rate is an indication of what has happ
Figure 3). Thiss alarming grow pened, and wh
hat will. The
presen
nt water dema
and is approxim
mately 18.31 M
MLD and the estimated
e demand for 2051 is twice the
curren
nt demand (Figure 4) using th
he arithmetic prrojection metho
od (Table 8).
11Table 8: Wa
ater Demand for the Proje
ected Populattion
Yea
ar Arithme
etical Increase (AI) er demand att 200 lpcd
Wate W
Water Deman
nd (MLD)
200
01 27,591 5,518,238
8 5.52
201
11 80,180 16,036,00
00 16.04
4
201
17 91,593 18,318,79
90 18.31
1
202
21 99,203 19,840,65
50 19.84
4
203
31 118,227 23,645,30
00 23.65
5
204
41 137,250 27,449,95
50 27.45
5
205
51 156,273 31,254,600.00 31.25
5
206
61 175,296 35,059,250.00 35.06
6
ce: Author’s ca
Sourc alculation based
d on Census daata 2015
Figurre 4: Projecte
ed Water Dem
mand for Bella
andur ward 2
2011-2061
Projecte
ed Water deman nd for Beellandurr
20011 ‐ 206
61
35.06
31.25
27.45
23.65
19.84
16.04
2011 2021 2031 2041 2051 2061
Water Demand for arithmetic increase
Wate
er Use Behavior
To acccount for non-cconsumptive usses of groundw
water, a survey was carried ou
ut on the two predominant
p
practicces of car wasshing and stre
eet washing. A third aspect that also need
ds to be accou
unted for is
wastag es posed a challenge, but Tab
ge. Estimating these quantitie able 9 makes an attempt.
12Table 9: Challenges for Estimating Demand of Non-consumptive Uses
S. No Activity Reasons Our approach for demand
estimation
1 Car washing Number of cars - owned cars could Questionnaire survey of 285
be obtained by survey but taxi cars households, with no. of cars. The
or private cars could not be property tax information collected
procured. from BBMP gives us the car parking
area details from which we could
work out estimated number of
cars.
Frequency of washing Survey interaction included car
owners, cleaners to identify
method, frequency of cleaning.
No uniform method For bucket wash, 25 litres of water
quantity is assumed. For spray
wash, mechanic shops have air
spray
The cleaning method varies from
individual to individual
2 Street washing Mode of washing used varies. Some Observations were recorded during
users use hose pipe and others use early morning when commercial
buckets. The purpose also varies, and residential establishments
either for dust suppression alone or use/spray water to suppress dust.
for application of Rangoli.
Spatial factor: the area washed
cannot be limited to the surrounding
space and cannot be demarcated or
measured
Seasonal variation
Cultural factors: during festivities, People were asked to come out
washing is more periodical with the motive behind this;
responses claimed that it was
mainly for one of the following
three reasons:
i. religious practices
ii. Dust suppression
iii. Habitual reasons or the
influence of others who practise it.
3 OHT overflow Period of overflow varies. The Whenever overflow was observed,
sampled households show the we requested respondents to
period of overflow ranging from 15 permit us to measure the flow rate.
mins to 2 hours. Some residences The time taken to fill one bucket
have overflow throughout night. was noted and that gave us the
flow rate.
Source: Author’s construction based on survey
Using the methodology outlined above, the survey found that there is lack of knowledge
among respondents about their actual water usage levels since their usage is not metered at the
household level. The various socio-economic characteristics affecting the demand in general and
specifically for non-consumptive uses are discussed below.
13Socio-economic Characteristics Affecting Water Demand for Non-
consumptive Uses
Occupancy/Household Size
The number of people living in a household (Occupancy) has a direct influence on per capita
consumption. Although an increase in the number of inhabitants per household increases the total
domestic water consumption, there is a general agreement that per capita consumption decreases with
increased occupancy (Edwards & Martin, 1995), which was also the case in this study region as seen in
Table 10. The average family size of the study region is 4. The majority of the respondent families
have a family size of 3 or less (54%). While 33% have a family size between 4 & 6, the remaining have
a family size greater than 7. There were 3 families with a household size of 10 and their average water
usage was surprisingly less, i.e. up to 188 litres per person per day.
Table 10: Average Water Usage Based on Household Size
Household Size Average usage
(member per household) (Litres per capita per day)
1 215
2 266
3 181
4 315
5 265
6 243
7 347
8 295
9 250
10 188
Source: Author’s calculation based on survey
Income Vs Demand: The sample respondents had mixed income levels, with a majority (28%) of the
respondents falling under the income category of 30,000 to 60,000 (60K). Approximately 12% came
under 60k to 1 lakh income category. Household income had a positive, significant effect on water
usage as seen in Table 11. Similarly, education had a positive correlation with demand (Table 12) as
highly educated individuals and families had a better income and standard of living, which increased
their water usage.
Table 11: Variation in domestic water use as a function of income
Income Average usage (Litres per capita per day)
< 5,000 115
5,000 to 10,000 177
10,000 to 30,000 218
30,000 to 60,000 287
60,000 to 1 Lakh 295
> 1 Lakh 295
Source: Author’s calculation based on survey
14Table 12: Influence of education on water demand
Average Average usage (lpd) for % Non-
Education
usage (lpd) Non-consumptive purposes potable usage
Illiterate 135 10 7%
Primary to Higher Secondary 207 14 7%
Undergraduate 278 30 11%
Post Graduate 283 38 13%
Source: Author’s calculation based on survey
This analysis provides useful insights to understand the socio-cultural dimensions influencing
the present patterns of water use, quantify unaccounted water supply sources to tap groundwater,
identify opportunities for water savings, and help water authorities to plan the governance mechanisms
applicable to such peri-urban wards.
Understanding the demand by end users is necessary to build a policy support framework for
assessing water supply and demand management options. Studies around the world provide such a rich
set of information. Therefore it is important to combine the considerations introduced by the different
studies and the best practices implemented in other countries (Rathnayaka et al, 2016). Evaluating a
comprehensive list of water supply options conjunctively with demand management options proves to
be very useful in long term planning (Mukheibir & Mitchell, 2011). Residential water use demand for
consumptive uses have been analyzed in various literatures (Renwick & Archibald, 1998; Beal et al,
2016). But this study also tries to account for non-consumptive/ non-potable uses such as washing
vehicles like buses and cars, uses which are not commonly included in the literature on the subject
(Paxeus, 1996; Renwick & Archibald, 1998; Al-Odwani et al, 2007; Boussu et al, 2007; Zaneti et al,
2012; Abagale et al, 2013). It was observed that on average 15 litres per day is used for car wash
alone, 30 litres per day for washing streets using hose pipes, and 10 litres per day by shops for dust
suppression on streets. This evaluation has quantified the demand and collected relevant information on
various sources of water supply and types of demand existing in the ward.
Conclusion
The following are the conclusions drawn:
1. The paper revealed the basis for understanding the physical flow of water within a system
boundary (ward). This understanding can come only from a proper study of groundwater
dependent areas and areas where water supply is not metered. The results of this study have
shown broader relevance, particularly to other water scarce peri-urban areas facing similar water
management issues.
2. The social relations that generate these physical flows pose challenges for estimating demand, and
different end use studies are essential to successfully meet the challenges. The studies must
employ methods such as:
i. Qualitative data gathering techniques to capture the heterogenous nature of demand at
residential and commercial level. This will provide the rationale for “fit-for-purpose” allocation
of water.
15ii. Micro scale engagements which yield insights into various factors to help build data, as no
secondary data is available.
3. To prioritize interventions that focus on reducing non-consumptive uses, use of fit-for-purpose
water, mainly by recycling, and rain water harvesting are needed. Policies should be framed to
target specific uses instead of being generic, which will not benefit end users. Challenges that
hinder the development of mechanisms to incentivize the reduction of fresh water usage for non-
consumptive uses and promote reuse are tabulated in Table 13.
Table 13: Challenges for Reclaimed Water Usage for Non-consumptive Uses
S. Interventions or Operational Behavioral Economic
No mechanisms challenges challenges challenges
Public will
question as to Additional
Laying pipeline
Distribution network from why this alternate infrastructure. Cost
1 networks,
STP to Households. provision, instead of construction and
pumping stations
of fresh water maintenance.
supply pipelines
Public acceptance
is very difficult.
Ex: RWH structure Cost to the
Construction and
House service connections – with very little consumers for
2 rework on existing
dual piping alteration of construction and
buildings
structure would maintenance.
come under
opposition
Quality will
Spatial constraints
deteriorate if kept
will not allow Additional cost for
for too long.
3 Storage public to accept maintenance and
People cannot
the idea at the disposal
provide separate
first instance.
tanks
Source: Author’s calculation based on survey
The outcome of this study can be directly applied to other growing wards of this city and the
methodology could be applied to the overall peri-urban context of India and other groundwater
dependent regions. This would be very useful in designing suitable policies as one blanket policy cannot
address all the categories for wise water management.
16References
Abagale, F K, D A Sarpong, J A Ojediran, R Osei-Agyemang, A G Shaibu and P T Birteeb (2013). Heavy
Metal Concentration in Wastewater from Car Washing Bays used for Agriculture in the Tamale
Metropolis. Ghana.
Almeida, C M V, D Borges Jr, S H Bonilla and B F Giannetti (2010). Identifying Improvements in Water
Management of Bus-washing Stations in Brazil. Resources, Conservation and Recycling, 54
(11): 821-31.
Al-Odwani, A, M Ahmed and S Bou-Hamad (2007). Carwash Water Reclamation in
Kuwait. Desalination, 206 (1-3): 17-28.
Biswas, A K (2012). India’s Groundwater Crisis is Invisible — and Getting Worse. Water Policy Online.
Bangalore Water Supply and Sewerage Board (BWSSB) data on billed water connections for Bellandur
Ward for the year 2015
Beal, C D, T R Gurung and R A Stewart (2016). Demand-side Management for Supply-side Efficiency:
Modeling Tailored Strategies for Reducing Peak Residential Water Demand. Sustainable
Production and Consumption, 6: 1-11.
Boussu, K, C Kindts, C Vandecasteele and B Van der Bruggen (2007). Applicability of Nanofiltration in
the Carwash Industry. Separation and Purification Technology, 54 (2): 139-46.
Brooks, D B (2006). An Operational Definition of Water Demand Management. International Journal of
Water Resources Development, 22 (4): 521-28.
Bruhat Bangalore Mahangara Palike (BBMP) Property Tax data of 2015.
Decker, E H, S Elliott, F A Smith, D R Blake and F S Rowland (2000). Energy and Material Flow through
the Urban Ecosystem. Annual Review of Energy and the Environment, 25.
De Francis, M P (2011). Economic Impacts of Inadequate Sanitation in India. Water and Sanitation
Program—World Bank, Washington DC.
Drangert, J O (1993). Who Cares about Water? Study of Household Water Development in Sukumaland,
Tanzania. Department of Theme Research, Water and Environmental Studies, Linköping
University.
Edwards, K and L Martin (1995). A Methodology for Surveying Domestic Water Consumption. Water and
Environment journal, 9 (5): 477-88.
French, S and J Geldermann (2005). The Varied Contexts of Environmental Decision Problems and their
Implications for Decision Support. Environmental Science & Policy, 8 (4): 378-91.
Grönwall, J T, M Mulenga and G McGranahan (2010). Groundwater, Self-supply and Poor Urban
Dwellers: A Review with Case Studies of Bangalore and Lusaka (No. 26). IIED.
Hewitt, J A and W M Hanemann (1995). A Discrete/continuous Choice Approach to Residential Water
Demand under Block Rate Pricing. Land Economics, 173-192.
Howe, C W and F P Linaweaver (1967). The Impact of Price on Residential Water Demand and Its
Relation to System Design and Price Structure. Water Resources Research, 3 (1): 13-32.
Katzman, M T (1977). Income and Price Elasticities of Demand for Water in Developing Countries
1. JAWRA Journal of the American Water Resources Association, 13 (1): 47-55.
17Kenway, S, A Gregory and J McMahon (2011). Urban Water Mass Balance Analysis. Journal of Industrial
Ecology, 15 (5): 693-706.
Kundzewicz, Z W and Doell, P (2009). Will Groundwater Ease Freshwater Stress under Climate
Change? Hydrological Sciences Journal, 54 (4): 665-75.
Mehta, V and D Yates (2012). Integrated Water-energy-emissions Analysis: Applying LEAP and WEAP
together in California. Stockholm Environment Institute Policy Brief.
Morris, B L, A R Lawrence, P J C Chilton, B Adams, R C Calow, B A Klinck (2003). Groundwater and Its
Susceptibility to Degradation: a Global Assessment of the Problem and Options for
Management (Vol. 3). United Nations Environment Programme.
Mukheibir, P and C A Mitchell (2011). Planning for Resilient Water Systems-a water Supply and Demand
Investment Options Assessment Framework.
Nieswiadomy, M L and D J Molina (1989). Comparing Residential Water Demand Estimates under
Decreasing and Increasing Block Rates using Household Data. Land Economics, 65 (3): 280-
89.
Ostrom, E (2009). A General Framework for Analyzing Sustainability of Social-ecological
Systems. Science, 325 (5939): 419-22.
Paxeus, N (1996). Vehicle Washing as a Source of Organic Pollutants in Municipal Wastewater. Water
science and Technology, 33 (6): 1-8.
Ranganathan, M (2014). 'Mafias' in the Waterscape: Urban Informality and Everyday Public Authority in
Bangalore. Water Alternatives, 7 (1).
Rathnayaka, K, H Malano and M Arora (2016). Assessment of Sustainability of Urban Water Supply and
Demand Management Options: A Comprehensive Approach. Water, 8 (12): 595.
Rathnayaka, K, S Maheepala, B Nawarathna, B George, H Malano, M Arora and P Roberts (2014).
Factors Affecting the Variability of Household Water Use in Melbourne, Australia. Resources,
Conservation and Recycling, 92: 85-94.
Renwick, M E and S O Archibald (1998). Demand Side Management Policies for Residential Water Use:
Who Bears the Conservation Burden? Land Economics, 343-359.
Satterthwaite, D (2008). Cities’ Contribution to Global Warming: Notes on the Allocation of Greenhouse
Gas Emissions. Environment and Urbanization, 20 (2): 539-49.
Water & Sanitation Programme (n.d). The Economic Impacts of Inadequate Sanitation in India. Report
by the World Bank.
White, G F, D J Bradley and A U White (2002). Drawers of Water: Domestic Water use in East
Africa. Bulletin of the World Health Organization, 80: 63-73.
Zaneti, R, R Etchepare and J Rubio (2012). More Environmentally Friendly Vehicle Washes: Water
Reclamation. Journal of Cleaner Production, 37: 115-24.
18Recent Working Papers
359 Climate Change and Sea-Level Rise: A 376 PPP Infrastructure Finance: An Empirical
Review of Studies on Low-Lying and Island Evidence from India
Countries Nagesha G and K Gayithri
Nidhi Rawat, M S Umesh Babu and
377 Contributory Pension Schemes for the
Sunil Nautiyal
Poor: Issues and Ways Forward
360 Educational Outcome: Identifying Social D Rajasekhar, Santosh Kesavan and R Manjula
Factors in South 24 Parganas District of
378 Federalism and the Formation of States in
West Bengal
India
Jhuma Halder
Susant Kumar Naik and V Anil Kumar
361 Social Exclusion and Caste Discrimination
379 Ill-Health Experience of Women: A Gender
in Public and Private Sectors in India: A
Perspective
Decomposition Analysis
Annapuranam Karuppannan
Smrutirekha Singhari and S Madheswaran
380 The Political Historiography of Modern
362 Value of Statistical Life: A Meta-Analysis
Gujarat
with Mixed Effects Regression Model
Tannen Neil Lincoln
Agamoni Majumder and S Madheswaran
381 Growth Effects of Economic Globalization:
363 Informal Employment in India: An Analysis
A Cross-Country Analysis
of Forms and Determinants
Sovna Mohanty
Rosa Abraham
382 Trade Potential of the Fishery Sector:
364 Ecological History of An Ecosystem Under
Evidence from India
Pressure: A Case of Bhitarkanika in Odisha
Veena Renjini K K
Subhashree Banerjee
383 Toilet Access among the Urban Poor –
365 Work-Life Balance among Working
Challenges and Concerns in Bengaluru
Women – A Cross-cultural Review
City Slums
Gayatri Pradhan
S Manasi and N Latha
366 Sensitivity of India’s Agri-Food Exports
384 Usage of Land and Labour under Shifting
to the European Union: An Institutional
Cultivation in Manipur
Perspective
Marchang Reimeingam
C Nalin Kumar
385 State Intervention: A Gift or Threat to
367 Relationship Between Fiscal Deficit
India’s Sugarcane Sector?
Composition and Economic Growth in
Abnave Vikas B and M Devendra Babu
India: A Time Series Econometric
Analysis 386 Structural Change and Labour Productivity
Anantha Ramu M R and K Gayithri Growth in India: Role of Informal Workers
Rosa Abraham
368 Conceptualising Work-life Balance
Gayatri Pradhan 387 Electricity Consumption and Economic
Growth in Karnataka
369 Land Use under Homestead in Kerala:
Laxmi Rajkumari and K Gayithri
The Status of Homestead Cultivation
from a Village Study 388 Augmenting Small Farmers’ Income
Sr. Sheeba Andrews and Elumalai Kannan through Rural Non-farm Sector: Role of
Information and Institutions
370 A Sociological Review of Marital Quality
Meenakshi Rajeev and Manojit Bhattacharjee
among Working Couples in Bangalore
City 389 Livelihoods, Conservation and Forest
Shiju Joseph and Anand Inbanathan Rights Act in a National Park: An
Oxymoron?
371 Migration from North-Eastern Region to
Subhashree Banerjee and Syed Ajmal Pasha
Bangalore: Level and Trend Analysis
Marchang Reimeingam 390 Womanhood Beyond Motherhood:
Exploring Experiences of Voluntary
372 Analysis of Revealed Comparative
Childless Women
Advantage in Export of India’s Agricultural
Chandni Bhambhani and Anand Inbanathan
Products
Subhash Jagdambe 391 Economic Globalization and Income
Inequality: Cross-country Empirical
373 Marital Disharmony among Working
Evidence
Couples in Urban India – A Sociological
Sovna Mohanty
Inquity
Shiju Joseph and Anand Inbanathan 392 Cultural Dimension of Women’s Health
across Social Groups in Chennai
374 MGNREGA Job Sustainability and Poverty
Annapuranam K and Anand Inbanathan
in Sikkim
Marchang Reimeingam 393 Earnings and Investment Differentials
between Migrants and Natives: A Study of
375 Quantifying the Effect of Non-Tariff
Street Vendors in Bengaluru City
Measures and Food Safety Standards on
Channamma Kambara and Indrajit Bairagya
India’s Fish and Fishery Products’ Exports
Veena Renjini K K 394 ‘Caste’ Among Muslims: Ethnographic
Account from a Karnataka Village
Sobin George and Shrinidhi Adiga395 Is Decentralisation Promoting or 410 An Evaluation of Input-specific Technical
Hindering the Effective Implementation of Efficiency of Indian Fertilizer Firms
MGNREGS? The Evidence from Karnataka Soumita Khan
D Rajasekhar, Salim Lakha and R Manjula 411 Mapping Institutions for Assessing
396 Efficiency of Indian Fertilizer Firms: A Groundwater Scenario in West Bengal,
Stochastic Frontier Approach India
Soumita Khan Madhavi Marwah
397 Politics in the State of Telangana: Identity, 412 Participation of Rural Households in
Representation and Democracy Farm, Non-Farm and Pluri-Activity:
Anil Kumar Vaddiraju Evidence from India
398 India’s Plantation Labour Act - A Critique S Subramanian
Malini L Tantri 413 Inequalities in Health Outcomes:
399 Federalism and the Formation of States in Evidence from NSS Data
India: Some Evidence from Hyderabad- Anushree K N and S Madheswaran
Karnataka Region and Telangana State 414 Urban Household Enterprises and Lack
Susant Kumar Naik of Access to Production Loans
400 Locating Armed Forces (Special Powers) Shika Saravanabhavan and Meenakshi Rajeev
Act, 1958 in the Federal Structure: An 415 Economic and Social Benefits of SHG-
Analysis of Its Application in Manipur and Bank Linkage Programme in Karnataka
Tripura Meenakshi Rajeev, B P Vani and
Rajiv Tewari Veerashekharappa
401 Performance of Power Sector in Karnataka 416 Two Decades of Fiscal Decentralization
in the Context of Power Sector Reforms Reforms In Karnataka: Opportunities,
Laxmi Rajkumari and K Gayithri Issues and Challenges
402 Are Elections to Grama Panchayats Party- M Devendra Babu, Farah Zahir, Rajesh Khanna
less? The Evidence from Karnataka and Prakash M Philip
D Rajasekhar, M Devendra Babu and R Manjula 417 Karnataka State Budgets - How Far Have
403 Hannah Arendt and Modernity: Revisiting They Promoted Inclusiveness?
the Work The Human Condition K Gayithri and Vijeth Acharya
Anil Kumar Vaddiraju 418 Caste Discrimination Practices in Rural
404 From E-Governance to Digitisation: Some Karnataka
Reflections and Concerns I Maruthi and Pesala Peter
Anil Kumar Vaddiraju and S Manasi 419 Food Security in Brics - Current Status
405 Understanding the Disparity in Financial and Issues
Inclusion across Indian States: A Malini L Tantri and Kumar Shaurav
Comprehensive Index for the Period 1984 420 Impact of Age Structure Transition on
– 2016 Current Account Balance for India: An
Shika Saravanabhavan Empirical Analysis
406 Gender Relations in the Context of Aneesha Chitgupi
Women’s Health in Chennai 421 Market Value and Capital Structure: A
Annapuranam K and Anand Inbanathan Study of Indian Manufacturing Firms
407 Value of Statistical Life in India: A Dhananjaya K and Krishna Raj
Hedonic Wage Approach 422 Inequity in Outpatient Healthcare Use
Agamoni Majumder and S Madheswaran and Utilization of Public Healthcare
408 World Bank’s Reformed Model of Facilities: Empirical Evidence from
Development in Karnataka NSS Data
Amitabha Sarkar Anushree K N and S Madheswaran
409 Environmental Fiscal Instruments: A Few 423 Role of Worker’s Compensation Benefit
International Experiences in Estimating Value of Statistical Life
Rajat Verma and K Gayithri Agamoni Majumder and S Madheswaran
Price: ` 30.00 ISBN 978-81-7791-280-7
INSTITUTE FOR SOCIAL AND ECONOMIC CHANGE
Dr V K R V Rao Road, Nagarabhavi P.O., Bangalore - 560 072, India
Phone: 0091-80-23215468, 23215519, 23215592; Fax: 0091-80-23217008
E-mail: reimeingam@isec.ac.in; Web: www.isec.ac.inYou can also read