INDUSTRIAL First Half 2018 - Research and Forecast Report - Colliers International
←
→
Page content transcription
If your browser does not render page correctly, please read the page content below
Research and
Forecast Report

                     Accelerating success.

   INDUSTRIAL
   First Half 2018
EXPERTS
IN PROPERTY DATA & INSIGHTS
Colliers Edge harnesses the on the ground knowledge and
latest transactional insights from the country’s leading industrial
operatives team. For market leading insights into Australian
industrial market, contact us today.

  DEEPER INSIGHTS             LIMITLESS SUPPORT         FAIRER PRICING
   Largest data set           Analyst not operators   Tailored to your needs
   on market today

Want better insights, faster? Talk to a Colliers Edge expert today
         Anneke Thompson
         National Director | Research
         +61 412 581 647
         anneke.thompson@colliers.com
         colliers.com.au/colliersedge

                                                            Accelerating success.
CONTENTS
Domestic snapshot                                                                 4

Global snapshot                                                                   5

National overview		                                                               6

Sydney                                                                            8

Melbourne                                                                        12

Brisbane                                                                         15

Adelaide                                                                         18

Perth                                                                            20

Newcastle                                                                        22

New Zealand                                                                      24

Our experience – Industrial                                                      26

                     Industrial | Research & Forecast Report | First Half 2018    3
DOMESTIC SNAPSHOT
*H1 2018 figures as at Q1 2018 BRISBANE
NET FACE RENT YIELD CAPITAL VALUE INCENTIVE LEVEL
$/m² H1 2018 $106 6.44% $1,654 16.0%
$/m² H2 2017 $106 6.55% $1,615 15.5%
% Change 0.0% -1.7% 2.4% 3.0%
SYDNEY
NET FACE RENT YIELD CAPITAL VALUE INCENTIVE LEVEL
$/m² H1 2018 $142 5.37% $2,654 11.1%
$/m² H2 2017 $140 5.73% $2,470 10.6%
% Change 1.4% -6.3% 7.5% 4.7%
MELBOURNE
NET FACE RENT YIELD CAPITAL VALUE INCENTIVE LEVEL
$/m² H1 2018 $108 6.18% $1,747 16.2%
$/m² H2 2017 $107 6.27% $1,701 16.7%
% Change 0.8% -1.5% 2.7% -3.0%
To Note: All figures represent average prime grade assets.
Port Container Movements (TEUs)
7.2%
2016 2017 Growth
2.36 2.53
5.8% SYDNEY
Average Land Value Ranges 2.65 2.80
6.0%
ADELAIDE
AVG: $252
H2 2017 1.21 1.28
AVG: $202 H1 2018
MELBOURNE
PERTH
AVG: $380 BRISBANE
AVG: $370
To Note: TEU stands for Twenty-Foot Equivalent Unit and includes Full and Empty Containers
BRISBANE All figures in millions.
AVG: $237
AVG: $246
Share of Development Supply to be Delivered in 2018
MELBOURNE
AVG: $490
(by floorspace) 6%
AVG: $552 3% Perth
SYDNEY
Adelaide
AVG: $890
AVG: $972
11%
Brisbane
$100/sqm $300/sqm $600/sqm $900/sqm $1,200/sqm $1,500/sqm
39%
Sydney
Active Tenant Enquiry Level 2016 vs 2017
40%
NSW QLD VIC
Melbourne
2016 476,100 sqm 43,550 sqm 995,207 sqm
2017 439,874 sqm 107,450 sqm 1,395,204 sqm
4
GLOBAL SNAPSHOT
*All figures in AUD; as at Q4 2017 ASIA
EUROPE CAPITAL VALUE RENT YIELD
CAPITAL VALUE RENT YIELD Hong Kong $8,282 $323 3.9%
London $5,455 $235 4.3% Singapore $7,272 $262 3.6%
Munich $3,360 $158 4.7% Beijing $2,214 $102 4.6%
Frankfurt $2,725 $128 4.7% Shanghai $1,674 $100 6.0%
NORTH AMERICA
CAPITAL VALUE RENT YIELD
Orange County $2,778 $144 5.2%
Vancouver $2,210 $99 4.5% AUSTRALIA & NEW ZEALAND
Los Angeles $2,089 $123 5.9% CAPITAL VALUE RENT YIELD
Chicago $1,425 $71 5.0% Auckland $2,058 $120 5.8%
Houston $1,298 $91 7.0% Sydney $2,039 $141 5.6%
Toronto $1,268 $70 5.5% Brisbane $1,630 $106 6.4%
Dallas $1,004 $61 6.1% Melbourne $1,214 $107 6.2%
Projected Average Annual Population Growth Projected Average Annual Growth of Imported/
(2018 to 2022) Exported Goods (2018 to 2022)
1.8% 10.0%
9.3%
1.6% 1.6%
9.0%
A verage Annual Growth Rate (%)
1.4% 1.3%
A verage Annual Growth Rate (%)
8.0% 7.5%
1.2% Exported Goods Imported Goods
1.0% 7.0%
1.0% 0.9%
0.8%
0.8% 0.7% 6.0%
0.6% 0.6%
0.6% 0.5% 5.0% 4.9% 5.1% 5.0%
0.4% 4.1% 4.2% 4.3%
3.9% 3.9%
4.0% 3.8%
0.2% 3.4% 3.4% 3.6%
0.0% 3.3% 3.1%
3.0%
0.0% 3.0% 2.8% 2.6%
-0.2% 2.0%
2.1%
-0.4%
-0.4% 1.0%
-0.6% 0.6% 0.4%
United Kingdom
United States
Hong Kong
Singapore
0.0%
Germany
Australia
Canada
France
Japan
China
India
Hong Kong
Singapore
Germany
Australia
Kingdom
Canada
France
United
States
Japan
China
India
United
Source: IMF/Colliers Research Source: IMF/Colliers Research
Australia’s Total Export and Import Activity by Value
(Direction of Trade in USD Billions) KOREA
$25b
MALAYSIA SINGAPORE
$13b $12b
THAILAND
JAPAN $12b UK
$51b $10b
CHINA
$129b
USA
$34b
INDIA
HONG KONG
$16b
NEW ZEALAND $9b
To note: Direction of Trade Statistics presents the value of merchandise exports and imports $13b GERMANY
disaggregated according to a country’s primary trading partners. Imports are reports on a $11b
cost, insurance and freight basis and exports are reported on a free on board basis.
Source: IMF/Colliers Research
Industrial | Research & Forecast Report | First Half 2018 5
NATIONAL
OVERVIEW
By Sass J-Baleh                                                            Although employment growth within specific industry ‘sub-
Associate Director | Research                                              sectors’ need to be considered, Colliers International explore
sass.jbaleh@colliers.com                                                   the following points when analysing and forecasting industrial
Australia’s economic growth will continue to be underpinned                property demand:
by solid fundamentals, with low interest rates, consumption                •     Manufacturing is an evolving industry that is becoming more
growth (fuelled by population growth), infrastructure investment,                ‘advanced’
employment and trade growth, driving demand for industrial                 •     A wider basket of employment industry sectors that
property.                                                                        have scope to occupy industrial and business zoned land
It is important to acknowledge the evolving nature of industries                 (e.g. retail trade, construction, information media and
that occupy industrial property. A wider basket of industry                      telecommunication, electricity, gas, water and waste services,
sectors and jobs, coupled with the impact of technology advances,                administrative and support services, professional, scientific
need to be taken in to consideration when calculating the projected              and technical services)
demand for industrial floorspace/land and building use/design.             •     A growing online retail trade sector
Although Investment choices in logistic-type assets will remain            •     Growth in retail demand, on the back of population growth,
dominant, particularly as eCommerce continues its exponential                    for non-discretionary goods (such as food – both ambient
growth path, other industrial sectors have experienced positive                  product and goods that require cold storage).
employment growth over the past five years (highlighted in the
tables below).

Industry of Employment Sub-sectors (Australia)

                      Industry   5-Year Annual   Transport, Postal,   Industry     5-Year Annual    Wholesale        Industry   5-Year Annual
 Manufacturing        Share      Growth          and Warehousing      Share        Growth           Trade            Share      Growth

 Fabricated Metal        10%        12.5%        Road Transport          46%           5.5%         Other Goods         25%          3.5%
 Product

                                                 Air and Space
 Wood Product             6%         7.1%                                9%            4.5%         Basic Material      24%         2.0%
                                                 Transport

 Pulp, Paper and                                 Transport Support
 Converted Paper          2%         5.3%                                13%           4.2%
                                                 Services
 Product

 Furniture and                                   Warehousing and
                          7%         3.0%                                10%            1.4%
 Other                                           Storage Services

                                                 Postal and Courier
 Beverage and             3%         2.7%        Pick-up and             13%           0.5%
 Tobacco Product                                 Delivery Services

 Basic Chemical
 and Chemical             5%         2.1%
 Product

 Petroleum and            1%         1.4%
 Coal Product

 Food Product            23%         0.5%

Source: ABS/Colliers Research

6
Top 5 Sub-Sectors Share Total Manufacturing Industry
6% 7%
Food Product
17% Food Product
9% Transport Equipment 8% 23% Machinery and Equipment
1997 Fabricated Metal Product
TODAY Transport Equipment
Printing Furniture and Other
Textile, Leather, 10% Fabricated Metal Product
10% Clothing and Footwear
11% 12%
Source: ABS/Colliers Research
The Eastern Seaboard is the focus both nationally and globally, per cent YoY growth for prime and secondary grade assets,
representing approximately 86 per cent of total national respectively), as the exposure to major infrastructure expenditure
investment sales over 2017. over the next ten years - in a land constrained market - remains a
key driving factor.
Although most of the market transactions in 2017 were from
domestic purchasers (approximately 75 per cent) and the Supply is being outstripped by demand, as indicated by lower
remainder from offshore investors, the share of offshore investors investment volumes (compared to the last three years), tighter
in Australia’s industrial property market has increased over the yields (with scope for further compression over the next six
past five years and this is expected to continue over the next few months), and significant increases in land values. Land price
years - as supported by the improvement in the global economy increases, coupled with persistent demand, are expected to place
and projected rise in demand and investment growth in the upward pressure on rental values - for both existing buildings and
major advanced economies and in the high-income economies in the pre-lease market – as well as raise the value of infill locations
Asia. Overseas purchasers dominated total Investment sales (by over the next 12 months.
volume) over the first quarter of 2018, representing approximately
Long run growth in industrial property values (land, capital, and
63 per cent of total sales, mainly stemming from Singapore and
rent) within the Eastern Seaboard states are expected to continue
China.
to be supported primarily by the following:
Conditions in the industrial property market remain strongest in
• Major infrastructure projects
Sydney and Melbourne, which is consistent with the relatively
• Long-term leases - typically backed by multinational
higher economic growth in these states. Although the Eastern
corporations
Seaboard is the focus both nationally and globally, there is a
• A diversified source of capital (local – privates, institutions,
heightened interest in Sydney. Sydney continues to perform
and super funds, as well as offshore buyer groups).
above all cities, in terms of capital growth (13 per cent and 17
Transaction Volumes and Average Cap Rates
$9 10%
Transaction Volume (AUD Billions)
$8 9%
$7 8%
Average Cap Rate (%)
7%
$6
6%
$5
5%
$4
4%
$3
3%
$2 2%
$1 1%
$0 0%
2011
2013
2017
2010
2012
2014
2015
2016
2007
2008
2009
NSW VIC QLD WA SA ACT Other Average Prime Yield Average Secondary Yield
To note: Investment sales greater than and equal to $5 million included; yields reflect reversionary yields
Source: RCA / Colliers Edge
Industrial | Research & Forecast Report | First Half 2018 7
Research &
Forecast Report
SYDNEY
Industrial | First Half 2018
By Sass J-Baleh
Associate Director | Research
sass.jbaleh@colliers.com
Prime effective rents within the Outer West, South West and
MARKET HIGHLIGHTS
North West sub-markets, where most of the development activity
and demand/take-up has been concentrated, has been relatively
A constrained supply of serviced land will limit the amount
stable. With the price of land expected to increase further over
of development activity post-2018 and continue to drive land
2018, it is projected that either:
values, in turn, increasing the value of infill locations.
• Rental values must also rise for new industrial developments
Sydney will continue to be the focus for both national and global to remain feasible,
property players, despite the land price affordability issue. • Supply from the Western Sydney Employment area be
allocated and released for industrial use/zoning,
The lack of land supply has already spurred the trend of multi- • Or both.
level strata developments across several sub-markets with
consideration made for multi-level warehousing. Sydney Average Land Value
$1,200 40%
A nnual Growth Rate (%)
$1,000 30%
La nd Value ($/sqm)
Rental growth is forecasted in the pre-lease market over the 20%
$800
next 12 months. 10%
$600
0%
$400
-10%
Overview $200
$0
-20%
-30%
Sep-08
Sep-09
Mar-08
Mar-09
Sep-10
Mar-10
Sep-12
Sep-14
Sep-15
Sep-16
Sep-13
Mar-12
Mar-14
Mar-15
Mar-16
Sep-17
Mar-18
Mar-13
Mar-17
Sep-11
Mar-11
The number of large scale infrastructure projects currently under
construction, coupled with the lack of stock on market available Average Land Value Average Annual Growth Rate
for sale and depletion of industrial zoned land across the Sydney Source: Colliers Edge
Metropolitan area have, and will continue, to be a contributing
factor to the rise in land values across all sub-markets. The The lack of stock on market available for rent and sale coupled
overall Sydney average YoY growth in land values has been with a limited and diminishing supply of industrial zoned land
approximately 17 per cent (as at Q1 2018), above the ten-year within the North and South sub-markets – representing 3 per
annual average of 5 per cent. Annual growth rates over the cent and 13 per cent, respectively, of total Sydney Metropolitan
next six months are projected to remain in double digits as the supply – will continue to be a contributing factor to the rise in
construction phase of major infrastructure projects continue to land and rental values for these sub-market, in turn, raising the
progress and as serviced land supply is further depleted. overall Sydney average. As land in these markets are constrained,
Although Sydney’s Western sub-markets have experienced record it is projected that the development of multi-level industrial strata
growth in land values, particularly over the last 12 months, rises buildings will become ever more attractive to maximise floorspace
in effective rents in the pre-lease market have not kept pace. ratios and market values particularly as small businesses continue
to demand space near the CBD.
8
Average Land Value Western Sub-Markets
$700
Submarkets
West
La nd Value ($/sqm)
$600
$500
The Western market, comprising the Inner, Central, North West,
$400
South West, and Outer West sub markets, will benefit from the
$300
large investments being made in transport infrastructure. The
$200
most recently committed infrastructure has been the North-South
$100
$0
rail link (first stage - under the ‘Western Sydney City Deal’) from
St Marys to Badgerys Creek via Western Sydney Airport, with
Sep-08
Sep-09
Mar-08
Mar-09
Sep-10
Sep-12
Sep-14
Sep-16
Sep-15
Mar-10
Mar-12
Sep-13
Mar-14
Mar-16
Mar-18
Mar-15
Sep-17
Mar-13
Mar-17
Sep-11
Mar-11
expected completion by 2026.
Inner West Central West South West
North West Outer West
The positive spillover effects from infrastructure investment is
Source: Colliers Edge expected to continue throughout 2018 as projects’ construction
phases commence. Land value uplift has been realised across
As industrial land across Sydney is becoming increasingly
all the Western sub-markets where annual growth rates have
constrained, the rise of multi-level industrial strata buildings has
averaged above 20 per cent.
become an attractive option to maximise floorspace ratios and
market values. These types of development have been prominently West Market Land Values
occurring within Sydney’s South sub-market – achieving record $700 35%
sale prices. The most recent projects include 29 Bay Road, $600 30%
Land Value ($/sqm)
Taren Point (13-unit industrial estate, completely sold within three $500 25%
months) and 40 Cawarra Road, Carringbah (showroom/office/
Growth Rate (%)
$400 20%
warehouse and 94 lock-up storage units) $300 15%
$200 10%
The share of eCommerce sales has been and will continue to
$100 5%
grow exponentially. There will be an increasing need to position
$0 0%
logistic/warehouse facilities dedicated for the ‘last mile’ within South West Central West Outer West Inner West North West
Q1 2017 Land Value Q1 2018 Land Value YoY Growth
Sydney’s inner/middle ring precincts. However, finding and
securing an optimally located industrial space within this inner To note: Land Values refer to 2.5 ha serviced sites
area will be a major challenge going forward. Given the extremely Source: Colliers Edge
low levels of stock on market and industrial land within the North
Net face rents across the western sub-markets have recorded
and South sub-markets, industrial users requiring proximity to
continued growth of around 7 per cent over the past 12 months,
the CBD and accessibility to the greatest proportion of the Sydney
however this has been mainly driven by rises in incentives rather
Metropolitan population have been increasingly enquiring for
than effective growth. To secure large tenants’ incentives have
space within the Kingsgrove suburb area. Kingsgrove is currently
risen within the Outer West sub-market over the past 12 months,
the strongest industrial precinct outside of the South Sydney
rising from an average of 10 per cent at the end of 2016 to 15 per
‘core’, with land prices currently trading at the same as Botany.
cent (as at March 2018). Competition between developers and
Against a backdrop of strong market demand in attaining a limited private land owners is expected to remain high over 2018 due to
pool of industrial assets across Sydney, yields have continued continued levels of development activity. Therefore it is projected
to compress for both prime and secondary grade assets. Prime that incentive levels will remain relatively unchanged, particularly
and secondary yields currently average 5.37 per cent and 6.46 within the Outer western markets for prime grade assets.
per cent, respectively. Prime yields have compressed by 65 bps,
versus 66 bps for secondary, over the past 12 months to March Prime Average West Market Rent and Incentive
$140 12%
2018. Compression rates in yields over the last six months has $120
10%
however declined, and it is expected that yields will remain stable $100
8%
over the next six months.
Rent ($/sqm)
Incentive (%)
$80
6%
$60
4%
$40
2%
$20
$0 0%
Sep-08
Sep-09
Mar-08
Mar-09
Sep-10
Sep-11
Sep-12
Sep-13
Sep-14
Sep-15
Sep-16
Sep-17
Mar-13
Mar-10
Mar-11
Mar-12
Mar-14
Mar-15
Mar-16
Mar-17
Mar-18
Average West Incentive Average West Net Face Rent Average West Net Effective Rent
Source: Colliers Edge
Industrial | Research & Forecast Report | First Half 2018 9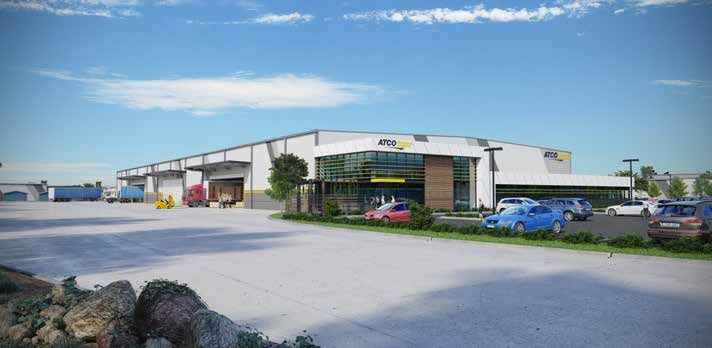
The majority (around 94 per cent, or 644,230 sqm) of Sydney’s Access to the metropolitan population as well as other key
industrial development will continue to be delivered in the Western stakeholders (e.g. suppliers)
markets over 2018 – compared to 80 per cent in 2017 (for
Proximity to existing industrial infrastructure
developments over 5,000 sqm). Major developments include:
Strong accessibility into/out of site – easy movement of large
• Calibre Eastern Creek (Mirvac) - a speculative development.
freight vehicles and areas surrounded by B-double access
This project is to be delivered over five stages, adding
routes
120,000 sqm of industrial space. The site has already
secured three logistic tenants – CEVA Logistics (19,000sqm), Internal flexibility in the movement/flow throughout the facility
Sheldon Hammond (31,000 sqm), and Miele (17,780 sqm). Scale in terms of cubic capacity - supply chain costs are
The total project is expected to be complete by the end of greater than rental costs, and therefore sites that are more
2018. space efficient will boost profit margins for many industrial
• Crossroads Logistics Centre (AMP) at Casula, adding users
approximately 80,000 sqm of warehouse/office space over
Scope to cater for current and future technology
three precincts, with expected completion in Q4 2018. The
(e.g. automated material handling and racking systems),
site has already secured three tenants - Electrolux, WesTrac
therefore can adapt to the changing nature of facilities now
and Cosentino.
and into the future.
• Oakdale Industrial Estate at Eastern Creek (Goodman and
Brickworks JV), comprising of Oakdale Central and Oakdale
South. This project will deliver 241,200 sqm of industrial
South
space over the next five years. Approximately 36,600 sqm Strong competition to find and secure sites within the South
is expected to be delivered in early 2018 – pre-committed by sub-market continues to be the main factor driving land and rental
Reckitt Benckiser. values. Land values in the South remain one of the highest rates
relative to all other Sydney sub-markets and have now reached an
Tenant demand over the past year for pre-lease space has been
average of $1,925/sqm. This reflects a 19 per cent YoY increase,
strong as tenant relocation options have been more attractive
and over double the Sydney average of $971/sqm. Net face rents
than the renewal of leases. Large industrial operators have been
have however remained stable over the past 12 months, for both
seeking to increase their supply chain efficiencies – demonstrating
prime and secondary assets, and currently average $178/sqm and
the current and continued strength in the market for core plus
$139/sqm, respectively.
assets. Sites that have the following features will become
increasingly important as they offer opportunities for increasing
business efficiency:
5 Irvine Place, Bella Vista
Sold on behalf of Actron Air
10Artist Impression
23 Hollinsworth Road, Marsden Park
Leased on behalf of Logos
The extremely low level of stock on market, as well as a units will continue to be developed over the next few years to
continuing depletion of industrial zoned land, has led to more meet the growing demand.
users seeking to locate toward the Kingsgrove Area, South West
as well as the ‘Outer’ southern market, that is the Sutherland North
Shire, where industrial space options are greater. Industrial users
The North sub-market has the most limited supply of industrial
from the Inner West who have been forced to relocate have also
zoned land relative to all other sub-markets, representing only a 3
shown increasing interest to occupy space within the Sutherland
per cent share of land supply relative to the Sydney Metropolitan
Shire. The Sutherland Shire’s average strata building and land
Area. Similar factors that are present in the South market
sales record a large price differential relative to the Inner South
continue to affect the North market and, as such, land values have
market (i.e. precincts of Alexandria, Mascot, Botany etc.) even
continued to climb reaching $2,000/sqm. Notable sales include
though the Sutherland Shire values have grown significantly -
142 Wicks Road, Macquarie Park (3,155 sqm) for $8.25 million,
around 50 per cent growth over the past three years. Current
as well as the sale of 2 Lincoln street, Lane Cove (6,818 sqm) for
sale rates recorded for the Sutherland Shire include:
$28.25 million.
• Strata building sub 500 sqm = $3,900-$5,000/sqm
Net face rents have remained stable over the past 12 months,
• Freehold building above 500 sqm = $3,300-$4,200/sqm
averaging $200/sqm for prime and $164/sqm for secondary
• Land values = $1,200-$1,700/sqm. grade assets - still the highest rental rates compared to all other
The Sutherland Shire is well-positioned to continue attracting Sydney sub-markets. Incentives for secondary grade assets have
industrial users who are relocating from Inner Sydney areas, decreased over the past 12 months, from around 12 per cent to
due to the critical mass and diversity of business activities in 8 per cent (as at March 2018). It is projected that rental growth
the area and relative short-distance to Sydney Airport and Port in secondary assets will remain positive over the year as limited
infrastructure. stock on the market continues to place upward pressure on rents
and downward pressure on incentives.
Most of the recent industrial developments in the South market
have been multi-story industrial units to maximize floorspace The scarcity of stock with long-term leases will however increase
ratios and market values. There has been strong take-up the migration of industrial operations (particularly medium to
for these smaller industrial units, encompassing co-located large scale users which do not have a localised focus) to move
warehouse and ancillary office space, with demand from a mix to alternative locations (including toward precincts that lie within
of users, particularly those businesses that have relocated from the North West sub-market) to take advantage of relative cheaper
city locations (such as Surry Hills, Pyrmont, and the CBD) due to rents, new buildings and large space.
rental premiums. It is expected that multi-level strata industrial
Industrial | Research & Forecast Report | First Half 2018 11Research &
Forecast Report
MELBOURNE
Industrial | First Half 2018
By Anika Wong interest for well-located industrial land. Ecommerce has been
Manager | Research driving demand for modern logistic facilities. Occupiers seeking
anika.wong@colliers.com prime assets to cater to the ongoing drive for efficiency and, in
turn, pushing businesses to assess their warehouse footprint
and supply chain efficiency. Continued high demand from major
MARKET HIGHLIGHTS
logistics, transport and warehousing groups will see an increase in
Rising scarcity of developable land in the City Fringe and development of vertical warehouses particularly in the City Fringe
South East sub-markets are placing upwards pressure on and South East sub-markets where land supply is limited.
land values.
Submarkets
Recycling of assets have slowed on the back of little stock
being listed for sale. City Fringe
The finalized Fishermans Bend framework and the release of
Investors look to expand their asset allocation in the West the planning controls is expected in the second half of 2018.
sub-market to benefit from rising transport infrastructure There are five linked precincts – Montague, Lorimer, Sandridge
spending. and Wirraway (Capital City Zoned) and the Employment precinct
(230 ha) which has retained its industrial zoning. According to
Overview the 2017 framework draft, the employment precinct is set to be
“Australia’s premier design and manufacturing centre supporting
small and large-scale manufacturing” with the total precinct
Over the first quarter of 2018 investment transactions reached
looking to accommodate 80,000 residents and 80,000 jobs by
a total of $123 million – with overseas buyers dominating 95 per
2050. This will place further implications as owners hold out for
cent of the total volume. This attributed to around 40 per cent of
rezoning opportunities and developers await planning restrictions,
the national sales volume, behind New South Wales at 46 per cent.
particularly where the new North Melbourne station will be
The volume of sales recorded has trended downwards over the
built in the Arden precinct - currently a big industrial presence.
past 12 months, and this is due to the limited stock of prime grade
A structure plan will be put in place, which will likely include
assets being offered to the market. However, the unprecedented
significant residential, retail and office usage.
demand from domestic and offshore buyers remain strong with
high levels of interest for quality assets (when available in the Rental value uplift in both prime ($194/sqm) and secondary
market). This translated into average yields for both prime and ($104/sqm) assets saw an increase of 1.8 per cent and 5.1 per
secondary grade assets to tighten by 22 basis points (to 6.18 per cent, respectively. With industrial land scarce in Port Melbourne
cent) and 56 basis points (to 7.25 per cent) respectively. there is a significant lack of both prime and secondary assets
available for lease and thereafter tenants are finding it difficult to
Connectivity within industrial precincts will set to benefit from
secure lease terms longer than five years. This will further add
the current and planned infrastructure and road projects across
investment appeal and catalyse a reduction in lease deal times
Victoria with major projects including the CityLink Tulla Widening,
and incentive levels over the course of 2018. Similar to the South
M80 Road Upgrade, West Gate Tunnel Project and pending North
Sydney sub-market, there is limited new stock being built in the
East Link project. In addition, the robust population growth and
fringe market, with only the Port Melbourne offering opportunity
strong economic conditions in Victoria has seen transport and
whilst there are still tenants (mainly in the construction sector)
logistics and wholesale and distribution groups capture significant
requiring an Inner-City location where outer markets are not
12suitable for their requirements. Inner-City areas such as Cremorne Melbourne Investment Sales
has become an attractive destination for diverse industries not $1,800
$1,600
only for creative and tech groups but also the automotive sector
Transaction Volume ($ Millions)
$1,400
due to the accessibility to motorways and major arterial roads. $1,200
This was evidenced with Tesla securing a warehouse (700 sqm) $1,000
$800
in Cremorne on a two-year lease. $600
$400
Land values in the City Fringe have risen in line with rents, $200
growing by 10 per cent over Q1 2018, now averaging $1,350/sqm. $0
2013 2014 2015 2016 2017 Q1 2018
This has been driven by owner occupiers who need certainty of To note: Investment sales greater than and equal to $5 million included
tenure and are opting to acquire assets opposed to leasing. Source: RCA/Colliers Edge
Prime and Secondary Average Net Face Rent
North
and Incentive
The North sub-market has seen continued strong tenant demand $120 20%
18%
for prime grade stock. Prime face rents increased by 3.2 per $100
16%
cent over the first quarter of 2018 now averaging at $80/sqm, $80
14%
Rent ($/sqm)
Incentive (%)
12%
and incentives for prime and secondary grade stock fell by one $60 10%
8%
percentage point to an average of 19 per cent and 14 per cent, $40
6%
respectively. $20
4%
2%
$0 0%
The supply of new industrial floorspace for the remainder of 2018
Sep-08
Sep-09
Mar-08
Mar-09
Sep-20
Mar-20
Sep-10
Mar-10
Sep-12
Sep-14
Sep-16
Mar-12
Sep-15
Sep-18
Sep-13
Mar-14
Sep-19
Mar-15
Mar-16
Mar-18
Mar-19
Mar-13
Sep-17
Mar-21
Mar-17
Sep-11
Mar-11
is concentrated in the North region (422,069 sqm); expected to
account for around 60 per cent of total new supply to be delivered
Prime Incentives Secondary Incentives Prime Net Face Rents Secondary Net Face Rents
Source: Colliers Edge
in Melbourne. The majority of this supply is in the final stages
of development of the Merrifield Business Park, on course to be
completed in the second half of 2018. Average Land Values (excluding City Fringe)
$470
Land values have risen by 7.5 per cent over the first quarter of $420
$370
2018, now averaging $288/sqm, after remaining stagnate since
La nd Value ($/sqm)
$320
December 2016. Growth in land value was underpinned by the $270
lack of prime grade stock and underlying demand competition $220
$170
from food groups, logistics and packaging industries seeking sites $120
to expand their manufacturing footprint. This was evident with $70
the exchange of D’Orsogna striking a $60 million warehouse deal $20
Mar-08
Mar-09
Nov-08
Nov-09
Jul-08
Jul-09
Mar-10
Nov-10
Mar-12
Mar-14
Mar-15
Mar-16
Mar-18
Nov-12
Mar-13
Nov-14
Nov-13
Nov-15
Nov-16
Mar-17
Nov-17
Mar-11
Nov-11
Jul-10
Jul-12
Jul-14
Jul-15
Jul-16
Jul-13
Jul-17
Jul-11
with MAB Corp and joint-venture Gibson Property Corporation
for the new 10,858 sqm manufacturing site at Merrifield Business North South East West Outer East
Park. D’Orsogna plan to expand its products to the South- Source: Colliers Edge
East Asian market, and will be operating in a newly technology
Share of Development Supply to be delivered in 2018
designed facility due to complete towards the end of 2018. (by floorspace)
Emerging businesses catering to local and export markets are also
further boosting owner-occupier activity for established stock, as
17%
locations with strong transport infrastructure remain attractive.
North
West South East
23%
On an annual basis, prime face rents in the West sub-market 60% West
recorded the strongest face rental growth at 3.9 per cent to $79/
sqm. This was also reflected in secondary grade stock increasing
by 4.3 per cent to $60/sqm over the same period, as occupier
demand for space in the premises increases in popularity. With Source: Cordell Connect/Colliers Edge
competition high, the average time a property is on the market for
lease has decreased significantly from 6 to 3 months.
Industrial | Research & Forecast Report | First Half 2018 13One of Victoria’s largest industrial property lease deals was $425/sqm. On an annual basis, land values appreciated by 39 per
secured with Albi Imports. The homeware importer and cent, with the Outer East sub-market also experiencing double
wholesaler secured a seven-year lease on prime grade facility digit growth rising by 17 per cent over the same period and 6 per
(27,903 sqm) in Truganina as its new distribution centre. This cent over Q1 2018. The constraint of the land supply shortage in
was an expansion and relocation from their 14,000 sqm facility the South-East sub-market, in combination with the increasingly
in Truganina, and has reported to be on an annual rent of $1.5 scarce development and value-add opportunities with most major
million. As a result, the unprecedented demand is expected to sites owned by developers, have placed significant upwards
continue and we expect face rents to climb by 1.5 to 2 per cent pressure on land prices. For this reason, we expect rental growth
and incentives to fall by close to 5 percentage points by the end of will follow over 2018, and landlords will capitalise on the strong
2018. demand and limited supply.
Outgoings for prime grade assets have decreased by 13 per cent The South East sub-market recorded $99.8 million in investment
to $13/sqm, as newly designed buildings and existing buildings are transactions over the first half of 2018 across seven assets – with
undergoing upgrades that are focused on efficient and sustainable the majority of assets exchanging in January this year. Prime
practices. yields remained unchanged South East secondary yields tightened
by 12 basis points to 7.13 per cent. Major sales have been highly
Highly constrained supply, particularly prime grade assets, in the
active in the Eastern arena with a notable transaction including
Inner-West caused average land values to increase by four per
Woolworths HQ in Mulgrave purchased for $90.75 million to
cent over Q1 2018 to $260/sqm. This was underpinned by the
Growthpoint Properties reflecting a 5.2 per cent yield on a 3.8
strong demand from tenants looking to benefit from significant
year WALE. The 68,144 sqm asset poses development and value-
road upgrades including the West Gate tunnel Project that will
add opportunities. In the Outer East, strong purchaser appetite
significantly improve access to the Port of Melbourne.
continues with a recent example of Forza Capital acquiring a
Only 17 per cent (or 117,123 sqm) is recorded in the development Blackburn asset for $31.5 million on a passing yield of 6.7 per
supply pipeline to be delivered in the West sub-market over 2018. cent. The 20,400sqm warehouse was sold fully tenanted including
It is projected this will lead to further appreciation in land values. a 50 per cent lease to Gainsborough Hardware.
Over the first half of this year, a total of $220 million across There is approximately 161,986 sqm of industrial land to be
seven sales were transacted in the Western industrial market. The delivered over 2018 however much of this is in the early stages
largest transaction recorded over this period was the purchase of development. Englobo land demand continues to escalate
of 25-33 Fourth Avenue, Sunshine comprising of four industrial as zoned land supply remains scarce on the back of pre-lease
properties. The GPT Group acquired the former printing facility activity and strong land sales. With The Key Industrial Park in
for $74 million reflecting a 6 per cent yield. The four buildings Keysborough nearing completion, Frasers Property extended
span over 52,8504 sqm and is tenanted by IVE print and their portfolio with the recent acquisition of 23 ha land parcel
communications business on a 9-year WALE. Another notable for $19 million earmarked for an industrial estate (Braeside
sale was the Myer Distribution Centre at Altona North purchased Estate) - offering saleable turnkey opportunities and prime grade
by Lendlease’s APPF Industrial from Dexus for $38.2 million. The buildings for lease. The Braeside Estate, expected to commence
30,400 sqm facility leased to Myer is well located within a key construction by mid-2019, is well-located in one of the highly
logistics precinct with strong accessibility to transport links and sought-after areas in Braeside within Melbourne’s South East
surplus land (20,000 sqm) for further development opportunities. market and will cater to the growing demand for industrial land.
Nissan Australia sold its Melbourne headquarters for $35 million
to a syndicate of local investors. The 11.4 ha site in Dandenong
South was occupied with Nissan’s parts warehousing operations
now relocating to new facilities in Melbourne’s West industrial hub
developed by Frasers Property with CEVA. The syndicate with the
intention to expand the existing facility on the Nissan site, similar
to GM Holdens manufacturing plant in Adelaide last year, later
transforming the space into a business park.
South East and Outer East
Land values in the South East sub-market recorded strong growth
of 17 per cent over the first quarter of 2018, well outperforming
Building 1 & 2, 27-43 Toll Drive, Altona North
the other major precincts over this period, currently averaging Managed on behalf of Logos Australia Group
14Research &
Forecast Report
BRISBANE
Industrial | First Half 2018
By Helen Swanson product. There has been a 55 to 115 bps cap rate compression of
Manager | Research prime grade initial yields for Brisbane industrial assets over the
helen.swanson@colliers.com period Q4 2015 to Q1 2018. The greatest level of compression
over the respective period was experienced in Brisbane’s northern
industrial precinct, with yields tightening by 110-115 bps. The ATC
MARKET HIGHLIGHTS records the tightest initial yield for prime grade industrial product
sitting at 6.00 to 6.45 per cent.
Record level of take up in 2017, where the 251,000 sqm of
A similar story has been experienced for industrial land values
industrial supply added to the market has all been leased.
with prices rising considerably, due to limited supply over the last
year. Year-on-year to March 2018 the average industrial land value
Improved economic conditions driving demand for across Brisbane increased by around 9 per cent. Land prices for
Brisbane’s Industrial assets. industrial allotments 2.5 hectares are currently highest in the ATC
and range between $285/sqm and $425/sqm.
$1.4 billion of industrial sales in 2017, up 54 per cent the Leasing activity for prime grade warehousing remained buoyant
previous year. whereas secondary grade stock remains relatively subdued.
There was nearly 490,000 sqm of leasing transactions during
2017. Of this, the majority were design and construct and/or pre-
Yields continue to compress, with prime grade assets commitments. Prime grade rental rates remained relatively stable
averaging 6.44 per cent. over the last year and stagnant over the last quarter. The ATC led
the industry average at net face $116/sqm.
There was 251,000 sqm of industrial supply added to the industrial
Overview market in 2017, of which all have been leased. Additionally, of the
196,000 sqm anticipated for completion in 2018, 33,649 sqm is
Brisbane’s industrial market fundamentals improved in 2017 with a now complete and fully leased and a further 84 per cent of the
record level of take-up recorded, particularly in the Outer South and 103,000 sqm currently under construction is leased. Looking
Australia TradeCoast (ATC) precincts. The Queensland economy forward and assessing the supply pipeline of new upcoming
is also benefiting from improved employment and net interstate projects over the next few years being below historical levels, we
migration numbers along with a strengthening service and anticipate that incentives will continue to fall over the short to
residential construction sector, which overall are having a positive medium term.
impact on business sentiment and hence demand for industrial
assets. Brisbane Industrial Sales
$1,600
Total industrial property sales across greater Brisbane priced for
$1,400
the 2017 calendar year totalled $1.43 billion (for sales equal to and
$1,200
above $5 million). This was up 54 per cent on the $928 million
(AUD) Millions
$1,000
recorded in 2016. Domestic buyers made up approximately $1
billion (or 74 per cent) of sales. Although the share of offshore $800
investment was lower in 2017 this was due to the limited supply of $600
suitable stock. Contributing to the record value in 2017 were some $400
significant sales. This included the sale of 10 properties, totaling $200
around $444 million, over four portfolios. $0
2007 2008 2009 2010 2011 2012 2013 2014 2015 2016 2017 2018
Limited availability of stock and strong demand for industrial assets To note: Include sales equal to and above $5 million; 2018 figure reflects Q1 2018
Source: RCA/Colliers Edge
resulted in rising prices and tightening yields for prime grade
Industrial | Research & Forecast Report | First Half 2018 15Submarkets Hendra, Northgate and Banyo, are now also in competition with
medium rise residential density developments. Consequently,
Australian TradeCoast value add industrial sites in this precinct are also being considered
as a viable investment option for some purchasers.
Record level of prices achieved for industrial
Key notable transactions in the latter half of 2017 included,
allotments
920-928 Nudgee Road, Banyo and 741 Nudgee Road, Northgate.
Limited supply of industrial land in the ATC has seen prices rise 920-928 Nudgee Road, Banyo was acquired in November 2017 by
significantly. Prices for industrial allotments reached a 10-year Kingdom Sub TC Pty Ltd from Sentinel Property Group for $36.75
low in early 2014 with allotments circa 2.5 hectare averaging million. Located on a 47,880 sqm site, the steel processing and
$275/sqm. However, as at Q1 2018 the average industrial distribution facility was leased long-term to BlueScope until 2026.
allotment (circa 2.5 hectare) sits at $285/sqm to $425/sqm. The facility offers opportunity for further expansion with only 36
A recent example of investors’ interest in the ATC precinct per cent site coverage. Additionally, 741 Nudgee Road, Northgate
was Sentinel Property Group’s acquisition of a major industrial was purchased by New Zealand exchange listed Augusta Capital
investment with development upside (STCA), within the ATC for $28.25 million. It purchased the 8,764 sqm site through a
precinct at Pinkenba, for $48.5 million. The waterfront bulk single asset fund established by its subsidiary Augusta Funds
storage industrial facility located on a 140,006 sqm site at Management.
69 Tingira Street, Pinkenba, was purchased in a leaseback
arrangement with global diversified industrial chemical South
company Incitec Pivot Pty Ltd (ASX:IPL). IPL will continue to
All, but quiet, on the southern front
run its fertiliser distribution centre from the site and will lease
approximately 11.5 ha of the property with 2.5 ha on Soutter Street There has been strong demand from a number of multi-national
available to Sentinel for further development. The site benefits companies seeking to secure warehousing space for their
from an adjoining wet lease of 15,370 sqm with associated wharf headquarters in Brisbane’s southern region. For instance, both
infrastructure. Hilton Foods and Asahi committed to purpose-built facilities for
their operations in Heathwood last year.
Flexibility key to spec and purpose-built take up
Speculative and purpose-built buildings are being leased relatively
quickly in the ATC. Recent examples include the following: Brisbane Industrial Prime Grade Yields by Precinct
10.00%
• Pepsi co, Export Motorway Estate, Lytton
9.00%
> Speculative development – 19,718sqm for $120/sqm net
8.00%
Yield (%)
• Deliver Group, Export Motorway Estate, Lytton
7.00%
> Speculative development – 6,438sqm at $120/sqm net 6.00%
• MRC, 96 Export St, Export Motorway Estate, Lytton (spec) 5.00%
> Speculative development – 4,070 sqm at $123/sqm net 4.00%
Sep-05
Sep-06
Sep-08
Sep-09
Mar-05
Mar-06
Sep-07
Mar-08
Mar-09
Mar-07
Sep-20
Mar-20
Mar-22
Sep-10
Sep-12
Sep-14
Mar-10
Sep-15
Sep-16
Sep-18
Sep-19
Mar-12
Sep-13
Mar-14
Mar-15
Mar-16
Mar-13
Sep-17
Mar-18
Mar-19
Sep-21
Mar-17
Mar-21
Sep-11
Mar-11
• Miele Australia, Brisbane Airport
ATC North South South West Yatala
> Purpose built facility – 7,065sqm at $130/sqm net
Source: Colliers Edge
• Steelforce Australia Pty Ltd, Port West Logistics Facility
Brisbane Industrial Incentives by Asset Class
> Purpose built facility – 15,980 sqm at $120/sqm
20%
North and Outer North 18%
16%
14%
Incentive (%)
Value add sites sought after due to tightening 12%
10%
land supply 8%
6%
There was circa $160 million worth of industrial sales in 4%
2%
Brisbane’s North and Outer North region over 2017. Investors 0%
Mar-08
Mar-09
Mar-20
Mar-22
Mar-10
Mar-12
Mar-14
Mar-15
Mar-16
Mar-18
Mar-13
Mar-19
Mar-17
Mar-21
Mar-11
who were unable to purchase, due to lack of stock, ventured
further afield to opportunities on offer in Brisbane’s North. Many
Prime Secondary
Source: Colliers Edge
industrial assets located in Brisbane’s Inner North, such as
16Hilton Food Group has secured a new 40,225 sqm state of the finding appropriately zoned land which offers ease of access to
art specialised meat facility on a 71,160 sqm site at Seeana Place, infrastructure networks and is also not encroaching on residential
Heathwood to supply Woolworths Ltd. The facility will include a development is similarly becoming difficult to source.
ground floor, mezzanine level and first floor warehouse packaging
area. The ground floor GLA will be approximately 25,000 sqm.
Yatala Enterprise Area (YEA)
Hilton will pre-lease the facility when completed in April 2019 for
a 15-year term. It is believed an incentive was provided as part of Improved sentiment & affordability driving demand
the lease deal. Additionally, Asahi also committed to a purpose- for industrial product
built facility of 18,762 sqm for a 20 year term. Completion of the Improved sentiment driven by recent positive economic results for
Asahi building is anticipated by Easter this year. the Gold Coast, has helped drive demand for industrial product
in the Yatala Enterprise Region (YEA). A current trend is for
South West businesses from the Gold Coast relocating to Yatala due to the
limited supply of product on offer in the Gold Coast Central region
Costco head south west
and/or enticed by the cost effectiveness of industrial allotments
A Costco warehouse is ready for development in Brisbane’s South on offer in this precinct. Industrial allotments sized circa 2.5
West industrial precinct within the Citiswich development located hectares in the YEA currently ranges between $200/sqm and
in Bundamba. Construction will include a wholesale warehouse, $275/sqm. This compares to industrial allotments in the ATC
including a tyre centre, optical centre, hearing aid centre and food which are currently achieving $285/sqm to $425/sqm. Given the
court with approximately 13,750 sqm. Spokespersons for the YEA’s ease of access to the M1 and efficient transport network,
company noted that the development suited the unique location the region is becoming an affordable alternative for a variety of
requirements of the company, with excellent freeway access to a industrial users.
large regional customer base.
Zupp Property acquires 18-26 Lahrs Road, Ormeau
Developers look to secure and land bank large
ZUPP Property Group has secured a major industrial asset in the
portions of land
Brisbane-Gold Coast corridor. The Ormeau property was sold
Developers are looking further West for land banking opportunities fully leased to Stoddart Group’s Steel House Frames business.
as the supply of large parcels of industrial zoned land within a On a 2.05 ha site at 18-26 Lahrs Road, it comprises a 4,469 sqm
20 km radius of Brisbane’s CBD is becoming increasingly harder building and generates a rental income of about $650,000 per
to source. This is placing upward pressure on land prices in annum net. The 22 per cent site coverage also offers the new
Brisbane’s South Western industrial precincts. Additionally, owners development upside.
Empire Industrial Estate - Lots 62 & 63 Peachey Road, Yatala
Leased on behalf of CIP (Lessor) ATCO Structures & Logistics (Lessee)
Industrial | Research & Forecast Report | First Half 2018 17Research &
Forecast Report
ADELAIDE
Industrial | First Half 2018
By Kate Gray powered battery storage facility to provide power to the steel
Director | Research works which will assist in boosting the output of the steelworks.
kate.gray@colliers.com The investment in renewables is expected to bring the price of
power down which has restricted growth in industrial business
with power price escalations.
MARKET HIGHLIGHTS
The Adelaide industrial property market has seen vacancy
Techport infrastructure for submarine contract underway. increase to 3.9 percent, up from a very low 2.8 percent in
September 2017. This is mostly due to vacancy increasing in the
Largest battery power plant now in operation. Outer North market, with more space expected to be offered to the
market over the next six months. New supply is expected to pick
up pace in 2018 and 2019 which is likely to be driven by defence
Tonsley sees new tenants move in.
and logistics. Rents have remained largely stable across most
sub-markets and incentives remain in the 10-15 per cent range for
Overview most areas.
Over the past 12 months there is growing momentum in the Investment activity in the Adelaide market was above average
Adelaide economy which is starting to result in some positive with approximately $180 million of sales recorded for transactions
signs in the Adelaide industrial market. There are several equal to and greater than $5 million during 2017. Investment has
factors contributing to this momentum which include significant been driven by private investors, but we are seeing increasing
infrastructure spending such as Torrens to Torrens upgrade, the level of enquiry from institutional investors for industrial property
Darlington interchange and the proposed Northern Connector, and over the last six months. There has been a slight tightening
a focus on key innovative industries such as bio medical, energy of yields in the established industrial markets, but there is an
and mining. There is also a growth in the appetite for start-up increasing demand for prime assets so there is scope for further
companies to continue to grow in Adelaide which is expected to tightening over the next 12 months for prime grade assets.
be boosted by the election of the Liberal government in March.
Also not to be underestimated is the gearing up for the $60 billion Sub Markets
submarine contract which includes infrastructure, jobs, and is
Outer North
likely to lead to additional high tech industries in the future. A
space agency has been floated in the last six months with the The Adelaide Outer North market has seen an increase in
Federal government widely expected to commit funding to the vacancy over the last 6 months to 3.0 percent. This is up from
establishment of an agency. The combination of all this spending 0.5 percent in September 2017. Although the Holden plant has
will drive new supply and business growth in the Adelaide ceased operations, Holden is still occupying and commencing
industrial market. the decommissioning and has not been offered to the market for
lease. This site sold in December to Pelligra for a reported $55
South Australia has also seen Tesla install the world’s largest
million. It is understood that this will not settle until mid-next year
battery which was commissioned in December 2017. This is linked
and will be repositioned as Liongate Business Park once it settles.
to the Hornsdale wind farm, located in Jamestown. This state
The increase in vacancy in the Outer North is a result of several
government investment will stabilise the network. Liberty House
automotive suppliers ceasing operations once Holden closed and
has also purchased a stake in Zen energy, after the acquisition
therefore the space is now being offered to the market.
of Arrium in Whyalla. The company plans to construct a solar
18Inner North
Adelaide Industrial Sales
The infrastructure spending to support the Submarine contract $350
has commenced with $1.2 billion of new infrastructure underway.
$300
This includes new roads, wharf and equipment upgrades and new
$250
(AUD) Millions
buildings are all planned for the commencement of construction of
$200
the submarines in 2020. This is only the beginning of the pipeline
$150
of supply we are likely to see due to the submarine contract.
With the release of the Defence white paper in 2016, the Federal $100
government has a long term commitment and plan for defence $50
spending over the next 10 years. This has seen Adelaide becoming $0
2007 2008 2009 2010 2011 2012 2013 2014 2015 2016 2017
the centre of naval construction for defence. With the significant 1st Half 2nd Half
government investment in naval contracts expected to start to flow To note: Includes sales equal to and above $5 million
over the next two years private contractors that secure contracts Source: RCA / Colliers Edge
for these projects are expected to commit to locating a facility in
Adelaide Industrial Vacancy
Adelaide.
Technology Park at Mawson Lakes has been earmarked for South
expansion with Raytheon and SAAB technologies both committed
West
to expansion in the area. Raytheon is expected to build a Centre
for joint Integration which will create over 350 jobs over 9 Inner North
years. SAAB technologies forecast a further 200 jobs due to the
Outer North
expansion of their Civil and Technologies business.
Total Market
Vacancy in the Inner North has increased slightly to 4.5 percent.
Rents have remained largely stable and range from $85/sqm 0.0% 1.0% 2.0% 3.0% 4.0% 5.0% 6.0% 7.0% 8.0%
to $120/sqm with incentives in the 10-15 per cent range. It is in 18-Mar 17-Sep 17-Mar
this market where significant new supply is expected due to the Source: Colliers International
submarine contract.
South
Tonsley continues to transform into a high tech manufacturing
and education precinct with Tonsley taking out ‘Delivered
Outcome – large scale’ in the Australian Urban Design Awards
in October 2017. SAGE automation has opened their facility in
September which is expected to employ 120 people and Ziess will
move tier operations from Lonsdale to Tonsley in April. Further
commitments have been made by modular construction groups
Smith Brothers group and Specialised solutions who have worked
collaboratively on several projects in the Adelaide CBD and plan
on expanding their workforces at Tonsley.
This precinct also encourages collaboration with one example
being Flinders University teaming with Festo to produce a 3ED
printed bionic handling assistant which is the latest robotic
technology and will drive high tech manufacturing efficiencies.
Further proposed developments at Tonsley include the Living
Laboratory Network which is aimed at testing products and
services for older Australians is currently seeking interest from
start-ups with active interest. 89 Cavan Road, Gepps Cross
Leased on behalf of M&G Holdings Pty Ltd
Industrial | Research & Forecast Report | First Half 2018 19Research &
Forecast Report
PERTH
Industrial | First Half 2018
By Quyen Quach strong absorption levels in buildings 2,000 sqm and over, during
Senior Research Analyst | Research 2017, with approximately 320,000 sqm of space absorbed.
quyen.quach@colliers.com Colliers’ analysis showed approximately 805,670 sqm of space
was on the market during March 2018, compared to 894,500 sqm
in January 2017.
MARKET HIGHLIGHTS
Vacancies in larger buildings (10,000 sqm and above) have
Confidence starting to return. declined from 6.6 per cent in January 2017 to 4.7 per cent in
March 2018. Vacancy for larger assets remained concentrated in
Enquiries rising. the South and East regions, where most of this stock is situated.
The East region has seen a reduction in large vacancies, falling
from a total of 110,740 sqm to 91,050 sqm. The South region, on
Developer activity is still subdued.
the other hand, has seen large vacancies increase from 104,965
sqm to 121,090 sqm over the past 12 months to March 2018.
Overview
Vacancy in assets 5,000-10,000 sqm fell to seven per cent, down
from nine per cent in January 2017. Approximately 23 per cent of
total vacancy is within this floorspace range.
WA mining is back
Vacancy in smaller industrial facilities (between 2,000 sqm and
Things are starting to look-up for Perth’s industrial sector. Over
5,000 sqm) also moderated, but only marginally to 14.5 per cent
the past 18 months, the mining sector has been gradually pumping
from 14.6 per cent in January 2017. Currently, 47 per cent of total
more capital into exploration spend, following around three years
vacant space above 2,000 sqm was in this floorspace range.
of contraction. This has increased business confidence and
employers are now on the hunt again. According the Department
Moderating vacancy see rents stabalise
of Jobs and Small business, employment ads have increased
Notwithstanding an estimated absorption of 320,000 sqm over
over the year to February 2018. Western Australia recorded the
2017, there is still a significant volume of space competing for
strongest growth, with a 14.8 per cent increase over the year.
tenants. There was also 195,000 sqm of new space added
Second was Northern Territory at 14.4 per cent, whilst NSW and
through 2017. Some of this supply was added speculatively and
Victoria registered increases of 8.6 per cent and 13.0 per cent,
hence are currently seeking tenants.
respectively.
Rents have tended towards stabilisation, although the recent
This recovery in exploration spend and job ads has started to
robust absorption is creating a back drop for future rental rate
flow through to reabsorption of industrial space vacated during
recovery. Average Perth metropolitan Prime warehouse rents
the downturn. Hence, vacancy looks to have peaked in 2017 and
generally ranged between $68.5/sqm and $85/sqm during the
has been trending lower through the year. This recovery may be
March 2018 quarter, which is unchanged from the December 2017
gradual, but sure enough it is happening.
quarter. Secondary rents were stable, at an average range of $55/
Perth’s industrial vacancy is now down to 8.2 per cent from 9.4 sqm to $75/sqm. Incentives have also been stable over the past
per cent in January 2017. Colliers market assessment showed six months at an average of 15 per cent.
20You can also read