Associated Estates (AEC) - Our View: Grossly Undervalued and Undermanaged
←
→
Page content transcription
If your browser does not render page correctly, please read the page content below

Associated Estates (AEC) – Our View:
           Grossly Undervalued
            and Undermanaged
                              Please email questions and comments to:
                              AEC-REALCHANGE@landandbuildings.com

Jonathan Litt
Craig Melcher
Corey Lorinsky
www.LandandBuildings.com                                                                                                                                            January 2015

                 This presentation is a research report and is for informational purposes only. Opinions expressed are solely those of Land and Buildings Investment Management
                 and this is not a recommendation to purchase securities discussed herein. Please refer to slide 60 for additional disclosures.
Table of Contents

 I. Introduction
 II. Southeast Florida Case Study
 III. Grossly Undervalued
 IV. Destroyed Value, Credibility and Trust – History of Poor
     Capital Allocation
 V. Worst of Both Worlds – High G&A and Low Performance
    Creates Opportunity
 VI. Real Opportunity to Become Best in Class REIT

                        Please email questions and comments to:
                        AEC-REALCHANGE@landandbuildings.com
I. Introduction

  Please email questions and comments to:
  AEC-REALCHANGE@landandbuildings.com

Land and Buildings Overview

• Firm Background
 › SEC-registered investment advisor founded in 2008 and located in Stamford, CT
 › Invests in the publicly traded shares of global REITs and real estate related companies

• Investment Strategy
 › Long-term investment horizon
 › Invest primarily in companies with discounted valuations and high growth that is likely to come in above
   expectations; In addition, invest in select value opportunities with catalysts for change
 › Own a concentrated portfolio based on extensive fundamental research
 › Aim to maintain and nurture constructive relationships with portfolio companies

• Investment Team
 › Jonathan Litt is the Founder and CIO of Land and Buildings. Prior to Land and Buildings, Jonathan Litt was
   Managing Director and Senior Global Real Estate Strategist at Citigroup where he was responsible for Global
   Property Investment Strategy from 2000 to March 2008. Jonathan Litt led the #1 Institutional Investor All American
   Real Estate Research Team for 8 years and was top ranked for 13 years while at Citigroup, PaineWebber and
   Salomon Brothers. Columbia BA, NYU MBA.
 › Craig Melcher, Co-Founder and Principal at Land and Buildings, was a key member of the top-ranked Citigroup
   REIT research team and has worked together with Jonathan Litt for 12 years. Wharton BS, NYU MBA.
 › Corey Lorinsky is Senior Analyst and Principal at Land and Buildings. Wharton BS.

                                            Please email questions and comments to:
                                            AEC-REALCHANGE@landandbuildings.com
Company Overview

• Associated Estates (NYSE: AEC): Owner and operator of 50 high quality apartment
  communities containing over 13,000 units across 9 states

                Portfolio Statistics                                                   Pro Forma (01/14/15)
                                                                           AEC Stock Information Asset Value by Market
         Communities/Units:      50 / 13,034
         Average Age:                          16 years
         Occupancy:                             95.4%
         Average Rent :                         $1,238

                 AEC Stock Information                                                           Portfolio Breakdown
         Last Price:              $24.98
         52-Week Range:                    $15.49 - 25.74
         Market Cap:                           $1.4B
         Dividend/Yield:                    $0.21 / 3.4%
         Enterprise Value:                     $2.2B

             Source: Land and Buildings estimates, Bloomberg, Company reports
             Notes: Occupancy, Monthly Property Revenue Per Occupied Unit (“Average
             Rent”) and Average Age are based on same community disclosures as of
             third quarter 2014; AEC stock information as of 01/23/2015; Pro forma asset
             values includes development pipeline projected asset values
Associated Estates (AEC): ~50% Upside with
  Significant Catalysts for Future Growth

                                                                     • Land and Buildings believes AEC has significant upside to the
                                                                       private market value of its assets and that this value can be
                                                                       unlocked through strategic changes at the Company

                                                                     • Grossly Undervalued and Undermanaged
                                                                        › AEC still trades at the largest discount to NAV in the apartment sector in
Fair Value with L&B Nominees1           $37/share
                                                                          spite of investor activism4
Current Share Price2                    $24.98/share
                                                                        › AEC has traded at a nearly 30% average discount to NAV over the
Upside with L&B Nominees                     49%
                                                                          trailing 10 years5 due, in our view, to operational underperformance,
Current Net Asset Value                  $31/share                        poor capital allocation decisions and other management missteps
Upside to Current NAV                        23%
                                                                        › AEC’s apartment portfolio is Class A quality with significant structural,
Share Price Prior to Activism3          $14.65/share
                                                                          market and sector-specific tailwinds
                                                                        › With L&B nominees in-place, outsized NAV/earnings growth opportunity
                                                                          given embedded NOI upside from operational improvements; Southeast
                                                                          Florida case study highlights such opportunity

                                                                     • Real Opportunity to Become Best in Class REIT
                                                                        › Land and Buildings intends to nominate seven independent, highly-
                                                                          qualified directors who have the skills to turn AEC into a best in class REIT
                                                                        › Blue-chip REITs have traded at an average 9.4% premium to NAV over
                                                                          the trailing 10 years, enhancing potential upside to AEC shareholders6

                            Image: http://www.cambridgeatbuckhead.com                                       4.   Land and Buildings estimate
                            1.  See slide 19 for additional details.                                        5.   Trailing 10 years defined on this slide: October 8, 2004 – October 3, 2014;
                            2.  Share price as of 01/23/15                                                       see slide 24 for additional details
                            3.  Defined as the last closing price prior to Kohlberg Kravis Roberts & Co’s   6.   Calculated by Land and Buildings using data provided by Green Street
                                (“KKR”) initial stake disclosure on November 14th, 2013                          Advisors; Blue-chip REITs defined as AVB, BXP, ESS, FRT, PLD, PSA, SPG
How Did We Get Here?

• History of operational underperformance and poor capital allocation
 › Stock below IPO price: AEC shares prior to investor activism were 33% below the November 1993
   IPO price of $22 and lagged proxy peers by over 250% over the trailing 20 years (or 700% including
   dividends)
 › Dividend cut in half: Dividend per share has fallen by more than 50% over the trailing 20 years
 › Sizable NOI underperformance: Property-level underperformance is stark relative to proxy peers in
   similar geographies and we believe is tied to an unsophisticated use of the revenue management
   system several of our Board members pioneered as well as a broken corporate culture
 › Worst 2014 growth: AEC is on pace to deliver the worst 2014 same-store revenue growth of their
   proxy peers, most likely due to mismanagement
 › Negative cash flow growth: FFO (funds from operations) per share has fallen 4% since 2008 as the
   Company more than tripled its share count through five massively dilutive equity issuances and
   excessively grew its G&A expense; Proxy peer FFO per share rose 26% over the same timeframe
 › Failure to buy back stock: Aggressive acquisition and development activity in lieu of buying back
   discounted stock has weighed on NAV per share growth

              Source: Land and Buildings estimates, Company reports
              Notes: Please see slides 17, 34, 38, 39 and 48 for additional details, including

              footnotes.                                        Please email questions and comments to:
                                                          AEC-REALCHANGE@landandbuildings.com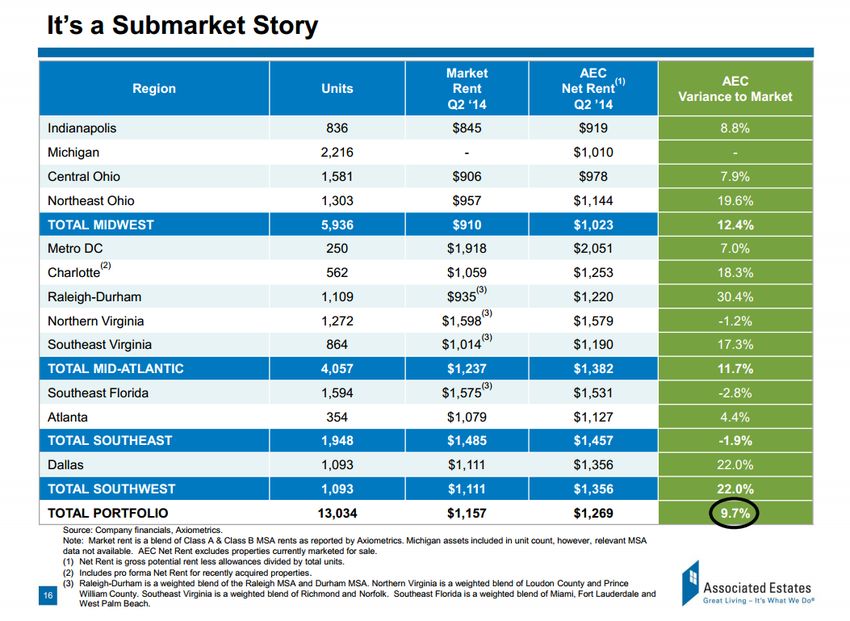
Strategic Plan: Creating a Best in Class REIT
Operations Capital Allocation Governance
Optimize NOI in-line with Re-assess all current and Install independent,
best practices that future external growth highly qualified Board of
several Board nominees activity Directors
pioneered1
Exploit arbitrage Eliminate conflicts of
Full operational review, between public and interest relating to family
including taking specific private real estate and personal
steps to maximize LRO2 markets relationships
revenue management
Create a differentiated Lift 4% ownership limit
Instill culture of Class A apartment REIT immediately
excellence1 by focusing in the core
markets and exploiting Explore strategic
Reduce bloated G&A market inefficiencies alternatives
1. Land and Buildings nominees have significant multifamily and other real
estate experience at leading public and private companies.
2. Rainmaker Lease Rent Options revenue management software
II. Southeast Florida Case Study

           Please email questions and comments to:
           AEC-REALCHANGE@landandbuildings.com
Southeast Florida Spotlight:
Blatant Undermanagement

• AEC’s 14% underperformance in Southeast Florida since 2011 confirms, in our view,
  that management is well below industry standards
• Land and Buildings’ deep-dive into AEC’s Southeast Florida assets revealed significant
  mismanagement of the top and bottom line
 › In our view:
  ―AEC is mispricing apartment leases due to an apparent unsophisticated use and understanding
   of the LRO revenue management system
  ―AEC is not utilizing optimal lease lengths and does not seem to understand seasonality
  ―AEC is providing unnecessary incentives and free rent
  ―AEC’s apartment assets are filthy and poorly maintained despite significant staffing
  ―AEC’s customer service is well below industry standards—in both leasing and maintenance

                                                               Same-Store NOI Growth
                                  Southeast FL                                2011 2012 2013 2014 Cumulative
                                  Associated Estates                           3.6% 2.8% 4.0% 5.5%   17%
                                  Proxy Peers                                  6.1% 7.8% 5.9% 8.2%   31%
                                   AEC Underperformance -2.5% -5.0% -1.9% -2.7%                      -14%

              Source: Land and Buildings estimates, Company reports
              Notes: Southeast FL peers are AIV (Miami), CPT (Southeast FL), EQR (South                        < 10 >
              Florida), HME (Southeast Florida), and MAA (South Florida); 2014 represents first
              three quarters
Smoking Gun: Apartment Leases Mispriced,
Dramatically Reducing NOI/Potential Growth
• AEC appears to us to be leaving significant money on the table in Southeast Florida
due to the organization’s mispricing of leases and misuse of LRO
› At 4 out 5 of AEC’s Southeast Florida assets, rents are lowest for 15-month leases
― 15 month leases should generally not be offered in an up-market—and should not be the least expensive
option given the Southeast Florida rental market is on fire (nearly 7% rental growth in 2014 alone, coupled with
high occupancies)
― Cheap 15 months leases leave revenue on the table that could be captured with higher rents and also impair
revenue at the asset by taking a longer time to roll and realize a rental increase, which are currently in the high
single-digits in the market
― 15 month leases signed in early 2014 will expire next summer, a seasonally slow period in Southeast Florida
› AEC’s Vista Lago asset is offering 3 month leases, which has been largely abandoned by leading
operators in Southeast Florida
― Estimated $1,000 in turn costs makes it difficult to maximize revenue with three-month leases, even with
significant rental premiums
― Florida hotel tax, applicable to short-term leases, deters most institutional operators from granting leases of
fewer than seven months
Source: Land and Buildings, Axiometrics
< 11 >
Please email questions and comments to:
AEC-REALCHANGE@landandbuildings.comThe Edge at Flagler Village:
Yield Likely Not Being Maximized
• The Edge at Flagler Village is an A+ asset in
lease-up in a red hot Fort Lauderdale market,
but AEC is bafflingly offering concessions
› One month free is available—which is highly
unusual for an operator properly utilizing LRO,
particularly in a market this hot
› AEC appears to be maximizing occupancy rather
than revenue and stabilized yield—a tradeoff that
boosts near-term FFO, but destroys longer term
value creation
Source: Land and Buildings, Company reports
< 12 >
Please email questions and comments to:
AEC-REALCHANGE@landandbuildings.comAEC Southeast Florida Assets:
Filthy and Poorly Maintained
• Waterstone at Wellington, a Class A high-end apartment asset in West Palm Beach, is
filthy and poorly maintained despite being well-staffed
› Mildew/fungus is evident across the property, including the windows and signage
› Parking lots and roofs look like they have not been cleaned in months
AEC Promotional Photos L&B Actual Photos
Source: Land and Buildings, Company reports
< 13 >
Please email questions and comments to:
AEC-REALCHANGE@landandbuildings.comAEC Southeast Florida Assets:
Filthy and Poorly Maintained (cont’d)
• Windsor Pines, a Class A asset in Broward County, in mid-January appears to be a
Christmas tree graveyard or supermarket parking lot as much as a high-end apartment
community
All visible from the
Dead Christmas Tree
leasing office
In front of
Should leasing office
have Sidewalk in door: concrete
been disrepair leading paint can
removed into leasing office
weeks remedy in
and throughout minutes
ago
marketing paths
Source: Land and Buildings
< 14 >
Please email questions and comments to:
AEC-REALCHANGE@landandbuildings.comAEC Southeast Florida Assets:
Filthy and Poorly Maintained (cont’d)
• Doral West, a B+ apartment asset in an A location near Miami, shows that dirty parking
lots and ragged signs appear to be an Associated Estates hallmark
Appears to be an unkempt & neglected asset Multiple signs with holes on the property
*Reminder that Miami is hardly a traditionally deciduous area
Source: Land and Buildings
< 15 >
Please email questions and comments to:
AEC-REALCHANGE@landandbuildings.comPoor Customer Service Evident
Across Southeast Florida Assets
• Filthy assets appear symptomatic of greater
operational issues and lack of customer focus that
Land and Buildings representatives encountered
during our on-site due diligence
› Long wait times were experienced in leasing offices
› No phone call follow-ups were received from any of the
leasing professionals at any of the Southeast Florida assets
following on-site visits by our interested lessee
› In addition to unkempt grounds, dirty hallways and broken
exercise equipment were routinely seen
› Were told maintenance requests are responded to within 48
hours, while industry norm is for issues to be fixed within 24
hours (something Archstone was doing over 15 years ago)
› Business centers with antiquated computers and fax
machines were used as selling points
› Employees demonstrated a general malaise rather than a
strong customer focus or service culture
Source: Land and Buildings
< 16 >
Please email questions and comments to:
AEC-REALCHANGE@landandbuildings.comData Supports Contention AEC is a Poor
Operator in Competitive Apartment Markets
• AEC has cumulatively underperformed its public peers net operating income growth
by 900bps since 2011 in overlapping geographies
› Atlanta and Southeast Florida have both been stand-out markets for apartment rental growth
since 2011, but Associated Estates has badly lagged its public peers, underperforming same-store
NOI growth cumulatively by 1,300bps and 1,400bps respectively
› In Washington DC and Northern Virginia, AEC’s portfolio has been more insulated against the
significant ramp up in new multifamily supply relative to inside the beltway focused peers, yet AEC
was not able to outperform despite this advantage
Cumulative Same-Store NOI Growth 2011 - 2014 YTD
Company Atlanta DC/Northern VA Southeast FL Average
Associated Estates 19% 14% 17% 17%
Proxy Peers 32% 14% 31% 26%
AEC
UNDERPERFORMANCE -13% 0% -14% -9%
Source: Land and Buildings estimates, Company reports Notes (cont’d): HME (Washington DC), PPS (Washington DC), & UDR (Metro
Notes: Proxy peer growth calculated using a straight average of annual same- DC); Southeast FL peers are AIV (Miami), CPT (Southeast FL), EQR (South < 17 >
store NOI and compounding growth. Atlanta peers are AIV, CPT, EQR, MAA & Florida), HME (Southeast Florida), and MAA (South Florida); 2014 represents first
PPS; DC/Northern VA peers are AIV (Washington - NoVa – MD), AVB three quarters
(Washington Metro), CPT (DC Metro), EQR (Washington DC),III. Grossly Undervalued
< 18 >
Please email questions and comments to:
AEC-REALCHANGE@landandbuildings.comAEC Net Asset Value: Significant Upside
• $37 Fair Value with L&B Board Nominees L&B Estimated Fair Value $37
Current Share Price $24.98
› Recovery of cumulative 900bps NOI Upside to Fair Value 49%
underperformance of past 4 years relative
Forw ard I n-Place Net Operating I ncome $120,962
to proxy peers in same geographies
Recovery of 900bps of Underperformance $10,887
› 10% blue-chip premium in-line with high- Stabilized Net Operating I ncome $131,848
quality traditional property REITs Applied Cap Rate 5.7%
Private Market Value of Properties $2,329,653
› 5.7% applied cap rate determined through
property due diligence in conjunction with Cash $99,399
Construction in Progress/Land $172,836
multifamily real estate brokers, private
Dev elopment Value Creation $148,872
investors and other third party consultants Other Assets $18,005
› Cap rate assumed is ~20bps lower than last Total Assets $2,768,765
published NAV estimate as boots on the
Debt ($729,324)
ground have discovered that cap rates Other Liabilities ($69,683)
have compressed further Total Liabilities ($799,007)
Net Asset Value $1,969,758
NAV with 10% Blue-Chip Premium $2,166,733
Common Shares/OP Units Outstanding 58,033
L&B Estimated Fair Value $37
Notes: Balance sheet data as of end of third quarter 2014; All numbers in Notes (cont’d): stabilized yield on $415 million of development spend, a 4.5%
thousands except per share and percentage figures; Forward In-place NOI is market cap rate and discounting the development profit to current dollars; < 19 >
3Q14 annualized and assumes 4% forward NOI growth, includes a 2.4% Next 12 months cash generation assumed to be $70 million
property management fee and deducts $250 of maintenance capex per unit;
“Development Value Creation” calculated by assuming a 6.4% averageAEC Fair Value Bridge
AEC Fair Value of $37 with L&B Board Nominees
$40 Fair Value with
L&B Nominees
$38 $37
$36
$3
$34 $6
AEC Achieves
Current NAV $3 10% Blue-Chip
$32 $31 Premium
Recovery of
$30 900bps NOI
Underperformance
$28
$26
$31 $31
$24
$22
$20
< 20 >
Please email questions and comments to:
AEC-REALCHANGE@landandbuildings.comAEC Apartments Merit a 5.7% Cap Rate
• AEC apartment portfolio is Class A quality and warrants a 5.7% cap rate
› L&B believes investors currently misunderstand the high quality and diverse geographic make-up
of AEC’s portfolio and therefore are not valuing it correctly in the public markets
Portfolio Breakdown
Market Units % of NOI Avg. Rent Age Grade Cap Rate
Virginia 2,136 21.2% $1,510 8 B+ 5.5%
Southeast Florida 1,594 14.2% $1,470 16 A- 5.3%
Michigan 2,216 13.4% $1,030 21 A- 7.0%
Cleveland 1,303 10.0% $1,250 19 A 6.4%
Raleigh-Durham 1,109 9.3% $1,211 7 A+ 4.8%
Columbus 1,581 9.3% $1,040 23 A 6.4%
Dallas 1,093 7.6% $1,206 10 A 5.3%
Indianapolis 836 4.8% $981 18 A 6.4%
Metro DC 250 3.5% $2,134 6 A- 4.6%
Charlotte 562 4.4% n/a n/a B+ 5.8%
Atlanta 354 2.3% $1,186 22 B+ 5.3%
Total 13,034 100% $1,238 16 A/A- 5.7%
Source: Land and Buildings estimates, Bloomberg, Company reports
Notes: All AEC asset cap rates and grades are Land and Buildings estimates; < 21 >
Occupancy, Monthly Property Revenue Per Occupied Unit (“Avg. Rent”) and
Average Age (“Age”) are based on same community disclosures as of third
quarter 2014CBRE: Class A Apartment
Cap Rates Rarely Exceed 6% Range
• CBRE private market cap rate transaction data from 1H14 shows a low cap rate
environment across all regions, including those seen as “non-core” by public investors
› Class A suburban multifamily assets across
Cleveland, Columbus and Detroit all generally CBRE Suburban Apartment Cap Rates AEC NOI
trade in 6’s, a fact likely not well understood by City Class A Exposure
public REIT investors Atlanta 5.00 - 5.50 2.3%
› Class A suburban multifamily assets across the Charlotte 5.00 - 5.25 4.4%
sunbelt, DC/Virginia and Southeast Florida Cleveland 6.75 - 7.00 10.0%
trade in the 5’s and 4’s Columbus 6.00 - 6.50 9.3%
Dallas 5.25 - 5.75 7.6%
› Gables, a TX/sunbelt and DC/VA-focused Class
Detroit 6.75 - 7.50 13.4%
A apartment portfolio, sold for $3.2 billion in
Indianapolis 6.00 - 6.50 4.8%
early January 2015 for a sub-5% cap rate
Miami 4.50 - 5.25 14.2%
› Cap rates have likely compressed by 25bps or Raleigh-Durham 5.00 - 5.25 9.3%
more since the first half of 2014 as supported by Washington DC/VA 4.75 - 5.75 24.7%
transactional data and L&B due diligence Weighted Average 5.8% 100%
― On January 23, 2015, Green Street Advisors1 lowered
its apartment cap rates ~25bps and increased
apartment NAVs 7%
Source: Land and Buildings estimates, Company reports, Wall Street Research, 1. Green Street Advisors has been an industry leader in real estate and REIT
CBRE Cap Rate Survey First Half 2014 research for over 25 years. Greenwich Associates rated Green Street < 22 >
Notes: CBRE cap rate ranges are based on an estimated NOI derived by Advisors #1 in five categories including first place in Best Industry
annualizing the last 90 days of revenue and subtracting buyer’s estimated Knowledge and Best Original Research for the last six years in a row.
stabilized year-one expenses after adjustments for real estate taxes & reserves.AEC Dispositions Highlight Value
• AEC dispositions of non-core assets display strong pricing
› AEC has disclosed a 5.4% weighted average cap rate on 2014 completed dispositions
› AEC’s public market valuation is wholly inconsistent with the low cap rates AEC is able to achieve
on the sales of some its non-core and least desired assets
Disposition Date Property Location Sales Price Cap Rate
16-Jun-14 Annen Woods Pikesville, MD $20,500 5.5%
28-Apr-14 Reflections Columbia, MD $38,400 5.7%
2-Apr-14 Vista Germantown Nashville, TN $53,250 4.5%
24-Feb-14 Hampton Point Silver Spings, MD $60,000 6.0%
Weighted Average year-to-date 2014 5.4%
Sources: Land and Buildings estimates, Company reports Notes (cont’d): Does not include dispositions under contract as of AEC’s third
Notes: Cap rates as disclosed by AEC; typically the Company discloses a quarter 2014 earnings conference call < 23 >
“market” cap rate which defines net operating income as the asset’s trailing
12 months performance, assuming a 3% management fee and adjusted for
marking to market real estate taxes;AEC Has Historically Traded at
an Average 28% Discount to NAV
• AEC has traded at an average 28% discount to NAV over the trailing 10 years
according to Green Street Advisors data analyzed by Land and Buildings
› For the last decade, it appears investors have voted against management with their feet
Source: Land and Buildings estimates, Green Street Advisors
Notes: Data range is October 8, 2004 through October 3, 2014 < 24 >
Please email questions and comments to:
AEC-REALCHANGE@landandbuildings.comAEC: Persistent Discount to Proxy Peers
• AEC has consistently traded at a discount to NAV while its proxy peers have traded
very close to NAV, according to Green Street Advisors data L&B analyzed
› AEC is a clear outlier, trading at the largest discount to NAV among its proxy peers across the
trailing 3 and 5 year periods
› Two other apartment REITs that traded at persistent discounts to NAV over similar time periods, BRE
Properties (NYSE: BRE) and Colonial Properties Trust (NYSE: CLP), were both acquired by
competitors in the past 18 months
Historical Premium/ Proxy Average Discount to
(Discount) to NAV AEC Peers Proxy Peers
Trailing 5 Years -20% 3% -23%
Trailing 3 Years -23% -3% -19%
Notes: Trailing 5 years defined as October 9, 2009 – October 3, 2014, trailing 3
years defined as October 3, 2011 – October 3, 2014; Trailing 10 years not shown < 25 >
given incomplete data set for proxy peers Please email questions and comments to:
AEC-REALCHANGE@landandbuildings.comAEC Apartment Markets:
Good Growth with Less Volatility
• Low cap rates in AEC markets justified by Effective Annualized Rental Growth
attractive risk-adjusted growth profile AEC Market Weighted Average National Average
3.5% 3.2% 3.2%
› AEC’s markets, on a weighted average basis,
3.0%
have achieved similar annual rental growth 2.5% 2.4%
2.2%
(+2.2%) as the national average (+2.4%) over 2.0%
the last 10 years with over 20% less volatility 1.5%
› Cleveland and Columbus, two of AEC’s least 1.0%
0.5%
favored markets by public investors, have
0.0%
exhibited roughly half the volatility in rental Trailing 10 Years Trailing 5 Years
growth as the national average while
averaging over 2% annual rental growth the
past decade, justifying low cap rates
› In 2009, AEC’s markets, on a weighted average
basis, only endured two-thirds of the rental
growth decline the national apartment market
suffered
Image: AEC September 2014 Investor Presentation
Sources: Axiometrics, Land and Buildings, Company reports < 26 >
Notes: Weighted average effective annualized rental growth for AEC’s
markets based on NOI exposures for in-place portfolio as shown on slide 5;
Data is through year-end 2014AEC Apartments Are Class A Quality, High
Rent and Amongst the Best in Their Submarkets
Source: Company reports
< 27 >
Please email questions and comments to:
AEC-REALCHANGE@landandbuildings.comAEC Apartment Markets Projected
to See Accelerating Rental Growth
• Axiometrics forecasts AEC’s apartment markets will see accelerating rental growth,
averaging 3.1% annual growth from 2015 – 2017, well above the trailing 10 year
average of 2.2%
Projected Market Rent Growth
% of Portfolio 3-Year
Market (by NOI) 2015 2016 2017 Average
Washington DC/Virginia 24.7% 1.9% 2.9% 4.5% 3.1%
Southeast Florida 14.2% 3.1% 3.1% 4.5% 3.6%
Michigan 13.4% 2.4% 1.8% 2.5% 2.3%
Cleveland 10.0% 2.1% 2.9% 3.5% 2.8%
Raleigh-Durham 9.3% 3.3% 3.6% 3.6% 3.5%
Columbus 9.3% 2.5% 3.0% 3.7% 3.1%
Dallas 7.6% 3.9% 3.2% 4.4% 3.8%
Indianapolis 4.8% 2.0% 2.9% 3.1% 2.7%
Charlotte 4.4% 3.2% 3.0% 3.9% 3.4%
Atlanta 2.3% 4.5% 3.2% 3.2% 3.7%
Portfolio Weighted Average 2.6% 2.9% 3.9% 3.1%
Source: Land and Buildings estimates, Axiometrics
< 28 >
Please email questions and comments to:
AEC-REALCHANGE@landandbuildings.comNational Apartment Rents are Surging,
Likely Causing Growth Forecasts to Rise
• National annual effective rent growth in December 2014 reached 4.9%, the strongest of
2014 and the highest since August 2011 – 41 months ago – when the rate was 5.0%
› Bucking normal seasonality: December was a 21bps increase from November's 4.7%, which is
notable because the end of the year is usually when rental growth begins to decelerate
Source: Axiometrics
< 29 >
Please email questions and comments to:
AEC-REALCHANGE@landandbuildings.comApartment Supply Growth in AEC
Markets Below National Average
• Apartment supply growth in AEC Apartment Supply Growth as % of Inventory
Market 2014 2015 2016 2017 AEC % of NOI
markets meaningfully below United District of Columbia 0.7% 0.7% 0.7% 0.7% 24.7%
Miami 0.8% 2.8% 3.3% 2.2% 14.2%
States average
Detroit 0.1% 0.2% 0.6% 0.8% 13.4%
› AEC markets are forecasted to Cleveland 1.7% 1.7% 1.7% 1.7% 10.0%
Raleigh-Durham 5.7% 3.9% 2.3% 2.4% 9.3%
experience10% less annual multifamily
Columbus 0.9% 0.9% 0.9% 0.9% 9.3%
supply growth as a percent of existing Dallas 3.1% 3.1% 1.6% 1.2% 7.6%
stock than the national average Indianapolis 1.6% 1.6% 0.9% 1.3% 4.8%
Charlotte 4.6% 5.4% 2.1% 2.1% 4.4%
› Supply growth is anticipated to peak in
Atlanta 1.5% 2.0% 1.9% 1.6% 2.3%
2015, leading to a likely acceleration in AEC Composite 1.6% 1.8% 1.5% 1.3% 100.0%
market rent growth United States 1.8% 2.1% 1.6% 1.5%
AEC Composite United States
2.5%
2.1%
Apartment Supply Growth
2.0% 1.8% 1.8%
1.6%
1.5% 1.6%
as % of Inventory
1.5%
1.5% 1.3%
1.0%
0.5%
0.0%
2014 2015 2016 2017
Source: Land and Buildings estimates, REIS
< 30 >
Please email questions and comments to:
AEC-REALCHANGE@landandbuildings.com“Renter Nation” to Benefit Apartment Owners
• Low homeownership rates appear Homeownership Rate Continues to Decline
70%
structural as well as cyclical as renter
69%
lifestyle is preferred by younger 68%
generations 67%
66%
› Renting can allow for greater freedom of
65%
movement and the ability to live in
64%
locations with better amenities and
social/cultural opportunities
• Apartments likely to benefit Household Formation Growth Poised to Spike
disproportionately from an increase in 2,500
the number of households as younger 2,000
800,000 Average YoY Change in
cohorts drive the growth 1,500
Quarterly Household Formations
1,000
› The average year-over-year increase in
household formations is 800,000 over the 500
trailing 10 years versus the 500,000 growth 0
300,000 Below Trend Since 1Q13
experienced since the first quarter of 2013
Source: Land and Buildings estimates, US Census Survey, Evercore ISI
< 31 >
Please email questions and comments to:
AEC-REALCHANGE@landandbuildings.comHousing Shortage of ~750,000 Annually
• Harvard estimates demand for 1.6 - 1.9 million homes annually between 2015-20251
• Shortfall of ~750,000 homes annually at current pace of housing starts
• Apartment shortfall: multifamily starts at ~350,000 annually are 30% below necessary
500,0002 units
Harvard University Study of Components of New Home Demand 2015 - 2025
Low Immigration High Immigration
Thousands ('000) Projection Projection
Projected Household Growth 11,620 13,200
Increase in Structural Vacancy 1,440 1,627
Projected Total Estimated Net Removals 3,250 3,250
Projected Total Demand for New Units 16,442 18,702
Average Annual New Home Demand 1,644 1,870
Current Pace of Annual New Home Construction3 990 990
4
Current Pace of Annual Underbuilding (654) (880)
Source: Land and Buildings estimates, U.S. Census Bureau, Joint Center for 3. US Census figure for 2014 through November
Housing Studies at Harvard University 2009 and 2014 reports 4. Land and Buildings estimate combining Harvard projections and US Census < 32 >
1. Joint Center for Housing Studies of Harvard University figures
2. Based on historical ratio of 29% of multifamily (for rent and for sale) starts
relative to total housing starts from 1965 through 2014IV. Destroyed Value, Credibility and
Trust – History of Poor Capital
Allocation
< 33 >
Please email questions and comments to:
AEC-REALCHANGE@landandbuildings.comAEC: 20 Years of Material
Share Underperformance
• AEC’s share returns are significantly below proxy peers
› Over the past 20 years AEC’s total return including dividends has lagged proxy peers by nearly
700% and its share price return has lagged proxy peers by over 250%1
› AEC shares prior to investor activism were 33% below its November 1993 IPO price of $222
AEC Proxy Peers
400
Share Price Indexed to 100
Share Price Returns 350
300
Trailing Since Investor
250
20 Years Activism 200
Associated Estates -32% 71% 150
AEC Underperformance 100
vs. Proxy Peer Average -256% 29% 50
0
1994
1995
1996
1997
1998
1999
2000
2001
2002
2003
2004
2005
2006
2007
2008
2009
2010
2011
2012
2013
• Dividend per share has been slashed by over 50% since 1995
› AEC’s dividend per share has declined by 54% since 1995, while peers saw their dividends per
share more than triple3
Source: Land and Buildings estimates, Company reports, Bloomberg 2. Defined as share price of $14.65 on November 14th, 2013, the last closing
Notes: “Since investor activism” share price returns through 01/23/15 price prior to Kohlberg Kravis Roberts & Co’s (“KKR”) initial stake disclosure < 34 >
1. Trailing 20 years defined as July 29, 1994 – November 14, 2013 to reflect a 3. Dividends per share paid in 1995 compared to dividends per share paid
start date to capture the completion of several proxy peer IPOs in 2014Negative “Management Value Added”
Score Highlights Poor Capital Allocation
• AEC is the lowest scoring apartment REIT in Green Street Advisors’ “Management Value
Added” metric over the last 7 years1
› From June 2006 through June 2013, AEC’s NAV growth underperformed the levered appreciation
of the company’s properties by 2,100bps based on Green Street Advisors’ analysis, which we
believe highlights the Company’s poor capital allocation history
› “CEOs…must make capital allocation decisions, a critical job that they may have never tackled and that is not easily mastered…The lack
of skill that many CEOs have at capital allocation is no small matter: After ten years on the job, a CEO whose company annually retains
earnings equal to 10% of net worth will have been responsible for the deployment of more than 60% of all the capital at work in the
business. ”
― Warren Buffett, Letter To the Shareholders of Berkshire Hathaway Inc., February 1988
Notes: Green Street Advisors defines Management Value Added as the 1. Green Street Advisors October 2014 research note, “AEC Company
difference between NAV per share growth and the leveraged growth Update” < 35 >
in same-store portfolio value over any time period. MVA measures value
added or subtracted via balance sheet management, capital-allocation or
other factors not related to the performance of the real estate portfolio.Destroying Value and Credibility: Five Equity
Offerings at Large Discounts to NAV
• AEC has issued large blocks of new common equity five times since January 2010
› AEC issued over $450 million of equity at a 22% average discount to Green Street’s AEC NAV
› These issuances were highly dilutive to the net real estate value of the company
Equity Issuance Date Shares Issued (000's) Issuance Price Discount to NAV
January 12, 2010 5,175 $11.10 -31%
May 6, 2010 9,200 $13.00 -15%
September 28, 2010 9,200 $13.60 -15%
June 22, 2012 6,325 $14.40 -33%
May 29, 2013 7,048 $17.25 -23%
Weighted Average Discount to NAV -22%
• After 3 value-destroying equity raises in 2010, the CEO stated AEC would not issue more
equity until the stock traded closer to NAV and then issued equity in 2012 and 2013 at
steep discounts to NAV
› “We don’t need to issue equity and we won’t until our stock price is more reflective of NAV.”
― Chief Executive Officer and Chairman of Associated Estates, Fourth Quarter 2010 Earnings Conference Call
Image: http://www.flickr.com/photos/purpleslog/3040508093/in/photostream/
Notes: Discounts to net asset value estimated by Land and Buildings through < 36 >
analysis of data provided by Green Street AdvisorsDestroying Trust: May 2013 Equity
Issuance Raises Serious Questions
• AEC lowered growth and earnings guidance less than 2 months
after issuing forward equity
› On May 29, 2013, AEC issued over 7 million shares of forward common
equity in a secondary offering and raised over $120 million that would be
settled no later than October 1, 2013
› Less than two months later in AEC’s July 23, 2013 second quarter earnings
release, AEC lowered guidance for numerous growth measures
― 2013 same community revenue growth guidance was reduced from 4.0% – 5.0% to 3.25% – 3.75%
― 2013 same community NOI growth guidance was reduced from 5.25% – 6.25% to 4.75% – 5.25%
― 2013 FFO per share guidance was reduced by 2.3% at the midpoint
› The market and those participating in the equity offering were likely unaware of any deteriorating
AEC fundamentals at the time of the forward equity raise
› “So you raised equity on a forward basis rather than doing a spot deal for proceeds to be used to pay down
debt. That was coming due later in the year, right? It was a little bit odd, I would say, at least to do that. And then
taking to the fact that your fundamentals are weaker than expected and you sort of have inkling of that in late
May, clearly the Street and your stock is underperforming and is down a lot. When you sort of put those two
together, then one can be very skeptical of how things have transpired.”
― Michael Bilerman, Managing Director of Real Estate and Lodging Research at Citi, Second Quarter 2013 Earnings Conference Call
Source: Land and Buildings, Company reports, Bloomberg
< 37 >
Please email questions and comments to:
AEC-REALCHANGE@landandbuildings.comAEC: Five Equity Offerings
and No Earnings Growth
• AEC’s share count growth has far outpaced its earnings per share growth
› Since 2008, AEC’s weighted average diluted share count has grown 257% while the company’s
FFO (funds from operations) per share growth is -4%, a stark contrast
Cumulative Share Count Growth Cumulative FFO/share Growth
300%
250% 257%
221%
200%
186%
150% 156%
100%
87%
50%
0% 0 2%
-4%
2008 2009 2010 2011 2012 2013 2014
-50% -12% -33% -23% -5% -5%
Source: Land and Buildings estimates, Company reports, Bloomberg
Notes: Weighted average diluted AEC shares for 2014 are through third quarter < 38 >
2014; FFO per share adjusted for known non-core items; 2014 FFO per share
represents midpoint of AEC company guidanceAEC: NOI Growth NOT Translating
to Cash Flow Growth
• Poor capital allocation decisions have deprived shareholders of cash flow growth
› Despite comparable same-store NOI growth as peers since 2008, dilutive equity raises,
disproportionally high G&A costs and, in our view, other management missteps actually caused
FFO per share to decline
AEC Proxy Peers
30%
26%
25%
20%
2008 - 2014 growth
20% 19%
15%
10%
5%
0%
-5%
-4%
Cumulative same-store NOI growth FFO per share growth
Source: Land and Buildings estimates, Company reports, Bloomberg
Notes: Same-store NOI growth is through third quarter 2014; FFO per share < 39 >
growth is through midpoint of 2014 company guidancePaying Full Price in the Private Market
When AEC’s Own Portfolio Is On Sale
• Poor capital allocation: Why was AEC buying 5.5% cap
rate apartment assets in the private market when AEC
stock was trading at an 8%+ implied cap rate?
› On September 23, 2013, AEC announced it had entered into a
definitive purchase agreement with respect to a seven-asset
$324 million portfolio of Class-A apartment communities
located in the Southeast and Mid-Atlantic at a blended
nominal cap rate of 5.5% on year one stabilized net operating
income
› Concurrently, AEC announced it would fund the acquisition
with property dispositions
› Buying back stock with disposition proceeds would have
created significant value for shareholders
―If AEC had sold $300 million of assets and repurchased $150
million worth of stock at the $15 share price the stock traded
at the time of the announcement, the buybacks would have
been nearly 10% accretive to NAV
Image: http://becuo.com/retail-sale-signs
Source: Land and Buildings estimates, Company reports
< 40 >
Please email questions and comments to:
AEC-REALCHANGE@landandbuildings.comAEC: Large Development
Pipeline Weighing on Shares
• Investors likely skeptical of AEC
development value creation
› AEC currently carries a development
pipeline requiring ~$400 million of spend or
~20% of enterprise value, the largest of
AEC’s proxy peer group
› Over 50% of the development pipeline by
cost is in California, a high-barrier to entry,
low cap rate market that AEC has no
current exposure to
―The CEO has stated1 the company would
like 20% exposure to California, indicating
west coast investment is likely to continue
› A history of perceived poor capital allocation is likely amplifying investor worries surrounding
successful execution
› Potential management missteps, including rising construction costs, are likely to be masked by
continued robust market rent growth in coastal California
Image: Associated Estates September 2014 Investor Presentation
Source: Company reports < 41 >
1. Associated Estates second quarter 2013 earnings conference callV. Worst of Both Worlds – High G&A
and Low Performance Creates
Opportunity
< 42 >
Please email questions and comments to:
AEC-REALCHANGE@landandbuildings.comAEC: Outsized G&A and Excessive
Compensation Relative to Peers
• AEC’s general and administrative expenses (G&A), including executive compensation,
are outsized relative to peers on a variety of measures
› AEC’s G&A as a percent of revenue is nearly 11% vs. the proxy peer average of 4%
― All nine of AEC’s proxy peers were below 6% on this measure, showing AEC is a clear outlier
› AEC’s G&A relative to enterprise value is ~3 times higher than proxy peers (1.1% vs. 0.4%)
› Executive compensation is a significant driver of the heavy G&A load, as AEC’s top 5 executives are paid nearly
5% of revenue vs. 1.4% for peers and CEO compensation is more than 4 times larger than peers as a percent of
revenue (2.1% vs. 0.5%) and 50% higher than similarly sized REITs on average across all sectors1
― All nine of AEC’s proxy peer’s top 5 executive compensation as a percent of revenue were less than half of AEC
― All nine of AEC’s proxy peer CEOs were paid below 1% of company revenue; AEC’s CEO was highly
compensated at $3.8 million in 2013 given the size of his company and the substantial and sustained discount to
NAV the company trades at
G&A as a % of G&A as a % of Top 5 Executive Comp CEO Compensation as
Company Revenue 1 Enterprise Value 2 as a % of Revenue 3 a % of Revenue 4
Associated Estates (AEC) 10.7% 1.1% 4.9% 2.1%
Proxy Peers 4.0% 0.4% 1.4% 0.5%
AEC Underperformance
vs. Peers -6.7% -0.7% -3.5% -1.6%
Source: Company reports, Bloomberg 1. Similarly sized REITs defined as those US REITs between $1.5 to $2.5 billion in
Notes: Data based on 2013 results and compensation; Enterprise value data enterprise value as of December 31, 2013 < 43 >
as of December 31, 2013; “Revenue” is total company revenueAEC G&A Has Grown Significantly
• G&A expenses continue to grow, potentially benefiting management at the expense of
shareholders despite statements by management that AEC will become more efficient
› “Well, as it relates to G&A, we believe we operate very thin in that G&A as a percentage of our property revenue
will come down as we grow.”
― Chief Financial Officer of Associated Estates, Second Quarter 2011 Earnings Conference Call
› “The way we look at G&A is that we believe the overall investment is necessary to do all the things that we want to
do and we really think it's a function of scale. And so the way we bring that 11% down is by growing the top line
property revenue, not only from our same-store portfolio but from any acquisitions that we're able to do here in
2010 and going forward.”
― Chief Financial Officer of Associated Estates, First Quarter 2010 Earnings Conference Call
AEC G&A as a % of Revenue AEC G&A Expense
12.0% $25,000
G&A as a % of Revenue
10.0% $20,000
G&A Expense (000s)
8.0%
$15,000
6.0%
$10,000
4.0%
2.0% $5,000
0.0% $0
2002 2003 2004 2005 2006 2007 2008 2009 2010 2011 2012 2013
Source: Land and Buildings estimates, Company reports, Bloomberg
Notes: “Revenue” is total company revenue
< 44 >
Please email questions and comments to:
AEC-REALCHANGE@landandbuildings.comAEC G&A Expense Ratios Continued
to Grow While Peer Ratios Improved
• AEC G&A expense as a percent of revenue has kept growing while peers have
become more efficient
2011 2012 2013
12%
10.7%
9.7%
10%
9.1%
G&A as a % of Revenue
8%
6%
4.7% 4.5%
4.0%
4%
2%
0%
AEC Proxy Peers
Source: Company reports, Bloomberg
Notes: “Revenue” is total company revenue
< 45 >
Please email questions and comments to:
AEC-REALCHANGE@landandbuildings.comAEC Management Consistently
Missing Own Expectations
• As apartment fundamentals soared since 2009, AEC still frequently lowered guidance
and missed expectations
› The past six years, AEC actual annual FFO/share has missed initial guidance by -0.9% on average
› Annual FFO per share results have only beat initial guidance in one of the past six years
› Over the same time period, AEC’s public apartment peers were routinely beating and raising
guidance as multifamily fundamentals were generally much stronger than initial expectations
› 2014 was a "miss and lower" year as funds from operations (“FFO”) per share and core same-store
growth guidance were both lowered despite year-to-date national apartment rental growth
being stronger than in any other post-recession year; AEC once again missed consensus FFO
expectations in the third quarter of 2014
Fiscal Intial FFO per share Actual FFO % (Below)/Above
Year Guidance Midpoint per share Guidance
2014 $1.29 $1.28 -0.8%
2013 $1.31 $1.27 -3.1%
2012 $1.25 $1.27 1.6%
2011 $1.04 $1.03 -1.0%
2010 $0.89 $0.89 0.0%
2009 $1.20 $1.17 -2.5%
Average Guidance Miss -0.9%
Source: Land and Buildings estimates, Company reports, Axiometrics,
Bloomberg < 46 >
Notes: FFO per share adjusted for known non-core items; 2014 FFO per share
represents midpoint of AEC company guidanceAEC Mismanaged LRO Revenue
Management Implementation
• AEC saw no visible “pop” from LRO revenue
management rollout
› According to Rainmaker, owner of LRO, apartment
operators typically experience 400 – 700bps of
additional revenue growth in the initial 24 months
following a completed implementation
―For example, Post Properties (NYSE: PPS), a high quality sunbelt focused apartment REIT, saw
an immediate additional 200bps in revenue growth solely from LRO implementation
o “Pricing was on our competitor’s radar so it needed to be on our radar,” explains Post vice president
of IT Janet Ham. “We had immediate revenue lift of 2% driving Post to deploy portfolio wide…”1
› AEC appears to manage LRO in-house without the use of an expert, a similar mistake as BRE
Properties
• Not only was implementation lackluster, it was also unjustifiably late
› AEC finished the roll out of LRO revenue management in the first quarter of 20122, years after
most other public apartment REITs
• Archstone-Smith pioneered the LRO revenue management system
Source: Company reports, Rainmaker
1. http://www.letitrain.com/multifamily-housing-product-suite/case- < 47 >
studies/post-properties
2. AEC first quarter 2012 earnings conference call, April 25, 2012AEC: On Pace to Deliver the Worst
Revenue Growth of Peers in 2014
• Not only has management consistently missed own growth expectations, AEC is now
on pace to deliver the worst same-store revenue growth of their proxy peers
Associated Estates 2014 Same-Store Revenue Guidance
Worst Among Proxy Peers Following Guidance Reduction
Source: Company reports, Bloomberg
Notes: Data based on 2014 Company proxy peer guidance as of third quarter < 48 >
2014 earnings releases; bar represents guidance range for each company
and the midpoint is providedAEC: Already Lowered Expectations for 2015
• AEC appears to be laying the groundwork for an underwhelming 2015
› 2014 initial same-store revenue growth guidance was 3.25% at the midpoint
› 2Q14 earnings Conference Call: “…we would expect 2015 revenue particularly to be better than
2014”
― Chief Executive Officer and Chairman of Associated Estates
› 3Q14 Earnings Conference Call: “…we would expect a revenue growth to equal or exceed the
revenue growth from 2014…those of us with exposure in less dynamic markets or even in markets
like the Mid-Atlantic, we would be impacted somewhat...So if I had to give a big range that
would probably – at the midpoint of that range would probably be 3% or better.”
― Chief Executive Officer and Chairman of Associated Estates
Source: Company reports. Bloomberg
< 49 >
Please email questions and comments to:
AEC-REALCHANGE@landandbuildings.comVI. Real Opportunity to Become Best
in Class REIT
< 50 >
Please email questions and comments to:
AEC-REALCHANGE@landandbuildings.comREITs Particularly Well Suited for Change
• REITs generally own a collection of homogeneous and “hard” assets, allowing for a
unique set of circumstances
› Significant recurring revenue means little to no operational disruption should occur when board or
management turnover occurs
› All or a portion of a REIT’s assets can be acquired or merged into another real estate company
with significant synergies (e.g. reduced G&A expense) and without the large integration costs and
complications normally associated with M&A in operational companies with intangible assets
• Value and relative underperformance can be easily identified
› Real estate has a large and liquid private transaction market allowing investors to readily identify
dislocations between private and public market valuations
› REITs’ relative ability to maximize property-level net operating income growth can be directly
measured against peers
› REITs’ ability to drive net asset value per share growth can be directly measured against the
appreciation in the private market of asset values
› REIT capital allocation decisions drive a significant percentage of the differences in
premiums/discounts relative to NAV per share and stock price performance over time
< 51 >
Please email questions and comments to:
AEC-REALCHANGE@landandbuildings.comLand and Buildings AEC Board Nominees
• Land and Buildings proposes to make AEC’s Board stronger
› Land and Buildings has nominated seven independent, highly-experienced, high integrity
individuals who want to take a fresh look at the best ways to create value for stockholders at AEC
› These nominees bring a track record of operational excellence, capital allocation expertise,
shareholder value maximization and/or investment expertise across the apartment REIT, broader
REIT and corporate universe
› Land and Buildings’ nominees intend to restore shareholder trust, earn back credibility and create
significant value for stakeholders
› Land and Buildings believes that a vote for AEC’s directors is a vote for the status quo – the status
quo may be best for the entrenched Board and management, but in our opinion is unacceptable
for stockholders
< 52 >
Please email questions and comments to:
AEC-REALCHANGE@landandbuildings.comLand and Buildings AEC Board Nominees
• Land and Buildings AEC Board Nominees
› Marcus E. Bromley – Former public multifamily REIT CEO and Chairman at Gables Residential Trust
› Michael J. DeMarco – Former investment banker and public office REIT executive at Vornado
Realty Trust (NYSE: VNO)
› Charles M. Elson – Professor and leading authority on corporate governance
› Dana K. Hamilton – Former public multifamily REIT EVP of Operations at Archstone-Smith Trust
› Gregory F. Hughes – Former public REIT CFO at SL Green (NYSE: SLG) with experience across
numerous real estate sectors
› Jonathan Litt – Founder/CIO of Land and Buildings and former top-ranked sell-side REIT analyst
› R. Scot Sellers – Former public multifamily REIT CEO and CIO at Archstone-Smith Trust
< 53 >
Please email questions and comments to:
AEC-REALCHANGE@landandbuildings.comWall Street Reactions to Land and Buildings
Nominees Have Been Very Favorable
• Green Street Advisors Research Note (11/17/14)
› “…seven highly-reputable independent directors…Scot Sellers’ presence is noteworthy as he is
regarded as one of the top apartment executives in the country.”
• Citigroup Research Note (11/17/14)
› “…we do believe L&B’s slate would be well received by investors…We are impressed with the
proposed Board slate and believe that their public company, operational, capital allocation, and
corporate governance experience would benefit AEC shareholders. We believe that the
proposed Board would be able to help close the persistent discount to NAV.”
• Sandler O’Neil Research Note (12/10/14)
› “We believe AEC shareholders will elect the proposed Board given the candidates are highly
qualified and have ample public market and REIT experience. Two of the notable nominees
include Scot Sellers (former ASN CEO) and Michael DeMarco (former REIT banker and VNO
executive) who are both highly regarded within the REIT world.”
Source: Wall Street Research
< 54 >
Please email questions and comments to:
AEC-REALCHANGE@landandbuildings.comLand and Buildings AEC Board Nominees
Marcus E. Bromley – Former public multifamily REIT CEO and Chairman at Gables Residential Trust
Marc Bromley has over 30 years of experience in the real estate industry ranging from his roles in finance and development in
the private sector to his role as CEO and director of large public real estate companies. Mr. Bromley served as CEO and
Chairman of the Board of Gables Residential Trust (NYSE: GBP) from its IPO in 1993 to his retirement in 2001. He continued to
serve on the $3 billion company’s board until its sale in late 2005. Prior to taking Gables public in 1993, Mr. Bromley was a
division partner for Trammell Crow Residential. His division was a leading developer of apartment communities in the
Southeast from 1982 to 1993. Mr. Bromley served as a Director of three Cole Property Trust companies based in Phoenix,
Arizona. Mr. Bromley also serves on the board of directors of The Shoptaw Group (TSG), a multifamily operation based in
Atlanta. He is a member of the Advisory Board of Nancy Creek Capital, a private equity firm in Atlanta. In the past, Marc
Bromley has served on the Advisory Board for the School of Commerce, Economics and Politics for Washington & Lee
University. Mr. Bromley is a 1971 Graduate of Washington & Lee University with a degree in Economics and a 1973 graduate of
the University of North Carolina a where he received his MBA degree.
Michael J. DeMarco – Former investment banker and public office REIT executive at Vornado Realty Trust
Michael DeMarco has over 25 years of experience in the real estate industry. He was most recently the Chief Investment
Officer of CCRE, a non-bank finance company and one the largest originators of CMBS. Mr. DeMarco was also an Executive
Vice President with Vornado Realty Trust from 2010 to 2013. Prior to that Mr. DeMarco was a Partner at Fortress Investment from
2007 to 2010, overseeing on a direct basis a number of real estate operating companies that Fortress acquired. Additionally,
he was a senior Managing Director with Lehman Brothers from 1993 to 2007 in the company’s real estate investment banking
unit specializing in Mergers and acquisitions, structured finance, and initial public offerings. Mr. DeMarco’s client list included:
Simon Property Group, Vornado Realty Trust, SL Green, Douglas Emment, the Rouse Company and many others. Mr. DeMarco
started his career at First Boston as an investment banker in 1987 after graduating from the University of Chicago with an MBA
in Finance. Mr. DeMarco graduated from Pace University with BBA in Accounting and a minor in History. He is also a Certified
Public Accountant.
< 55 >
Please email questions and comments to:
AEC-REALCHANGE@landandbuildings.comLand and Buildings AEC Board Nominees
Charles M. Elson – Professor and leading authority on corporate governance
Charles M. Elson is the Edgar S. Woolard, Jr., Chair in Corporate Governance and the Director of the John L. Weinberg Center
for Corporate Governance at the University of Delaware. He is also "Of Counsel" to the law firm of Holland & Knight. He
formerly served as a Professor of Law at Stetson University College of Law in St. Petersburg, Florida from 1990 until 2001. His
fields of expertise include corporations, securities regulation and corporate governance. He is a graduate of Harvard College
and the University of Virginia Law School, and has served as a law clerk to Judges J. Harvie Wilkinson III and Elbert P. Tuttle of
the United States Court of Appeals for the Fourth and Eleventh Circuits. He has been a Visiting Professor at the University of
Illinois College Of Law, the Cornell Law School, and the University of Maryland School of Law, and was a Salvatori Fellow at the
Heritage Foundation in Washington, D.C. and is a member of the American Law Institute. Professor Elson has written
extensively on the subject of boards of directors. He is a frequent contributor on corporate governance issues to various
scholarly and popular publications. He served on the National Association of Corporate Directors' Commissions on Director
Compensation, Director Professionalism, CEO Succession, Audit Committees, Strategic Planning, Director Evaluation, Risk
Governance, Effective Lead Director, and Board Diversity and was a member of its Best Practices Council on Coping With
Fraud and Other Illegal Activity. He served as well on that organization’s Advisory Council. He is Vice Chairman of the ABA
Business Law Section’s Committee on Corporate Governance and was a member of its Committee on Corporate Laws. He is
presently a member of the Board of Directors of HealthSouth Corporation, a healthcare services provider and Bob Evans
Farms Inc., a restaurant and food products company.
Dana K. Hamilton – Former public multifamily REIT EVP of Operations at Archstone-Smith Trust
Dana Hamilton was a key member of the management team that grew Archstone from $100 million in residential real estate
assets to more than $20 billion—and into an industry-leading owner and operator of apartments in the United States and
abroad. She was President-Europe and a member of the Executive Committee from May 2005 until February 2013, and
Executive Vice President national Operations and a member of the Executive Committee from May 2001 until May 2005. Ms.
Hamilton oversaw many industry first’s during her nearly 20 years at Archstone. She is credited with promoting “Archstone,” the
first national brand in the multifamily industry, and spearheading the development of online leasing, outcomes-based credit
scoring and highly sophisticated revenue management—all of which have subsequently become industry standards. In 2005,
she took Archstone to Europe, helping to pave the way for massive industry change in the German residential market. A
graduate of Stanford University, Dana Hamilton received her MBA from the University of California, Berkeley. Ms. Hamilton is a
member of the World Presidents Organization, Urban Land Institute and Golden Seeds.
< 56 >
Please email questions and comments to:
AEC-REALCHANGE@landandbuildings.comYou can also read