WiseTech Global 1H20 Results Investor briefing materials February 2020 - Empowering and enabling the logistics industry globally
←
→
Page content transcription
If your browser does not render page correctly, please read the page content below
Empowering and enabling the
logistics industry globally

 WiseTech Global 1H20 Results
 Investor briefing materials February 2020

Important notice and disclaimer
Content of presentation for information purposes only

                                                                                                                    Preparation of information
Visit wisetechglobal.com/investors                                                                                  All financial information has been prepared and reviewed in accordance with Australian Accounting
                                                                                                                    Standards. Certain financial data included in this presentation is ‘non-IFRS financial information’. The
Forward-looking statements                                                                                          Company believes that this non-IFRS financial information provides useful insight in measuring the
This presentation may contain statements that are, or may be deemed to be, forward-looking                          financial performance and condition of WiseTech Global. Readers are cautioned not to place undue
statements. Such statements can generally be identified by the use of words such as 'may', 'will',                  reliance on any non-IFRS financial information including ratios included in this presentation.
'expect', 'intend', 'plan', 'estimate', 'anticipate', 'believe', 'continue', 'objectives', 'outlook', 'guidance‘,
‘forecast’ and similar expressions. Indications of plans, strategies, management objectives, sales and              Presentation of information
financial performance are also forward-looking statements.                                                          •   The financial data in this presentation is provided on a statutory basis but in a non-statutory
                                                                                                                        presentation format (unless otherwise stated).
Such statements are not guarantees of future performance, and involve known and unknown risks,
                                                                                                                    •   Pro forma (PF) Where indicated, financial measures for periods prior to FY17 are provided on a pro
uncertainties, assumptions, contingencies and other factors, many of which are outside the control of
                                                                                                                        forma basis. Information on the specific pro forma adjustments is disclosed on page 116 of
WiseTech Global. No representation is made or will be made that any forward-looking statements will
                                                                                                                        WiseTech Global’s 2019 Annual Report.
be achieved or will prove to be correct. Readers are cautioned not to place undue reliance on forward-
                                                                                                                    •   Currency All amounts in this presentation are in Australian dollars unless otherwise stated.
looking statements and WiseTech Global assumes no obligation to update such statements.
                                                                                                                    •   FY refers to the full year to 30 June, 1H refers to the six months to 31 December, and 2H refers to
No representation or warranty, expressed or implied, is made as to the accuracy, reliability, adequacy                  the six months to 30 June.
or completeness of the information contained in this presentation.                                                  •   Rounding Amounts in this presentation have been rounded to the nearest $0.1m. Any differences
                                                                                                                        between this presentation and the accompanying financial statements are due to rounding.
Past performance                                                                                                        Amounts shown as "-" represent zero amounts and amounts less than $50,000 which have been
Past performance information in this presentation is given for illustrative purposes only and should not                rounded down.
be relied upon as (and is not) an indication of future performance.
                                                                                                                    Third party information and market data
Information is not advice                                                                                           The views expressed in this presentation contain information that has been derived from publicly
This presentation is not, and is not intended to constitute, financial advice, or an offer or an invitation,        available sources that have not been independently verified. No representation or warranty is made as
solicitation or recommendation to acquire or sell WiseTech Global shares or any other financial                     to the accuracy, reliability, adequacy or completeness of the information. This presentation should not
products in any jurisdiction and is not a prospectus, product disclosure statement, disclosure                      be relied upon as a recommendation or forecast by WiseTech Global. Market share information is
document or other offering document under Australian law or any other law. This presentation also                   based on management estimates except where explicitly identified.
does not form the basis of any contract or commitment to sell or apply for securities in WiseTech
Global or any of its subsidiaries. It is for information purposes only.                                             No liability or responsibility
                                                                                                                    The information in this presentation is provided in summary form and is therefore not necessarily
WiseTech Global does not warrant or represent that the information in this presentation is free from
                                                                                                                    complete.
errors, omissions or misrepresentations or is suitable for your intended use. The information contained
in this presentation has been prepared without taking account of any person’s investment objectives,                To the maximum extent permitted by law, WiseTech Global and each of its subsidiaries, affiliates,
financial situation or particular needs and nothing contained in this presentation constitutes                      directors, employees, officers, partners, agents and advisers and any other person involved in the
investment, legal, tax or other advice. The information provided in this presentation may not be                    preparation of this presentation disclaim all liability and responsibility (including without limitation, any
suitable for your specific needs and should not be relied upon by you in substitution of you obtaining              liability arising from fault or negligence) for any direct or indirect loss or damage which may arise or be
independent advice. Subject to any terms implied by law and which cannot be excluded, WiseTech                      suffered through use or reliance on anything contained in, or omitted from, this presentation. WiseTech
Global accepts no responsibility for any loss, damage, cost or expense (whether direct or indirect)                 Global accepts no responsibility or obligation to inform you of any matter arising or coming to its notice,
incurred by you as a result of any error in, omission from or misrepresentation in this presentation.               after the date of this presentation, which may affect any matter referred to in this presentation. This
                                                                                                                    presentation should be read in conjunction with WiseTech Global’s other periodic and continuous
                                                                                                                    disclosure announcements lodged with the ASX.
2       © 2020 WiseTech Global
3 © 2020 WiseTech Global

Our technology is used by the world’s logistics providers across 150+ countries

     15,000+
 logistics organisations
globally are customers(1)

        150+
        countries(2)

      2,000+
    valued employees(4)
     across 60+ offices

    50+ billion
 data transactions in
CargoWise annually(3)

    4+ million
    development hours
     over two decades

                                1. Includes customers on CargoWise and platforms of acquired businesses whose customers may be counted with reference to installed sites.
                                2. Countries in which CargoWise is licensed for use for 1H20.
                                3. Data transactions for FY19, transactions measured at 30 June annually.
4      © 2020 WiseTech Global   4. Includes acquisitions announced or completed to 18 February 2020.
CargoWise… operating system for global logistics
Strong foundation for future technology, seamless rollout, scalable capacity, global solutions

                                                                           ✓   scalable to any size of business
                                                                           ✓   global reach ~150 countries
                                                                           ✓   deeply integrated with real-time visibility
                                                                           ✓   reduces risks, costs and data entry
                                                                           ✓   detailed compliance
                                                                           ✓   30 languages
                                                                           ✓   data entered only once
                                                                           ✓   automations and delegations
                                                                           ✓   built-in productivity tools
                                                                           ✓   On-Demand/transaction-based licensing
                                                                           ✓   global data sets and execution engines
                                                                           ✓   swift on-boarding, efficient sales process
                                                                           ✓   open-access, cloud enabled
           Relentless platform expansion with ~700 enhancements annually   ✓   available anywhere, anytime

 5
40 of the top 50 global third party logistics providers(1)
                              use our solutions across 150+ countries worldwide,
                                               34 use CargoWise.

                             DHL

6   © 2020 WiseTech Global
                                     1. Armstrong & Associates: Top 50 Global Third Party Logistics Providers List ranked by 2018 logistics gross revenue/turnover. Armstrong & Associates: Top 25 Global Freight Forwarders List ranked by 2018
                                     logistics gross revenue/turnover and freight forwarding volumes.
25 of the top 25 global freight forwarders
use our solutions across 150+ countries worldwide,
                 23 use CargoWise.
                                                                                                                                                                                8 of the top 25 global freight
    DHL                                                                                                                                                                         forwarders(1) use CargoWise in
                                                                                                                                                                                global forwarding rollout
                                                                                                                                                                                exclusively – or are rolling out -
                                                                                                                                                                                including the world’s largest.
                                                                                                                                                                                “We have chosen the CargoWise One single platform software
                                                                                                                                                                                solution which fully responds to our needs and ambitions. This
                                                                                                                                                                                new tool will gradually replace all of our existing TMS software.”

                                                                                                                                                                                CEO of Bolloré Logistics,
                                                                                                                                                                                Thierry Ehrenbogen(2)

                                                                                                                                                                                “…CargoWise One is the foundation of everything. We need a
                                                                                                                                                                                strong TMS system, and this TMS system will then give us the
                                                                                                                                                                                opportunity to work also with automation, will give us better
                                                                                                                                                                                data accuracy and end-to-end shipment process, ownership and
                                                                                                                                                                                we'll gradually harmonize our processes.”

                                                                                                                                                                                DHLGF, Capital Markets Day - Nov 2019

7   © 2020 WiseTech Global   1. Armstrong & Associates: Top 50 Global Third Party Logistics Providers List ranked by 2018 logistics gross revenue/turnover. Armstrong & Associates: Top 25 Global Freight Forwarders List ranked by 2018 logistics gross
                             revenue/turnover and freight forwarding volumes.
                             2. Lloyds Loading List article 4 Dec 2018.
1H20
performance,
 delivery on
strategy and
  financial
   results

8   © 2020 WiseTech Global
WiseTech Global financial highlights
Delivered significant, high quality growth while expanding technology lead and global footprint
SIGNIFICANT HIGH recurring LOW HIGH innovation LOW sales and PROFITABLE high
revenue HIGH quality customer product development marketing EBITDA margin +
growth revenue attrition investment expense cash generative
99% recurring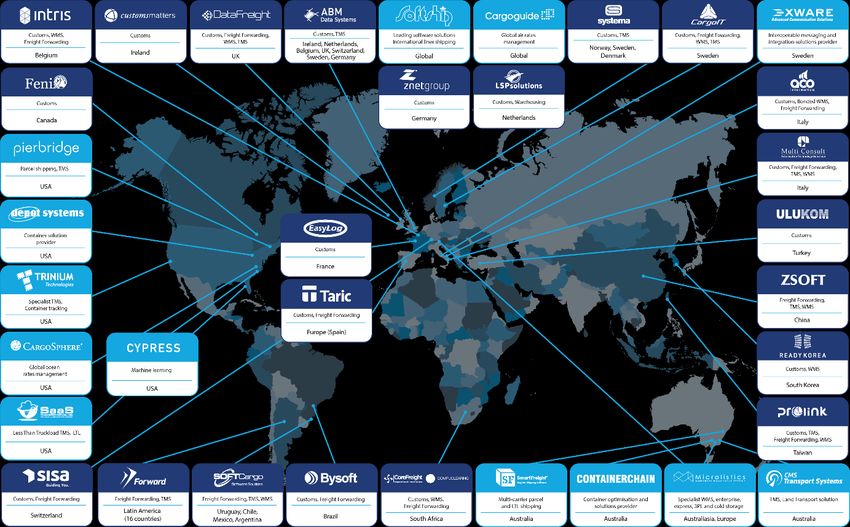
Delivered on strategy – significant progress in 1H20
Focus on expanding market leadership and investing to grow
+ + +
Innovation and expansion of Greater usage by Increase new customers Stimulate Strategic acquisitions: securing
our global platform existing customers on the platform network effects resources and market entry(4)
✓ Delivered 450+ product upgrades ✓ Existing customers’ revenue grew ✓ Continuing wins in multi- ✓ Over 280 CargoWise ✓ Across 30+ strategic assets,
and enhancements(1) to $17.0m in 1H20, and provided 70% region and mid-size Partner organisations progressed multi-year product
CargoWise platform in 1H20 of CargoWise revenue growth in including Green Worldwide now referring, promoting and technology builds, along
1H20 Shipping, Shanghai Coil or implementing our with commercial foundation
✓ Investment in expanding core Dragon and PT Yamato platform development and localisations
platform – scaling, functionality, ✓ Made significant progress in global Indonesia ✓ Over 3,700 new CCLP
productivity and performance rollouts for DHLGF, DSV with ✓ Added 500+ technologist and
Panalpina and Bollore – driving ✓ In 2020 signed new multi- certifications completed in
✓ Accelerating development industry experts since FY19
seat growth across global year FF and customs global 1H20 – total of over
capability across over 35 rollout with Aramex 19,000 practitioners ✓ Global customs/geo foothold
development centres CargoWise platform
✓ Acquisitions expanding ✓ Now 48 independent 1. Ready Korea (South Korea)
✓ Built more technology assets in ✓ 40 of top 50 global 3PLs(3) are 2. SISA (Switzerland)
network effect – bringing industry partner networks
pipeline of initiatives, with focus customers – early penetration
customers to CW ahead of
on: ✓ All top 25 global freight ✓ Invested in updating ✓ Technology adjacencies
new product build
forwarders(3) are customers, 23 channel program, content 3. Depot Systems (container
• Global customs capability ✓ Select acquired assets architecture and global
now use CargoWise yard & terminal solutions)
• Machine learning, natural gained new customer wins, brand rollout (to launch 4. Cypress (early-stage
language processing and ✓ Each cohort of CW customers grew supported global customers in 2H20) machine-learning
data robotics revenue in 1H20 and, while in transition,
specific solutions are being ✓ We can also now access classification)
• Global data sets and ✓ Diversified revenue further: top 10 ~15,000 customers across
adopted by global ✓ Added to pipeline for Asia
enterprise engines customers are 19% of revenue the WiseTech group
customers e.g. rates opportunities plus technology
(1H19: 25%), no single customer
• Regulatory upgrades management adjacencies in landside logistics
>5%
• Next-generation accounting and platform components
• CargoWise neo (Nexus)
1. From FY19, the ‘product upgrades and enhancements’ count includes global plus specialised enhancements and upgrades specific to an individual region.
2. Total investment in product development and innovation includes both expensed and capitalised amounts each year spent on product development and innovation, patents and purchased external software licences used in our products.
3. Armstrong & Associates: Top 50 Global Third Party Logistics Providers List ranked by 2018 logistics gross revenue/turnover. Armstrong & Associates: Top 25 Global Freight Forwarders List ranked by 2018 logistics gross revenue/turnover and freight forwarding volumes.
4. Including acquisitions announced or completed to 18 February 2020.
10 © 2020 WiseTech GlobalStrong growth in revenue continues
Significant high quality revenue growth while focusing on innovation and global expansion
Revenue
$m 348.3 1H20 revenue
+31%
vs 1H19
191.6
221.6
205.9 +43%
CAGR 1H16 – 1H20
153.8
128.2
102.8 82.7 Full year revenue (FY13 and FY14),
70.0 2H revenue (FY15 – FY19)
54.2 156.7
56.7
43.0 1H revenue (FY15 – FY20)
37.7 93.4
71.1
56.7 48.6
43.0 32.3
FY13 FY14 FY15 FY16 FY17 FY18 FY19 1H20
11 © 2020 WiseTech GlobalCargoWise organic revenue growth – all cohorts grew revenue in 1H20
Expanding penetration… more users, modules and transactions
• CargoWise continues
significant growth during CargoWise revenue by customer cohort
240
extensive business $m, last 12 months
transformation, licence
conversions, development 220
and pilot programs
200
• All CargoWise cohorts
grew revenue in 1H20
180
• Diversified revenue
drivers of CargoWise
transactions and seats 160
resilient through
additional industry 140
headwinds in 2019 trade
wars (US China, US
120
Europe) and geo-political
uncertainty (Brexit)
100
80
60
40
20
0
Dec-15 Jun-16 Dec-16 Jun-17 Dec-17 Jun-18 Dec-18 Jun-19 Dec-19
FY06 & prior FY07 FY08 FY09 FY10 FY11 FY12 FY13 FY14 FY15 FY16 FY17 FY18 FY19 FY20
12 © 2020 WiseTech GlobalGlobal rollouts increasing – larger players rolling out, grow more valuable over time
Powerful network effect, exponential growth in transactions, revenue over long term
Top 25 global freight Top 25 global freight forwarder 23 of the top 25 global freight forwarders
The world’s top 25 global freight forwarder logistics gross freight forwarding volume use CargoWise
forwarders continue to expand in revenue (A$bn)
scale – collectively they move 27
million ocean TEUs + 16 million air 347
30
metric tons of the industry each 27
year with revenues ~A$350bn(1).
15 16
314
2017 2018 2017 2018
Ocean (mil TEUs) Air (mil metric tons)
CargoWise has 10 freight forwarders with full global FF rollout (e.g. DSV) or in process of rolling out (e.g. DHLGF), however we are still in early penetration.
DSV (UTi, Panalpina)
DHL Global Forwarding
Yusen Logistics
TOLL
BOLLORE Logistics
GEODIS (OHL)
Mainfreight
JAS Forwarding
Rohlig Logistics
NEW GLOBAL ROLLOUT SIGNED 2020
Aramex
13 © 2020 WiseTech Global 1. Armstrong & Associates: Top 50 Global Third Party Logistics Providers List ranked by 2018 logistics gross revenue/turnover. Armstrong & Associates: Top 25 Global Freight Forwarders List ranked by 2018
logistics gross revenue/turnover and freight forwarding volumes.CargoWise organic revenue strength and EBITDA efficiency continues
Drivers of CargoWise Organic Revenue
Increased usage across our existing CargoWise
customer base, Organic CargoWise revenue, EBITDA(1) and EBITDA margin
as existing customers use more – i.e.
($m)
• add transactions
• open up in new sites
• start to use more modules and features
• use new products and features 49% 49%
50%
• expand to more geographies 46%
• extend to global rollouts 140
45%
• add automations to increase transaction
throughput
• add more users 120 126.5 40%
• consolidate their acquisitions onto the platform
35%
100
Revenue movements from customers that have 102.3 30%
transitioned from (static) temporary pricing
arrangements (+/-) 80
25%
Customer take up of behavioural discounts (+/-)
60
71.7 20%
Customer consolidation of other companies they
acquire 62.5
15%
New customers adding users to the platform in single 40 49.7
site, multi-region or full global rollout
10%
Trade patterns, trade volumes (+/-) 32.8
20
Measured price changes related to new product 5%
additions or CPI adjustment
0 0%
Launch of new product/features to the platform:
commercialised then monetised through transaction 1H18 1H19 1H20
charges or in seat licence
Revenue EBITDA EBITDA margin
See Appendix slide 49-50
1. If AASB 16 Leases had been applied in 1H19 this would have increased reported EBITDA by $3m.
14 © 2020 WiseTech GlobalSignificant total 1H20 revenue growth of 31%
Strong CargoWise growth with impact of large volume of strategic acquisitions
• Powerful revenue growth of 31% in
challenging logistics industry
environment Revenue
• Organic revenues from our existing
and new CargoWise customers
$m
delivered 49% of our total revenue 0.4 205.9
growth over 1H19, driven by:
Increase from
• increased usage across our 22.6 3 acquisitions in 1H20
existing customer base, 1.9
• new customers rolling on, and
Increase from
Growth from 23
• new product/features launch
24.3 acquisitions in FY18 &
full period impact of
79.3
156.7 prior
14 acquisitions in
FY19
• 24% organic growth yoy on
CargoWise revenue. Generally, CargoWise growth
organic CargoWise revenue tends to existing & new
grow roughly 20 – 30% each year CargoWise
54.4 customers(1)
• CargoWise revenue can contain
large static components on which
organic growth does not occur e.g.
fixed or transitionary pricing
• Growth from acquired businesses
was primarily driven by the full
period impact of FY19 acquisitions
• Revenue from acquired businesses
We expect revenue growth from 126.5
acquisitions to remain flat or
negative during business model
102.3
transition as they build out the
commercial foundation toward
WiseTech Global efficiencies and
growth rates
1H19 Organic Acquisitions
Total revenueFY18 Acquisitions
FX impact yoy: $4.6mFY19 Acquisitions 1H20 1H20
& Prior
CargoWise revenue from existing and new customers Revenue from all the acquisitions since 2012 and not embedded into CargoWise
1. Growth from new CargoWise customers is revenue growth from CargoWise platform customers won in the current financial year and the previous two financial years.
15 © 2020 WiseTech GlobalStrong growth in total revenue and EBITDA
Strong CargoWise revenue growth, high CargoWise EBITDA margin, while building out our platform
• 31% revenue growth vs
1H19, reflecting both
strong CargoWise growth
and impact of acquisition
of strategic assets that lay Revenue
solid foundations for
EBITDA(1) 49%
future organic growth $m CargoWise $m CargoWise
99% recurring 49% 49% EBITDA margin(2)
• 99% recurring revenue revenue
46%
from CargoWise 100.0
• Recurring revenue 90%
overall, predominantly 34%
reflecting the different
business models of recent
205.9 31% 30%
80.0
acquisitions which have
higher OTL and support EBITDA margin
services CargoWise EBITDA
156.7 margin(2)
• 49% CargoWise EBITDA 60.0
margin, reflecting
continued improvement in
CargoWise efficiency – up
significantly from 30% in
FY16 PF 40.0
93.4 90%
• 29% EBITDA growth vs 62.5
1H19, strong profit growth 89%
48.5
20.0
94%
31.8
-
1H18 1H19 1H20 1H18 1H19 1H20
Recurring revenue Non-recurring revenue EBITDA
1. If AASB 16 Leases had been applied in 1H19 this would have increased reported EBITDA by $3m.
2. CargoWise EBITDA margin excluded acquisitions since 2012 not embedded into CargoWise and included M&A costs.
16 © 2020 WiseTech GlobalLicensing model – On-Demand removes constraints to growth
Focus on pay for usage, revenue benefits from transition of customers to On-Demand licensing
• Excluding acquisitions, CargoWise
has achieved 99% recurring revenue,
with 99% revenue from customers
on On-Demand licensing
Revenue by licence type
% of total revenue
• We have proven skills in licensing
transformation with well-established
processes – ensuring minimal
attrition and building transaction
revenue
On-Demand licensing
On-Demand
73%
MUL STL (recurring)
82%
74%
Module User Seat/Transaction 99%
Customers pay on a per Customers pay a fee per
user, per month basis registered user, per month +
fee per transaction
16% 16%
OTL maintenance
(recurring) 12%
OTL & support 11%
services 6% 10% 1%
1H18 1H19 1H20 1H20*
* CargoWise only.
17 © 2020 WiseTech GlobalLicensing model – transformation ongoing
Transitioning pre-existing MUL to more sustainable STL progressed rapidly in 1H20
• We have well-proven expertise
in customer licence transition Revenue by licence type
withStrong financial position and disciplined use of capital 19 © 2020 WiseTech Global
Financial summary
 Significant growth in revenue and earnings reflects strength of business and execution on strategy

        $m                                                                                     1H18                                   1H19                                   1H20
                                                                                                                                                                                                                Change
                                                                                                                                                                                                                (vs 1H19)
        Total revenue                                                                           93.4                                  156.7                                  205.9                                  +31%

        Gross profit                                                                            79.4                                  129.0                                  169.4                                  +31%

        Gross profit margin                                                                     85%                                    82%                                    82%                                         -

        Total operating expenses                                                              (47.6)                                 (80.4)                                (106.9)                                  +33%

        EBITDA(1)                                                                               31.8                                   48.5                                   62.5                                  +29%

        EBITDA margin                                                                           34%                                    31%                                    30%                                   (1)pp
        Net profit
        attributable to equity holders                                                          15.6                                   23.1                                   59.9                                 +160%
        of the parent
        NPATA(2)                                                                                16.8                                   27.5                                   33.5                                    22%
        Basic earnings per share
                                                                                                 5.3                                     7.6                                  18.8                                  147%
        (cents)
       1. If AASB 16 Leases had been applied in 1H19 this would have increased reported EBITDA by $3m.
       2. Net profit after tax attributable to equity holders of the parent before acquired amortisation net of tax, contingent consideration interest unwind net of tax and fair value changes on contingent consideration.

20   © 2020 WiseTech Global
Operating expenses
Scaling to support relentless innovation, geographic expansion and business growth
Operating expenses focused on
strategic levers: Product design & development
Gross profit margin
• Innovation, product development % of total revenue
and maintenance of our global
platform and expansion and 86% 85% 20% 20%
82% 82% 19%
retention of our skilled 18%
development workforce
• Increased PD&D expense with new
acquisitions which typically have
higher levels of maintenance and
support charges
• Increased S&M expense to amplify
brand, support new product
launches and marketing in new $14.3m $17.2m $31.2m $38.3m
geographies and adjacencies
• G&A expense reflects increased 1H17 1H18 1H19 1H20 1H17 1H18 1H19 1H20
investment to support acquisition
management teams and additional
headcount in corporate functions Sales & marketing General & administration
for global growth % of total revenue % of total revenue
14% 22%
Trends:
21% 20% 19%
• Investment in R&D to increase in $ 11% 11%
10%
terms, but in the longer term will
benefit from operating leverage
• Sales and marketing as % of
revenue to remain at 10% – 15%
• General and administration also
includes M&A costs and acquired
G&A, over time, as a % of revenue $6.9m $10.4m $18.1m $28.8m $15.8m $20.0m $31.2m $39.8m
expect to be more efficient, below
20% 1H17 1H18 1H19 1H20 1H17 1H18 1H19 1H20
21 © 2020 WiseTech GlobalInvestment in innovation and product development
Continued high investment in R&D, every $ and every hour build out our technology
• 1H20 $73.3m invested in R&D
• 450+ product upgrades and Investment in innovation and product development
enhancements in 1H20 across the
CargoWise platform
$m
• 43% increase yoy R&D spend 40% 37% 36%
reflects growth in the innovation 33% Total R&D % of total revenue
35%
pipeline of commercialisable
development (e.g. customs 30%
modules in new countries, 25% 80.0
international logistics products, 20%
73.3
cargo chain solutions),
15% 70.0
acquisitions, and additional
investment in industry experts 10%
and skilled software developers 5%
• We expense maintenance, fixes, 0% 60.0
and research that cannot be 51.2 35.0 48% Capitalised
capitalised
50.0
• Proportion of R&D investment
capitalised broadly in range 40%
– 50% 20.1
40.0
• $368m invested in R&D and 34.3
innovation in last 5 years driving
our platform leadership 30.0
• See Appendix for more detail on 17.1
capitalised development
approach and comparatives 20.0 38.3 52% Expensed
31.2
10.0
17.2
-
1H18 1H19 1H20
22 © 2020 WiseTech GlobalIntangibles: significant technology assets for commercialisation
Building commercialisable and monetisable assets for future growth
Intangible assets and tangible assets at period end ($m)
844.6
783.7
650.8
360.3 346.9 361.2
241.2
176.9
106.6 111.9
1H18 2H18 1H19 2H19 1H20
Total intangible assets Total tangible assets
23 © 2020 WiseTech Global
Source: 1. Exchange differences are not separately shown in the chart (1H19: $0.0m, 2H19: $0.3m, 1H20: $0.1m).
https://ipcloseup.com/2019/06/04/21-trillion-in-u-s-intangible-asset-value-is-84-of-sp-500-value-ip-rights-and-reputation-included/Cash flow profile
Increasing operating and free cash flow
• Strong operating performance
delivered continuing increase
Operating cash flow
in operating cash flow
$m 1H18 1H19 1H20 $m
• Continued high conversion of 69.7
EBITDA into operating cash EBITDA 31.8 48.5 62.5
flow
Non-cash items in EBITDA 2.8 3.2 6.8 51.4
• Non-cash items in EBITDA
mainly reflect share-
based payments Change in working capital (4.2) (0.4) 0.4
30.4
• Continued expenditure on
Operating cash flow 30.4 51.4 69.7
development and innovation
• $33.0m capitalised
development investment
(see Appendix) Capitalised development
(15.9) (18.3) (33.0)
• Other net capital expenditure investment(1) 1H18 1H19 1H20
mainly reflects cost related
with data centre additions Other net capital expenditure (2.6) (2.4) (8.7)
Net cash at period end 232.5
and office facilities for growth $m
in employees Free cash flow 11.9 30.7 28.0
108.8
Key operating metrics
57.7
Operating cash flow
96% 106% 111% 11.6
conversion ratio
-12.6
Free cash flow conversion ratio 37% 63% 45%
1H16 1H17 1H18 1H19 1H20
1. Includes expenditure on patents and purchased external software licences used in our products. Net cash is cash and cash equivalents minus total borrowings.
24 © 2020 WiseTech GlobalCash flow movement
• Healthy inflows of $218.6m
from customers
• Main cash outflows
Operations Financing Invest to grow
comprise:
• $148.9m of payments to
suppliers and employees
• Investments in future
$39.2m related to the
acquisition of strategic
assets and $33.0m cash
cost of capitalised
developments, resulting
in a closing cash balance
of $233.1m
Opening Receipts Payments Income Interest Interest Dividends Other Purchase Payments Acquisition Closing
cash from to suppliers tax received paid paid financing of for of cash
balance customers and paid activities property, intangible businesses balance
employees and plant and assets
exchange equipment
differences
25 © 2020 WiseTech GlobalSummary statement of financial position
Solid capital position to drive further strategic growth
• Strong balance sheet and healthy
cash generation to support growth $m 30 June 2019 31 December 2019
and strategic initiatives Current assets
• Further funding alternatives in Cash and cash equivalents 260.1 233.1
place, including share issuance to Trade receivables 50.8 45.1
acquisition sellers and undrawn Other current assets 13.0 15.1
debt facility of $190m (with $200m Total current assets 323.9 293.3
accordion) Non-current assets
• Decrease in cash and cash Intangible assets 783.7 844.6
equivalents mainly reflected Property, plant and equipment 15.8 59.8
acquisition payments and Other non-current assets 7.3 8.0
investment in capitalised Total non-current assets 806.8 912.5
development, partly offset by cash Total assets 1,130.6 1,205.8
from operating activities Current liabilities
• Increase in intangible assets Trade and other payables 35.2 33.8
reflects acquisition goodwill and Borrowings 0.2 0.2
continuing product investments Lease liabilities 0.2 11.3
Deferred revenue 19.0 14.1
• Increase in property, plant and
Other current liabilities 114.4 131.7
equipment primarily due to first-
Total current liabilities 169.0 191.2
time adoption of AASB 16
Non-current liabilities
• Other current and non-current Borrowings 0.5 0.4
liabilities mainly include contingent Lease liabilities 0.2 31.7
earnouts for strategic acquisitions Deferred tax liabilities 33.7 33.3
• Interim dividend declared, fully- Other non-current liabilities 160.6 119.1
franked, 1.70 cents per share with Total non-current liabilities 195.0 184.5
up to $5.4m payable in April 2020 Total liabilities 364.1 375.7
Net assets 766.6 830.1
Equity
Share capital 668.5 669.5
Reserves (25.7) (2.3)
Retained earnings 123.8 162.9
Non-controlling interests - -
Total equity 766.6 830.1
26 © 2020 WiseTech GlobalInvesting
to grow
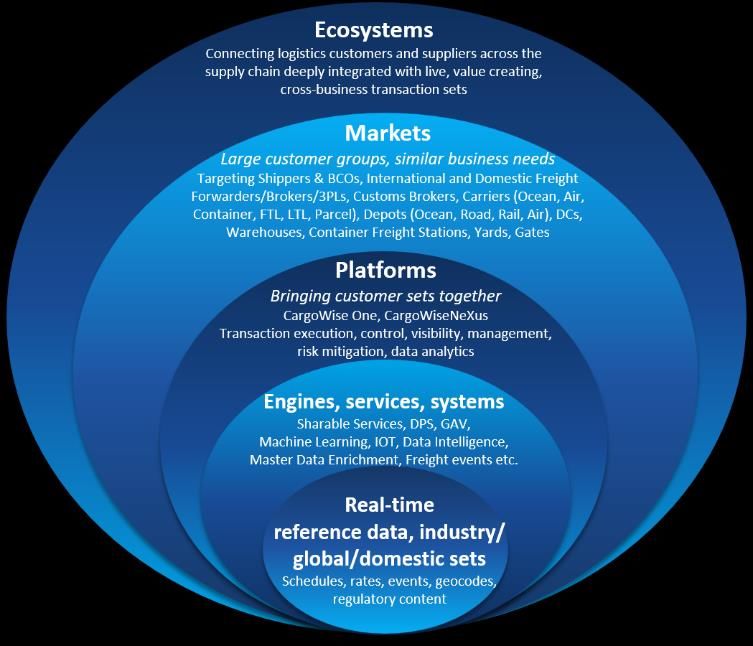
27 © 2020 WiseTech GlobalWidening our reach, building the operating system for ecosystem
Expanding global
CargoWise platform
Expanding technology to
new addressable markets
Expanding platform to
Operating System (neo)
Expanding commercial
foundation to new
geo-markets
Transforming content
architectures, channel
development, brand assets
Growing R&D speed,
quality and capacity
28 © 2020 WiseTech GlobalIncreasing investment in relentless innovation
Significant pipeline of longer-term innovations across existing verticals and new adjacencies
450+
product upgrades and
enhancements in 1H20
36%
of revenue invested in
innovation in 1H20
49%
employees focus on
product development
>805,000
unit tests executed
every 45 mins
$368m
invested in last 5 years
29 © 2020 WiseTech GlobalIncreasing investment in relentless innovation
Significant pipeline of longer-term innovations across existing verticals and new adjacencies
Extending CargoWise Cargo chain Trade and border International Landside logistics CargoWise neo
One functionality ecosystem compliance ecosystem Ecommerce and land transport
• Gateway Ops and billing • Across border, at
• Product/new • Next-gen • Secured Depot Technology suite to
• Global Air and Sea border and in-country
components/new international Systems asset connect users of
Schedules compliance
modules/Enterprise ecommerce with bringing together logistics services
layer capabilities • Container Events • Global Accounting
shipper portal, with Containerchain • On track for beta
• Cargo Vessel Tracking consolidation and and Trinium on
and Tax compliance launch end
• Data sets, engines, events deconsolidation depots, yards and
architecture – 2020 calendar 2020
compute components launched in Australia container
• Air Waybill Tracking focus on complex tax • Working protypes
and NZ optimisation
reporting economies for digital
• Machine learning, • Aircraft Avionics and real • Netherlands next
in EU and LATAM • Transit Warehouse forwarding portal,
guided decision- time tracking focus
making, automations, (GLOW based) Schedules, Quotes,
• Predictive ETA and Carrier • Further Customs • Launching origin released to 6 Beta Booking, Tracking,
performance reporting integrations and depot 2H20
• Spatial technology, customers and Invoice
• Continuing digital Native Customs Reconciliation
IOT
integration of Air and builds
Ocean Carriers for
Schedules, Rates, • Customs Entry
Bookings, Cargo Events Optimisation and
and Billing Automations
30 © 2020 WiseTech GlobalAcquire people, knowledge & market positions to fuel development
Small targeted founder-led acquisitions provide safer, faster, stronger entry
Geographic footholds fuel global customs platform, adjacencies expand into addressable markets/technologies
31 © 2020 WiseTech GlobalIntegration process ─ build out of foundation to support efficient growth
Evolution of strategic assets involves comprehensive reshaping of commercial model
Foothold 12 ─ 36 mths
3 ─ 12 mths 0 ─ 36 mths
Adjacencies 3+ years
Integrate operations Develop product Grow revenue
Platform migration, TECHNOLOGY DEVELOPMENT Global customers access new capability integrated in CargoWise
business processes Universal Customs Engine
Immediate revenue once capability is embedded in global platform, transaction-based licence
Development system COMMERCIAL FOUNDATION Conversion of acquired customer base
Commercial standards ‘Acculturation’ to WiseTech Way
Management control of operations On-boarding, licence transition, staggered move of base over 3+ years
On-boarding and sales efficiency
Interface acquired product swiftly Licensing and channel development Acquired customers – expand usage
Content systems, eLearning platform
Localisation and languages Acquired customers – multi-region rollout
Move to full “native” product
Full global rollout capability (aligned with global FF rollouts)
Content architectures Licensing Sales evolution Service and support Channel development
• Education • On-demand licensing • On-boarding • Training, systems • Establish Partners
• Certifications • Universal contracting • Systems • Outsource consulting and on- • Technical
• Sales and marketing • Universal pricing • Inside sales boarding • Service
• Channel • CargoWise • Semi-automations • Referral
• Languages Certifications • CW Cert Practitioners • Access CargoWise Partners
• Localisations + Networks
Acquisition and integration value components
32 © 2020 WiseTech GlobalProgress on integration
Key highlights for 1H20 “To date we have secured over 1,200 industry experts
• Acquired Depot Systems, Cypress, Ready and key logistics industry resources with hard to
Korea and SISA since FY19 access knowledge and development capability across
• We have now completed interface for 30+ logistics software businesses”
10 acquired custom platforms, with 12
native or embedded builds underway
and 3 in commencement stage LEARN MORE ABOUT
WHAT WE BUY AND WHY
• Extended PAVE use and training to
WE BUY IN APPENDIX
another 20 assets for development
• Completed China customs ready for
rollout, Taiwan 90% complete
• Completed Cargoguide next-gen product
for rollout 2H20
• Completed compliance upgrades for
customs and regulatory environments
w/wide
• CargoWise localisation:
▪ Accounting – LATAM, Italy, Turkey
▪ Significant development in
CargoWise content - translation to SEE APPENDICES
German, Italian, French, Spanish, FOR OVERVIEW ON
Portuguese and Turkish INTEGRATION PROGRESS FOR
• Partner channels in 38 countries – STRATEGIC ASSETS
developing/strengthening relationships
in key geographies.
33 © 2020 WiseTech Global2020
Strategy
and
outlook
34 © 2020 WiseTech GlobalWe are moving swiftly and determinedly to grow our market and moat
Solved for global platform, high growth commercial model, expanding network foundation
Global Hyper-scalable
integrated efficient
platform commercial model
Digital straight-through Speeds onboarding
processing Eliminates costs
Disciplined use of
Facilitates relentless resources
product development
Vast
data sets Network
foundation
Global and domestic
machine learning Nodes + connections
Automate execution Thousands of logistics
Identify supply chain organisations,
opportunities brings million+ nodes
50 billion data
transactions per year
35Powerful growth strategy
Multiple levers to sustain growth and increase market penetration
+ +
Transactions/users Modules
Innovation + Increase new Strategic
customers on Stimulate acquisitions-
and expansion
the platform network securing
of our global
Geographies Industry effects resources +
platform consolidation
market entry
Greater usage by
existing customers
“We are accelerating into more products, more geographies and more adjacencies…
driving our long-term growth with each innovation and acquisition.”
36 © 2020 WiseTech GlobalLogistics execution industry dynamics
Industry pain points and trade changes cycle faster, drive an exponential shift to CargoWise
3PL industry dynamics vs Impact of Our leading global logistics software, CargoWise and
low propensity to switch out of dynamic for open-access, usage-driven business model remove
proprietary systems WiseTech Global constraints to growth
Increasing regulation positive Fast to market with new regulatory changes
Increasing complexity positive Relentless innovation investment, automates or eliminates processes
Growth in transactions positive Highly scalable, integrated platform, productivity focused
High fragmentation positive Operating system for logistics, one to thousands of users
Pressure on supply chain execution margins positive SaaS, pay for use monthly in arrears, productivity benefits
Capital constraints positive No upfront capital, easily add users and regions, only pay for use
Increasing network tie-ups positive Integrated global platform, 150+ countries, real-time visibility
Demand for faster throughput positive Highly automated, more productive, enter data once
Cycles in 3PL verticals – economic up/downturn positive Pay for what you use, linked to value point
Consolidation across 1PL/2PL/3PL, Amazon positive Execution capability across supply chain, plug into myriad systems
3PL consolidation growing positive Seamless, swift, scalable onboarding of thousands, global rollouts
High labour cost in high GDP trade routes positive Significant productivity gains through technology
Impact of political change (new govt/Brexit) positive Large-scale customs/border software development capacity to meet change
Shift to SaaS, cloud positive SaaS since 2008, cloud, all devices, LDaaS and PaaS to come
Shift from in-house to commercial systems positive Commercially proven, integrated platform used by 25 largest global FF’s
Trade wars, tariffs, barriers up/down positive CargoWise swift to update, trade complexity adds transactions
Our technology and business model turns industry problems into tailwinds
37Industry environment early 2020
COVID-19 virus closing manufacturing, delaying trade
Container departures per region
Container departures per country - Asia
Sources:
https://www.joc.com/maritime-news/global-container-growth-forecast-rebound_20190425.html
https://www.joc.com/maritime-news/trade-lanes/trade-war-drives-first-year-year-drop-us-imports-asia-
Source: CargoWise – industry analysis Feb 2020
decade_20200117.html
38 © 2020 WiseTech GlobalStrong growth outlook – powerful organic revenue
Execution on strategy continues to deliver strong long term growth
420 – 450 Strong delivery
• Momentum from accelerating penetration of
existing customers
FY20 revenue(1) • 99% recurring revenue on CargoWise
• Annual CargoWise customer attrition rate ofFinancial information Appendices
FY20 guidance and assumptions
Global revenues received in a mix of key currencies
Financial performance summary
Income statement Company information
Key operating metrics – WiseTech Global including and excluding acquisitions Opportunity for the solution to industry pain points is vast
Contingent consideration liability
Explanatory notes Powerful high growth engine – CargoWise integrated global platform
Reconciliation of statutory operating cash flow to statutory cash flow CargoWise – value proposition for customers
CargoWise integrated global platform – productivity gains and cost savings
Revenue Employees
Revenue: CargoWise and acquired strategic assets
Significant revenue growth
Overview of revenue licensing models, drivers and platform
CargoWise Transformation
WiseTech difference, transformation track record – Product
WiseTech difference, transformation track record – Revenue
Acquired Strategic Assets WiseTech difference, transformation track record – Cost efficiency
Integration process ─ build out of foundation to support efficient growth WiseTech difference, transformation track record – Technology
Acquisitions progress – integration and product GLOBAL CUSTOMS
Acquisitions progress – integration and product ADJACENCIES
“Lego-map’ CargoWise expanding to be the operating system for global logistics
Industry
Development Regulatory changes
Product commercialisation and monetisation processes and timeline Overview of moving goods and data
Capitalised development and amortisation
Focus on innovation investment, efficient sales and marketing
40 © 2020 WiseTech GlobalFY20 guidance and assumptions
Growth in revenue and EBITDA
What is included in the FY20 guidance: What is not included in the guidance:
• Retention of existing customers with CargoWise usage growth • Revenue from new products in development but not planned to be
consistent with historical levels commercialised
• New customer growth consistent with historical levels • Benefits from migration of customers from acquired platforms, where
• New product and feature launches monetised CargoWise development is yet to be completed
• Contractual increases in revenue from existing customers, including • Growth in services revenue outside of e-services
those reflecting the end of temporary pricing arrangements • Changes in the mix of invoicing currencies
• Standard price increases • Future potential acquisitions, revenues and associated costs
• Full year effect of prior year acquisitions and minimal growth for
acquisitions as a group overall
• Acquisition completed post 30 June 2019: Depot Systems, Cypress,
Ready Korea, SISA
• Prudent allowance for COVID-19 timing impact during 2H20
FY19 FY20 guidance
Revenue $348.3m $420m - $450m
EBITDA(1) $108.1m $114m - $132m
1. The application of AASB 16 Leases brought into effect from 1 July 2019, is expected to add $6m to EBITDA for FY20 with no change to revenue. The total is reflected in the guidance provided.
41 © 2020 WiseTech GlobalGlobal revenues received in a mix of key currencies
Revenues protected with effective natural hedge
FY20 1H20 2H20
FX rates v AUD
prior guidance actual forward guidance
• 75% of 1H20 revenue in
non-AUD currencies, 1pp GBP 0.55 0.55 0.52
lower than 1H19 (76%)
RMB 4.80 4.81 4.81
• Natural hedges in some EUR 0.61 0.62 0.62
regions with both revenue
and expenses NZD 1.05 1.06 1.04
denominated in local ZAR 10.1 10.1 9.9
currencies – including
recent acquisitions USD 0.69 0.69 0.67
TRY 4.05 3.94 4.02
• 43% of 1H20 revenue in
non-local due to impact
from overseas acquisitions
2H20 revenue 2H20 EBITDA
and mix of transactions Sensitivities Increase/decrease
$m $m
and users in CargoWise
FX rates vs AUD
• No derivative contracts in
place for 1H20 USD +/- 5% -/+ 3.7 -/+ 2.0
EUR +/- 5% -/+ 2.1 -/+ 0.3
ZAR +/- 10% -/+ 0.6 -/+ 0.2
TRY +/- 10% -/+ 0.1 -/+ 0.1
42 © 2020 WiseTech GlobalFinancial performance summary
Robust delivery on strategy, business thriving, revenue growing
Income statement
$m
1H19 1H20 Change (vs 1H19)
Revenue
Recurring On-Demand 114.1 151.8 33%
Recurring OTL maintenance 25.0 34.1 36%
OTL & support services 17.7 19.9 12%
Total revenue 156.7 205.9 31%
Cost of revenues (27.7) (36.4) 31%
Gross profit 129.0 169.4 31%
Operating expenses
Product design and development (31.2) (38.3) 23%
Sales and marketing (18.1) (28.8) 59%
General and administration (31.2) (39.8) 28%
Total operating expenses (80.4) (106.9) 33%
EBITDA 48.5 62.5 29%
Key operating metrics – including acquisitions
Recurring revenue 89% 90% 1pp
On-Demand revenue 73% 74% 1pp
Gross profit margin 82% 82% -
Total R&D - % of total revenue 33% 36% 3pp
Sales and marketing - % of total revenue 11% 14% 3pp
General and administration - % of total revenue 20% 19% (1)pp
General and administration (excluding M&A) - % of total
17% 17% -
revenue
EBITDA margin 31% 30% (1)pp
43 © 2020 WiseTech GlobalIncome statement
$m 1H19 1H20
Revenue
Recurring On-Demand 114.1 151.8
Recurring OTL maintenance 25.0 34.1
OTL & support services 17.7 19.9
Total revenue 156.7 205.9
Cost of revenues (27.7) (36.4)
Gross profit 129.0 169.4
Operating expenses
Product design and development (31.2) (38.3)
Sales and marketing (18.1) (28.8)
General and administration (31.2) (39.8)
Total operating expenses (80.4) (106.9)
EBITDA 48.5 62.5
Depreciation (3.9) (7.8)
Amortisation (5.1) (7.5)
EBITA 39.5 47.2
Acquired amortisation (3.7) (5.2)
EBIT 35.8 42.0
Net finance costs (2.8) (3.0)
Fair value gain on contingent consideration 0.1 32.7
Share of (loss)/profit of equity accounted investees - -
Profit before income tax 33.1 71.8
Tax expense (10.1) (11.9)
NPAT 23.0 59.9
Non-controlling interests - -
Net profit attributable to equity holders of the parent 23.1 59.9
NPATA(1) 27.5 33.5
1. Net profit after tax attributable to equity holders of the parent before acquired amortisation net of tax, contingent consideration interest unwind net of tax and fair value changes on contingent consideration.
44 © 2020 WiseTech GlobalKey operating metrics – WiseTech Global including and excluding acquisitions
1H20
1H19 1H20
CargoWise(1)
Total revenue growth vs prior period 22% 7%
Total revenue growth vs prior corresponding period 68% 31%
Recurring revenue 89% 90% 99%
On-Demand revenue 73% 74% 99%
Gross profit margin 82% 82% 92%
Product design and development - % of total revenue 20% 19% 11%
Total R&D - % of total revenue 33% 36% 32%
Sales and marketing - % of total revenue 11% 14% 13%
General and administration - % of total revenue 20% 19% 19%
EBITDA margin 31% 30% 49%
EBIT - % of total revenue 23% 20%
NPAT - % of total revenue 15% 29%
NPATA - % of total revenue 18% 16%
Capitalised development investment $m 20.1 35.0
Total R&D $m 51.2 73.3
Effective tax rate 30% 17%
1. CargoWise ratios excluded acquisitions since 2012 not embedded into CargoWise and included M&A costs.
45 © 2020 WiseTech GlobalContingent consideration liability
• Contingent consideration liability is
related to earnouts agreed, at the time
of acquisition for 29 acquired
businesses, contingent on achieving
select milestones over periods of 3 years
or more such as for financial
performance, product development or
customer transition.
• As part of the assessment of the liability
at each reporting date, the fair value of
contingent consideration is determined,
taking into account historical and
expected future performance.
• Changes in the fair value of contingent
consideration after the acquisition date
must be recognised in profit or loss.
• Each period, we gain a clearer picture of
the operational performance and
potential of our acquired businesses.
This updates our assessment of the
contingent consideration payable
pursuant to performance conditions. In
this period, the assessment resulted in a
liability reduction and a corresponding
fair value gain of $32.7m (1H19: $0.1m).
46 © 2020 WiseTech GlobalExplanatory notes
$m
1H18 2H18 1H19 2H19 1H20
NPATA NPAT attributable to equity holders of the Parent 15.6 25.3 23.1 31.1 59.9
Acquired amortisation (net of tax) 0.8 1.8 2.7 3.6 3.8
Contingent consideration interest unwind (net of tax) 0.5 1.0 1.9 2.2 2.6
Fair value gain on contingent consideration - - (0.1) (1.5) (32.7)
NPATA* attributable to equity holders of the Parent 16.8 28.0 27.5 35.4 33.5
*NPATA – Net profit after tax attributable to equity holders of the parent before: acquired amortisation net of tax,
contingent consideration interest unwind net of tax and fair value changes on contingent consideration
$28.4m $41.1m $66.1m $38.3m
1H20 excl. 1H20 FV gain 1H20
Impact of fair FV gain
value gains on
effective tax Profit before income tax 39.1 32.7 71.8
rate Tax expense (11.9) - (11.9)
NPAT 27.2 32.7 59.9
Effective tax rate 30.4% - 16.6%
In Australia, a Deed of Cross Guarantee is available to provide Company Groups relief from the requirement
Deed of cross to prepare redundant, duplicate financial information. This information is already provided and audited in
guarantee the $15.4m
Group accounts
$22.6mand no$44.0m
additional$28.8m
information would be available
$33.3mshould$45.5m
the deed $68.3m
not be in place.
$39.8m
47 © 2020 WiseTech GlobalReconciliation of statutory operating cash flow to statutory cash flow
$m 1H19 1H20
• Payments for intangible EBITDA 48.5 62.5
assets reflected internal Non-cash items in EBITDA 3.2 6.8
capitalised development Changes in working capital (0.4) 0.4
Operating cash flow 51.3 69.7
Income tax paid (7.6) (7.3)
• Acquisition of businesses
Net cash flows from operating activities 43.7 62.4
comprises payment for
acquisitions upfront Payments for intangible assets (18.3) (33.0)
consideration and earnouts Purchase of property, plant and equipment (3.1) (8.7)
Interest received 0.3 2.0
• Purchase of property, plant Acquisition of businesses, net of cash acquired (120.4) (39.2)
and equipment included Disposal of assets held for sale 0.7 -
Net cash flows used in investing activities (140.8) (78.9)
data centre additions, office
equipment replacement Interest paid (0.5) (1.3)
and new office facilities Treasury shares acquired (5.7) -
Repayments of lease liabilities (1H19: finance lease liabilities) (0.5) (2.6)
Proceeds from/(repayment of) borrowings 28.4 (0.1)
Dividends paid (4.7) (5.9)
Transaction costs on issue of shares - (0.2)
Net cash flows from/(used in) financing activities 17.0 (10.2)
Net decrease in cash and cash equivalents (80.1) (26.7)
Cash and cash equivalents at 1 July 121.8 260.1
Effect of exchange differences on cash balances 0.5 (0.3)
Cash and cash equivalents at 31 December 42.2 233.1
48 © 2020 WiseTech GlobalRevenue: CargoWise and acquired strategic assets
Strong organic revenue from CargoWise is durable as it derives from many drivers
What drives CargoWise organic revenue growth? When does acquired revenue become CargoWise?
Organic revenue relates to revenue from existing CargoWise customers As with everything we do, it is driven by the technology.
or new CargoWise customers. Revenue from all strategic assets acquired since 2012 (not already embedded in
CargoWise) are categorised as ‘revenue from customers on acquired platforms’ or ‘growth
from acquisitions’. Unlike many companies that transfer revenue from acquired to
Drivers organic shortly after business integration, we keep our acquired revenue separate.
1. Increased usage across our existing CargoWise customer base,
as existing customers: For geographic expansion assets:
• use more – i.e. add transactions
• the revenue will only become CargoWise when the customs technology is embedded
• open up in new sites
in CargoWise and usage of the module/platform is native to CargoWise, and
• start to use more modules and features
• use new products and features • the revenue related to the customers acquired, that remain on the acquired platform,
is recorded as acquired revenue until that customer transitions to CargoWise.
• expand to more geographies
• extend to global rollouts
• add automations to increase transaction throughput For adjacent technology assets:
• add more users Adjacent technology assets will move to the CargoWise revenue category when:
• consolidate their acquisitions onto the platform
• their technology interface to CargoWise is complete and seamless (SSO), and
2. Revenue growth from customers that have transitioned from (static)
• they have completed the commercial foundation (e.g. content and eLearning
temporary pricing arrangements
architecture, contract and licensing transition, sales and support model).
3. Customer take up of behavioural discounts
4. Customer consolidation of other companies they acquire Acquisitions with minimal or no revenues or customers can be absorbed quickly into the
CargoWise core, predominantly impacting operating expense.
5. New customers adding users to the platform in single site,
multi-region or global rollout
6. Trade patterns
7. Measured price changes related to new product additions or CPI adjustment
In any given period, while revenue drivers can cause large lumpy
8. Launch of new product/features to the platform: commercialised then
monetised through transaction charges or in seat licence.
movements, on average, organic CargoWise growth range is about 20 – 30% pa.
49 © 2020 WiseTech GlobalSignificant revenue growth
Strong underlying CargoWise growth demonstrates resilience during extensive business transformation
• Organic CargoWise revenue Revenue
growth 24% yoy
$m
• CargoWise revenue can
contain large static 22.6 0.4 205.9
components on which
organic growth does not
occur. e.g. fixed or 24.3 1.9
transitionary pricing such
as for global rollouts
15.9 156.7 79.3
• Revenue from strategic
asset acquisitions can be
impacted by part-period
14.6
consolidation 30.6 2.2 54.4
• Strategic assets may stop
one-off or non-recurring
transactions or services and 93.4
one-time licence sales or
introduce transitionary
commercial arrangements 21.7
during a period
126.5
• Revenue related to sales of
CargoWise through new 102.3
geographic assets or
adjacencies yet to be 71.7
embedded, will appear as
CargoWise revenue
Total revenue FX impact yoy: $4.8m Total revenue FX impact yoy: $4.6m
1H18 1H19 1H20
CargoWise revenue from existing and new customers(1)
Acquired business revenue from all the acquisitions since 2012 and not embedded into CargoWise
50 © 2020 WiseTech Global 1. Growth from new CargoWise customers is revenue growth from CargoWise platform customers won in the current financial year and the previous two financial years.Overview of revenue licensing models, drivers and platform
Customers in transition to On-Demand, ultimately move to transaction-based licensing
Nature of revenue: Recurring revenue Other revenue
(1) (1)
90% 10%
Revenue categories: On-Demand OTL maintenance OTL & support services
74%(1) 16%(1) 10%(1)
Licence model: Seat Plus Transaction Licensing (STL) Module User Licence (MUL) One-Time Licence (OTL) Support services
Maintenance Licence
Temporary contracted
Revenue drivers: Transactions Modules used Services(2) Licences
pricing arrangements
· Price per transaction executed · Price per user
Annual maintenance price per One-time price per
Price drivers: · Price per individual user · Price per module used licence perpetual licence
· Fixed monthly rate for
Ad hoc revenue such as
Transactions executed per month and limited period
Level of usage professional services, training
· Contracted price Number of MUL users per month
number of individual users and paid feature requests
increases
· Number and size of customers · Number and size of customers
Volume drivers: · Excess user fees Number of licences Number of licences
· Activity level of customers · Activity level of customers
FX: · Foreign exchange rates for customers invoiced in foreign currency
Platform:
- CargoWise One O O
- ediEnterprise O O
- BorderWise O O O O O O
- ProductivityWise O O O O O
TransLogix, Zsoft, TransLogix, Zsoft, Softship, znet,
Softship, znet, ACO, ACO, Bysoft, CMS, Prolink,
TransLogix, Compu-Clearing, znet, TransLogix, Zsoft, CoreFreight, CCN,
CMS, Prolink, Microlistics, ABM Data Systems,
Bysoft, CMS, ABM Data Systems, Softship, znet, ACO, Bysoft, Digerati,
Ulukom, Fenix, CustomsMatters, Intris, LSP,
CustomsMatters, LSP, EasyLog, CMS, Prolink, Cargoguide, CargoSphere,
Pierbridge, Taric, Softcargo, Fenix, Ulukom,
SmartFreight, Ulukom, Trinium, Systema, Forward, Softcargo, SaaS Microlistics, Intris, Softcargo, Ulukom,
- Acquired
Containerchain, Ready Korea
O Transportation, Trinium,
CCN
Fenix, Pierbridge, Taric, DataFreight,
DataFreight, CargoIT, Pierbridge, Taric, CargoIT,
Multi Consult, DataFreight, SmartFreight, SaaS
Pierbridge, SmartFreight, Systema, CargoIT, SmartFreight, Multi Consult,
Trinium, Systema, Transportation, Multi Consult,
Containerchain, Xware, Depot Trinium, Systema, Containerchain,
Containerchain, Trinium, Systema,
Systems Xware, Depot Systems, Ready Korea
Depot Systems, Containerchain, Xware, Depot
Ready Korea Systems, Ready Korea
1. Represents percentage of 1H20 total revenue.
2. Mainly comprises additional services such as e-services (connections to commercial information systems) and hosting fees provided to STL and MUL customers. Fees are typically based on the transfer of data or execution of activities contained within each active module.
51 © 2020 WiseTech GlobalYou can also read