Business Plan 2021-2025 - Energizing Our Community's Future - Orangeville Hydro
←
→
Page content transcription
If your browser does not render page correctly, please read the page content below
2021-2025
Business Plan

  Energizing Our Community’s Future

Table of Contents
  1.      Executive Summary ......................................................................................................................... 3
  2.      Mission, Vision and Values ............................................................................................................... 3
       Vision Statement ................................................................................................................................. 3
       Mission Statement ............................................................................................................................... 3
       Values Statement ................................................................................................................................ 3
  3.      Strategic Objectives ......................................................................................................................... 4
       Safety .................................................................................................................................................. 4
       Customer Focus ................................................................................................................................... 4
       Operational Effectiveness .................................................................................................................... 4
       Public Policy Responsiveness ............................................................................................................... 5
       Financial Performance ......................................................................................................................... 5
  4.      SWOT Analysis ................................................................................................................................. 5
       Strengths ............................................................................................................................................. 5
       Weaknesses......................................................................................................................................... 6
       Opportunities ...................................................................................................................................... 6
       Threats and Uncertainties.................................................................................................................... 7
       Capability ............................................................................................................................................ 7
  5.      About the Utility .............................................................................................................................. 8
       Corporate Structure and Organizational Chart of the Utility ................................................................. 8
  6.      Economic Overview and Customer Description ................................................................................ 9
       Economic Overview of the Service Area ............................................................................................... 9
       Customer Description .......................................................................................................................... 9
  7.      Performance Metrics and Future Plans .......................................................................................... 11
       2019 Scorecard Management Discussion and Analysis ....................................................................... 11
       General Scorecard Overview.............................................................................................................. 11
       Pacific Economics Group (PEG) Report ............................................................................................... 19
       Distribution Revenue ......................................................................................................................... 19
       Historical and Proposed Revenues ..................................................................................................... 22
       Bill Impacts ........................................................................................................................................ 22
  8.      Capital Spending ............................................................................................................................ 24
       Key Objectives for Capital Expenditures ............................................................................................. 24

  Orangeville Hydro Business Plan 2021-2025                                                                                                             Page 1
2021 Capital Budget .......................................................................................................................... 25
     2022-2025 Capital Expenditure Plan .................................................................................................. 27
9.      Operational Costs .......................................................................................................................... 28
     2021 Operations, Maintenance, and Administration Budget .............................................................. 29
     2022-2025 Operating, Maintenance, and Administration Expenditure Plan ....................................... 31
10.         Personnel................................................................................................................................... 33
11.         Financial Summary ..................................................................................................................... 34
     Revenues........................................................................................................................................... 35
     Expenses ........................................................................................................................................... 35
     Capital Structure................................................................................................................................ 35
     Rates/Return ..................................................................................................................................... 36
     Corporate Income Tax ....................................................................................................................... 36
     Dividends .......................................................................................................................................... 36
12.         Pro-Forma Financial Statements ................................................................................................ 37
13.         Conclusion ................................................................................................................................. 39

Orangeville Hydro Business Plan 2021-2025                                                                                                         Page 2
1. Executive Summary

Orangeville Hydro Limited’s Business Plan for 2021-2025 is developed in conjunction with the strategic
plan, goal setting and target planning. This business plan is also based on Ontario Energy Board (OEB)
initiatives and governmental public policy responsiveness as well as our internal conception of the utility
to meet certain other objectives in creating efficiencies. These objectives are met while maintaining
safety; excellent customer service objectives and focus; system reliability; and stable financial
performance.

The key areas that are reviewed within this Business Plan are:

    •   Mission statement, Vision statement and Values statement
    •   Strategic Objectives
    •   SWOT Analysis
    •   Local economic overview and customer description
    •   Performance metrics
    •   Future Capital and Operating plans
    •   Financial Summary

2. Mission, Vision and Values
Orangeville Hydro’s strategies are in harmony with our corporate values, our vision, our mission
statement as well as our approach to a balanced scorecard and the outcomes identified in the Ontario
Energy Board Renewed Regulatory Framework for Electricity Distributors (RRFE).

Vision Statement
To be acknowledged as a leader among electric utilities in the areas of safety, reliability, customer service,
customer satisfaction, sustainability, and financial performance.

Mission Statement
To provide safe, reliable, efficient delivery of electrical energy while being accountable to our
shareholders...the citizens of Orangeville and Grand Valley.

While we must operate as a business and be profitable for our shareholders, our main reason for existing
is to provide safe, reliable, and economic electricity services to the people of the Town of Orangeville and
the Town of Grand Valley. That is what distinguishes us from other large, remotely owned and controlled
energy companies.

Values Statement
To continue into the future as a profitable electricity distribution enterprise the following principles are
core values of our Company:

We value professionalism and safety in our service and our work.
We value people - our customers, employees, board members, and shareholders.
We value our community - its environment and its economic progress.
We value integrity, honesty, respect, and communications.
We value local control, local accountability, local employment, and local purchasing; and
We value easy accessibility for our customers.

Orangeville Hydro Business Plan 2021-2025                                                             Page 3
3. Strategic Objectives
We will use the following strategies to overcome our weaknesses and threats and capitalize on
our strengths and opportunities. These strategies will also be in harmony with the corporate
values, vision, and mission statement.
Safety
Health and safety will continue to be a paramount for the company.
We provide safe work practice training for all employees consistent with industry best practices. We will
continue to seek new ways to further communicate and promote a safety culture to our employees, our
customers, and our community both inside and outside the workplace.
Customer Focus
As the customer’s role within the electricity system evolves, successful utilities will be those who recognize
that customers are not all the same. A willingness to invest in the skills, culture, technology, and practices
needed to leverage those tools will be a key difference between leading and trailing utilities in a more
customer-centric landscape.
We will adapt and tailor the service delivery methods to the specific needs of individual customers,
leveraging technology to enhance the customer experience and increase operational agility.
Tools exist for Orangeville Hydro to understand and engage our customers at an individual level and
provide a truly personalized service. Leveraging the power of big data, existing social media platforms,
and the convenience of mobile technology, we can anticipate our customers’ needs with increasing
precision to create a more effortless customer experience.
Operational Effectiveness
We will continue to leverage the benefits of collaboration with the CHEC membership, Electricity
Distributors Association, Utility Collaborative Services, and Utilities Standards Forum.
We will continue to network with other boards, stakeholders, and other utilities to develop and share best
practices.
We will investigate areas that are within our control to reduce or curtail costs to better utilize resources.
We will ensure our infrastructure is maintained properly by implementing and reviewing our 2014
Distribution System Plan as well as our Asset Condition Assessment and annual Distribution Maintenance
Program.
We will invest heavily in our staff and rely on them to help us accomplish our goals through the following
activities:
• We will keep our people informed
• We will make sure our people understand what we expect from them and why they are important
to the organization
Orangeville Hydro Business Plan 2021-2025 Page 4• We will support our people by providing them with information, tools, equipment, standard
policies & procedures, and training
• We will utilize a pay-for-performance model for the management team and attempt to link their
compensation with their performance and the performance of the company
• We will continue to carry out our succession planning process.
Public Policy Responsiveness
We will ensure our Distribution System can accommodate Distributed Energy Resources (PV solar,
combined heat and power, battery storage, and small natural-gas generators) and electric vehicle
technology.
We will promote PV Solar renewable energy within our service area.
We will continue to successfully deliver Provincial Programs to our customers such as future Conservation
& Demand Management Programs, the Industrial Conservation Initiative, the Home Assistance Program,
the Ontario Electricity Support Program, the Low-Income Energy Assistance Program, and the COVID-19
Energy Assistance Program.
We will deliver obligations mandated by pertinent government legislation and regulatory requirements.
We will investigate altered and additional business activities to improve shareholder value, empower the
customer, and advance with innovation.
Financial Performance
We will maximize financial viability by investigating efficiencies and maintaining prudent cost savings.
We will continue to maintain just and reasonable rates for our customers while achieving our deemed
rate of return.
We will continue to ensure we have a high level of performance relative to our industry peers by
continually reviewing the OEB LDC Yearbook data and well as our year to year trending.
We will investigate feasible opportunities to grow the distribution business.
4. SWOT Analysis
An essential element of our strategy is to ensure Orangeville Hydro Limited is ready to embrace change
and disruption in our sector. In a period of significant transformation, the ability to not only accommodate
change, but to make the most of it, is likely to be a distinguishing characteristic of those utilities that
continue to thrive. We will advocate and lobby for public policy that benefits our customers now and in
the future.
Strengths
We have positive relationships with our shareholders - the people of Orangeville and Grand Valley,
individual customers, and their elected representatives.
We have a core of high-quality employees, effective management, and solid relations between the staff
and the Board of Directors. In addition, we have a well-maintained distribution system.
Orangeville Hydro Business Plan 2021-2025 Page 5As a small organization, we have the advantage of being flexible and nimble when it comes to implementing change and reacting to threats quickly. We have a high level of quality customer service and customer satisfaction, based on survey results. We have a strong relationship with local organizations, including the Home Builders Association, Dufferin Board of Trade (DBOT), the County of Dufferin, Social Services, and service clubs. We have stability within our revenues due to operating within a regulated environment as well as our customer demographics. Over 66% of our revenue is received from our residential customers and the remainder is received by a diverse mix of small commercial, institutional, municipal, and industrial customers. Our largest customer only accounts for 1% of our total distribution revenue. Intensification is occurring within our service territory which is contributing to consistent customer growth and increasing the efficiency of our distribution system. Due to historical diligence in our succession planning, our workforce is in a stable position with exceptional leadership in place. Weaknesses We have limited land for large residential and industrial developments within our service area. The strict regulated environment limits the scope of potential business opportunities. We have a lean workforce. Therefore, when a departure or a leave of absence occurs the impact is significant and challenging. Opportunities We have an opportunity to maintain a high standard of service for our customers, contribute to the welfare of our local community, and return profits to the citizens of Orangeville and Grand Valley for their local benefit rather than remote corporate gain. We can help increase our customers’ knowledge regarding the safe use of electricity and conservation solutions to reduce their energy costs. The opportunities for customer interaction and control are growing daily, as are our customer’s expectations for choice, convenience, and responsiveness. Orangeville Hydro can be a solutions provider to improve our customer’s experience. Investigate expanding our service area by working with developers surrounding the existing service area and applying for Service Area Amendments. The COVID-19 pandemic has created an environment to find creative solutions to serve our customers and continue the operation of all business activities under different circumstances such as working remotely. The pandemic is an opportunity to challenge the status quo and find more effective ways of operating as an organization. Orangeville Hydro Business Plan 2021-2025 Page 6
Threats and Uncertainties
The COVID-19 coronavirus pandemic has created new threats and uncertainties regarding impacts to
staffing levels, distribution revenue, operational capabilities, and our customers’ ability to pay.

The Ontario electrical sector is subject to the current direction of the provincial government which shifts
due to the four-year provincial election cycle. The changes in government create uncertainty for the
direction of the Ministry of Energy and other Ministries that affect the electrical sector.

The implementation of various rules and regulations by the Ontario Energy Board will make it difficult for
distribution companies to collect from customers that default on their bill payments and increase the risk
of bad debts.

Revenue recovery is based on approval from the Ontario Energy Board. Their expectations and
requirements are continually changing and placing downward pressure on revenue recovery.

There are increased uncertainties regarding technological advances, climate change, and cyber security
(world-wide threats) that need to be considered.

The removal of all LDC’s involvement in the provincial Conservation and Demand Management programs
along with the reduction of programs in March of 2019 reduced the incentive for customers to conserve
energy and removed a program that increased Orangeville Hydro’s ability to interact with and assist
customers.

Capability
A highly skilled, properly trained, and knowledgeable workforce is essential to Orangeville Hydro’s
continued success. Like many other companies and utilities, Orangeville Hydro ‘s continuing
comprehensive succession planning is aimed at anticipating and fulfilling current and potential employee
needs, through planning, talent attraction, effective deployment of resources, performance management,
and development.

Orangeville Hydro Business Plan 2021-2025                                                           Page 7
5. About the Utility
The Energy Competition Act, 1998 required local distribution utilities like Orangeville Hydro to become
incorporated according to the Ontario Business Corporations Act by November 7, 2000. Hence on October
2, 2000, the Town of Orangeville passed a by-law transferring all assets and liabilities of the Orangeville
Hydro-Electric Commission to Orangeville Hydro Limited. Orangeville Hydro Limited is considered a
local distribution company or a wires company. In 2009, Orangeville Hydro Limited and Grand Valley Energy
Inc. merged. Since then, Orangeville Hydro Limited has been owned by the Town of Orangeville (94.5%)
and the Town of Grand Valley (5.5%). Orangeville Hydro Limited is licensed by the Ontario Energy Board to
operate as an electricity distribution company within the current boundaries of the Town of Orangeville
and the former Village of Grand Valley. Successful Service Area Amendments have allowed Orangeville
Hydro to grow our service area beyond our original limits of the former Village of Grand Valley.

Orangeville Hydro must operate its business in compliance with all applicable laws, including the Electricity
Act, 1998, the Ontario Energy Board Act, 1998, the Ontario Business Corporations Act, and the rules,
policies and requirements of the OEB. These include the Distribution System Code, the Affiliate
Relationships Code, the Retail Settlement Code, the Standard Supply Service Code, the Accounting
Procedures Handbook and the Uniform System of Accounts as well as the applicable Rate Handbook and
Filing Requirements.

Corporate Structure and Organizational Chart of the Utility
Orangeville Hydro employs 18 full time highly trained staff and is an active partner in the community.

                         Table 1: Corporate Structure and Organizational Chart

Orangeville Hydro Business Plan 2021-2025                                                             Page 8
6. Economic Overview and Customer Description
Economic Overview of the Service Area
Orangeville Hydro’s service area has a population of approximately 32,000 and is expected to grow to
42,540 by 2036 according to forecasts contained within the Dufferin County Official Plan (2017). This
growth is constrained beyond these numbers due to the limited residential land development in the Town
of Orangeville and the limited municipal water service and municipal sewage service in both the Town of
Orangeville and the Town of Grand Valley.
The Town of Orangeville is the urban hub of Dufferin County. The population of almost 30,000 people
sustains strong commercial retail stores that includes big box stores, nationwide commercial retail stores,
and small locally owned retail stores. Orangeville has a strong group of manufacturers in sectors such as
plastics, food products, woodworking, aerospace, and automotive. The economic base of the Town of
Orangeville is diversified between many sectors.
The Town of Grand Valley is a fast-growing area within Dufferin County. Orangeville Hydro services the
urban settlement area and Hydro One services the surrounding rural farmlands. The urban settlement
area of the Town of Grand Valley has a population near 2,000 and is growing through both intensification
and greenfield developments. The Town of Grand Valley is an urban hub with businesses for shopping,
dining, and services.
Customer Description
Orangeville Hydro’s breakdown of customers by class is shown below:
Table 2: Customers by Class December 31, 2019
Customer Class Number of Customers
Residential 11,360
General Service < 50 kW 1,160
General Service > 50 kW 132
Sentinel Lights 35
Street Lights 3
Unmetered Scattered Load 31
Generation 42
Total 12,763
Orangeville Hydro has a steadily growing base of residential customers with new subdivisions being
energized in both Orangeville and Grand Valley. There is also significant redevelopment and
intensification occurring within both communities. The intensification projects will continue to increase
Orangeville Hydro’s density metrics such as customers per kilometer of line and customers per square
kilometer. Orangeville Hydro has a diverse manufacturing sector, with several large industrial customers
in the plastics and food product manufacturing sectors.
Orangeville Hydro Business Plan 2021-2025 Page 9Table 3: Average Monthly Consumption per Customer (kWh)
Customer Class 2014 2015 2016 2017 2018 2019
Residential 687 667 658 620 677 654
General Service < 50 kW 2,518 2,489 2,509 2,485 2,557 2,505
General Service > 50 kW 71,425 75,531 74,124 82,350 78,941 80,110
Sentinel Lights 61 57 49 57 55 55
Street Lights 52 49 28 26 25 25
Unmetered Scattered Load 441 332 304 344 322 322
Orangeville Hydro has witnessed a slow decline in the average consumption of our residential customers
for most years. This is occurring due to factors such as conservation activities, installation of more
efficient equipment, improved building code requirements in new homes, intensification decreasing the
average size of a household, and our customers converting from electrical heating equipment to natural
gas. The decline is not necessarily consistent as weather patterns such as extreme heat waves or
extended periods of extreme cold are not consistent year to year. Although residential consumption is
decreasing, residential distribution rates are based on a fixed service charge, and therefore provide a
stable revenue source.
The average usage of a General Service >50kW customer has increased from 2014 compared to 2019 as
our large customers have expanded, as well as the customers that used to be at the lower end of the
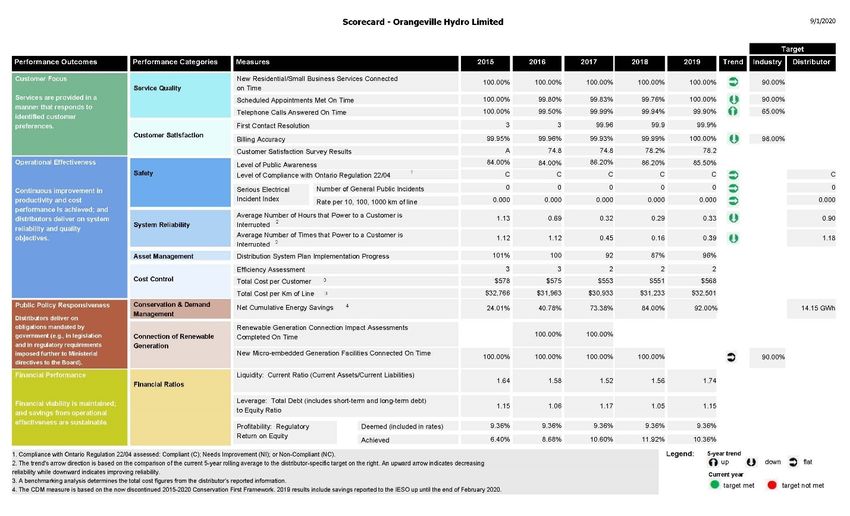
GS>50kW customer class have been reclassified to General Service7. Performance Metrics and Future Plans 2019 Scorecard Management Discussion and Analysis The performance outcomes outlined in the RRFE are measured on the LDCs scorecard which is published annually. In 2019 Orangeville Hydro exceeded all performance targets. A discussion of the scorecard results follows the reproduction of the scorecard below. The scorecard is published annually by the Ontario Energy Board on or after September 30, therefore the next scorecard which will include 2020 audited results will be posted around September 30, 2021. General Scorecard Overview In 2019, Orangeville Hydro exceeded all performance targets. Aging distribution infrastructure continues to be a challenge for many utilities today. Like most utilities in Ontario, Orangeville Hydro must replace aging infrastructure at a steady pace to meet this challenge. Therefore, Orangeville Hydro strategically plans to manage the renewal and growth of the distribution system in a cost-effective manner. In addition, vegetation control, including line clearing activities, were increased in the year to reduce the vulnerability of the distribution system to external uncontrollable events, such as weather. Orangeville Hydro continues to focus on providing value to our customers. Orangeville Hydro offers “Customer Connect” to assist our customers with interactive information that will permit them to better monitor, understand, and control their electricity consumption. Orangeville Hydro is continually improving our website, which allows customers an improved experience when interacting with us. Our social media presence has increased, to provide immediate updates for outages as well as current news. Orangeville Hydro makes every effort to engage its customers on a regular basis to ensure that we are aware of your needs and that you are receiving the best value for your dollar. Orangeville Hydro Business Plan 2021-2025 Page 11
In 2020, Orangeville Hydro will continue its efforts to improve its overall scorecard performance results as
compared to prior years. This performance improvement is expected as a result of continued investment
in both our infrastructure and in our response to your needs.

     Service Quality

•   New Residential/Small Business Services Connected on Time

In 2019, Orangeville Hydro connected 106 low-voltage (connections under 750 volts) residential and small
business customers within the five-day timeline as prescribed by the Ontario Energy Board. This quantity
is less than the 2019 new connections. Orangeville Hydro considers “New Services Connected on Time” as
an important form of customer engagement as it is the utilities first opportunity to meet and/or exceed
its customer’s expectations, which in turn affects the level of customer satisfaction within a utility’s
territory. Consistent with prior years, Orangeville Hydro connected 100% of these customers on time,
which significantly exceeds the Ontario Energy Board’s mandated target of 90% for this measure.
Orangeville Hydro expects this trend to continue into the foreseeable future.

•   Scheduled Appointments Met On Time

Orangeville Hydro scheduled 272 appointments in 2019 to disconnect and/or reconnect service for
maintenance, gain access to read or replace an inside meter, locate underground wires or otherwise
complete work requested by its customers, including energizing new subdivisions. Orangeville Hydro
considers “Scheduled Appointments Met” as an important form of customer engagement as customer
presence is required for all types of appointments. Consistent with prior years, Orangeville Hydro met
100.00% of these appointments on time, which significantly exceeds the Ontario Energy Board’s mandated
target of 90% for this measure. Orangeville Hydro expects this trend to continue into the foreseeable
future.

•   Telephone Calls Answered On Time

In 2019, Orangeville Hydro received over 22,747 calls from its customers (an average of 91 calls per day),
an increase of 6% from 2018. Orangeville Hydro considers “Telephone Calls” to be an important
communication tool for identifying and responding to its customers’ needs and preferences. Consistent
with prior years, a customer service representative answered 99.9% of these calls in 30 seconds or less,
which significantly exceeds the Ontario Energy Board mandated target of 65% for this measure.
Orangeville Hydro expects this trend to continue into the foreseeable future.

     Customer Satisfaction

•   First Contact Resolution

First Contact Resolution is a scorecard measure introduced by the Ontario Energy Board midway through
2014. The Ontario Energy Board has not yet issued a common definition for this measure but is expected
to do so within the next few years. As a result, this measure may differ from other utilities in the Province.

Orangeville Hydro defines “First Contact Resolution” as the number of customer inquiries that are not
resolved by the first contact at the utility, resulting in the inquiry being escalated to an alternate contact

Orangeville Hydro Business Plan 2021-2025                                                            Page 12
at the utility, typically a supervisor or a manager. This includes all customer inquiries that are made to a
customer service representative whether by telephone, letter, e-mail, or in person. First contact resolution
is tracked through the billing system. Once the issue has been escalated, details of the issue and the agreed
upon resolution are logged on the customer’s account by management. Outside escalation’s are updated
through email and copied to the customer’s account. Orangeville Hydro considers the ability to address
customer enquiries quickly and accurately to be an essential component of customer satisfaction.
• Billing Accuracy
Billing Accuracy is defined as the number of accurate bills issued expressed as a percentage of total bills
issued. Orangeville Hydro considers timely and accurate billing to be an essential component of customer
satisfaction. For 2019, Orangeville Hydro issued more than 153,427 customer bills and achieved a billing
accuracy of 100.00%, which is within the Ontario Energy Board mandated target of 98%. Orangeville Hydro
expects this trend to continue for 2020.
• Customer Satisfaction Survey Results
Customer Satisfaction Survey was a new scorecard measure introduced by the Ontario Energy Board for
the 2014 scorecard. The Ontario Energy Board has not yet issued a common definition for this measure
but is expected to do so within the next few years. This measure will differ from other utilities in the
Province since there is not a consistent instrument or approach used across the Province. This makes
meaningful comparison of results between many LDCs nearly impossible until there is a consistent
Province-wide methodology.
In 2018, Orangeville Hydro engaged a third-party organization to conduct a customer satisfaction survey.
This statistical survey canvassed several key areas including power quality and reliability, price, billing and
payments, communications, and the overall customer service experience. Orangeville Hydro considers this
customer satisfaction survey to be a useful tool for engaging the customer to get a better understanding
of their wants and needs with respect to the provision of electricity services and for identifying areas that
may require improvement. For 2018, Orangeville Hydro received a rating of 78.2% on its customer
satisfaction survey. Orangeville Hydro is only required to report on this measure on a biennial basis (every
second year) but expects this trend to continue into the foreseeable future.
Safety
• Public Safety
o Component A – Public Awareness of Electrical Safety
Component A consists of a statistical survey that gauges the public’s awareness of key electrical
safety concepts related to electrical distribution equipment found in a utility’s territory. The
survey also provides a benchmark of the levels of awareness including identifying gaps where
additional education and awareness efforts may be required. Orangeville Hydro’s ESA Public
Safety Awareness Index Score for the 2019 Survey was 85.50%.
o Component B – Compliance with Ontario Regulation 22/04
Component B consists of a utilities compliance with Ontario Regulation 22/04 - Electrical
Distribution Safety. Ontario Regulation 22/04 establishes the safety requirements for the design,
construction, and maintenance of electrical distribution systems, particularly in relation to the
Orangeville Hydro Business Plan 2021-2025 Page 13approvals and inspections required prior to putting electrical equipment into service. Over the past
five years, Orangeville
Hydro was found to be compliant with Ontario Regulation 22/04 (Electrical Distribution Safety).
This was achieved by our strong commitment to safety, and the adherence to company procedures
& policies.
o Component C – Serious Electrical Incident Index
Component C consists of the number of serious electrical incidents affecting the public, including
fatalities, which occur within a utility’s territory. In 2019, Orangeville Hydro had zero fatalities
and zero serious incidents within its territory. Orangeville Hydro will continue to make efforts and
work with the Electrical Safety Authority to continue the safe operation of our distribution
system.
System Reliability
• Average Number of Hours that Power to a Customer is Interrupted
The average number of hours that power to a customer is interrupted is a measure of system reliability
or the ability of a system to perform its required function. Orangeville Hydro views reliability of electrical
service as a high priority for its customers and constantly monitors its system for signs of reliability
degradation. Orangeville Hydro also regularly maintains its distribution system to ensure its level of
reliability is kept as high as possible. The OEB typically requires a utility to keep its hours of interruption
within the range of its historical performance, however, outside factors such as severe weather,
defective equipment, or even regularly scheduled maintenance can greatly impact this measure. For
2019, Orangeville Hydro achieved an average of 0.33 hours of interrupted power, which is less than the
distributor-specific target of 0.90 hours based on our 5-year average performance data. This value is
also significantly less than Ontario Industry Average of 2.64 as stated in the OEB 2019 Yearbook of
Electricity Distributors.
Orangeville Hydro’s distribution system experienced fewer outages in 2019 than our historical average.
The average is expected to return to the historical range in future years.
• Average Number of Times that Power to a Customer is Interrupted
The average number of times that power to a customer is interrupted is also a measure of system
reliability and is also a high priority for Orangeville Hydro. As outlined above, the OEB also typically
requires a utility to keep this measure within the range of its historical performance and outside factors
can also greatly impact this measure. Orangeville Hydro experienced interrupted power 0.39 times
during 2019, which is less than the distributor-specific target of 1.18 based on our 5-year average
performance data. This value is also significantly less than Ontario Industry Average of 1.52 as stated in
the OEB 2018 Yearbook of Electricity Distributors.
Orangeville Hydro’s distribution system experienced fewer outages in 2019 than our historical average.
The average is expected to return to the historical range in future years.
Orangeville Hydro Business Plan 2021-2025 Page 14Asset Management
• Distribution System Plan Implementation Progress
The Distribution System Plan outlines Orangeville Hydro’s forecasted capital expenditures, over a five (5)
year period, which are required to maintain and expand the utility’s electricity system to serve its
current and future customers. The Distribution System Plan Implementation Progress measure is
intended to assess Orangeville Hydro’s effectiveness at planning and implementing these capital
expenditures. Consistent with other new measures, utilities were given an opportunity to define this
measure in the manner that best fits their organization. As a result, this measure may differ from other
utilities in the Province.
Orangeville Hydro defines this measure as the tracking of actual capital project costs to planned capital
project costs, expressed as a percentage. For this measure, Orangeville Hydro will include System
Renewal, System Service, and General Plant capital expenditures. Orangeville Hydro moved to using this
measure in 2015 based on information received from other utilities in the Province. Orangeville Hydro
will continue to participate in the Ontario Energy Board Distribution System Plan Implementation
Progress consultation process.
For 2019, Orangeville Hydro completed 96% of the planned capital expenditures. Since the Distribution
System Plan timeframe had finished in 2018, the value was calculated as follows: the total of actual
capital expenditures for 2014 to 2019, divided by the total budgeted values for 2014 to 2018 multiplied
by 120%.
Cost Control
• Efficiency Assessment
On an annual basis, each utility in Ontario is assigned an efficiency ranking based on its performance. To
determine a ranking, electricity distributors are divided into five groups based on the magnitude of the
difference between their actual costs and predicted costs. In 2019, Orangeville Hydro remained in
Cohort II, where a Cohort II distributor is defined as having actual costs 10% to 25% or more below
predicted costs. Distributors with larger negative differences between actual and predicted costs are
considered better cost performers and therefore eligible for lower stretch factors. The following outlines
the five groups to which the distributors can be allocated and their definitions:
1) Cohort I (Stretch Factor = 0.0%) – Actual costs are 25% or more below predicted costs
2) Cohort II (Stretch Factor = 0.15%) – Actual costs are 10% to 25% or more below predicted costs
3) Cohort III (Stretch Factor = 0.30%) – Actual costs are within +/- 10% of predicted costs
4) Cohort IV (Stretch Factor = 0.45%) – Actual costs are 10% to 25% or more above predicted costs
5) Cohort V (Stretch Factor = 0.60%) – Actual costs are 25% or more above predicted costs
Orangeville Hydro will continue to work efficiently to ensure we stay within Cohort II and investigate
opportunities to improve our cost efficiencies.
Orangeville Hydro Business Plan 2021-2025 Page 15• Total Cost per Customer
Total cost per customer is calculated as the sum of Orangeville Hydro’s capital and operating costs and
dividing this cost figure by the total number of customers that Orangeville Hydro serves. Orangeville
Hydro’s cost performance increased in 2019 to $568 per customer, above the cost performance in 2018
at $551 per customer.
Orangeville Hydro’s Total Cost per Customer has decreased on average by 0.05% per annum over the
period 2011 through 2019. Orangeville Hydro has scrutinized costs to correspond with the level of
expenses as approved in our rate application and has kept costs at a stable level. Like most distributors in
the province, Orangeville Hydro has experienced slight increases in its total costs required to deliver
quality and reliable service to customers, and also has seen a continually increasing customer base.
Province wide programs such as smart meters, time of use pricing, as well as growth in wage and benefits
costs for our employees have all contributed to increased operating costs. Orangeville Hydro’s capital
costs are planned strategically to manage the renewal and growth of the distribution system in a cost-
effective manner.
Orangeville Hydro will continue to replace distribution assets proactively along a carefully managed
timeframe in a manner that balances system risks and customer rate impacts. Going forward, keeping
pace with economic fluctuations, Orangeville Hydro will continue to implement productivity and
improvement initiatives to help offset some of the costs associated with future system improvement and
enhancements and make it our goal to maintain or reduce the cost per customer.
• Total Cost per Km of Line
This measure uses the same total cost that is used in the Cost per Customer calculation above. The total
cost is divided by the kilometers of line that Orangeville Hydro operates to serve its customers. Orangeville
Hydro's 2019 cost per Km of line is $32,501, an increase of 4.1% over 2018 and an overall average decrease
of 1.4% over the period 2012 to 2019. Orangeville Hydro experienced a minimal amount of growth in its
total kilometers of lines. The same cost drivers that apply to the total cost per customer apply to the total
cost per km of line. Orangeville Hydro continues to seek innovative solutions to help ensure cost/km of
line remains competitive and within acceptable limits to our customers.
Conservation & Demand Management
• Net Cumulative Energy Savings
Orangeville Hydro Limited achieved 92% of its six-year Net Cumulative Energy (kWh’s) Savings target of
14,150,000 kWh. This has been achieved by leveraging the suite of OEB approved CDM programs
designed primarily for residential and small commercial classes of customers. The Net Cumulative
Savings Results for 2015-2020 are 11,832 MWh ranking 37th out of 67 LDCs in the province.
Connection of Renewable Generation
• Renewable Generation Connection Impact Assessments Completed on Time
Electricity distributors are required to conduct Connection Impact Assessments (CIA’s) on all renewable
generation connections within 60 days of receiving the required deliverables from the proposed
Orangeville Hydro Business Plan 2021-2025 Page 16Generator. Orangeville Hydro has developed and implemented an internal procedure to ensure
compliance with this regulation. In 2019, Orangeville Hydro did not complete any CIAs.
• New Micro-embedded Generation Facilities Connected On Time
Micro-embedded generation facilities consist of solar, wind, or other clean energy projects of less than
10 kW that are typically installed by homeowners or small businesses. In 2019, Orangeville Hydro
connected zero new micro-embedded generation facility within its territory. In the past any projects
were connected within the prescribed timeframe of five (5) business days, which significantly exceeds
the Ontario Energy Board’s mandated target of 90% for this measure. Orangeville Hydro’s process for
these projects is well documented and Orangeville Hydro works closely with its customers and their
contractors to ensure the customer’s needs are met and/or exceeded. Orangeville Hydro expects the
trend for this measure to continue to exceed the mandated target for the foreseeable future.
Financial Ratios
• Liquidity: Current Ratio (Current Assets/Current Liabilities)
As an indicator of financial health, a current ratio indicates a company’s ability to pay its short-term debts
and financial obligations. Typically, a current ratio between 1.5 and 3 is considered good. If the current
ratio is below 1, then a company may have problems meeting its current financial obligations. If the
current ratio is too high, then the company may be inefficient at using its current assets or its short-term
financing facilities.
Orangeville Hydro’s current ratio increased slightly from 1.56 in 2018 to 1.74 in 2019, which is still
indicative of a financially healthy organization. Orangeville Hydro’s current ratio is expected to remain
healthy into the foreseeable future.
• Leverage: Total Debt (includes short-term and long-term debt) to Equity Ratio
The debt to equity ratio is a financial ratio indicating the relative proportion of shareholders' equity and
debt used to finance a company's assets. The Ontario Energy Board (OEB) uses a deemed capital structure
of 60% debt, 40% equity for electricity distributors when establishing rates. This deemed capital mix is
equal to a debt to equity ratio of 1.5 (60/40). A debt to equity ratio of more than 1.5 indicates that a
distributor is more highly leveraged than the deemed capital structure. A high debt to equity ratio may
indicate that an electricity distributor may have difficulty generating sufficient cash flows to make its debt
payments. A debt to equity ratio of less than 1.5 indicates that the distributor is less leveraged than the
deemed capital structure. A low debt-to-equity ratio may indicate that an electricity distributor is not
taking advantage of the increased profits that financial leverage may bring.
Orangeville Hydro’s debt to equity rate was 1.15; or 53% debt to 47% equity in 2019. Orangeville Hydro
strives to maintain a debt to equity structure that closely resembles the ratio expected by the OEB.
Orangeville Hydro expects its debt to equity ratio to remain close to the expected norm into the
foreseeable future.
Orangeville Hydro Business Plan 2021-2025 Page 17• Profitability: Regulatory Return on Equity – Deemed (included in rates) Return on equity (ROE) measures the rate of return on shareholder equity. ROE demonstrates an organization’s profitability or how well a company uses its investments to generate earnings growth. A utility’s ROE should be within the +/-3% range allowed by the Ontario Energy Board (OEB). Orangeville Hydro's last cost of service application was approved by the OEB and commenced on May 1, 2014. The approved rates include an expected (deemed) regulatory return on equity of 9.36%. When a distributor performs outside of this range, the actual performance may trigger a regulatory review of the distributor’s revenues and costs structure by the OEB. • Profitability: Regulatory Return on Equity – Achieved Orangeville Hydro’s return on equity achieved in 2019 was 10.36%, which is within the deemed ROE set by the Ontario Energy Board (OEB) of 9.36%, and a slightly lower ROE than 2018. The average return over the past 9 years was 8.74% and has continued to be within the OEB allowed range of +/-3%. Orangeville Hydro will continue to seek process improvements, find efficiencies, and manage costs while delivering on the operational and capital programs that have been put before the OEB. Orangeville Hydro will continue to deliver electricity to its customers in a safe, reliable, and efficient manner that provides good value for money while being responsive to customer and community needs and contributing to provincial and local public policy objectives. Orangeville Hydro Business Plan 2021-2025 Page 18
Pacific Economics Group (PEG) Report

The PEG report compares utilities’ cost efficiencies on a consistent basis and is publicly available on the
OEB website. PEG produces an annual report that provides a ranking of the utilities included in the study,
summarizes the results, and provides insight into the trends in utility efficiency scoring. Orangeville Hydro
has been assigned a Group 2 efficiency ranking again for 2019, moving from Group 3 in 2017. (Group 2 as
per PEG 3-year average). Orangeville Hydro strives to remain in the Group 2 while still achieving greater
efficiencies through productivity improvements and cost control, without compromising safety and
reliability. The utility is continuously looking for ways of finding efficiency in its Operations, Maintenance
and Administration costs thus reducing rates.

                                    Table 4: PEG Past Performance (Stretch Factor)

                                            2014           2015           2016       2017         2018       2019
Stretch Factor Cohort - Annual result         3              3             3           2           2           2
Associated Stretch Factor Value             0.30           0.30           0.30       0.15         0.15       0.15

The summary of cost performance results shows the actual total cost on an annual basis used to complete
the PEG analysis. A negative percentage difference means that actual total costs are less than predicted
costs. Shown below, the differential between actual total cost and predicted costs becomes increasingly
larger with each year, which is why in 2017 Orangeville Hydro was moved to Group 2. Moving to Group
2 would historically have provided Orangeville Hydro with a larger increase in distribution revenue as a
bonus for increased cost efficiencies.

In 2020, when Orangeville Hydro received its Cost of Service deferral approval for 2021 rates, the OEB
determined that Orangeville Hydro will complete its next IRM rate application using the Annual IR
methodology. This means that for 2021 rates, the distribution revenue increase will be smaller than in
previous years, as the stretch factor value is .6% as opposed to .15% for Group 2 utilities. The estimated
increase in distribution rates for 2021 will be 1.4%, which is calculated as 2.0% Price Escalator (which may
be updated at a later date) minus .6% Stretch Factor.

                                    Table 5: Summary of Cost Performance Results

                                                 2014           2015        2016          2017        2018       2019
Actual Total Cost                       $   6,743,925 $    6,848,039 $ 6,904,089 $   6,836,145 $ 6,933,646   7,182,788
Percentage Change on previous year                              1.5%        0.8%        -0.98%       1.43%      3.59%
Percentage Difference (Cost
Performance) per PEG Analysis                      -4.0%          -7.6%    -10.2%       -14.3%      -20.0%     -20.7%

Distribution Revenue
The Ontario Energy Board compiles an annual Yearbook which contains various financial and non-financial
statistics of all utilities in the province. This report allows comparison between Orangeville Hydro and
LDCs with similar characteristics, as well as neighbouring LDCs. The following charts highlight the efforts
taken by Orangeville Hydro to keep the distribution revenue rates lower than many other LDCs for our
customers. A three-year average from 2017-2019 was chosen to reduce the effect of anomalous data
points that occur within a single year.

Orangeville Hydro Business Plan 2021-2025                                                                    Page 19
Table 6: Distribution Revenue - Residential Customer rate per month
Distribution Revenue - Residential Customer per month
$70.00
$65.16
$60.00
$50.00
$40.00
$28.77 $29.01
$30.00
$26.22
$20.00
$10.00
$-
OHL LDCs in 100 km radius Greater Golden Horsheshoe Hydro One
Table 7: Distribution Revenue – General Service < 50 kW Customer rate per month
Distribution Revenue - General Service < 50 per month
$160.00
$140.69
$140.00
$120.00
$100.00
$80.00
$70.26 $70.75
$60.77
$60.00
$40.00
$20.00
$-
OHL LDCs in 100 km radius Greater Golden Horsheshoe Hydro One
Orangeville Hydro Business Plan 2021-2025 Page 20Table 8: Distribution Revenue – General Service > 50 kW Customer rate per month
Distribution Revenue - General Service > 50 per month
$2,000.00
1,897.96
$1,800.00
$1,600.00
$1,400.00
$1,200.00
1,023.36
978.19
$1,000.00
$800.00
$600.00 $545.15
$400.00
$200.00
$-
OHL LDCs in 100 km radius Greater Golden Horseshoe Hydro One
Orangeville Hydro Business Plan 2021-2025 Page 21Historical and Proposed Revenues
The historical customer growth has allowed Orangeville Hydro’s overall distribution revenue to increase
without increasing the distribution revenue per customer. In 2020, due to the COVID-19 pandemic, a
decision was made to defer the May 1, 2020 distribution rate increase to November 1, 2020. This meant
that the May 1, 2019 rates continued until November 1, 2020. On November 1, 2020, a small additional
fixed and variable rate was added to recover these deferred revenues. This additional rate continues until
October 31, 2021. On May 1, 2021 it is expected there will be another small rate increase, due to the
completion of the Annual IR rate application.
Table 9: Historical and Proposed Distribution Revenues
2014 2015 2016 2017 2018 2019 2020 2021
Residential Fixed Rate $ 15.25 $ 15.45 $ 18.19 $ 21.00 $ 23.72 $ 26.62 $ 26.74 $ 27.42
Variable Rate $ 0.0131 $ 0.0133 $ 0.0102 $ 0.0069 $ 0.0035 $ - $ - $ -
Customers 10,407 10,570 10,730 11,084 11,285 11,367 11,419 11,517
kWh 85,735,759 84,589,267 84,770,868 82,405,642 91,698,339 94,935,768 100,669,968 101,483,825
Revenues $ 3,187,626 $ 3,090,922 $ 3,200,973 $ 3,352,629 $ 3,602,177 $ 3,682,037 $ 3,860,058 $ 3,880,404
GS50 Fixed Rate $ 160.00 $ 162.08 $ 165.00 $ 167.64 $ 169.15 $ 171.43 $ 172.22 $ 176.62
Variable Rate $ 2.1482 $ 2.1761 $ 2.2153 $ 2.2507 $ 2.2710 $ 2.3017 $ 2.3124 $ 2.3718
Customers 137 138 141 132 134 132 132 133
kWh 119,994,247 124,173,673 124,528,148 129,453,609 125,990,621 128,262,888 126,101,795 128,641,694
Revenues $ 816,710 $ 826,561 $ 888,196 $ 870,180 $ 857,752 $ 891,714 $ 844,967 $ 985,219
Sentinel Lights Fixed Rate $ 3.12 $ 3.16 $ 3.22 $ 3.27 $ 3.30 $ 3.34 $ 3.36 $ 3.44
Variable Rate $ 12.1717 $ 12.3299 $ 12.5518 $ 12.7526 $ 12.8674 $ 13.0411 $ 13.1018 $ 13.4380
Connections 141 151 152 151 155 155 158 158
kWh 103,151 103,889 90,200 102,865 102,422 105826 107948 108177
Revenues $ 7,254 $ 7,339 $ 8,482 $ 8,096 $ 8,362 $ 10,064 $ 10,259 $ 10,495
Streetlights Fixed Rate $ 1.42 $ 1.44 $ 1.47 $ 1.49 $ 1.50 $ 1.52 $ 1.53 $ 1.57
Variable Rate $ 7.8391 $ 7.9410 $ 8.0839 $ 8.2132 $ 8.2871 $ 8.3990 $ 8.4378 $ 8.6530
Connections 2,915 2,851 2,845 2,890 2,939 2939 2940 2940
kWh 1,832,465 1,670,532 961,396 897,958 870,907 907844 926583 926701
Revenues $ 91,595 $ 91,113 $ 52,294 $ 71,690 $ 73,088 $ 74,954 $ 75,619 $ 78,266
USL Fixed Rate $ 5.95 $ 6.03 $ 6.14 $ 6.24 $ 6.30 $ 6.39 $ 6.48 $ 6.59
Variable Rate $ 0.0083 $ 0.0084 $ 0.0086 $ 0.0087 $ 0.0088 $ 0.0089 $ 0.0090 $ 0.0092
Connections 73 96 97 97 97 97 97 97
kWh 386,058 382,131 353,441 400,466 375,337 387,372 393,390 393,390
Revenues $ 10,158 $ 10,401 $ 10,939 $ 10,928 $ 40,430 $ 11,039 $ 11,268 $ 11,500
TOTAL kWh 242,533,277 244,733,765 244,695,490 247,523,480 254,757,654 261,589,351 263,713,992 267,993,834
Revenues $ 4,908,779 $ 4,777,622 $ 4,926,426 $ 5,232,741 $ 5,364,768 $ 5,526,725 $ 5,650,960 $ 5,851,986
Bill Impacts
Since our last Cost of Service for 2014 rates, Orangeville Hydro’s residential rate increases excluding rate
riders have been near or below the rate of inflation. The transition to a fully fixed residential service
charge has helped to ensure a stable source of revenue for Orangeville Hydro as well as ensuring more
consistency for our residential customers energy costs. Overall residential bill impacts include rate riders,
which are in place for the recovery of deferral and variance accounts from pass through charges
Orangeville Hydro Business Plan 2021-2025 Page 22(regulatory assets and liabilities). As noted above, the May 1, 2020 rate change was deferred to November
1, 2020.
Table 10: Residential Bill Impacts (Distribution Only)
Excluding Rate Riders (incl. SME charge)
2014 2015 2016 2017 2018 2019 November 1, 2020
Residential Fixed Rate $ 16.04 $ 16.24 $ 18.98 $ 21.79 $ 24.29 $ 27.19 $ 27.92
Variable Rate $ 0.0131 $ 0.0133 $ 0.0102 $ 0.0069 $ 0.0035 $ - $ -
Total (700 kWh) $ 25.21 $ 25.55 $ 26.12 $ 26.62 $ 26.74 $ 27.19 $ 27.92
Bill Impact 1.35% 2.23% 1.91% 0.45% 1.68% 2.68%
Including Rate Riders
2014 2015 2016 2017 2018 2019 November 1, 2020
Residential Fixed Rate $ 17.08 $ 17.28 $ 19.15 $ 21.96 $ 24.46 $ 27.35 $ 28.08
Variable Rate $ 0.0120 $ 0.0137 $ 0.0117 $ 0.0064 $ 0.0031 $ 0.0011 $ 0.0011
Total (700 kWh) $ 25.48 $ 26.87 $ 27.34 $ 26.44 $ 26.63 $ 28.12 $ 28.85
Bill Impact 5.46% 1.75% -3.29% 0.72% 5.60% 2.60%
Table 11: Historical Distribution Revenue per Customer
Distribution Revenue per Customer
$600
$550
$500
$450
$400
$350
$300
$250
$200
2014 2015 2016 2017 2018 2019
OHL All LDC's
Orangeville Hydro Business Plan 2021-2025 Page 238. Capital Spending
Key Objectives for Capital Expenditures
The key objectives for Orangeville Hydro’s capital expenditures over the next five years include:
• Ensuring our existing and future customers enjoy the benefit of a safe and reliable distribution system,
• Ensuring our staff can work safely on and near the distribution system,
• Mitigating the inherent risks of a distribution system through an effective asset management
program,
• Ensuring our load, generation, and storage customers have access to the distribution system as well
as a long-term secure supply of energy, and
• Ensuring all regulatory compliance obligations are achieved.
System access expenditures for 2021 to 2025 are expected to be comparable to the historical average of
2014 to 2020. System Access projects encompass customer requests for service connections and
subdivisions. Growth will occur from new subdivisions, infill developments, and intensification
developments. Considering these expenditures are based on customer demand, this forecast is subject
to change.
System renewal expenditures for 2021 to 2025 are expected to be comparable to the historical average
of 2014 to 2020. These expenditures are to improve the distribution system by either replacing assets or
extending the original service life of the major assets such as poles, transformers, switches, switching
cubicles, and revenue meters. Considering these expenditures can be affected by the quantity of major
assets that fail in a specific year, this forecast is subject to change.
System service expenditures for 2021 to 2025 are expected to be comparable to the historical average of
2014 to 2020. These projects are planned to ensure the distribution system continues to meet operational
objectives, while addressing future needs. The expenditures within this 5 year plan are significantly driven
by Orangeville Hydro’s voltage conversion program as well as conductor upgrades.
General Plant expenditures for 2021 to 2025 are expected to be comparable to the historical average of
2014 to 2020. General Plant expenditures are for non-distribution assets, such as land, building, office
equipment, computer hardware, vehicles, and small equipment. Intangibles are included in General Plant
and include land rights and computer software.
Orangeville Hydro Business Plan 2021-2025 Page 24You can also read