OUTA SUBMISSION TO NERSA ON ESKOM'S RCA 2018/19 APPLICATION - LIZ MCDAID OUTA PARLIAMENTARY ADVISOR AND ENERGY ADVISOR
←
→
Page content transcription
If your browser does not render page correctly, please read the page content below
OUTA submissiontoNERSA
 onEskom’ sRCA 2018/
                   19
       appl
          icati
              on

    Li
     zMcDai
          d
    OUTAParl
           iament
                aryAdvi
                      sorandEner
                               gyAdvi
                                    sor
    l
    iz.
      mcdai
          d@outa.
                co.za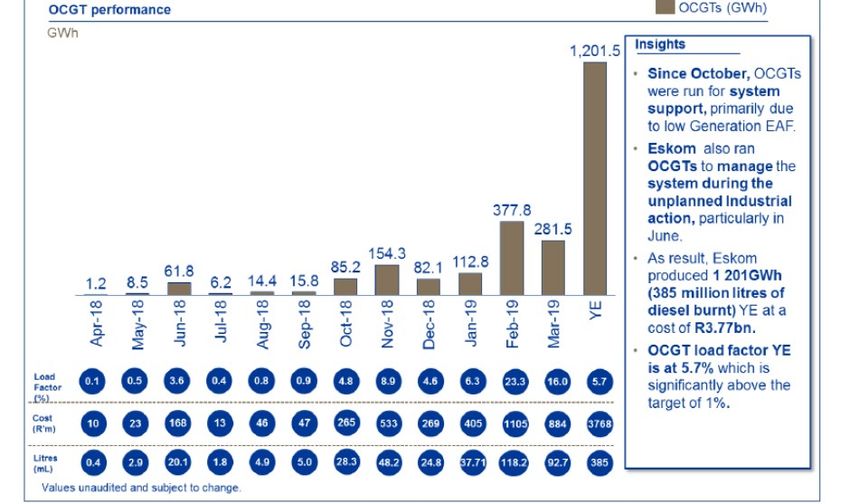
Contents
1.     Introduction .................................................................................................................................... 1
2.     The RCA process: Repeating the same pattern but expecting different results............................. 3
3.     RCA 2019 repeats the demand problem......................................................................................... 4
4.     Operating costs ............................................................................................................................. 11
5.     Coal costs ...................................................................................................................................... 15
6.     Staff costs ...................................................................................................................................... 16
7.     Medupi and Kusile ........................................................................................................................ 17
8.     Financing the gap .......................................................................................................................... 17
9.     Conclusions ................................................................................................................................... 18
Appendix A ............................................................................................................................................ 19
1. Introduction

The Organisation Undoing Tax Abuse (OUTA) is a non-profit civil action organisation dedicated to
working for a better South Africa. OUTA was established to challenge the abuse of authority, in
particular the abuse of taxpayers’ money. We have a strong interest in the electricity pricing process,
because state-owned entity Eskom has been mismanaged for years, resulting in higher prices and
social hardship for consumers, substantial bailouts with taxpayers’ funds which should have been
available for alternative spending, and a devastating effect on the economy.

This is OUTA’s submission on Eskom’s application to NERSA for Regulatory Clearing Account (RCA)
revenue for 2018/19 1 (RCA 2019).

Table 1 below summarises Eskom’s application:

1
    Eskom. August 2019. Regulatory Clearing Account (RCA) FY2019 Submission to NERSA.

                                                      1
From a reading of the rules 2 that NERSA has created around the review of Eskom revenue and what
costs can be passed through to Eskom’s customers, it appears that the RCA was set up to deal with
coal cost variances which Eskom could not reasonably accurately forecast (see Appendix A). We
deduce this as NERSA states that other primary energy costs are considered stable and less risky, and
cannot be passed through.

If RCA is mostly concerned with coal costs and costs that Eskom could not have predicted, this is the
lens that NERSA has created to scrutinise any application for more money that Eskom could present.

Critically, NERSA states that only prudent and efficient costs will be allowed: “Whether a cost is
prudently incurred depends on how the decision to incur the cost was made, not the outcome of the
decision.” 3

Prudent action would mean that Eskom should be able to show how it has accounted for the
changing context in which it operates and how, despite genuine attempts to do so, it has failed to
generate the predicted revenue. It is our contention that Eskom fails dismally in this regard and
accordingly should not be allowed any additional revenue but should meet its shortfall through
other means.

OUTA believes that Eskom has consistently failed to carry out its homework in predicting its demand,
and therefore its revenue, and in its choice of energy supply, has failed to apply a consistent
comparative method.

OUTA submitted a summary of points to NERSA which we then elaborate on:

a. The RCA process should be reviewed as it has outlived its usefulness. This process effectively
   allows Eskom to overstate its sales predictions and understate its operating costs, then go back
   to NERSA to get the extra funds.
b. Eskom routinely overstates its sales predictions. This is because Eskom does not pay attention to
   the real world, where higher electricity prices and the increasing use by customers of embedded
   generation lower the demand.
c. Eskom’s cost calculations are questionable. The future of South Africa’s economy depends on
   choices which Eskom makes. Costs incurred due to incorrect calculation of energy production
   costs cannot be passed through.
d. Medupi and Kusile are years behind schedule and over budget, leaving Eskom with lower
   generation capacity than it should have plus higher costs for these power stations.
e. Eskom spent R3.4bn more on diesel for the expensive OCGT generators to mitigate against load
   shedding, due to excessive breakdowns which should have been avoided.
f. Staff costs are still out of control.
g. Eskom doesn’t compare like-for-like when comparing the costs of electricity produced from coal
   and from renewable energy IPPs. The renewables do not attract an environmental levy (a cost of
   about R7.8bn for Eskom for the year, charged on coal generation but not include in those costs),
   and Eskom also runs staff costs (including staff used on power stations) as a separate cost. These
   artificially lower the cost of coal-fired generation.

2
  NERSA: No date. Multi-Year Price Determination Methodology. Available at
http://www.nersa.org.za/Admin/Document/Editor/file/Electricity/Legislation/Methodologies%20and%20Guid
elines/MYPD%20regulatory%20methodology%20-%20%2020%20Nov%20_2_.pdf
3
  NERSA: August 2018. Guidelines for Prudency Assessment. Page 29. Available at
http://www.nersa.org.za/Admin/Document/Editor/file/RegulatorsDecisions/Cross%20Cutting/Guidelines%20f
or%20Prudency%20Assessment-%20August%202018.pdf

                                                  2
h. Eskom assumes that whatever prices it charges, customers will pay.
In this submission, OUTA expands on the above points.
2. The RCA process: Repeating the same pattern but expecting
different results
Civil society returns very year to present to NERSA on Eskom’s applications for yet another tariff
increase. We have noticed the same arguments being raised year after year and yet we do not see
an improvement. We provide a brief review of previous inputs made at public hearings.
In 2012, EGI-SA said this: “Interestingly, Eskom states in its MYPD3 application that “Price is more
effective at promoting investment into energy-efficiency technologies than incentive schemes or
other factors. If price levels provide the correct signals, consumers will respond by limiting electricity
use and employing more energy-efficient technologies, reducing demand.” Does this mean that
Eskom accepts that price is a driver of reduced demand? …… And yet, Eskom’s MYPD3 application
assumes that, contrary to what price elasticity trends have shown, electricity demand will increase
by 1.9% compound annual growth a year over the MYPD 3 period” 4.
In December 2014, Eskom failed to sell enough electricity to meet its revenue target. It was then
allowed to raise electricity prices further in order to hopefully make enough money to make up the
shortfall in revenue. This didn’t work in 2009. How was repeating the mistake in 2014 going to fix
the problem? Clearly it didn’t.
And now Eskom has returned again, with the same story, and wants the people of South Africa to
bail it out again.
Again, if we look at past civil society input into 2013-14RCA:
Eskom also underspent on its demand side management programmes and its energy
efficiency programmes (R905m plus R316m (pg 22). However, given Eskom’s past
history, prudent operating would have not assumed 82 to 83% EAF, or new build
commission that was over optimistic. And, if additional power had been saved through
efficiency, less revenue would have been spent on expensive coal, diesel etc and thus it is
difficult to see how these actions of Eskom are in any way “prudent”.
The current overall methodology allows Eskom to regain revenue lost due to lower
demand for electricity and lower economic growth. These trends are likely to continue,
leading to a cycle of decreasing electricity sales and increasing electricity tariffs. It
appears that there is a need to review the methodology as in its current state, there is no
incentive for Eskom to apply its mind to solving the problem, as it can always rely on the
RCA to bail it out.
The second example is drawn from data supplied by Eskom in its application (pg 154).
During 2013/14, Eskom spent R1.36bn on DSM whereas the MYPD3 decision for the
2013/14 financial year was R1.46bn. The progammes installed resulted in 409MW of
savings during the year. To save energy costs R1.36bn for 409MW = R2.53m per MW.
4 EGI-SA submission to NERSA 20 November 2012
3Illustratively, to build coal, Medupi cost R105bn for 3990MW = R26.30m per MW, an
order of magnitude higher. But Medupi is not up and running properly yet, and we are
reliant on even more expensive electricity generation. 5
The expensive diesel OCGT plants are running far more than anticipated at significant
expense. In other words, Eskom failed to implement energy savings but still wants
consumers to pay for its inability to implement electricity services in the most cost
efficient way 6.
The above points are provided as part of a historical narrative. Civil society comments are on the
record. The question is that with that history at hand, what makes up Eskom’s argument for this
round of tariff increases?
OUTA commends NERSA for its latest MYPD4 methodology (2018) which attempts to further
regulate the details of how and which cost variances should be passed through to the customer.
However, Eskom’s application seems to continue using the same justifications as it has used in
previous years and it is difficult to see how the new methodology will reduce the runaway electricity
tariff hikes.
3. RCA 2019 repeats the demand problem
According to Eskom’s RCA application, “Electricity sales during the period under review reflect a
challenging macro-economic environment. The extreme drought conditions and depressed
commodity prices put a damper on electricity sales in the agricultural and mining sectors
respectively.” 7
This may be the case but the question is whether Eskom could have foreseen the challenging macro-
economics and the drought.
Agriculture
The RCA application claim on drought depressing agricultural sales is contradicted by Eskom’s own
statistics. On page 44 of the RCA application, the variances between projected and actual electricity
sales are provided. There is a variance of 111 GWh higher than the prediction. On page 47, there is
an explanation for the increased sales: “This sector ended the year with a 111 GWh more than
assumed in decision. This is due to the Free State, North West, Limpopo and Mpumalanga Eskom
regions contributing a combined 113 GWh. The higher sales are mainly due to increased water
pumping following the extreme temperatures and low rainfall experienced during the year,
especially in the Western Cape”.
It is difficult to reconcile the statement on page 9 with the statement on page 47. Eskom is claiming
that agriculture electricity sales declined and should be compensated for this loss of income, but its
own data show that sales increased.
5
With grateful thanks to Richard Halsey of Project90x2030.
6 From EG-SA member SAFCEI in submission to NERSA re Eskom’s RCA 2013-2014 application.
7 Eskom. August 2019. Regulatory Clearing Account (RCA) FY2019 Submission to NERSA. Page 9.
4Agriculture is charged the highest price of any sector by Eskom: 149.79c/kWh in 2018/19, compared
to the average price in SA of 91.64c/kWh. This is an extra cost of R166m to the sector, which must
have been devastating during a drought.
Mining
The second point at issue in the statement on page 9 relates to a decrease in mining-related
electricity sales.
According to Eskom, the mining sector contracted by 13.7% in 2018 as compared to an expansion of
21.6% in the prior period (RCA application page 43). In the variance table on page 44, it can be seen
that mining declined by 1 622GWh.
What was the financial implication of this?
Eskom charged mining 91.64c/kWh in 2018/19, so this was a loss in revenue of R1.486bn. If the cost
of producing electricity (71.25c/kWh in 2018/19, a total of R1.156bn) is deducted, Eskom lost a
profit of about R331m.
Could this have been reasonably predicted?
In 2016, Prof Jan du Plessis wrote: “Escalating electricity costs have become one of the biggest
expenditure drivers in mining operations. During the last eight years, energy costs have trebled
when expressed as a percentage of total running cost in South African mines”. 8
In 2014, the Department of Energy produced its first monitoring report on Energy Efficiency, in
which it stated: “Measured in terms of energy consumed per unit of value-added, the energy
intensity of the industry & mining sector decreased by 29.9% between 2000 and 2011”. 9 The report
did speak of variances but it was commenting on trends. In 2017, Goldfields proposed a 40MW solar
plant for its deep-south mine. 10 In a 2016 media article, Gold Fields CE Nick Holland said South
Deep’s annual power bill had reached R500m, forcing the group to seek alternative energy sources.
“If that doubles in five years, that's another R500m for us a year,” Holland said. “What about the rest
of the industry? How are they going to cope?” 11
Eskom, in its MYDP3 RCA application for 2013/14 12 (RCA 2013/14) stated that the contribution of the
energy intensive mining sector was starting to “dwindle” (Eskom RCA page 43).
Also in Eskom’s RCA 2013/14 application it stated that “The MYPD 3 sales growth over the 5 year
period (i.e. 2013/14 to 2017/18 volumes) was assumed to be 7.3% while the actual average growth
8
Prof Jan du Plessis. 18 January 2016. Energy efficiency in the mining industry. Published in BizCommunity.
Available at https://www.bizcommunity.com/Article/196/723/139231.html
9
Department of Energy. 2014. South Africa’s Energy Efficiency Targets: First annual monitoring report.
Available at: http://www.energy.gov.za/EEE/reports/First-Annual-Monitoring-Report.pdf
10
Tsakani Lotten Mthombeni. 22 November 2016. The role of alternative energy in addressing mining’s energy
challenges: our experience. Available at: https://rmi.org/wp-content/uploads/2017/10/RMI-GoldFields-Role-
Alternative-Energy-Addressing-Mining-Challenges.pdf
11
Dineo Faku. 16 August 2019. Gold Fields raises concerns over power costs at its South Deep mine.
Independent Online. Available at: https://www.iol.co.za/business-report/companies/gold-fields-raises-
concerns-over-power-costs-at-its-south-deep-mine-30842364
12
Eskom. November 2015. MYPD 3 (Year 2013/14) Regulatory Clearing Account Submission to NERSA.
Available at http://www.nersa.org.za/Admin/NewsAndPublication/UploadImages/MYPD3%20-2013-14-
%20Regulatory%20Clearing%20Account%20-%20Submission%20to%20NERSA3736132015013630.pdf
5rate per annum amounts to 1.8%”(page 43). In the Eskom reopener (April 2015) 13, Eskom once
again acknowledged that “Even though the demand for electricity has not increased as assumed
since the MYPD 3 decision, the challenges faced with the supply options have resulted in significant
shortfalls” (our emphasis).
Industrial
Eskom in its RCA 2013/14 application notes a decline in industrial sales (5 156 GWh) due to
commodity prices and moves to alternative energy sources, and a decline in mining (3 555 GWh) due
to “labour unrest” and the commodity prices etc.
For this 2019 RCA, Eskom shows that the industrial sector showed an increase in sales of 567 GWh.
This was attributed to “the offer”. In Feb 2017, a media article suggested that Eskom was going to
offer special pricing agreements to industrial customers because it had a surplus of electricity 14.
However, the article stated “In the past when Eskom had excess supply, it followed a similar policy
with the sale of cheap electricity to South32, formerly BHP Billiton, and its large aluminium smelters,
Hillside and Bayside in Richards Bay, and Mozal in Mozambique. But the contracts hurt the utility
financially and, during load-shedding, public anger was directed at the smelters because of their
drain on power”.
The Department of Energy published the framework for short-term negotiated pricing agreements
(NPAs), to sustain and grow the South African economy through increased electricity consumption.
This framework dated 22 June 2018 contains the following clauses 15:
The Framework for Short-term NPAs (hearafter STF) has been specifically structured to
provide opportunities to sustain existing businesses that are at risk of failure and permit
others that have closed production capacity in recent years, owing to their inability to
compete in their markets, to restart these assets. This will increase the utilisation of SA’s
electricity infrastructure, resulting in a lower unit cost of electricity than would otherwise
be the case, to the ultimate benefit of all electricity consumers in SA. The major economic
benefits to SA anticipated from implementation of the STF may be summarised as
follows:
• Direct and indirect jobs saved by preventing a number of business failures;
• Direct and indirect jobs saved by avoiding the closure or mothballing of Eskom
generation capacity;
• New direct and indirect job opportunities owing to the restarting of unused
productive capacity;
• Increased economic activity;
• Lower unit cost of electricity;
• Higher tax and Electricity Levy collections;
• Stronger Rand from an improved Balance of Payments; and
13
Eskom. MYPD 3. Re-opener for selective items (2015/16-2017/18): OCGTs and STPP including the impact of
environmental levy changes. Available at:
http://www.nersa.org.za/Admin/Document/Editor/file/Consultations/Electricity/Documents/MYPD%203%20R
eopener%20with%20levy%2030042015Publishable%20(6).pdf
14
Lynley Donelly. 10 February 2017. Can Eskom woo the big spender? Mail & Guardian. Available at:
https://mg.co.za/article/2017-02-10-00-can-eskom-woo-the-big-spenders/
15
Department of Energy. 22 June 2018. Framework for short-term negotiated pricing agreement to sustain and
grow the South African economy through increased electricity consumption. Available at:
http://www.energy.gov.za/files/policies/Electricity-Pricing-Policy-Position14Negotiated-Pricing-
Agreements.pdf
6• Reduced Social Grant burden on the fiscus.
As Eskom appears to have signed up industrial companies for cheap power, the increase in industrial
sales in the RCA application is assumed to be due to the lower tariffs. It is not clear whether, if the
RCA is successful, those customers who have signed these NPAs will then be exempt from RCA tariff
increases.
It is therefore difficult to conclude that as electricity prices increase, Eskom should not have
foreseen an overall decline in industry and mining electricity revenue.
From the special pricing arrangements, it would seem that Eskom foresaw a reduction of sales and
tried to tie industrial customers into longer term pricing contracts. While this might be an attempt
to stem sales reductions, if the revenue gained is not at the level of the tariff that Eskom claims it
needs, then how does it help Eskom’s financial viability?
It is also clear that instead of trying to rein in electricity price increases, the Department of Energy is
providing a mechanism for Eskom to selectively exempt certain customers. This appears to be
increasing inequity and OUTA views such retrograde steps with alarm.
Municipal and residential
Page 44 of the RCA application states this:
Municipalities ended the year 986 GWh below what was assumed: 16
• Western Cape region contributed 301 GWh less than assumed, as a result of
intensive energy savings in the Cape Metro and various other municipalities in the
Western Cape. The impact from the drought in the Western Cape also negatively
affected the sales.
• Kwa-Zulu Natal (KZN) region was 574 GWh lower than assumed mainly due to
Richards Bay Alloys switching off their two furnaces. In addition, Karbochem lowered
production due to feedstock shortages and technical plant problems.
• The Southern region (Eastern Cape) was 122 GWh lower than what was assumed due
to third party infeed or wheeling which offset the consumption taken from Eskom in
Nelson Mandela Bay municipality.
According to Eskom, municipal sales declined in the Western Cape due to energy savings, in KZN due
to industrial closures, and in the Southern Cape due to a wheeling arrangement. Could these
reductions have been predicted by Eskom?
We will not discuss the KZN industrial demand as we think it is covered by referring back to the
industry discussion in the section above.
We would highlight the Southern Cape wheeling agreement with the Nelson Mandela Bay
municipality. In a February 2018 media article, the wheeling agreement is described, arising from a
pilot in 2006, obtaining a licence in 2013-2014 and expanding from there. 17
16
Pg 44 of the RCA application 2018/19
17
Antoinette Slabbert. 12 February 2018. Electricity trading is alive and growing in South Africa. Moneyweb.
Republished in Cape Business News. Available at: https://www.cbn.co.za/news/electricity-trading-is-alive-and-
growing-in-south-africa/
7We would therefore ask how it is possible that Eskom could not have foreseen a reduction in sales
from this existing operation in the Southern Cape.
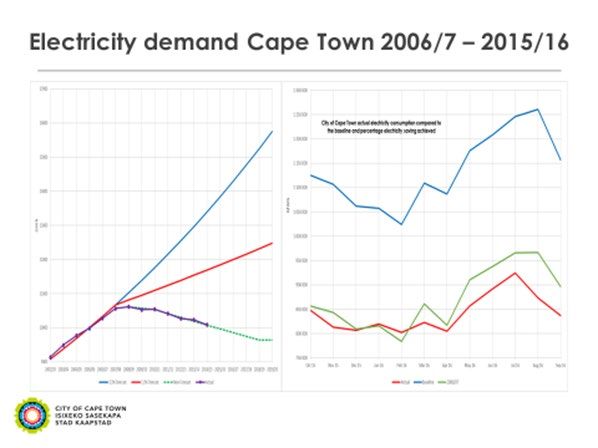
For the Western Cape issue, we refer to the city of Cape Town submissions to various NERSA
hearings in the past.
The above slide has been presented at various NERSA hearings and at other tariff related hearings.
The trend is clear. Yet in the MYPD4 application, Eskom again claimed that municipal demand made
up 41% of their sales and would increase each year 18.
In the 2015 MYPD 3 re-opener, SALGA made the following comments:
SALGA asserts that implementing the selective reopener will result in further increasing
non-payment and electricity theft. Both of these will negatively affect municipalities and
will in turn lead to more distributing municipalities defaulting on their bulk electricity
payments to Eskom. It is proposed that a less steep path of price increases should be
considered. SALGA is committed to the financial viability and long term sustainability of
Eskom. SALGA proposes that the end customer has a burden of a higher than inflationary
tariff increase to bail out the utility. This is deemed unfair, unaffordable and unjustified. 19
In the 2013/14 RCA application Eskom notes:
Historically, payments by municipalities are strongly correlated to them receiving the
equitable share from National Treasury. Previously this funding was sufficient to settle
outstanding electricity debt, but this is no longer the case with municipalities facing
increased electricity prices and reduced funding.
The media over the last few years have raised the issue of non-payment of municipal electricity
accounts. This is common knowledge as is the impact of the rising cost of electricity on the ability of
the poorer and more vulnerable citizens to pay.
This is not a new phenomenon as indicated by the following in a 2011 HSRC report:
18
Distribution Licensee MYPD4 September 2018 (page 24). Eskom.
19
Page 24 of Eskom MYPD3 reopener application 2015
8We looked at the impact of a once-off 25% increase in the electricity price. In this case,
the Consumer Price Index (CPI) for all households rises by 0.88%, with 0.53% coming from
direct effects and 0.35% from indirect effects. The impact is greater on poor households
than on rich ones. This is driven almost entirely by the direct impact, which in turn is
driven by the relative shares of total expenditure on electricity. Thus the richest
households allocate 0.8% of their expenditure to electricity, so the 25% price rise raises
their expenditure by 0.2%. By contrast, the poorest households spend 5.4% of
expenditure on electricity, so the 25% increase raises their expenditure by 1.35%. Against
this, the indirect effects are relatively uniform across household groups, contributing
0.40% to the CPI increase for the poorest and 0.32% to that for the richest”. 20
Rising residential tariffs over the last decade have certainly continued to impact more on the poor
and vulnerable in the same way as highlighted above. Rising electricity tariffs are unsustainable, and
we would argue a driving force for increasing inequity in the country.
StatsSA pointed out that by 2018, municipalities were increasingly using off-grid energy to service
some indigent households, through the implementation of Free Basic Alternative Energy (FBAE).
From this article: “To what extent are municipalities providing these sources, including solar energy?
Of South Africa’s 213 local and metropolitan municipalities, 49 indicated that they are servicing
indigent households with at least one form of off-grid energy source5, according to the Non-financial
census of municipalities report”. 21 Other sources which indicate the extent of energy poverty include
the general household survey for example.
It is therefore not surprising that municipalities are struggling to get their communities to pay
electricity bills.
Eskom’s RCA application includes a breakdown of sales variances in GWh over the year. 22
Table 11: Sales variances per customer category, GWh
Decision Actuals
Category FY 2019 FY 2019 Variance
Municipalities * 88 249 87 264 -986
Industrial 48 149 48 717 567
Mining 30 594 28 972 -1 622
Traction 2 830 2 831 1
Residential 12 437 11 748 -689
Commercial 10 585 10 558 -27
Agricultural 5 685 5 796 111
Internal Sales (at Standard Eskom tariff) 538 459 -79
IPP sales -- 67 67
Total Distribution Sales 199 067 196 412 2 655
Note: * Includes standard tariff sales to Lesotho
Note: Above-mentioned categories include NPA sales
20
Dr Miriam Altman et al. March 2011. Electricity Pricing and Supply with special attention to the impact on
employment and income distribution: Final Report. HSRC. Available at:
http://www.hsrc.ac.za/uploads/pageContent/3022/Making%20informed%20decisions%20about%20electricity
%20-%20SDC%20-%20Jan%2030%20-%2011%20v4.pdf
21
Statistics SA. 4 June 2018. Energy and the poor: a municipal breakdown. Available at:
http://www.statssa.gov.za/?p=11181
22
Table 11, page 44 of Eskom’s RCA 2018/19 application.
9In conclusion, we have shown that for the majority of the demand variations, Eskom should have
been able to foresee them and we would therefore strongly recommend that associated costs
should not be allowed.
How did Eskom calculate the revenue losses?
In table 11 above, Eskom lists the sales variances for each category in GWh. These are for South
African sales only. There is no listing of revenue changes for each category.
In Table 1, Eskom’s summary of its application, the total allowable revenue for 2018/19 is listed as
R190 348m against actual revenue of R179 892, a variance of R10 456. To cover this, Eskom wants an
additional R5 450m through the RCA. Eskom says this includes all billed revenue and after “adjusting
for non-electricity revenue, adjusting for demand response revenue as well as not including any load
shedding volume in the variances”. 23
We used Eskom’s Integrated Report 2019 to calculate the average price of electricity which Eskom
charged each sector. 24 The Integrated Report doesn’t include prices for IPPs or Internal Sales; for the
Internal Sales we used the Standard Eskom Tariff of 93.79c/kWh referred to by Eskom in the RCA
application 25.
Below, we take Eskom’s Table 11 on sales variances, and add extra columns with the average price
of electricity per sector. Using those average prices and the GWh sold, we calculate the revenue
losses per sector.
Table 11: Sales variances per customer category, GWh
Average
Decision Actuals Variance price in Value of
Category FY 2019 FY 2019 GWh c/kWh losses in R'm
Municipalities * 88 249 87 264 -986 88,53 -R872,906
Industrial 48 149 48 717 567 73,99 R419,523
Mining 30 594 28 972 -1 622 91,64 -R1 486,401
Traction 2 830 2 831 1 110,17 R1,102
Residential 12 437 11 748 -689 125,73 -R866,280
Commercial 10 585 10 558 -27 117,30 -R31,671
Agricultural 5 685 5 796 111 149,79 R166,267
Internal Sales (at Standard Eskom tariff) 538 459 -79 93,79 -R74,094
IPP sales -- 67 67
Total Distribution Sales 199 067 196 412 2 655 -R2 744,460
Note: * Includes standard tariff sales to Lesotho
Note: Above-mentioned categories include NPA sales
23
Table 1, page 8 of Eskom’s RCA 2018/19 application, with note on revenue below the table.
24
Eskom Integrated Report 2019. Customer information. Page 182 and 183.
25
Eskom standard tariff rate of 93.79c/kWh, listed on page 33 of the RCA application.
10We calculate the value of the variances as an overall revenue loss of R2 744.460m. If Eskom’s
average standard tariff of 93.79c/kWh is used, it’s a revenue loss of R2 490.125m.
But Eskom is claiming R5 450m, which is about double. How is this calculated? Did Eskom offer
massive discounts to one or more sectors, and expect to cover these losses in the RCA application by
spreading them across other sectors?
Table 10 of Eskom’s RCA application states that NPA sales were predicted to be 10 985 GWh and
were actually a little lower at 10 482 GWh. If this accounts for these huge losses, then how much
were the discounts on the NPAs?
Is Eskom perhaps hoping to cover its losses in international sales (which are not supposed to be part
of the RCA application)? The customer information in the Integrated Report 2019 26 shows that
Eskom has two categories of international customers: eight utilities and three “end users across the
border”. The sales (in GWh) and the revenue for each category indicate an average price per kWh of
111.89c/kWh for the utilities and 49.86kWh for the three “end users across the border”. Eskom’s
Integrated Report shows the electricity operating cost 27 as 71.25c/kWh. 28 Eskom thus sold
8 768GWh of power to just three international end-users in 2018/19 at a loss of 24.39c/kWh, a loss
of R2 139m. Table 12 in Eskom’s RCA application 29 indicates that almost all of this appears to have
been sold to Motraco. Motraco’s website says this is the Mozambique Transmission Company, which
was established in 1998 specifically to provide power to the Mozal aluminium plant in
Mozambique. 30 While the subsidised tariffs to smelters have long been known – and criticised – this
underlines the massive loss to Eskom. That loss over the last seven years (2012/13 to 2018/19) to
those three end-users is about R13 340m. 31
These international losses are not supposed to be covered by South African customers, but we
wonder if they are being built into our prices. How else does Eskom cover this loss? It’s worth noting
that those three cross-border end users getting the enormous subsidies from Eskom are not in South
Africa, so don’t pay tax to the SA government.
4. Operating costs
From a reading of the rules that NERSA has created around the review of Eskom revenue and what
costs can be passed through to Eskom’s customers, it appears that the RCA was set up to deal with
coal costs variances which Eskom could not reasonably accurately forecast. We deduce this as
26
Eskom Integrated Report 2019. Customer information. Page 182 and 183.
27
Eskom defines the electricity operating cost per MWh as “Electricity-related costs (primary energy costs,
employee benefit costs plus net impairment loss and other operating expenses, less other income) divided by
total electricity sales in GWh multiplied by 1000”. (Eskom Integrated Report 2019, Glossary, page 158).
28
Eskom Integrated Report 2019, Non-Technical Statistics: Group and Non-Technical Statistics: Company.
Pages 174. The group cost is R712.47/MWh (71.25c/kWh) and the company cost is R728.85/MWh
(72.89c/kWh). We used the group (lower) cost.
29
Table 12: Export sales variances, on page 48 of Eskom’s RCA 2018/19 application.
30
http://www.motraco.co.mz/index.php/en/
31
Based on statistics in Eskom Integrated Reports.
11NERSA states that other primary energy costs are considered stable and less risky, and cannot be
passed through.
If RCA is mostly concerned with coal costs and costs that Eskom could not have predicted, this is the
lens that NERSA has created to scrutinise any application for more money that Eskom could present.
Critically, NERSA states that only efficient costs will be allowed.
According to Eskom, “The decline in plant availability from 2013 meant that even less capacity was
available to meet demand and thus required the available plant to run even harder resulting in a
‘vicious circle’” 32. Eskom has described the lack of maintenance as the main contributor, as the
“increase in maintenance was the major contributor to the improvement in plant availability in the
2017 and 2018 financial years. This improvement was, unfortunately, short-lived and availability
started to decline again from late 2017. The reasons for this latest decline are many, complex and
varied. The historical sub-optimal mid-life refurbishments and hard running of an ageing fleet (more
than half – including Medupi and Kusile – over 37 years) still has the highest impact on plant
failures.” 33
The lack of maintenance was foreseen, and so how is it possible that Eskom can claim that a loss of
revenue due to plant unavailability is justified?
Should the utility claim that shareholder interference prevented proper maintenance and extended
the risk of unplanned outages, it could be argued that the shareholder should provide compensation
through foregoing its profits and providing some form of bailout. However, it is not clear why the
impact of political interference should be passed through to customers in the form of increased
tariffs.
IPPs
In the section on IPP costs, Eskom describes how additional payments had to be made to renewable
IPPs due to Eskom’s failure to connect these power plants to the grid. 34 Additional payments were
made due to dumping the IPPs off the grid due to low demand, and the need to keep the coal fired
plants going at their lowest level to avoid having to shut them down and then risk having to cold
start them again, with the need to then increase diesel at peak times. This reflects the chain of
problem. Had Eskom prioritised connecting the IPPs, maybe it would have had sufficient power to
not need all the coal power stations, and potentially would not then have needed to dump IPPs as
well, thereby incurring additional costs. This is speculative but raises additional questions about
Eskom’s political will to transition away from coal.
In considering how Eskom compares the costs of different generation options, we note the
following:
In its submissions to NERSA, Eskom compares the primary energy costs of its own generation vs the
REIPPs, making the current renewable energy project generated electricity appear to cost nearly
eight times as much as Eskom generation. However, if you include the costs of employees, the
generation capex and depreciation etc costs into the Eskom generation costs, which are already
included in the REIPPP price that Eskom pays to IPPs, the picture changes with Eskom generation
then only about half the cost of renewable energy. If you add in environmental costs of Eskom
32
Eskom RCA 2018/19 application, page 50.
33
Eskom RCA 2018/19 application, page 51.
34
Section 10.4.1.2 Demand energy payment, Eskom RCA 2018/19 application, page 59.
12cleaning up its generation fleet, even if spread over five years, then Eskom is about 60% of the costs
of round 1 expensive renewables.
The table below provides the calculations comparing Eskom generation numbers as supplied by
Eskom in both the MYPD4 and RCA 2019 applications:
Costs (R’m) Eskom Generation Eskom generation IPPs
(their version) (real)
Primary energy R54 896 R54 896 R21 300
Employees (generation R30 616
and corporate)
Environmental levy R8 061
Tx and Dx capex R9 286 R489
(95%) (5%)
R10 983 R578
Tx and Dx opex 35 (95%) (5%)
CAPEX generation R34 836
Depreciation R64 651
Environmental costs R40 000
R200bn spread over 5
years) 36 37 38
TOTAL R55 896 R253 329 R22 367
(93%) (93%) (7%)
Eskom Generation Eskom generation (real) IPPs
(their version)
GWh (2019 projected) 219 081 219 081 11 451
(95%) (5%)
Cost (R’m) per unit R0.255/kWh R1.156/kWh R1.953/kWh
(GWh) of elec (R/kwh)
For 2024, Eskom predicts that the cost of Eskom primary energy generation will double. As the
Integrated Resource Plan 2019 (IRP 2019) indicates, the predicted costs of renewable energy power
plants will proportionally decrease as cheaper renewable power plants come online. Even if the
actual costs of renewable energy stayed the same, when Eskom costs double, this means that within
35
Eskom RCA pg 131 – table 58
36
https://www.iol.co.za/saturday-star/news/eskom-slams-misleading-claims-of-contaminating-air-in-
mpumalanga-20043289
37
https://www.fin24.com/Economy/eskom-pollution-kills-almost-2000-people-a-year-report-20190312
38
Eskom. Applications for suspension, alternative limits and /or postponement of the minimum emissions
standards (MES) compliance timeframes for Eskom’s coal and liquid fuel fired power stations. Summary
Document. November 2018.pgs 21,23
13the next four years, renewable energy will be cheaper than Eskom coal generation. This means that
as we move forward, proportionally increasing the amounts of renewable energy will mitigate the
extent of future price increases of electricity.
Peakers
Eskom describes how it needed to run the peaker plants harder than anticipated. 39
“With an increasingly tight capacity situation, compounded by the lower REIPPP output than
assumed, the System Operator was required to utilise more diesel generation (from the Eskom fleet
as well as the DoE peaker)”. In the previous section, Eskom describes how it prevented the REIPPs
from putting power into the grid and now it acknowledges that Eskom (the system operator is inside
Eskom) needed to use more diesel because of this.
This requires a fair stretch of logic to understand the reasoning behind this.
Climate Change
Eskom describes how climate change related events such as cyclone Idai and the drought caused an
unexpected loss of imported power. 40 We would argue that such events are a salient reminder of
the reality of climate change and that such increasing droughts and storms are predicted in the
future. We would also argue that Eskom (who participates in climate change discussions) knew
about the drought and should have an adaptation strategy in place. Failure to do so might be
regarded as negligence or incompetence but cannot be attributed to ignorance.
In this regard, it is worth providing Eskom’s adaptation response presented in 2011:
“As such, the negative impacts of climate change will become a reality to which we must
adapt in order to sustain our business. Adaptation risks in South Africa include an
increased number and severity of droughts and floods, human settlement and, thus,
infrastructure movements, and risks to staff and customers. Short-term adaptation
measures include the consideration of dry-cooling at our new power stations, thus
reducing water consumption by approximately 90%. The trade-off is an efficiency loss.
Medium- to long-term considerations include improving the resilience of our
infrastructure and staff by incorporating adaptation issues into long-term planning and
risk mitigation strategies. This requires modelling of impacts and the development of
robust strategies that will reduce the overall cost of adaptation and minimise operational
disruptions” 41.
Eskom has known that operational disruptions might occur due to climate change and had
acknowledged the need to adapt as far back as 2011.
39
Section 10.4.1.3 DOE Peaker, in Eskom RCA 2018/19 application, page 60.
40
Section 11.2 Cross-border purchases of electricity, in Eskom RCA 2018/19 application, page 61.
41
Eskom presentation at COP17. Available at:
http://www.eskom.co.za/OurCompany/SustainableDevelopment/ClimateChangeCOP17/Documents/COP17art
icles222-02.pdf
145. Coal costs
Eskom describes its different coal contracts, and the varying reasons for the difference in the
amount and cost of coal supply to different power stations, together with examples of breakdowns
which led to the need for additional short-term supply.
Media articles, for example, a Mail & Guardian article of October 2019, provides an exposé of how
different companies are paying different prices for different qualities of coal. An extract: “The
taxpayer will be burdened with a roughly R10-billion bill over the next six years, because Eskom has
failed to negotiate a standard price for the coal it burns to keep the lights on” 42.
The need to negotiate a fair price for coal contracts is clearly something that can and should be
foreseen and the failure to do so is a decision that is not prudent, and has resulted in inefficiencies in
coal contracts. But such costs should not be borne by the consumers.
Eskom’s citing of issues such as the lack of funding for extension of mines, or the extended period of
negotiation over other coal contracts are also not unforeseen costs. Is it therefore prudent for
consumers to bear the cost of Eskom’s failure to manage such risks? We think not.
Issues such as conveyor breakdowns or community activism could be looked at differently. In our
view, the breakdowns are part of the lack of maintenance saga, taking place over years. The failure
of Eskom to plan efficiently for such maintenance and to run the fleet into the ground under
pressure from the shareholder is understood. However, why should the consumers pay for this?
The figure below shows the diesel burnt for the 2019 financial year. 43
42
Thanduxolo Jika and Sabelo Skiti. 11 October 2010. The high price of coal connections. Mail & Guardian.
Available at: https://mg.co.za/article/2019-10-11-00-the-high-price-of-coal-connections/
43
Figure 7: Gas Turbine usage for FY 2019, in Eskom RCA 2018/19 application, page 92.
15Eskom had planned to use 345 million litres of diesel and ended up using 3 768 million litres. This is
more than a ten-fold increase.
Due to failure in coal supply and failure in maintenance plans, Eskom burnt ten times more diesel
than it planned to. Was this the most efficient means of ensuring security of supply? Was this a
prudent cost? Given the maintenance failures, it is clear that Eskom should have foreseen the
potential of a shortage of supply. What alternative did it have? At this point, it might not have had
any but as it could have been predicted, is it fair to ask consumers to shoulder the burden for
Eskom’s lack of planning?
6. Staff costs
Eskom details some of the staffing issues on page 128 of the RCA application.
The variances include the awarding of higher than inflation salary increases, reduction in overtime
and the payment of non-bonuses! “The bonus cost is R100m lower than the application due to the
non-payment of performance bonus and it includes a once off cash payment of R10 000 after tax
paid to non-managerial staff which amounted to R24m.” 44 (page 128 of the RCA).
In the situation that Eskom finds itself in it could be assumed that working to fix power stations that
break down, and addressing unplanned outages would lead to increases in overtime to speed up the
repair process. However, given that Eskom has performed sub-optimally, should any contractual
obligation to pay a bonus by another name, be passed through to the customers? OUTA does not
believe that rewards for bad performance are an efficient cost, and queries how a reduction in
overtime would help increase response time to unplanned outages.
Eskom has had 11 CEOs 45 and six Board chairpersons 46 over the last decade. It is difficult to see how
a person who has not overseen an entire year production and financial cycle could have a sensible
idea of strategic interventions apart from the obvious need to root out corrupt practices. South
Africa needs to give the current team time to come up with results. However, neither the public nor
Eskom can afford to operate in the dark. Eskom needs to communicate honestly with its customers,
on progress and the tough choices that are needed to make progress. If we need four hours of
loadshedding every day for a year, then don’t tell us it is zero and then plunge us into darkness.
South Africa needs consistency around which resilience can be built both in the public and private
sector.
44
Eskom RCA 2018/19 application, page 128.
45
Eskom CEOs since 2010: Mpho Makwana, Brian Dames, Collin Matjila, Tshediso Matona, Brian Molefe,
Matshela Koko, Johnny Dladla, Sean Maritz, Phakamani Hadebe, Jabu Mabuza, Andre de Ruyter. See list at
https://twitter.com/AntonEberhard/status/1215973530329849856
46
Eskom board chairs since 2010: Mpho Makwana, Zola Tsotsi, Ben Ngubane, Zethembe Khoza, Jabu Mabuza,
Malegapuru Makgoba. See list at https://twitter.com/AntonEberhard/status/1215950674049019905
167. Medupi and Kusile
Cost of building Medupi and Kusile have soared while the builds have been delayed. This points to
incompetence by Eskom management.
In August 2007, a few months after construction on Medupi started, Eskom said Medupi would cost
about R80bn, the last unit would be commissioned in 2015 and it would have an operational life of
50 years.
Construction on the 4 800MW Kusile started in April 2008. The last unit was due to be commissioned
in 2016. In January 2015, Eskom estimated the costs for Kusile as R82bn excluding interest, with a
total cost of R118.5bn.
In 2016, then Minister Lynne Brown told Parliament that Medupi’s cost excluding interest was
R105bn and R134.2bn including interest during construction, while Kusile’s cost excluding interest
was R118.5bn and R167.2bn including interest during construction. These costs included escalation
costs of R12.69bn for Medupi and R22.7bn for Kusile.
Eskom’s Integrated Report 2019 lists the costs and progress: “To date, Medupi has spent 89% of its
R145 billion budget, and construction is 95% complete. Kusile has spent 87% of its R161 billion
budget, and construction is 87% complete.” The cost of fixing the six major plant defects at the pair
was estimated at R7.2bn, some of which would be recoverable from contractors. Eskom said it was
not financially viable to stop construction as this would cost R140bn (R40bn in claims and penalties,
and R100bn for impairing the asset in the regulatory asset base with the R100bn loan to be repaid
immediately).
In August 2019, Eskom’s figures were questioned by energy expert Chris Yelland, who said those
totals did not include all the costs, and totals would be more likely to be R234bn for Medupi and
R226bn for Kusile.
8. Financing the gap
Eskom’s MYPD4 application outlines the support provided by the government by that point. “Eskom
initially received support from government in the form of a R60bn shareholder loan which was
converted into equity in 2015 and in the form of a further R23bn equity injection completed in
March 2016. Government also approved R350bn worth of guarantees on Eskom’s debt of which
Eskom had drawn on R218bn worth by 2017/18 (the agreement is to be extend to 31 March 2023).
Government guarantees of SOE debt rose from R65bn in 2008 to a total of R445bn in 2017 and 77%
of this is for the electricity sector which also covers Eskom’s power purchase agreements with
IPPs.” 47
47
Eskom Revenue Application: Multi-Year Price Determination (MYPD 4) FY2019/20 – 2021/22. September
2018. Page 97. Available at:
http://www.nersa.org.za/Admin/Document/Editor/file/Consultations/Electricity/Notices/Eskom%20Summary
%20MYPD4.pdf
17We do not deny that due to past practices, Eskom will need further financial support as it
restructures and transforms to modernity. Eskom has had the ability to raise money from loans
from the shareholder, and additional equity from the shareholder and through the tariffs (using the
MYPD methodology). NERSA’s latest MYPD methodology, if properly applied, should limit variances
and enable NERSA to monitor Eskom more closely.
The RCA is an additional mechanism for dipping into a slush fund in a sense and it is the most
iniquitous in terms of destabilising impacts of varying electricity prices. OUTA therefore
recommends that the RCA be reviewed and scrapped and for such expenses that Eskom generally
needs a further bailout, it can approach the shareholder. Where such incidents are requested, a
precautionary approach would suggest that NERSA be asked to hold public hearings and to advise on
the feasibility and viability of such bailouts.
There have been numerous reports of shareholder interference which Eskom has cited as partly
responsible for its situation. However, this is not something new. Eskom has admitted it had to keep
the lights on for the 2010 World Cup, or over Christmas etc.
In 2019, in parliament, the minutes reflect that the Board was experiencing interference: “ If the
Board could take decisions without political interference, she could tell the Committee what was
needed. Eskom needed to tell SAs that Eskom needed to load shed for the next eight months. She
understood that load shedding cost the economy R2 billion a day. Eskom was sitting with units that
were nearly at the end of their lifespan. They would simply stop working because there had been no
maintenance and they had not been replaced. Decisions had been taken in the past to keep the
lights on at all costs because the country was nearing elections.” 48.
Such political pressure is not unknown and, could we argue, have been foreseen and therefore is not
a prudently occurred cost.
We would acknowledge that Eskom is in a difficult place if it refuses to bow to political pressure and
we would argue that politicians have been understandably concerned and felt it was necessary to
intervene in what had become an instrument of state capture, not an energy supply company.
9. Conclusions
On a broader strategic level looking at energy planning and energy security for South Africa going
forward, the idea of a mechanism to allow Eskom to return to the regulator every year to gain
approval for unforeseen cost increases leads to inconsistency and adds to the economic uncertainty
in the country.
Without going into a page by page analysis of the 151 pages of the RCA application, or its MYPD 4
base document, we have attempted to demonstrate that in the main, Eskom should have known
about the additional costs it incurred. It is our contention that Eskom fails to do its homework but
continues to forecast its performance and revenue year on year with unproven assumptions. The
48
Parliament’s Standing Committee on Appropriations. Meeting with Eskom Executive Board on challenges
facing the power utility. 29 October 2019. https://pmg.org.za/committee-meeting/29188/
18RCA mechanism means that Eskom is not accountable for its bad planning, and leads to increased
suffering for society.
In the RCA application, Eskom points to the risks of renegotiating coal contracts: “Additionally, if
contracts are regularly reopened, the purpose of having a contract is undermined and results in
negotiating in poor faith which could attract further risk”. 49
OUTA would suggest that the MYPD provides the basis for a “contract” between society and Eskom,
a price trajectory which South Africans can use to grow the economy. The rules that allow Eskom to
continually apply and receive additional tariff increases based on reasons that in general fail to stand
up to scrutiny, and which appear to civil society to amount to blackmail: “if we don’t get an increase,
the lights will go out”. This is an unsustainable approach to electricity provision and has certainly
“attracted further risk” to the economy and society in general.
OUTA therefore recommends that Eskom is not awarded any further increases in electricity tariffs
and that the entire RCA mechanism should be reviewed and potentially scrapped. This would ensure
increased certainty and consistency in the price path of future electricity tariffs and this can only be
positive for South Africa going forward.
Appendix A
Is NERSA following its own Methodology?
According to NERSA’s Multi-Year Price Determination Methodology, the following objectives are to
be achieved in regulating Eskom tariffs:
The following objectives are adopted in developing the regulatory methodology for the MYPD 50:
• To ensure Eskom’s sustainability as a business and limit the risk of excess or inadequate returns;
while giving incentives for new investment, especially in generation;
• To ensure reasonable tariff stability and smoothed changes over time consistent with the socio-
economic objective of the Government;
• To appropriately allocate commercial risk between Eskom and its customers;
• To provide efficiency incentives without leading to unintended consequences of regulation on
performance;
• To provide a systematic basis for revenue/tariff setting;
• To ensure consistency between price control periods;
According to 4.1 (Methodology), the formula for generation charges includes:
49
Eskom RCA 2018/19 application, page 66.
50
NERSA. Multi-Year Price Determination Methodology – MYPD4 methodology 2018.
19Efficient primary energy costs (inclusive of non-Eskom generation)
Allowances for service incentives
In assessing the valuation of assets, the regulator (according to the policy postion 1 of the Electriicty
pricing policy) sets the revenue requirement ”at a level which recovers the full cost of production,
including a reasonable risk adjusted margin or return on appropriate asset values. The regulator,
after consultation with stakeholders, must adopt an asset valuation methodology that accurately
reflects the replacement value of assets of those assets such as to allow the electricity utility to
obtain reasonably priced funding for investment: to meet Government defined economic growth. b.
In addition, the regulatory methodology should anticipate investment cycles and other trends to
prevent unreasonable price volatility and shocks while ensuring financial, viability, continuity,
fundability and stability over the short, medium and long term assuming an efficient and prudent
operator.”pg 10. 51
In calculating allowed revenue for operation costs, the regulator uses the following criteria.
5.4.1 Expenses must be incurred in the normal operations of production and supply of electricity,
including an acceptable level of refurbishment, repairs and maintenance costs;
5.4.2 Expenses must be prudently and efficiently incurred after careful consideration of available
options;
5.4.3 Expenses must be incurred in an arm’s length transaction. Eskom must have a competitive
procurement policy and demonstrate to the regulator that it has been strictly adhered to in its
procurement processes;
Primary energy costs have the following criteria:
The qualifying criteria for allowed primary energy costs are the same as for operating expenses. Only
efficient costs will be allowed.
Coal transport costs incurred as a result of coal purchased from coal sources remote from the power
stations are included in primary energy cost.
Provision has been made for a pass-through of prudently incurred primary energy costs..(pg 12)
The primary energy costs must be based on central estimates of power generation volumes and
prices and be consistent with the wholesale power sales budget.
In evaluating disruptions to the distribution system, the following criteria will apply:
Incentives payable to Eskom should not be larger than the value of improved performance, and
should also not be less than the cost to achieve it; • The incentive targets set need to have relevance
to the value of the improved performance; • Incentives/penalties should be capped in order to limit
the exposure of customers to higher prices;
On assessing pass-through rules, the regulator puts the following rules:
51
http://www.nersa.org.za/Admin/Document/Editor/file/Electricity/Legislation/Methodologies%20and%20Guid
elines/MYPD%20regulatory%20methodology%20-%20%2020%20Nov%20_2_.pdf
20The other primary energy costs (nuclear, hydro, other costs) are considered to be stable and less risky
and are therefore not allowed as pass-through. It is considered that Eskom must be able to
reasonably accurately forecast these costs. (pg 24).
Paragraph 6.4 (pg concerns the regulatory clearing account (RCA):
The RCA is used to debit/credit the allowable portion of coal costs variances as calculated through
the PBR formula and all other costs variances that have not been dealt with in the MYPD mechanism.
The point of contention over recent years is what NERSA has considered “prudent” costs. These
relate specifically to “prudently incurred primary energy costs” (section 17.1.1.2) and “prudently
incurred over or under-expenditure on operating costs” (section 17.1.1.4).
21You can also read