SILENT RECESSION WHY CALIFORNIA SCHOOL DISTRICTS ARE UNDERWATER DESPITE INCREASES IN FUNDING - WestEd
←
→
Page content transcription
If your browser does not render page correctly, please read the page content below
SILENT RECESSION
        WHY CALIFORNIA SCHOOL
      DISTRICTS ARE UNDERWATER
    DESPITE INCREASES IN FUNDING

                       Kelsey Krausen
                          Jason Willis

                       APRIL 2018
© 2018 WestEd. All rights reserved. Suggested citation: Krausen, K., & Willis, J. (2018). Silent Recession: Why California school districts are underwater despite increases in funding. San Francisco, CA: WestEd. This report was developed with funding from the Bill and Melinda Gates Foundation through the Smarter School Spending project. The content of this paper does not necessarily reflect the views or policies of the foundation or the Smarter School Spending project. WestEd is a nonpartisan, nonprofit research, development, and service agency that works with education and other communi- ties throughout the United States and abroad to promote excellence, achieve equity, and improve learning for children, youth, and adults. WestEd has more than a dozen offices nationwide, from Massachusetts, Vermont, Georgia, and Washington, DC, to Arizona and California, with headquarters in San Francisco.
CONTENTS

Introduction                                                                                 4
Purpose                                                                                       5
Funding for K–12 Education in California                                                      6
Figure 1. Increased pension expenditures outpace LCFF revenue increases in some districts     7

Fiscal Challenges                                                                            8
Pension Liabilities                                                                           8
Table 1. Large increases in K–12 districts’ pension contribution rates                        9
Figure 2. Nearly every district in the sample is expecting large increases in
CalSTRS and CalPERS expenditures between 2016/17 and 2017/18                                 10
Special Education Costs                                                                      10
Costs Associated with Recruiting, Retaining, and Training Teachers                           11
Employee Health Care Costs                                                                   12
Aging Facilities                                                                             13
Declining Enrollment                                                                         14
Table 2. Changing enrollment in sample districts, 2014/15 to 2016/17                         15

Implications of the Silent Recession                                                         17
Tradeoffs                                                                                    17
Figure 3. Districts have varying degrees of control over rising fiscal pressures, and some
fiscal pressures have a disproportionate impact on district budgets                          18
Figure 4. Increase in employee costs over time for California school districts               19
Deficit Spending                                                                             19
Figure 5. Sample districts’ expectations for future expenditures and revenues                20

Looking Ahead: Strategies                                                                    21
Increase Effectiveness                                                                       21
Increase Efficiency                                                                          21
Serve High-Need Students                                                                     21
Respond to Change                                                                            22
Use Data and Communication as Tools                                                          22

A Path Forward                                                                               23

Appendix                                                                                     24
Methodology                                                                                  24
Limitations                                                                                  24
Table A1. Breakdown of sample by district size                                               25
Table A2. Increasing cost of CalSTRS and CalPERS                                             25
INTRODUCTION
 “[I]T’S EXACTLY THIS SILENT                                                   is expected to nearly double between 2015/16 and 2020/21,
                                                                               based on complicated retirement and earnings forecasts that
 RECESSION SCENARIO…. THOUGH WE                                                are not well understood by the public — or by many state
 ARE RECEIVING MORE DOLLARS EACH                                               policymakers or district leaders. These costs create pres-
 YEAR PER STUDENT, THE COSTS THAT                                              sures on district budgets and erode districts’ abilities to make
                                                                               new investments in programs. They mark a new era of
 WE’RE BEING SADDLED WITH ARE
                                                                               fiscal constraint for California’s school districts — a Silent
 GREATER THAN THOSE REVENUES.                                                  Recession — which will likely force many districts to make
 SO, WE END UP IN A PERPETUAL                                                  dramatic program adjustments and reductions or risk signif-

 CUTTING MODE.”                                                                icant deficit spending, despite overall increases in K–12 fund-
                                                                               ing provided by the state.
                                       DISTRICT BUDGET OFFICER
                                                                               This paper suggests that despite efforts to help school districts
                                                                               recover from the recent Great Recession by bringing school
                                                                               district spending power back to pre-recession levels, growth
 Despite projected increases in state and local education
                                                                               in expenses to maintain operations means that school
 funding between 2017/18 and 2021/22,1 California school
                                                                               districts across the state are now experiencing the Silent
 districts face fiscal pressures that threaten to destabilize
                                                                               Recession. Although California’s education funding formula
 school district budgets and force reductions in services to
                                                                               provides revenues that grow incrementally each year, these
 students. Examples of these fiscal pressures include reduced
                                                                               increases are not based on the actual growth in the costs
 funding due to declining enrollment; the costs of upkeep
                                                                               of operating a school. Consequently, some school districts
 and renovations for aging school facilities; increasing special
                                                                               are experiencing cost increases that are outpacing revenue
 education program costs; increasing employee health care
                                                                               increases. The fiscal challenges that this dynamic creates will
 costs; and the costs associated with recruiting, retaining, and
                                                                               likely require school districts to find new strategies to prioritize
 training teachers, including ensuring competitive wages. Still,
                                                                               how they spend limited dollars and may lead to reductions
 for many California school districts, the most daunting fiscal
                                                                               in investments in current employees and programs, as rising
 pressure is the rising cost of employee pensions, totaling a
                                                                               costs effectively crowd out other investments. The Tradeoffs
 $1-billion increase over the previous year in costs to districts
                                                                               section of this paper presents a conceptual framework for
 statewide in the 2017/18 school year alone.2
                                                                               school district leaders to use in considering the tradeoffs and
 Many of these pressures on school district budgets are                        choices they may need to make. In particular, the framework
 largely hidden from public view because they do not take                      highlights the importance of focusing on budget strategies
 the form of new services or programs and instead are part                     that address areas in which districts have greater control
 of what is often referred to as the “cost of doing business.”                 over expenditures and which have the potential to make a
 Furthermore, school district spending on employee pensions                    substantial impact on district budgets.

 1
   http://www.lao.ca.gov/Publications/Report/3716 (The most recent projections from this report of the state’s Legislative Analyst’s Office
   show projected increases under a “Growth Scenario”; the report also provides projections under a “Recession Scenario.”)
 2
   http://www.lao.ca.gov/Publications/Report/3549

Silent Recession: Why California School Districts Are Underwater Despite Increases in Funding                                                    page 4
To explore the implications of the growing fiscal pressures in Formula legislation’s key goals of closing the budget gap and
a range of school districts, WestEd analyzed publicly available the achievement gap.
single-year budgets and multiyear projections (MYPs) for 25
In particular, this paper draws attention to the rising cost of
California school districts that were selected to be represen-
pensions and to other fiscal pressures on school districts
tative of the range of sizes, types, and regions of California
in an effort to broadcast these issues so they are no longer
school districts.3 To check if districts that tend to have higher
silent. These are complex budget issues that are difficult to
levels of revenues also tend to forecast the same budget issues
explain to the public, but they can be of significant impact
as districts in the 25-district sample, MYP analyses were also
and importance to maintaining academic and fiscal solvency
conducted for two additional samples: 15 school districts that
for many school districts in California, as well as elsewhere.
have high unduplicated student counts (74–98 percent of the
Many school districts will be forced to navigate formidable
district’s enrollment is from targeted groups)4 and 15 Basic
budget choices ahead, and this paper is written from the
Aid school districts.5
assumption that it is easier to foster authentic engagement
In addition, WestEd conducted interviews with district and and transparent conversations with the public about these
county leaders involved in WestEd’s Smarter School Spending choices when there is a shared understanding of current
Community of Practice, as well as interviews with chief busi- budget realities. Importantly, the current budget challenges
ness officers from districts across the state. (Additional infor- in many districts are not new and are not due solely to exter-
mation on how this paper was developed is in the Appendix.) 6
nal pressures. Rather, they are part of a larger story about how
district leadership, including local governing boards, have
Purpose historically made budget decisions — in some cases deferring
difficult budget choices — and about the increasing demands
The purpose of this paper — the first in a two-part series —
placed on the education system and the levels of funding
is to provide a detailed picture of the fiscal pressures that
provided for California school districts over time.
districts face and to outline the implications of the Silent
Recession for school districts. The second paper builds on this Although this paper briefly addresses some of the broader
urgent matter and offers budget strategies and approaches issues related to the adequacy of school funding in California,
that school districts may use to mitigate these pressures. The it does not delve deeply into the debate about whether the
implications include tradeoffs faced by districts, potential funding gap is caused by the adequacy of K–12 education
effects on collective bargaining and broader conversations funding in California. Rather, this paper is intended to serve as
with the public about the budget, and the implications for a springboard for discussions about how districts are dealing
deficit spending and for achieving the Local Control Funding with current budget realities.
3 Each district is required to submit to its county office of education a single-year budget and a multiyear projection of its budget along with
its Local Control and Accountability Plan by July 1 each year. These multiyear projections include information on the next three budget
years.
4 The term unduplicated student counts refers to the total number of English learner (EL) students, low-income students, and foster youth in
the district. Unduplicated students may also be referred to as targeted student groups because school districts receive additional funding
to target the educational needs of these students, as explained further in the Funding for K–12 Education in California section of this paper.
5 The term Basic Aid school district refers to a district in which local property tax revenues exceed the amount that the district would receive
from the state under California’s education funding formula.
6 WestEd has received support from the Bill and Melinda Gates Foundation through the Smarter School Spending project, which
provides school districts with tools and strategies to align investments, to prioritize investments based on the districts’ goals for student
achievement, and to evaluate program success relative to student outcomes. This paper is part of the project’s body of work, as the paper
captures some of the discussions that occurred through a WestEd-facilitated Smarter School Spending Community of Practice, and is
intended to be a potential resource for school district budget leaders.
Silent Recession: Why California School Districts Are Underwater Despite Increases in Funding page 5Funding for K–12 Education in California improving outcomes and helping to eliminate the achieve-
ment gap for the targeted student groups.
The passage of the Local Control Funding Formula (LCFF)
legislation in 2013 dramatically transformed California’s The passage of the LCFF coincided with California’s recov-
education funding system.7 The LCFF gives greater local ery from the Great Recession, which meant that the LCFF
control to school districts based on the idea that those who formula was used to determine how most of the significant
work most closely with students are better situated to make increases in funding for K–12 education resulting from the
spending decisions (i.e., “subsidiarity”) and in order to increase state’s post-recession economic growth were distributed.
equity in school funding and provide districts with additional However, much of the increased funding simply offset the
funding to increase and improve services for students with 15–20 percent budget reductions and the suspension of cost-
the greatest needs. The LCFF gave school districts greater of-living adjustments in state and local funding that school
flexibility in spending decisions in exchange for greater budget districts had experienced previously, between 2008/09 and
transparency through the requirement that each local educa- 2011/12. While the LCFF provided a mechanism to distribute
tion agency (LEA) create a Local Control and Accountability funding to K–12 education, it was not intended and does not
Plan — with input from the community — that details how operate as an adequacy formula — it is not meant to deter-
the district will allocate funds to meet its goals for improving mine how much money would be adequate for meeting the
student outcomes. state’s student outcome expectations for each district. Instead,
increases in funding for K–12 education related to the LCFF
Under the LCFF, the bulk of the funding that the state provides
were based on a commitment to returning school districts to
to each school district is based on the district’s average daily
pre-recession levels (2007/08), adjusted for inflation.
attendance (ADA), referred to as base grant funding. In addi-
tion, the LCFF designates that school districts may receive Notably, the LCFF formula provides for revenues that grow
supplemental funding and concentration funding from the by cost-of-living adjustments each year based on a general
state. Supplemental funding is based on unduplicated student measure of the growth in cost for governmental agencies
counts (meaning students from targeted populations): English that is inclusive of, but not limited to, education. In other
learner (EL) students, low-income students,8 and foster youth words, the LCFF generates revenue increases without refer-
in the district; and the state provides concentration funding ence to actual growth in the costs that are specific to oper-
to a district if more than 55 percent of the district’s enroll- ating schools. However, as of April 2018, the state legisla-
ment is from these targeted student populations. Importantly, ture is considering new legislation (introduced by assembly
school districts must demonstrate that they are increasing or member Al Muratsuchi, from Torrance) to increase the LCFF
improving services for the student populations that generated target to provide school districts with additional funding to
the supplemental and concentration funds.9 Consequently, cover rising fixed costs (e.g., pensions, fuel, maintenance) —
school districts that receive more supplemental and concen- a bill directly focused on addressing the adequacy of state
tration funding are working to use such funds to address the funding for education.
needs of targeted students and may experience greater pres-
sure from stakeholders to show that the additional dollars are
7 https://www.wested.org/resources/path-toward-equity/
8 Defined by eligibility for the federal Free and Reduced-Price Meals program.
9 As discussed in a later section of this paper, school districts that find they must cut services, even services to targeted student groups, due
to rising fiscal pressures may need to focus on strategies to improve services to students during times of budget constraint. According to
a 2013 report (http://www.lao.ca.gov/reports/2013/edu/lcff/lcff-072913.aspx), “Under the LCFF, districts will have to use supplemental
and concentration funds to ‘increase or improve services for EL/LI pupils in proportion to the increase in supplemental and concentration
funds.’ The exact meaning and regulatory effect of this proportionality clause is currently unknown.” Some stakeholders in the education
community remain concerned about the absence of explicit requirements regarding how districts increase or improve services for
targeted student groups.
Silent Recession: Why California School Districts Are Underwater Despite Increases in Funding page 6Since the LCFF was enacted, revenue for K–12 education has district determine how much is generated from the supple-
increased steadily from a statewide average of $8,987 per mental and concentration components of the LCFF. As a
pupil in 2013 to $10,657 per pupil in 2017. In particular, those
10
result, districts of similar size, but different demographics,
school districts with large populations of EL, low-income, and may receive considerably different per-pupil funding under
foster students have experienced the largest increases in fund- the LCFF.12 The variation in per-pupil funding rates and local
ing. Statewide in 2017/18, school districts received $1.4 billion contextual factors (e.g., enrollment growth or decline, age of
more in LCFF funding than in the previous year, and K–12 reve- workforce, size of the district) affect how different districts
nue is expected to continue to increase through 2020/21.11 In will experience the significant projected increases in pension
fact, Governor Jerry Brown’s January 2018 budget proposal costs. According to the Legislative Analyst’s Office, pension
includes nearly $3 billion to fund full implementation of the costs will constitute an estimated 30–40 percent of future
LCFF in 2018/19, two years ahead of the schedule that had LCFF funding growth. In some cases, districts are already
been previously set for fully funding the LCFF. experiencing increases in pension costs that exceed their
LCFF funding growth (Figure 1).13
However, by design, not all school districts have experienced
the transition to the LCFF equally. The demographics of a
Figure 1. Increased pension expenditures outpace LCFF revenue increases in some districts
For this sample school district in 2017-18 (San Bernardino Unified), salary-related expenditure increases will outpace
LCFF revenue increases by $10.9 million.
Source: Authors’ representation of data provided by the San Bernardino Unified School District
10
http://www.lao.ca.gov/Publications/Report/3549; in inflation adjusted dollars
11
http://www.lao.ca.gov/Publications/Report/3670 - Proposition.A098_Overview
12
http://www.ppic.org/publication/implementing-californias-school-funding-formula-will-high-need-students-benefit/
13
http://www.lao.ca.gov/Publications/Report/3549
Silent Recession: Why California School Districts Are Underwater Despite Increases in Funding page 7FISCAL CHALLENGES
This section includes a description of the increasing pressures make up for the shortfall. According to EdSource, increased
on school district budgets, as well as the difficult choices payments from the state will likely have a trickle-down effect
faced by school district leaders and the community at large. on districts as well. “Money for pensions will divert funding
Specifically, these fiscal challenges include pension liabilities; from other priorities at a time when Brown is predicting
special education costs; costs associated with recruiting, slower state revenues and the possibility of a recession.”14 As
retaining, and training teachers; employee health care costs; one district budget leader interviewed for this report stated,
aging facilities; and declining enrollment. “Issues with the CalSTRS and CalPERS, that is huge…. When
you look at how much increase it is every year . . . there’s no
Pension Liabilities way that it can be sustainable the way it’s going, because
your base dollar that comes in, it gets eaten up already by
For California — as for many other states — the rising cost of
just your additional increase in your CalSTRS and CalPERS
pension obligations presents a serious challenge, particularly
already.” Another district budget leader explained that the
for school districts. There are two major pension funds for
rising cost of pensions — outpacing increases in funding —
employees in K–12 education in California: the California State
will force school districts to reduce services for students.
Teachers Retirement System (CalSTRS) and the California
Public Employees’ Retirement System (CalPERS). CalSTRS, When the state adopted the Local Control Funding Formula,
which administers pension benefits for teachers, principals, it made a promise to restore the 07/08 purchasing powers
and other certificated employees such as speech therapists, of school districts…. And then a year later they passed the
school psychologists, and nurses, is the nation’s second-larg- STRS and PERS Reform Acts, which pretty much invalidated
est public employee pension fund. CalPERS provides pension that promise. There’s no way a school district can get back
benefits for classified employees such as classroom aides, to those purchasing levels with all of these new mandated
school security officers, and food services, maintenance, and payments. So they should have adjusted the LCFF base targets
clerical staff. To provide benefits to their members, CalSTRS when they changed PERS and STRS because there was a new
and CalPERS funds rely on contributions from members, cost that was never factored in when they set the targets. So,
employers, and the state, as well as income from invest- we’ve been saying . . . for several years that students are going
ments. Unfunded pension costs are the difference between to get fewer services because much of the new money is
the benefits promised to employees and the current savings going to go to employees’ deferred compensation.
available in the funds to meet those financial commitments. It
This concern over rising costs — particularly for CalSTRS and
is this unfunded liability that has driven dramatic increases in
CalPERS — exceeding increases in revenues was repeated by
the amount that school districts must contribute to the funds.
many of the district leaders interviewed for this report.
The value of funds in CalPERS and CalSTRS fell dramati-
cally during the 2008 recession and has never fully recov-
ered. In response, California’s 2014/15 budget included a
plan to fully fund CalSTRS within about 30 years by more
than doubling district contribution rates between 2013/14
and 2020/21 — from 8.3 percent of each district’s payroll in
2013/14 to 19.1 percent of payroll by 2020/21 (Table 1). The
state will also have to increase its contribution to the fund to
14
https://edsource.org/2017/state-new-teachers-to-pay-more-to-shore-up-state-teachers-pension-fund/576481
Silent Recession: Why California School Districts Are Underwater Despite Increases in Funding page 8Table 1. Large increases in K–12 districts’ pension contribution rates
2013/14 2014/15 2015/16 2016/17 2017/18 2018/19 2019/20 2020/21
Rates:
CalSTRS 8.3% 8.9% 10.7% 12.6% 14.4% 16.3% 18.1% 19.1%
CalPERS 11.4% 11.8% 11.8% 13.9% 15.8% 18.7% 21.6% 24.9%
Statewide Total School District Contributions (in millions):
CalSTRS $2,086 $2,463 $3,120 $3,840 $4,478 $5,305 $6,203 $6,862
CalPERS $1,122 $1,104 $1,214 $1,509 $1,710 $2,006 $2,341 $2,734
Totals $3,208 $3,567 $4,334 $5,349 $6,188 $7,311 $8,544 $9,596
Source: http://www.lao.ca.gov/Education/EdBudget/Details/82
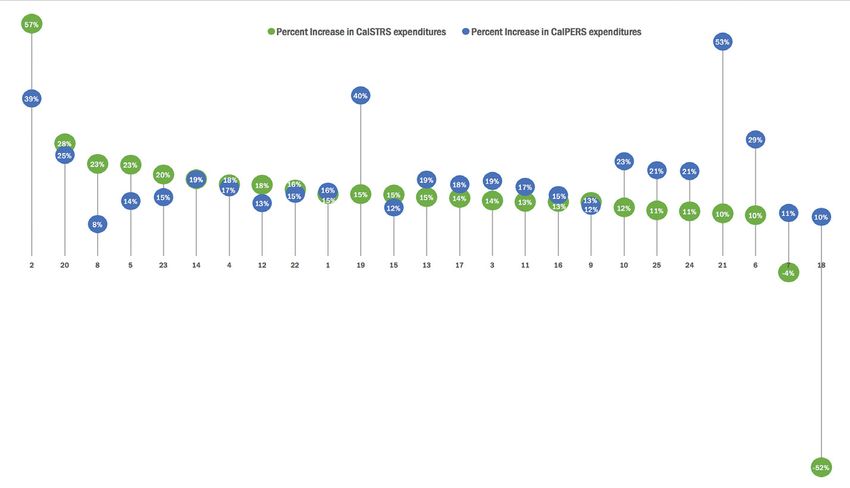
A 2017 report by the Pew Charitable Trust reveals that many costs on district budgets. For one district, its contribution to
other states’ pension systems are faced with addressing CalSTRS was 57 percent higher from one year to the next
growing and significant pension obligations.15 The report (Figure 2). These increases represent millions of dollars in
indicates that the gap between the assets of state pension increased contributions for some districts. The average
systems across the United States and the benefits promised increase across the 25 districts in WestEd’s sample was
to employees — referred to as the net pension liability — was 16 percent for CalSTRS, or just under $1.5 million in increased
$1.1 trillion in 2015 and was expected to increase by approxi- contributions on average, and 19 percent for CalPERS, or just
mately $200 billion in 2016. under $0.5 million in increased contributions, on average. Yet,
the steepest increases in district contributions to these funds
WestEd’s analysis of districts’ annual budgets illustrates
are still to come.
the varied impact of the increases in CalSTRS and CalPERS
15
http://www.pewtrusts.org/en/research-and-analysis/issue-briefs/2017/04/the-state-pension-funding-gap-2015
Silent Recession: Why California School Districts Are Underwater Despite Increases in Funding page 9Figure 2. Nearly every district in the sample is expecting large increases in CalSTRS and CalPERS expenditures
between 2016/17 and 2017/18
Source: Authors’ analysis of annual budget reports from sample districts
Special Education Costs areas of K–12 funding, the funding provided to districts for
special education services has grown based on a modest
Districts also struggle to cover the increasing costs of special
cost-of-living adjustment, yet funding for special educa-
education programs. As student needs and the costs of
tion has generally lagged behind the overall K–12 funding
meeting those needs continue to rise, providing appropri-
increase. The increases to special education funding have
ate support to meet the needs of students with disabilities
not matched the escalating cost of maintaining high-quality,
is an ongoing concern for districts. The LAO estimates that
legally compliant services.18
the cost of educating students with disabilities is, on average,
twice as much as the cost of educating general education One source of increased costs has been from greater aware-
students.16 ness of and investment in programs to support students with
a primary disability of autism. Although autism was once
In 2016/17, California enrolled over 680,000 K–12 students
considered a high-cost, low-incidence disability, California’s
eligible for special education services, or approximately
population of students with a primary disability of autism
11 percent of all K–12 students in the state.17 As with other
16
http://www.lao.ca.gov/reports/2013/edu/special-ed-primer/special-ed-primer-010313.aspx
17
https://dq.cde.ca.gov/dataquest/
18
http://www.ppic.org/content/pubs/report/R_1116LHR.pdf
Silent Recession: Why California School Districts Are Underwater Despite Increases in Funding page 10has increased from fewer than 40,000 students to more than down our special education revenue. And our special educa-
100,000 students over the last 10 years (2006/07 to 2016/17).19 tion costs are just soaring with autism and additional social,
The total number of special education students in California emotional-type needs. And so that’s kind of a big one that is
has also increased during this same period, from 679,602 different for every district, but they’re all experiencing larger
students to 754,277 students, while overall K–12 enrollment in encroachments because they’re not getting more money
the state has decreased.20 from the federal government. They’re not getting more
money from the state government. So, it’s coming down
Each student with a disability, as a regularly enrolled student,
to the local dollars and the unrestricted dollars too to fund
generates LCFF funding for a district and additionally gener-
more and more of that piece.” As this county leader suggests,
ates funding for the district through the AB 602 formula,
special education costs exceed the funding provided by the
which distributes 80 percent of the state’s special education
state and federal governments, a circumstance also stated by
funds. This formula, like the LCFF, is based on the total enroll-
other district budget leaders.
ment numbers of all students within each Special Education
Local Planning Area (SELPA); it is not based on the number Another district leader interviewed for this paper expressed
of students with disabilities. A 2016 Public Policy Institute of concern over the unpredictable nature of special educa-
California (PPIC) report asserts that this current system for tion costs in his district. “In Special Ed the costs are so crazy,
funding special education in California provides widely differ- variable, and unpredictable…. You can wind up having a
ent rates of funding for local districts. 21
non-public school placement. We can have settlements,
we can have kids that come in that are extremely expen-
Special education spending in California public schools totals
sive to educate and not get the funding back from the state….
over $12 billion annually. The largest share (62 percent) of
In Special Ed, like within a week, we can wind up spending
the funding comes from local school district sources. AB
hundreds of thousands of dollars of money that we didn’t
602 state sources provide 29 percent of the funding, and the
anticipate…. And that’s a challenge.” The unpredictable nature
federal government provides 9 percent. According to PPIC’s
of special education costs was also cited by several other
2016 report, “The number of students with [individualized
district budget leaders as one of the challenges in managing
education plans] (IEPs) and their share of the school popula-
rising costs in their districts.
tion began to increase in 2010 after many years of being rela-
tively flat. At the same time, overall K–12 student attendance,
which drives funding, did not rise. As a consequence, total
Costs Associated with Recruiting, Retaining,
state funding for students with special needs has fallen in
and Training Teachers
both nominal and constant dollars.”22 This reduction in avail- According to the Learning Policy Institute, 8 percent of
able dollars to support the needs of students with disabilities all teachers in the United States, or approximately 200,000
has further increased pressure on district budgets. teachers, leave the profession each year.23 Moreover, attrition
rates are much higher than 8 percent for new teachers and
As one county leader reported to WestEd staff during an inter- for teachers in high-poverty schools and school districts.24
view for this paper, the combination of declining enrollment
and increasing special education costs has put enormous Attrition in the teaching workforce comes at a high cost to
pressure on some districts: “Our declining enrollment takes school districts in California and nationally. At the national
19 Ibid. (This report also notes that California’s autism caseload increased 5.4 times between 2001/02 and 2013/14.)
20 https://data1.cde.ca.gov/dataquest/
21 http://www.ppic.org/content/pubs/report/R_1116LHR.pdf
22 http://www.ppic.org/content/pubs/report/R_1116LHR.pdf (p. 7)
23 https://learningpolicyinstitute.org/sites/default/files/product-files/A_Coming_Crisis_in_Teaching_REPORT.pdf
24 Estimates from the Learning Policy Institute’s September 2016 report suggest only around a third of teachers who exit the profession ever
return. Also see http://www.ppic.org/content/pubs/op/OP_601EBOP.pdf.
Silent Recession: Why California School Districts Are Underwater Despite Increases in Funding page 11level, the cost of replacing teachers who leave the classroom salaries of veteran teachers from the previous districts of
is more than $8 billion annually. The cost to replace individ- the incoming teachers. These bonuses represent substantial
ual teachers ranges from $10,000 in rural and small subur- investments by school districts that are already struggling to
ban districts to $20,000 or more in urban districts.25 Some of cover other costs.
these costs are driven by investments in professional devel-
opment for the teachers who enter the district to fill positions Employee Health Care Costs
that have been vacated. Another “cost” of the teacher short-
The costs of providing health care benefits for employees
age is in terms of an increase in the number of teachers who
and for retirees have also increased, and many districts do
are entering the profession with waivers, permits, and intern
not have the funds set aside to cover the growth in these
credentials. In other words, they have not necessarily had full
costs. Nevertheless, nearly all school districts in California
preparation to handle the challenges associated with teach-
provide benefits to current employees (covering medical,
ing, which may also impact the quality of student learning.
dental, and optometric costs either in part or in full, depend-
Often, districts must resort to long-term substitute teach- ing on the district, at least until employees turn 65), and about
ers in the scramble to fill all of the district’s vacancies. Many two-thirds of the state’s school districts also provide health
school districts across California are struggling to recruit and benefits to retired employees.
retain enough teachers to fill all of their vacancies, particu-
According to the LAO, districts are now spending about twice
larly in high-poverty, urban, and rural school districts. Teacher
as much on retiree health benefits as they did in the early
vacancies are also greater for science, mathematics, and
2000s, and the LAO notes, “This added cost pressure comes
special education.26
at a time when districts are facing other pressures — most
These shortages have led to competition among some notably, rising pension costs and expectations to enhance
school districts to attract teachers through higher wages. services for low-income students and English learners.”
Some school districts in which the shortages are the most Based on districts’ annual audit reports, the LAO calculated
acute have gone further to incentivize prospective teachers an unfunded liability for retiree health benefits alone of $24
to come to the district. For example, the Natomas Unified billion statewide.29
School District has offered to cover most of the cost of teacher
However, the same report from the LAO indicates that only
credential programs and provides free use of a MacBook and
a few large urban districts account for most of the unfunded
a bonus payment to teachers who live in the district. The
liability. These districts have unfunded liabilities ranging from
district also provides $5,000 in signing bonuses to bilingual
$3,800 up to $27,000 per pupil, while the average unfunded
and minority teachers. The Natomas district projects a cost
liability for all other districts in the state is approximately
of over $800,000 for its three-year recruiting effort.27 Similarly,
$1,500 per pupil. Yet, even $1,500 in additional funding per
the Golden Plains Unified School District, a district of fewer
pupil represents a substantial cost for districts that currently
than 2,000 students, offered a $3,000 signing bonus for all
receive about $10,657 per pupil on average in state funding.
new teachers in 2016/17. This signing bonus was increased to
$5,000 for new hires in 2017/18, with new bilingual teachers WestEd’s analysis of the general sample of 25 districts reveals
receiving a $7,300 bonus.28 Other districts offer to pay moving that between 2016/17 and 2017/18 alone, 10 of these school
expenses for teachers coming into the district, or match the districts anticipate an increase of at least $0.5 million in their
25
https://www.huffingtonpost.com/entry/we-can-solve-teacher-shortages-heres-how_us_59114ac7e4b056aa2363d899 and https://
www.washingtonpost.com/news/answer-sheet/wp/2017/09/18/where-have-all-the-teachers-gone/?utm_term=.9c9dda6654f2
26
https://learningpolicyinstitute.org/product/ca-district-teacher-shortage-brief
27
http://www.sacbee.com/news/local/education/article181911096.html
28
https://edsource.org/2017/outside-the-limelight-rural-schools-face-challenges-in-finding-and-keeping-teachers/579426
29
http://www.lao.ca.gov/Publications/Report/3704
Silent Recession: Why California School Districts Are Underwater Despite Increases in Funding page 12health-related expenditures, with 7 of these 10 anticipating into an additional $6.7 billion, or $1,083 per student, each year.
the increase to exceed $1 million. In 2016/17, these districts Yet, California is not alone in the inadequacy of spending for
ranged in enrollment from fewer than 3,000 students in one facilities. The report ranks California’s spending — $806 per
district to more than 53,000 students in another. Moreover, student on maintenance and operations in 2013 — as being
the average increase in spending on health-related expenses “average” in a nation of what it calls “underspenders.”31
between 2016/17 and 2017/18 among the sample of 25 school
A 2017 report from California’s Legislative Analyst’s Office
districts is approximately $800,000, representing a 4-percent
(LAO) confirms the existence of a gap in funding for facil-
increase in just a single year.
ities — specifically, a gap between what is necessary to
address the facilities needs of local school districts and what
Aging Facilities the state has proposed under a new bond measure passed
Another looming cost to California school districts is the by voters in 2016.32 According to the report, the governor’s
cost to repair, replace, and modernize school facilities. Many $655-million bond proposal “would clear the $370 million in
districts have delayed costly repairs to school sites due to a already approved school projects awaiting funding [but] only
lack of funding to support these efforts. A policy research $285 million would be available to address the remaining $2
paper by the Center for Cities and Schools at the University billion in projects on the acknowledged list.” The LAO has
of California, Berkeley, identified an “ongoing, structural raised concerns about funding for facilities in California previ-
pattern of inadequate and inequitable spending in many ously as well. In 2015, the LAO wrote the following:
school districts” on K–12 public school facilities in California.
Many groups over the years have raised serious
Consequently, more than half of the school districts in
concerns with the state’s current school facilities
California continue to underspend on facilities each year,
program. Notably, the existing program fails to
resulting in costly repairs and health and safety risks in some
treat school facility costs as an ongoing expense
cases. The paper also identified that school districts serv-
despite the recurring nature of facility needs, allows
ing higher numbers of low-income students “spent less on
disparities based on school district property wealth,
capital outlay per student and more on maintenance and
fails to target funding according to greatest need,
operations per student than districts serving higher-income
results in excessive administrative complexity, and
students…. This means school building operations cost more
lacks adequate accountability mechanisms. 33
in these poorer districts, leaving fewer dollars for education
programs.”30 As the costs of aging facilities increase, districts To raise additional dollars for school facilities, districts can go
are left with fewer dollars overall, creating further pressure on to their local voters for approval of general obligation bonds.
their already constrained budgets. However, voter willingness to approve such bonds varies
by city and region, and this willingness is not necessarily
To meet industry standards for facilities, schools would need
in accordance with school district need. According to an
to spend on maintenance and improvements an amount each
Ed-Data analysis of local school facilities funding, “With nota-
year that is equivalent to about 7 percent of what it would
ble exceptions, large urban districts or districts with relatively
cost to replace each building, according to a 2016 report by
few businesses and high concentrations of lower-income
the Center for Green Schools, the National Council on School
families have more difficulty generating support for schools.
Facilities, and the 21st Century School Fund. In California,
This circumstance results in inequities that are outside the
such maintenance and improvement costs would translate
30
http://citiesandschools.berkeley.edu/uploads/Vincent__Jain_2015_Going_it_Alone_final.pdf
31
https://kapost-files-prod.s3.amazonaws.com/published/56f02c3d626415b792000008/2016-state-of-our-schools-report.
pdf?kui=wo7vkgV0wW0LGSjxek0N5A
32
http://www.lao.ca.gov/handouts/education/2017/School-Facilities-033017.pdf
33
http://www.lao.ca.gov/reports/2015/budget/school-facilities/school-facilities-021715.aspx
Silent Recession: Why California School Districts Are Underwater Despite Increases in Funding page 13scope of the Serrano v. Priest guidelines for more nearly Department of Finance projects that enrollment will decline
equal treatment of taxpayers and of students.”34 in 28 of 58 counties by 2026/27, including 18 counties that will
lose 5 percent or more of their enrollment. Ventura and Santa
The district chief business officers (CBOs) who were inter-
Cruz Counties are each projected to lose over 10 percent of
viewed for this report detailed the difficulty of keeping up with
their K–12 enrollment by 2026/27. In the same time period,
the rising cost of facilities. One CBO focused specifically on
Orange County and Sonoma County are each projected
the challenge of raising revenue locally through general obli-
to lose over 14,000 students, while Los Angeles County is
gation bonds to cover the gap between local needs and state
projected to lose nearly 120,000 students.35
funding for facilities. Giving an example, the CBO noted the
difficulty of covering the costs associated with aging facilities Enrollment has declined since 2014/15 in 11 of the 25 districts
as well as the rising costs of basic utilities such as water and in the general sample analyzed for this report (Table 2).
electricity. “Although we may be getting an increase with the Although reductions in the actual number of students were
Local Control Funding Formula, $4 million of our new money not particularly substantial, the decline in enrollment still
is already spoken for…. That doesn’t even include utilities and represents a loss of spending power and economy of scale
facility needs…. It’s just a real challenge that our base funding for these districts. With state funding at approximately $10,657
is not adequate to cover all of our needs.” Similarly, another per pupil, a reduction of even 55 students equates to a loss
CBO talked about the need to maintain and modernize aging of over half a million dollars for a district. Yet, declines in
facilities through a $10-million project in a district with an enrollment are not uniform across districts. Accordingly,
annual budget of $100 million. To fund the project, the district school districts may benefit from tools to accurately
plans to ask the community to pass a new bond measure project student enrollment changes, as well as a flexible
while the district is still paying off an earlier bond. The CBO state policy environment so that district leaders can antic-
recognized that getting support for the new bond would be ipate changes in funding and adjust classroom, staffing, and
difficult. “It’s going to be a tough sell…. Our high school, our budgeting allocations accordingly.
infrastructure system is like 50 years old. It was built back in
1967, I believe. And we still have the old infrastructure…. So
that, right now, what we’re doing is that project, regardless if
we have a bond or not, we have to fix it.” From the experience
of these CBOs, there simply is not enough state funding or
local borrowing capacity to keep up with the demands of
maintaining or replacing their district facilities.
Declining Enrollment
Under the LCFF, funding for school districts in California is
directly tied to enrollment as measured by average daily
attendance (ADA). Over the last 20 years, California has had a
relatively flat level of student enrollment, and the Department
of Finance projects a decline of 181,000 students over the
next decade. While the overall enrollment is declining in the
majority of California school districts, there are some areas
with more significant declines in student enrollment. The
34
https://www.ed-data.org/article/School-District-Bond-and-Tax-Elections
35
http://www.dof.ca.gov/Forecasting/Demographics/Projections/Public_K-12_Graded_Enrollment/
Silent Recession: Why California School Districts Are Underwater Despite Increases in Funding page 14Table 2. Changing enrollment in sample districts, 2014/15 to 2016/17
Enrollment
2014/15 2015/16 2016/17 % Change
Change
District 21 9,277 8,900 8,782 -495 -5.3%
District 5 10,921 10,632 10,362 -559 -5.1%
District 19 16,935 16,702 16,426 -509 -3.0%
District 24 14,996 14,736 14,554 -442 -2.9%
District 2 1,936 1,916 1,881 -55 -2.8%
District 1 32,938 32,454 32,004 -934 -2.8%
District 11 23,947 23,885 23,696 -251 -1.0%
District 10 22,258 22,205 22,039 -219 -1.0%
District 13 53,365 53,303 53,152 -213 -0.4%
District 12 28,999 28,719 28,958 -41 -0.1%
District 16 9,914 9,948 9,904 -10 -0.1%
District 3 14,768 14,754 14,778 10 0.1%
District 6 62,888 62,767 63,061 173 0.3%
District 9 2,482 2,545 2,505 23 0.9%
District 23 42,339 42,462 42,769 430 1.0%
District 17 15,584 15,717 15,772 188 1.2%
District 18 3,353 3,424 3,397 44 1.3%
District 15 31,954 32,255 32,425 471 1.5%
District 20 20,415 20,530 20,779 364 1.8%
District 4 11,259 11,374 11,547 288 2.6%
District 14 6,349 6,511 6,579 230 3.6%
District 8 37,318 38,070 38,705 1,387 3.7%
District 22 6,555 6,714 6,814 259 4.0%
District 7 11,204 11,438 11,722 518 4.6%
District 25 1,982 2,040 2,188 206 10.4%
Sample District Totals 493,936 494,001 494,799 863 0.2%
Statewide Totals 6,235,520 6,226,737 6,228,235 -7,285 0%
Source: https://dq.cde.ca.gov/dataquest/
Silent Recession: Why California School Districts Are Underwater Despite Increases in Funding page 15A decline in enrollment can also mean that districts do not schools. The number of charter schools has increased each
require as much funding to meet current student needs. For year, as has the number of students enrolled in charter
example, the district may not need to hire as many teachers, schools. Currently, there are over 1,200 charter schools in
counselors, or staff. Yet, reductions in funding in response to California, with approximately 630,000 enrolled students.
declines in student enrollment are complicated by several Charter school enrollment now represents nearly 10 percent
factors. First, when district enrollment declines, the district’s of the state’s overall student enrollment. Furthermore, charter
fixed costs (e.g., heating, lighting, maintenance) then consume schools are expected to continue to increase enrollment by
a larger share of the budget and districts do not generally see nearly 30,000 students in California in 2017/18.36
declines in demands for specialized programs such as special
Increased enrollment in charter schools in California contrib-
education and English learner supports (see the Increasing
utes to reductions in school district budgets. When students
Special Education Costs section for additional detail). In
leave their district to attend a local charter school, state fund-
addition, certain adjustments can be difficult to scale to the
ing follows them out of the district.37 With the state’s per-pu-
reduction in the number of students. For example, a reduc-
pil funding at approximately $10,657 per student, a loss of
tion of 6 students per grade level may not be enough to allow
enrollment of 30,000 students equates to a loss of nearly
for reducing the number of teachers. If the district loses 30
$320 million in funding for California’s school districts.
students in a single grade level, however, staffing reductions
— and therefore cost savings — may be more straightforward
for the district.
In addition to experiencing declining enrollment caused by
shifts in the number of school-age children, many California
school districts have experienced enrollment declines as
students exit the traditional public school system for charter
36
http://www.ccsa.org/understanding/numbers/
37
https://www.edweek.org/media/2016/12/29/school-finance-education-week-quality-counts-2017.pdf
Silent Recession: Why California School Districts Are Underwater Despite Increases in Funding page 16IMPLICATIONS OF THE
SILENT RECESSION
The fiscal challenges outlined in this paper are a clear sign reduce investments in current employees and programs,
that many California school districts face a tough road ahead effectively crowding out other investments.38
with wide-ranging implications for students, community,
staff, and district leadership. Moreover, several of the fiscal Tradeoffs
challenges outlined in this paper tend to have a dispropor-
Such crowding out means that school districts may be forced
tionately negative impact on high-poverty districts with
to make tradeoffs as they balance competing costs and adjust
larger concentrations of at-risk student groups. These costs,
to constrained revenues. District leaders will need to consider
therefore, have the potential to exacerbate inequities in fund-
how to make spending (and cutting) decisions, while keep-
ing at the same time that the Local Control Funding Formula
ing their goals for student success at the center of their deci-
(LCFF) is designed to make funding more equitable.
sion-making process. Yet, district leaders must also contend
Importantly, the current budget challenges faced by a number with having limited control over some of the rising costs. Figure
of California school districts cannot be wholly explained by 3 is a conceptual framework for exploring the level of control
external pressures and rising costs. Rather, some districts have that districts have over these encroaching costs and their rela-
put off difficult budget choices (such as spending on school tive impact on district budgets. The framework is intended to
facilities) and have struggled to communicate the implica- represent the range of controls and costs among districts, since
tions of budget and collective bargaining decisions to the district costs and — in some cases — level of control are impacted
community and other key stakeholders. Furthermore, in some by local factors. For example, enrollment remains steady in some
districts, decisions about the budget have been complicated districts in California, while other districts are disproportionately
by the decisions of local school board members who have impacted by declines in enrollment and the resulting reductions
failed to heed the advice of chief business officers (CBOs) and in state funding provided to these districts.
other district leadership about the need for fiscal constraint.
The framework is also intended to help district superinten-
Other school districts have faced their budget challenges
dents, CBOs, and policymakers pinpoint where districts may
directly, suggesting the need to reduce this variation across
need additional support from the state in order to make
districts and move more consistently toward better deci-
changes, and where they have greater control over district
sion-making across all of California’s school districts.
expenditures. For example, districts have little control over
Outlining these fiscal challenges and the variety of responses costs such as their rising contributions to pension funds,
to them, as well as raising awareness about these challenges, which have a large impact on district budgets. However,
are critical to helping decision-makers and the public under- districts may have more control over facilities costs, where
stand the ways in which districts, with increasing constraints planned investments in maintenance may reduce potentially
on their budgets, will likely be pushed to conduct business larger expenditures in the future.
differently in the future. Laying out the challenges ahead may
The second paper in this series, in development for publica-
also help to highlight where districts can plan for growing
tion in 2018, focuses on budget strategies and addresses those
costs that are outside of the districts’ control. For example,
strategies that fall into the upper-left circle in the framework
many commentators have noted that pension costs, which
shown in Figure 3. These are strategies over which districts
are largely outside of the control of district leaders, will likely
have greater local control and which have the potential to
make a substantial impact on district budgets.
38
https://siepr.stanford.edu/sites/default/files/publications/17-023.pdf
Silent Recession: Why California School Districts Are Underwater Despite Increases in Funding page 17Figure 3. Districts have varying degrees of control Since employee salaries and benefits represent such a
over rising fiscal pressures, and some fiscal pressures large share of district budgets (approximately 82 percent
have a disproportionate impact on district budgets in California in 2015/16),39 the tradeoffs that districts make
will almost certainly include decisions about how much to
invest in salaries and benefits for employees. The tradeoff
between investing in employee costs versus other costs has
implications for each district’s ability to compete with other,
better-resourced districts and with other industries to attract
quality staff. It also will likely impact whether districts are able
to provide livable wages for employees, allowing them to
live in the communities in which they teach. General Fund40
expenditures on employees have continued to climb over
the years, driving up total expenditures in districts across the
state (Figure 4).
39 http://www.ed-data.org/
40 According to the California School Boards Association, “The General Fund includes both a restricted and unrestricted portion. We often
refer to the General Fund unrestricted as the ‘fund of last resort’ because it is where most of the district’s discretionary dollars reside. The
majority of all salaries and benefits, on average approximately 84% of the district’s expenditures, reside in the General Fund.”
(http://csba.org/TrainingAndEvents/~/media/CSBA/Files/TrainingAndEvents/AllEvents/MastersInGovernance/Course3_
FIN/2014_07_SchoolFinanceTerms.ashx)
Silent Recession: Why California School Districts Are Underwater Despite Increases in Funding page 18Figure 4. Increase in employee costs over time for California school districts
$27B
$26B
$24B
$23B $23B $23B
$9B
$8B
$7B $7B $7B $8B
$5B
$5B
$4B $4B $5B $5B
$3B
$2B $2B $2B $2B $3B
Note: Examples of “Other Post-Employment Benefits” include retirement incentives, tax-sheltered annuities, and deferred compensation.
Source: California Department of Education; data retrieved from http://www.ed-data.org/ on January 8, 2018
The crowding out caused by increasing employee-related Deficit Spending
costs and other expenses will also impact the types of WestEd’s analysis also indicates that the current fiscal pres-
programs and services that districts are able to provide. With sures have pushed many school districts into deficit spend-
fewer General Fund dollars available, districts may have to ing. Specifically, for all of the 55 districts selected for this
reduce some of the resources offered to children and fami- paper’s analyses, WestEd determined the net increase or
lies. These decisions must be made in light of the LCFF’s decrease in each district’s unrestricted funds, according to
requirement to use supplemental and concentration funds the districts’ multiyear projections (MYPs).42 The MYPs for
to “increase or improve” services for targeted student groups, all but three of the districts in this sample indicate that the
and may be influenced by pressure from advocacy groups to districts’ unrestricted expenditures will exceed revenues in
ensure that these funds reach the students they are intended at least one of the three years following the current budget
to serve, as well as being driven by education leaders’ desire year, and more than half of the school districts in the sample
to close achievement gaps.41 anticipate that expenditures will exceed revenues in all of the
next three years (Figure 5).43 Table A3 has additional details
41 https://www.cde.ca.gov/fg/aa/lc/lcfffaq.asp
42 WestEd researchers analyzed the unrestricted funds because these funds indicate a district’s fiscal solvency.
43 The analysis of each district’s MYP was unable to distinguish between the use of ongoing funds versus one-time funds by the district,
which may impact the net increase/decrease for the school district’s budget over time.
Silent Recession: Why California School Districts Are Underwater Despite Increases in Funding page 19You can also read