Freight shift from road to rail - Environmental Affairs
←
→
Page content transcription
If your browser does not render page correctly, please read the page content below

Freight shift from road to rail                         REPORT

THE SOCIO-ECONOMIC IMPACT OF A MODAL SHIFT OF FREIGHT FROM ROAD TO RAIL TO
ACHIEVE MAXIMUM GREENHOUSE GAS MITIGATION IN THE TRANSPORT SECTOR

       environmental affairs
       Department:
       Environmental Affairs
       REPUBLIC OF SOUTH AFRICA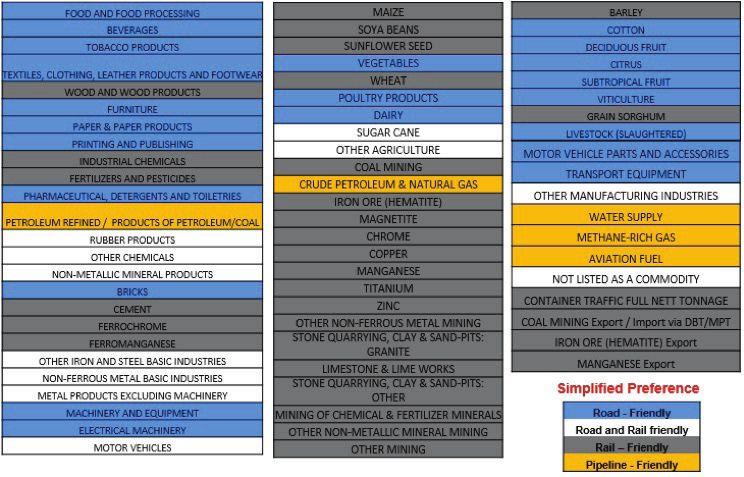

Freight shift from road to rail
Printed and published by
Department of Environmental Affairs

Design and layout by Chief Directorate:
Communications Private Bag X447,
Pretoria
Acknowledgements
The study on socio-economic impact of a modal shift of freight from road to
rail to achieve maximum greenhouse gas mitigation in the transport sector was
supported by the Deutsche Gesellschaft für Internationale Zusammenarbeit
(GIZ), on behalf of the Federal Ministry for the Environment, Nature Conservation,
Building and Nuclear Safety (BMUB) of the Republic of Germany.
The study was conducted by Palmer Development Group (PDG), in partnership
with Camco Clean Energy (South Africa).
The project team acknowledges various inputs received from WWF (South Africa),
Road Freight Association (RFA), Transnet, Department of Transport and other
stakeholders that made contributions towards the development of this report.

Contents

Executive summary .................................................................................................. VI
Purpose of the study ................................................................................................XII

1 Introduction .............................................................................................................1

2 Background and terminology ..............................................................................2
2.1 .The freight transport sector and the national freight flow model ..................2
2.2 .Road infrastructure ..............................................................................................6
2.3.Rail infrastructure ..................................................................................................9
2.4.Modes of freight movement................................................................................9
2.4.1 .Trucks ..................................................................................................................9
2.4.2. Trains .................................................................................................................10
2.5.Socio-economic modelling ..............................................................................12
2.5.1 .Job impacts .....................................................................................................14
2.6.South Africa’s freight sector ..............................................................................15

3. Methodology .........................................................................................................16

3.1 F. reight demand model methodology ............................................................17
3.2.Costing methodology .......................................................................................17
3.2.1 .Cost summary ..................................................................................................23
3.3.Socio-economic modelling methodology .....................................................24

4. Analysis...................................................................................................................24

4.1 .South Africa’s current freight movements ......................................................24
4.2.Freight movement projections .........................................................................27
4.2.1 S. electing different freight outlooks for analysis ...........................................27
4.2.2.Freight projection results ................................................................................29
4.3 .Dryports ...............................................................................................................30
5. Results ....................................................................................................................31

5.1.Business as usual outlook ...................................................................................31
5.1.1.Effect on GDP ..................................................................................................31
5.1.2.Effect on economic sectors ...........................................................................32
5.1.3.Effect on jobs ...................................................................................................32
5.1.4 .Surplus effects ..................................................................................................33
5.2.Transnet (high) uptake outlook ........................................................................33
5.2.1.Effect on GDP ..................................................................................................33
5.2.2.Effect on economic sectors ...........................................................................33
5.2.3.Effect on jobs ...................................................................................................34
5.2.4 .Surplus effects ..................................................................................................34
5.3.Medium uptake outlook ...................................................................................35
5.3.1.Effect on GDP ..................................................................................................35
5.3.2 E
      . ffect on jobs ...................................................................................................35
5.4.Low uptake outlook ...........................................................................................36
5.4.1.Effect on GDP ..................................................................................................36
5.4.2 E
      . ffect on jobs ...................................................................................................36
5.5 .Results summary .................................................................................................37
5.5.1.Overall impact on employment ...................................................................37
5.5.2.Implications for direct jobs .............................................................................38
5.5.3 O
      . verall impact on GDP ..................................................................................39

6.Limitations of the study .........................................................................................40

7 .Conclusion .............................................................................................................41
7.1.Environmental impact .......................................................................................41
7.2. Economic ............................................................................................................41
7.3. Employment ........................................................................................................42

8. References .............................................................................................................45
Executive summary
The Department of Environment Affairs has recently completed a Mitigation
Potential Analysis (MPA) for South Africa aimed at identifying priority mitigation
measures which will significantly reduce greenhouse gas emissions. One of the
most favourable measures, taking both the extent of mitigation of emissions and
the associated social and economic impacts in to consideration is the shift of
freight from road to rail. It has the potential to save almost 3 000 ktCO2eq (0.66%
of the total mitigation potential in South Africa, according to the MPA). However,
DEA has retained a concern over the possible job losses caused by the road
to rail freight shift, primarily as rail freight is less labour intensive. Therefore this
research was commissioned to assess the impact on jobs and, more broadly, on
the economy as a whole.
The quantification of the socio-economic impact of the modal transition of
freight from road to rail has been undertaken through three stages of analysis:
• A projection of the freight movements throughout the country but with
  specific attention to movements along corridors where the opportunities for
  modal shifts are greatest, taking into consideration commodities which are
  well suited to transport by rail.
• A projection of the overall costs which will be borne by the economy during
  the construction of new infrastructure and the operational costs associated
  with the modal shift.
• Application of these costs to a socio-economic model which allows the
  broader economic impacts, including employment impacts, on the South
  African economy to be assessed.
In making projections of freight quantities, Transnet’s Freight Demand Model has
been used to determine the projected growth of the full range of commodities.
Freight has been broken down into 74 commodity types with these grouped as
follows:
• Bulk commodities which are generally moved in large quantities and are not
  suited to packaging or containerising. They can be in solid, liquid or granular
  forms. Examples of bulk commodities in South Africa are coal, iron ore,
  petroleum-based products and some forms of agricultural products (such as
  wheat and maize).
• General freight is freight which is not classified as bulk cargo. It encompasses
a very broad range of products, and is generally differentiated from bulk by
   being either fragile, perishable, valuable or because the volume of cargo
   moved is too low for it to be considered as ‘bulk’. For the purposes of this
   study, the definition of general freight is deliberately left broad as this will
   allow for the greatest flexibility associated with shifting the mode of transport.
   • Break bulk is sub-component of general freight which is loaded onto/into
     a mode of transportation as individual or bundled pieces. Examples of this
     are palletised goods, such as cement bags or processed food.
These commodity groupings line up with their relative ability to be moved via rail.
Bulk freight is clearly suited to rail movement, as it is high volume and generally
lower value per mass and generally has relatively fixed origin and destination
points. General freight is suited to make a transition from road to rail if it flows
along a corridor (with relatively fixed origin and destination points) and it is in a
palletised or palletisable form. Therefore the emphasis in this study is on general
freight movements along corridors.
Projections of freight movements are made based on economic growth with
mass of freight movements closely correlated to economic growth (overall freight
growth is assumed at a constant 0.25% less than GDP growth). Projections are
made from the current year (2014) to 2050. Having these projections the second
component of the analysis, the costing was undertaken using the following data:

 Aspect of costing model     Road                        Rail
 Vehicle capital cost        Road Freight Association Transnet Long Term
                             tables                   Planning Framework
 Infrastructure capital      South African National      Transnet Long Term
 cost                        Roads Agency Limited        Planning Framework
                             Asset Management
                             Plan, bilateral
                             discussions & own
                             calculations
 Vehicle operating cost      Road Freight Association Transport Research
                             tables                   Support, Public-Private
                                                      Infrastructure Advisory
                                                      Facility, World Bank
                                                      (2011)
Aspect of costing model Road Rail
Infrastructure operating SANRAL Asset Transport Research
cost Management Plan Support, Public-Private
Infrastructure Advisory
Facility, World Bank
(2011)
Applying this data the, both capital and operating costs of moving freight can
be calculated with the results shown in the table below:
Costs incurred per year (2014 Rbn)
Road Rail
Vehicle capital cost 25 2
Infrastructure capital cost 7 4
Vehicle operating cost 422 47
Infrastructure operating 2
cost
The figures above are shown in the average year, which is estimated to be the year 2032. The figures re
for the Transnet (high) uptake outlook.
In considering costs it is notable that the emphasis of this analysis is on direct
costs of moving freight. In reality customers who require freight services look at
the total overall impact on their businesses of moving their goods, taking risk
associated with uncertain delivery times, inventory holding costs and other non-
cost factors into consideration. In excluding these ‘costs’, which are too complex
to estimate in a study of this nature, the result is overly favours the potential for a
shift to rail freight.
Turning to projections on economic and employment impacts, in order to make
comparisons in terms of road to rail shifts, a base case needs to be established.
For this case, the current freight makeup was projected forward, and assumed
zero move from road to rail (the current relative proportions were maintained).
Three different uptake outlooks were then modelled, with varying rates of freight
uptake by rail. The results of these freight uptake outlooks were compared to
that of the business as usual outlook. The only variable which changes between
scenarios is the rate of change of freight uptake. Transnet has an aspirational
upper limit of a 70% market share of general freight on corridors by the year
2043, with the medium and low uptake outlooks presenting 50% and 30% general
freight corridor based market shares by 2043 respectively.The economic modelling is aimed at assessing three sets of impacts, taking both GDP and employment changes into consideration: • Direct impacts are associated with projected changes in the transport sector itself: changes in GDP and employment in the road and rail freight industries. • Indirect impacts are due to backward (upstream) linkages which are caused through the changes in inputs to the transport sector through, for example, the purchase of fuel and vehicles. In modelling also include induced impacts associated with changes in the backward linked sectors. These backward linkages impact on sectors of the economy separate from transport. These other sectors may be affected positively or negatively depending on the change in purchases from these sectors by the transport sector. • Surplus impacts are the ‘forward’ impact which is caused by the change in the amount of transport used (and purchased from the transport sector) by all the sectors of the economy where freight movement is required. This impact is assessed through the change in net cost transport which is effectively a change in price (for example, a lowering in price results in greater surpluses with this additional money stimulating the economy as a whole). The results of the analysis are reported in the main body of this report in terms of GDP and employment (total labour years) changes for the full modelling period. They can be interpreted as figures per year by taking an average over the modelling period. The overall employment results from the modelling process are depicted in the figure below. Cumulative employment by freight uptake outlook
As is evident in the graph depicted above, there is a job loss in the direct, indirect
and induced industries relative to the ‘business as usual’ outlook. This is offset by
the surplus employment which is generated as a result of the savings which are
incurred due to the modal shift. The overall level of employment will improve in
the economy due to the modal shift.
While it is necessary to consider the implications of direct job losses (discussed
further below), this should not detract from the overall impact of the model
shift on the South African economy which will benefit significantly as indicated
above. Even considering the losses in the backward linked sectors such as the
manufacturing of road freight vehicles and fuel, these are more than offset by
benefits to households due to lower costs of goods, with the surplus available to
households use to purchase goods and services in the economy as a whole and
hence create jobs.
Looking at direct employment in the transport sector only it is evident that there
will be job losses. These need to be related to the current situation where data
is uncertain. However, based on an assessment of StatsSA (2010) and Human
Sciences Research Council (2008) information, it is estimated that the current
employment levels are in the region of 121 000 jobs in the freight transport sector.
Of these jobs an estimated 81 000 are involved in corridor based movements.
In the average year of 2032, the business as usual scenario estimates that there
will be 169 000 jobs in the corridor based movements of general freight. The
model estimates a total loss of 115 000 direct job loss due to the freight modal
shift, leaving an estimated employment of approximately 54 000 along corridors
shifting general freight. This is a direct job loss of approximately 27 000 jobs1. It
must be noted that these job losses would only be incurred in corridors based
movements, and this is offset by substantial gains made in the freight transport
sector as a whole (bulk freight and non-corridor based general movements in
metros and rural areas).
The timing of potential job losses in the road freight industry also needs to be
considered: this will happen gradually and it is highly unlikely that workers will
need to be retrenched due to a shift of freight from road to rail. It is more likely
that the trucking businesses will shift their business to other parts of the transport
sector, either away from competing with rail on corridors, or moving to shorter
haul intra-city movements. If retrenchment were to happen the economic surplus
effect will result in greater job opportunities elsewhere in the economy. It should

1
 Note that this is for the high freight uptake outlook, which is Transnet’s aspirational position, but it may
not necessarily be attainable
also be noted that the high freight uptake by rail outlook is only aspirational at
this point, and it is likely that a lower uptake will in face occur, thus there may be
no direct job losses on corridor based movements.
In order to mitigate job loss in the direct and indirect sectors, there are a few
approaches that could be taken:

Supplier development
Any expenditure which leaves South Africa does not benefit the country’s GDP
and employment levels, therefore the development of suppliers within the
country should be a priority. This includes, among other:
• Construction of rail infrastructure
• Manufacturers of rail vehicles
• Manufacturers of road vehicles (both for freight and passenger vehicles)
• Industries which are involved in the backward linkages of these industries, such
  as the energy industry where there are many new developments currently.

Passing on of cost savings to the consumer
There is a tendency for companies to identify an area of potential profit,
especially those in monopolistic situations such as Transnet. However, Transnet
is in a unique position as a parastatal to ensure that the benefits of reduced
logistics costs are passed on, resulting in increased disposable income for the
consumer. Through doing this, there will be greater economic benefits resulting
through the multiplier effect.

Supporting transport sector as a driver of the economy
Rather than see the negative possibility of job losses in the transport sector
the much more important positive impact on the economy as a whole of an
effective transport sector should receive attention. By increasing investment in
transport infrastructure and the sectors serving it, the spin-off for the economy as
a whole, including jobs, is substantial. This can occur at the same time as making
the cost of freight transport lower.
Purpose of the study
The Department of Environmental Affairs (DEA), with support from the German
International Cooperation (GIZ), commissioned Palmer Development Group,
trading as PDG, to perform a socio-economic impact study on the potential
modal shift of freight from road to rail in order to achieve maximum greenhouse
gas mitigation. PDG was supported by Carbon Asset Management Company
(Pty) Ltd, trading as Camco Clean Energy (South Africa) and Dr Neil Jacobs.
The purpose of this study was to provide further insight into the potential socio-
economic impacts of the potential freight modal shift from road to rail. This follows
from previous work done by DEA on the Mitigation Potential Analysis (MPA)
which identified this modal shift in the freight sector as one of the most beneficial
greenhouse gas (GHG) mitigation measures, making this a national priority of
Government. However, there have been concerns about direct job losses in the
road freight industry and hence this project intended to look at employment
impacts in the context of broader employment and economic impacts of a
projected modal shift.
Introduction
Rail transport has the potential, under the right circumstances, to provide a
cost effective freight transport option, making the economy more efficient,
provide access for freight and passenger movements, as well as providing an
environmentally sustainable transport solution. However, rail transport has its
limitations with the primary disadvantage being that it provides limited flexibility
in terms of destinations located off main freight and passenger movement
corridors. This is particularly significant when non-corridor movements in rural and
metropolitan areas are considered (Havenga & Pienaar, 2012). Nevertheless, the
opportunities for shifting freight movements from road to rail along corridors are
substantial and hence the Department of Environment Affairs, assisted by GIZ,
have commissioned this study which is aimed at investigating the impacts of a
road to rail shift.
The study follows from the recently completed Mitigation Potential Analysis
(MPA) undertaken by DEA which identified the shift of freight from road to rail
as a high priority greenhouse gas mitigation measure. It has the potential to
save almost 3,000 kilotons of carbon dioxide equivalents (ktCO2 eq) per year
by the year 2050 (approximately 0.66% of the total mitigation potential in South
Africa, according to the MPA). In addition to the potential greenhouse gas
mitigation effects, the MPA indicated that the modal shift also has the potential
to generate employment in the economy as a whole at a relatively low cost per
unit of emissions abated.
Historically, rail was the preferred method of moving freight in South Africa, but
following the deregulation of the transport sector, the rail market share has
progressively decreased. The investment in the rail transport infrastructure also
decreased in conjunction with the liberalisation of transport in South Africa. Due
to the decreased condition of rail infrastructure, there are significant challenges
in promoting the most economically effective movement of freight. There
is a modal imbalance between road and rail movements, which leads to an
unsustainable use of road infrastructure (Havenga & Pienaar 2012). This has led to
strain being put on the national fiscus due to increased capital and maintenance
costs of road infrastructure, as well as strain on the private sector who are forced
to use more expensive road transport as the mode of choice.
The current contribution of freight logistics to the South African economy is
estimated at 13.5% of the gross domestic product (GDP) (Council for Scientific
and Industrial Research, 2013). This is higher than the international average in
developed countries of 8-10% of GDP. A significant contributor to this relatively

                                                                                       1
high freight contribution is the long-distance road transport market share,
attributable to an extent to the fact that our largest economic centre is inland,
which means larger transport effort and thus higher costs. It is also influenced by
the high proportion of low value, high mass primary goods which are sensitive to
logistics costs which make up a large portion of their delivered costs (Havenga,
2013).This relatively high dependence on logistics creates a relatively high
exposure within South Africa to price shocks caused high reliance on imports in
the transport sector, such as exchange rate and oil price changes. This exposure
has been necessary though, as the efficient movement of freight is vital for
growth and economic development (Harris & Anderson, 2011).
The challenge for South Africa is that even if rail were to triple the current volume
of freight movements, it is estimated that road transport would need to increase
by 180% in order to meet the projected freight demand levels in 2043. Therefore,
if the evidently more sustainable rail freight solution is to be dominant, there will
need to be a dramatic change in the modal split of freight transport (Havenga
2013). In considering the impact of such a shift on the South African economy,
it is notable that the direct impact on the transport sector itself needs to be
considered along with broader impacts which occur through the indirect impact
associated with more efficient freight movements.
2 Background and terminology
In order for a socio-economic analysis to be performed on the freight transport
sector, a better understanding of the transport sector itself is needed. This section
will provide a description of the components of the sector, the terminology
associated with the sector and a description of the components which are the
inputs to the socio economic modelling process.
This section covers a description of the freight sector and the national freight
flow model, the road and rail infrastructure necessary for freight movements,
the road and rail vehicles necessary to move the freight, the socio economic
model which calculates the economic impacts of freight transitions and, finally,
an overview of South Africa’s freight sector makeup.
2.1 The freight transport sector and the national freight flow model
Professor Jan Havenga and Professor Wessel Pienaar of the Department of
Logistics at Stellenbosch University created a national freight flow model (NFFM)
in order to provide information on the modal market share and freight flows in
2 Freight shift from road to railSouth Africa. The primary objective of this model is to inform infrastructure policy
decisions and planning, and, secondly, to provide lead and lag indicators of the
performance of the freight transport network (Havenga, J H & Pienaar W J, 2012).
The NFFM methodology is covered extensively in Havenga & Pienaar (2012), with
a brief summary provided here. The NFFM uses the national input-output table
(I-O table) to model the supply of commodities geographically (by magisterial
district). The I-O table quantifies all transactions that take place between the
main economic sectors in a particular year. These transactions are monetary,
which is then converted into a volumetric transaction by using commodity
densities and prices. The modal split is determined by subtracting the known
flows (rail, pipeline, conveyor and coastal shipping) from the calculated values.
The freight demand model (FDM) is a forward projection, using the NFFM as the
base from which projections are made. It uses both tons and ton-kilometres (t.km)
as units of measurement. The usage of t.km is most common in freight modelling
as it is indicative of both the mass and the distance that the freight is moving.
There are three different spatial circumstances affecting the movement of
freight:
• Corridor movements occur along a defined geographical route, typically
between major metropolitan areas and ports. They are variable in length
depending on their specifically identified Origin/Destination (OD) points.
Examples of corridors would be the Cape Town to Gauteng and the Durban
to Gauteng corridors.
• Rural movements are characterised by a dispersion of OD points. These are
generally movements of agricultural or other primary products direct to ports
or urban hubs where the goods may be processed or transferred to other
modes or into corridor routes.
• Metropolitan movements are movements which occur within metropolitan
areas. They are generally either the first or last component of a longer
movement, or they can be movements between independent origin and
destination points within metropolitan areas (say from warehouse to a retailer).
Another distinction which needs to be made is the differentiation of bulk
commodities and general freight commodities:
• Bulk commodities are generally moved in large quantities. They can be in
solid, liquid or granular forms. Examples of bulk commodities in South Africa
are coal, iron ore, petroleum-based products and some forms of agricultural
products (such as wheat and maize).
3• General freight is freight which is not classified as bulk cargo. It encompasses
a very broad range of products, and is generally differentiated from bulk by
being either fragile, perishable, valuable or because the volume of cargo
moved is too low for it to be considered as ‘bulk’. For the purposes of this
study, the definition of general freight is deliberately left broad as this will
allow for the greatest flexibility associated with shifting the mode of transport.
• Break bulk is sub-component of general freight which is loaded onto/into
a mode of transportation as individual or bundled pieces. Examples of this
are palletised goods, such as cement bags or processed food.
Three other methods are useful for categorising freight transport. These distinctions
are made in Figure 1. The categories are:
• Rail friendly freight (predominately bulk freight),
• Competitive freight (freight which can move by either road or rail),
• Road friendly freight (generally perishable or valuable cargo)
• Pipeline friendly freight
Figure 1: Commodities and their classification by road, competitive (road and rail friendly), rail and
pipeline friendliness2 (Source: Department of Transport, 2011)
2
It should be noted that different organisations and entities define these categories differently, and
these are not used as an absolute measure to determine modal shifting potential.
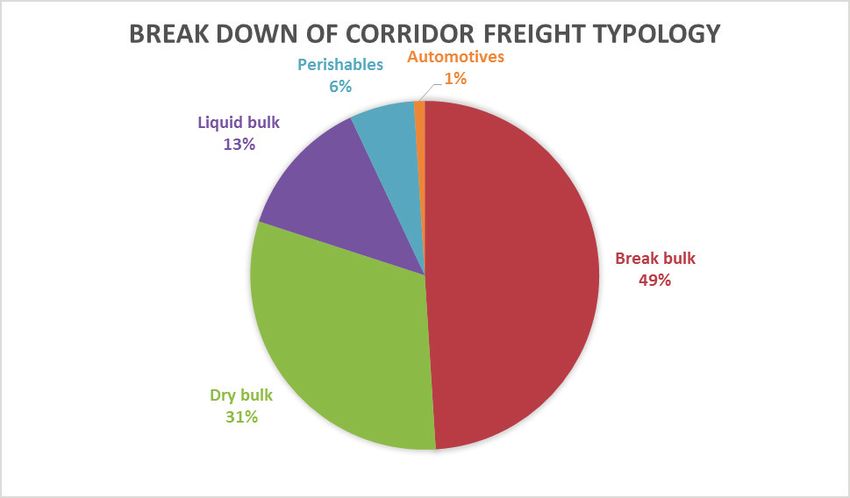
4 Freight shift from road to railFigure 2 shows the relative proportions of the freight typology on South Africa’s
corridors. As is evident, break bulk is a large component of the corridor based
movements, and there is therefore a large potential for movements of the freight
from road to rail.
Figure 2: Total corridor freight break down by freight type
The results of an analysis completed by Havenga & Pienaar (2012) indicate an
increasing trend in the mass of freight moved from 1993 to 2012, and a decrease
in the rail market share of this freight. Havenga’s study also revealed that currently,
41% of all freight (by mass) in South Africa originates and terminates in either
Johannesburg, Cape Town or Durban. These corridor based movements have
the greatest potential for the shift of road freight to rail as they are geographically
bound corridor based movements, thus negating the negative effect of rail’s
lack of origin/destination flexibility.
The use of rail for the movement of freight means that there is often a need for
inter-modal facilities on either end of the corridor based rail journey although
there are exceptions where the freight originates at, or is destined for, a marine
port. These inter-modal facilities are typically referred to as ‘dryports’.
5Dryports
Dryports are the term given to inland, inter-modal points which shift the rail from
road to rail or vice versa. They have been used extensively in Europe, North
America and Latin America (Konings, 2008). South Africa’s intermodal points
are the weakest points of our freight transport system (Beytell, 2012) and their
improvement should thus be a priority (National Planning Commission 2012).
South Africa’s most significant inter-modal point is City Deep in Johannesburg,
the largest inland port in Africa and the fifth largest in the world. Yet, even though
it is being underutilised, it is not large enough to handle the projected increase in
freight if the shifting of freight to rail is to occur at the anticipated rate (Gauteng
Growth and Development Agency, 2011).
In considering future priorities for rail freight, it is notable that 80% of break bulk
could be serviced by only four inter-modal facilities in Gauteng, Durban, Cape
Town and Port Elizabeth (Havenga, 2013).
2.2 Road infrastructure
Road infrastructure is affected by several factors, including: environmental
factors, the absolute volume of vehicles on the roads and the weight of these
vehicles. The road is designed to carry a certain number of Equivalent Standard
Axles (ESAs) during its design life. An ESA is a theoretical measure used to convert
all vehicle axles into the same unit of weight which can be used for design
calculations more conveniently. The ESA is an 80kN load. The ESA for a vehicle is
calculated as shown in the formula below:
(
1 ESA=
Vehicle single axle weight
( 4
80 KN
Note that this is a simplification of the actual formula, as the formula has factors
built in for rigid and flexible pavements. For the purposes of this study, the above
formula is adequate as the roads being compared have similar rigidities.
Applying the above formula, it can be calculated that a typical passenger car
axle (850kg or 8.5kN axle) does 0.002 times the damage that a typical 32t truck
axle (4000kg or 40KN axle) does, or that the truck axle does nearly 500 times the
structural damage that the car axle does.
6 Freight shift from road to railThe road will require a construction event such as the renewal or replacement
of a road layer when it has reached the end of its design life. South African
National Roads Agency Limited (SANRAL) generally builds roads which have a
wearing course design life of approximately 20 years, accounting for projected
increases in traffic volumes over the road’s lifespan. As the design life is related to
a specific number of equivalent standard axle passages, the removal of heavy
freight vehicles from these roads should cause the design life of these roads to
increase, thus reducing the capital and operating costs necessary for upkeep of
these roads.
In addition to the impact of traffic load on the design life of a road, the
environment (heat, rainfall etc.) also causes deterioration. Figure 3 illustrates the
relative contribution of the traffic load and environment, the two main aspects
which affect the road’s degradation, and how they vary according to the
number of ESAs the road is designed to carry. It shows that for low volume roads
the environmental effects are the primary cause of degradation, with the traffic
load being the main contributor for high volume roads. The roads that are the
primary concern for this study, namely the SANRAL corridor roads, are designed
to last longer than the 1 million ESAs that is the equivalence point in the graph,
and therefore the traffic load should be the primary contributor to the road’s
degradation.
According to Louw Kannemeyer, SANRAL’s Road Network Manager, SANRAL’s
use of the mechanistic empirical design methodology, which originates in the
1970’s, has ensured that the roads are structurally very well designed and built.
While the roads are designed primarily for traffic loading, he acknowledges
that the environment is a driver of road degradation of SANRAL corridor roads.
The design methodology used in South Africa has been very successful, which
is highlighted in the fact that 76% of pavements of the 21 400 km of SANRAL
roads are over their 20 year design life, yet only 8.5% are in a poor or very poor
condition3 (SANRAL 2013 and Louw Kannemeyer, personal communication).
3
The road is determined to have structurally failed if a rut depth of >20mm is recorded
7Figure 3: Traffic loading versus dominant mechanism of distress (SADC, 2003)
Due to the fact that there is a fourth power relationship between the damage
that a vehicle axle does to a pavement, and its weight, it has been found that
often the heaviest 20% of vehicles account for up to 80% of the damage that
occurs to a pavements structure. This is a general rule of thumb though, as it
depends on the total volume of lighter vehicles which travel on that road too.
Numerous case studies on road infrastructure have found that the heaviest 20%
of vehicles can account for anything from 2.5% of the damage on a road to
100%, which can occur if a single overladen vehicle destroys the entire pavement
structure in one pass (US Department of Transport, 2013). This variance in effects
show that it is very difficult to anticipate the resulting change in capital and
operating expenditure required for roads due to the reduction in freight vehicles
on these roads although, in principle, it remains obvious that the reduction in
freight movements on roads will increase the road’s service life. This increase
in service life may lead to decreased, or more spread out, maintenance and
rehabilitation events.
For the purpose of this analysis it is assumed that SANRAL’s expenditure on roads
will change slightly depending on the number of trucks on their roads. There is a
factor in place which does reduce capital expenditure depending on the rate
of uptake of freight by the railways. The factor is based on the US Department of
Transport (2013) research, and applies a 20% reduction in operating and capital
expenditure for the high freight uptake outlook, with lessor reduction depending
on the freight uptake outlook being investigated.
8 Freight shift from road to rail2.3 Rail infrastructure
Transnet is the state owned company responsible for the maintenance and
upkeep of rail infrastructure and vehicles in South Africa. Their mandate is to
’assist in lowering the cost of doing business in South Africa, enabling economic
growth and ensuring security of supply through providing appropriate port, rail
and pipeline infrastructure in a cost-effective and efficient manner’ (Transnet,
2013).
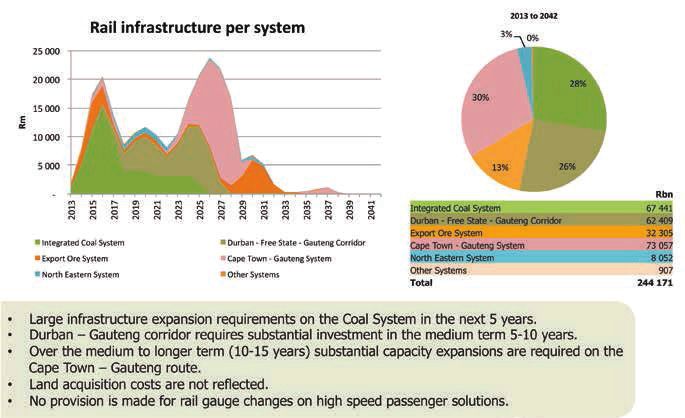
Transnet’s Long Term Planning Framework (LTPF) contains details about projected
capital expenditure, by rail system, for the forthcoming 30 years, as can be seen
in Figure 4.
Figure 4: Transnet (2013) projected expenditure on rail infrastructure
2.4 Modes of freight movement
2.4.1 Trucks
The Road Freight Association (RFA) publishes a vehicle cost schedule every year,
which contains information pertaining to different codes of vehicles and their
costs. This schedule is published in order to help RFA members determine the
feasibility of rates before any costs are incurred. It contains information on both
capital and operating costs of vehicles.
9The codes of these vehicles are in approximate order of increasing payload
and number of axles. The most common heavy motor vehicles used for corridor
based freight transport in South Africa are RFA codes 09, 11 and 19 (this was
determined in consultation with academic practitioners and the RFA).
In order to calculate the economic impact of road freight, calculations are
made on the basis of ton-kilometres. Considering each truck type which will
have a specific payload, this is calculated as follows:
Annual t.km capacity = (truck payload)*(truck annual distance)*(mass
utilisation)*(percentage of distance laden)
To simplify analysis a single representative vehicle is used, as the usage and
payload statistics of the stated codes are considered to be close in magnitude.
2.4.2 Trains
Trains, with much larger carrying capacity obviously have the ability to move
greater quantities of freight. While rail systems have large capital costs they also
have relatively low running costs per ton.km (when operating at full capacity)
making them effective in reducing the costs of logistics under circumstances
where the freight has a relatively low mass to value ratio.
Capital expenditure on rail vehicles
Rail vehicles consist of locomotives and wagons. Locomotives can be powered
by electricity, diesel or a combination of the two4. Wagons are designed to suit
the type of freight being transported. Transnet, as part of its capital investment
programme is planning for large scale additions and rehabilitation to its rolling
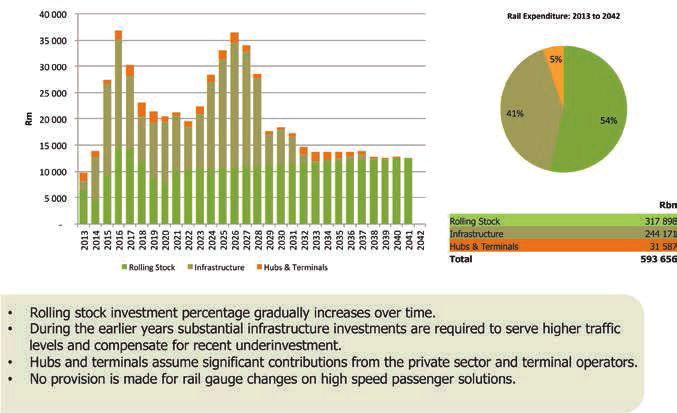
stock (vehicles), as illustrated in Figure 5.
4
Transnet anticipates the addition of compressed natural gas locomotives in the duration of this inves-
tigation (up to 2050) (Transnet, 2013).
10 Freight shift from road to railFigure 5: Transnet (2013) projection of capital expenditure on rail locomotives, infrastructure and hubs
& terminals
Capital expenditure on infrastructure
Capital expenditure on infrastructure includes railway line expansion and
rehabilitation, together with related signalling and control systems (see note
below Figure 5 which indicates that rail gauge changes are not provided for).
Operating expenditure
Operating expenditure on rail infrastructure consists mainly of the following items
(Profillidis, 2014):
• Maintenance and renewal of track (rail, sleepers and ballast) and subgrade
• Maintenance of electrification, signalling and telecommunications facilities
and substations (where applicable)
• Maintenance of tunnels and bridges
• Maintenance of platforms (in stations)
The breakdown within this is approximately 65% for track and platforms, 30%
for electrification, signalling telecommunications and substations, and 5% for
bridges and tunnels.
112.5 Socio-economic modelling
The socio-economic impact of changing the structure of the transport sector,
needs to be considered in four parts:
a) Direct impact which is associated with employment and net costs – capital
and operating - of the road or rail system itself.
b) Indirect impact due to backward linkages which are caused through
the changes in inputs to the road or rail system through, for example, the
purchase of fuel and vehicles. This occurs as a result of re-expenditure of
businesses/companies which have the expenditure of the direct industries
as their inputs. These backward linkages impact on sectors of the economy
separate from transport. These other sectors may be affected positively or
negatively depending on the change in purchases from these sectors by the
transport sector.
c) Induced impact due to direct and indirect expenditure occurs as a result
of any incurred expenditure in the broader economy. This is generally
reflected in increased household expenditure, as a result of an improvement
in revenue due to one of the ‘factors of production’ including production
and distribution. Induced impact also occurs as part of additional household
consumption.
d) Surplus effect: This includes the ‘forward’ impact which is caused by the
change in the amount of transport used (and purchased from the transport
sector) by all the sectors of the economy where freight movement is required.
This impact is assessed through the change in price of transport (a lowering in
price causes the sectors which use freight transport to be more effective and
hence employ more people and have greater sales).
For the purpose of this analysis, the direct impacts are calculated from first
principles based on changes in modal shift and hence changes in the cost of
both road or rail systems and changes in the number of people working on these
systems. In the case of the indirect impacts (backward and forward) economic
models are required to assess both the change in economic impact, measured
as Gross Domestic Product, and jobs.
This analysis relies on two different models to determine economic and job
impacts of the shift in freight from road to rail: and ‘Impacts’ Model, which deals
5
In this regard it is notable that Transnet anticipates that a modal shift can save the economy up to
R1150bn in a reduction in externalities in the next 30 years compared to the business as usual uptake
outlook
12 Freight shift from road to railwith backward impacts, and a ‘Surplus’ Model which deals with forward impacts.
These models, created by Conningarth Economists, are input-output models,
which utilise a Social Accounting Matrix (SAM) to relate net costs incurred in one
area of the economy to other sectors of the economy.
The Impacts Model is the model which takes into account any direct expenditure,
both construction (capital) expenditure and operating expenditure. This model
will provide the direct, indirect and induced effects of this expenditure, in full
time equivalent jobs, broken down into skilled, semi-skilled and unskilled jobs, as
well as impact on the GDP. It is important to note at this point that these effects
are geographically confined to the area of investigation, thus any expenditure
which leaves the area of investigation (such as money which is used to import
goods) is money which does not contribute to South Africa’s GDP.
The second model is the Surplus Model. This model’s inputs are the expected
surplus effects that any expenditure will have on the economy. This is not an
output of the Impacts Model.
Considering the Impacts Model, it requires two input costs: construction (capital
costs) and operating costs. The construction (capital) costs are the investments
in the road and rail infrastructure and vehicles, and the operational costs are the
costs of operating the vehicles for both road and rail, as well as the operating
costs of the road and rail infrastructure. The most significant part of the operating
costs is the cost of maintaining the vehicles.
There are different types of effects that spending can have on the economy.
This requires an understanding of the sectors which are linked to the transport
sector. As noted above, backward linkages are links which are upstream to the
sector being investigated, and would generally supply input (such as material or
information) to this sector. For freight movements, the backward linkages include
fuel, suppliers and servicers of vehicles and infrastructure, as well as any other
service providers (administrative support, IT support, human resources support
etc.) which may contribute to the running of a freight system.
The forward linked impacts of freight transport are significantly larger, as the
movement of freight has repercussions throughout the economy, due to the fact
that the movement of products is often part of the products life cycle (very few
products have their entire life cycle from creation to consumption in the same
geographical region).
13Externalities
In order to simplify this analysis externalities are not specifically included in
the modelling but comment is included on the extent to which this impacts
on recommendations is raised below. Typically these include the impact of
accidents, congestion, emissions, landway (land acquisition costs), noise and
policing. They are costs which are arise as a result of operations or economic
activity which occurs outside of the financial boundary of the organisation. They
are a burden or “tax” on the broader environment or society (Transnet, 2013).
As an indication of the cost to society of these externalities, figures from Transnet
are given in Table 1 (Transnet, 2013).
Table 1: Cost of externalities (Transnet, 2013)
SA road (c/t.km) SA rail (c/t.km)
Accidents 4.9 0.4
Congestion 1.9 0
Emissions 4.6 0.8
Landway 1.0 0.1
Noise 1.9 0.02
Policing 0.3 0
One additional externality is the cost to the economy when there is an electricity
shortage and rail is no longer able to function. Rail uses approximately 1.5% of
South Africa’s electricity so this may become a more important factor in the next
5 years as supply is likely to be low over this period.
2.5.1 Job impacts
A large component on the socio-economic modelling process is the impact that
the different types of expenditure will have on the job market. For the purposes
of this study, a labour-year needs to be defined: one labour-year is the amount
of work which one person performs assuming he or she is working for a full year.
The output of the model is given in total labour years, by both sector and labour
skill type (skilled, semi-skilled and unskilled). The model also has the ability to
produce results for ethnic group and gender, although this uses empirical data
which is not necessarily accurate in the long term, so these results are excluded.
14 Freight shift from road to rail2.6 South Africa’s freight sector
Statistics are kept on a wide range of different commodities being moved
throughout the country with 74 codes of goods. These commodities can be
grouped according to the way they are moved, either by road or rail, or by the
type of movement, namely: corridor based, rural or metropolitan (see Table 6 for
more detail).
Table 2: Summary of freight types and modal split
Movement type Percentage of national Percentage rail for
transport effort movement type
Total 100.0% 12.5%
Corridor 64.7% 19.3%
Metro 2.9% 4.6%
Rural 32.4% 15.3%
Considering commodities moved by rail, according to the Group Strategy Division
of Transnet, the respective make-up of bulk and general freight commodities
varies according to the railway line that they are moving along, making the
quantification of those commodities which are likely to shift modes very complex.
A simplifying assumption for the purposes of the calculations used in this study is
that only export coal from Mpumalanga, iron ore from Sishen and Manganese
from Hotazel which moves via rail are bulk commodities. The remaining codes
are classified as general freight (Transnet, 2013). However, while the majority of
bulk freight is moved by rail currently, this is not universal and particular attention
is paid in a later section to bulk commodities which are currently moving by
road. This includes coal for power stations in Mpumalanga (43 million tons p.a.
via road), sugar cane in rural Kwa-Zulu Natal (12.3 million tons p.a. via road) and
stone in rural North West (6.6 million tons p.a. via road).
Projections indicate that in the next 30 years, processed food and chemicals
will amount to 44% of break bulk freight (which constitutes 49% of total freight)
on the two largest corridors, Gauteng to Durban and Gauteng to Cape Town.
Due to the large percentage of the total movements coming from only two
commodities, it is easier for the authorities or relevant service providers to identify
the large generators of this freight, and thus engage directly with them in order
to facilitate the modal shift from road to rail. For example, palletised cargo (such
15as pallets of canned food or cement bags) is better suited for movement via rail
than un-palletised goods, such as crated soft drink or stacked cement bags, as it
is easier to load and unload from the train wagons.
Currently, break bulk products make up 49% of the freight movements along
all corridors, and approximately 45% of this is already palletised. The absolute
volume of break bulk is set to more than triple in the next 30 years. International
trends indicate that 80% of break bulk cargo moves in containers which are easily
transferable to rail. The propensity to use containers is set to increase, which will
lead to a faster growth in traffic which could make use of intermodal facilities
(Global Security 2013).
Importance of inter-modal transfer facilities
The National Planning Commission (NPC) states in the National Development
Plan (NDP) that intermodal points are currently not in an adequate condition,
and this is one of the key reasons why freight is not making the move back to rail
from road. The primary corridor which needs to be focussed on first is the busiest
corridor in the country, namely the Gauteng-Durban corridor (National Planning
Commission, 2012).
Conclusion on technical considerations relating to modal shift
These statistics indicate that South Africa’s freight make up is one which is
conducive to making the shift from road to rail though, according to the NPC,
our intermodal facilities are not yet at the standard which would facilitate
this change and, therefore, need to be prioritised as part of the road to rail
interventions (National Planning Commission, 2012).
3 Methodology
There are three main components which are important when considering the
socio-economic impact of the shift of freight from road to rail. These components
are:
• The quantification of freight movements and the proportion of this which
could make the shift from road to rail,
• The overall costs of moving freight, including the construction and capital
costs, as well as the operational costs,
• The socio-economic modelling and the resulting effects on the GDP and
employment
16 Freight shift from road to railIt is important that the methodology which underlies the freight demand model,
costing approach and socio-economic model is explicitly stated in order to
ensure the accuracy of the results.
3.1 Freight demand model methodology
For the purposes of this study, the following assumptions and simplifications have
been made:
• The different directions on the corridors are aggregated into one total corridor
movement.
• Only the movements via rail of export coal, iron ore and manganese are
excluded from the study as they are already on rail and the volumes are
significantly larger than the general freight movements, thus distorting results.
• The mix of commodities remains constant over the period of the study (up to
2050), and therefore movement of each commodity increases at the same
rate.
3.2 Costing methodology
The costs which are calculated are not allocated specifically between the
different actors in the sector, namely the private and public sector. This project
is looking at the overall impact of the expenditure in the economy, the source
of the money is not important, as the effects of the expenditure (from a job and
GDP impact perspective) are the same.
There are two types of costs which serve as the primary inputs into the
macroeconomic model, namely the construction (capital) costs and the
operating costs.
The costs were sourced from a variety of sources, as Table 3 shows.
Table 3: Data resources for costing model
Aspect of costing model Road Rail
Vehicle capital cost Road Freight Association Transnet Long Term
tables Planning Framework
17Aspect of costing model Road Rail
Infrastructure capital South African National Transnet Long Term
cost Roads Agency Limited Planning Framework
Asset Management
Plan, bilateral
discussions & own
calculations
Vehicle operating cost Road Freight Association Transport Research
tables Support, Public-Private
Infrastructure Advisory
Facility, World Bank
(2011)
Infrastructure operating SANRAL Asset Transport Research
cost Management Plan Support, Public-Private
Infrastructure Advisory
Facility, World Bank
(2011)
Each of the aspects of the costing model are described below.
Capital expenditure on road infrastructure
For the purposes of this study, the SANRAL capital expenditure on roads has been
projected up to the year 2050 based on previous expenditure and the 3 year
projections which have been provided in the asset management plan (SANRAL,
2013). The planned expenditure per year is R5.7bn.
Operating expenditure on road infrastructure
SANRAL provides operating expenditure details for the following three years as
part of their asset management plan (SANRAL, 2013). The planned expenditure
per year is R1.73bn.
Capital expenditure on road vehicles
Three different types of freight vehicles are most common on South African
roads. The vehicles are given numbers in the approximate order of increasing
payload. South Africa’s most common vehicles have RFA codes 09, 11 and 19. It
is assumed in the model that there is a 33.3% market share of the vehicles on the
road. The costs are as follows (VAT incl.) (RFA, 2014):
18 Freight shift from road to rail• 09 – R 1.5 million
• 11 – R 1.6 million
• 19 – R 2.1 million
The new demand generated as a result of growth in the general freight sector
is matched with the purchase of new vehicles, in the ratios mentioned above.
In addition to this the vehicle is depreciated over a period of time (from the
RFA tables), after which a new vehicle will need to be purchased as a capital
expense. The salvage cost is assumed to fund a portion (25%) of the new vehicle.
The rate of purchase of vehicles is constantly increasing, as there is constant
growth within the road freight sector overall. For the years 2034 to 2043, there is
no need for any new vehicles on several corridors5, as the rate of growth of rail is
reducing the volume of freight which road vehicles are moving. During this period
there is negative growth within the road freight industry on several corridors. This
does not affect the overall road freight movements, as it is still increasing.
Operating expenditure on road vehicles
The RFA vehicle cost schedule has information on the operating expenses
incurred per vehicle type per t.km. The costs (excluding depreciation) are as
follows (RFA, 2014):
• 09 – R1.24/t.km
• 11 – R1.10/t.km
• 19 – R1.11/t.km
In the model these are broken down into fuel, staffing, maintenance and other
costs. Each vehicle type has its own breakdown of these costs, for instance the
breakdown for the code 09 vehicle is 35% fuel, 22% maintenance, 19% staffing,
7% depreciation and 17% other (such as licensing, insurance etc.).
This component of the entire costing model is significantly larger than the
other components. It is increasing every year as the absolute transport effort is
constantly increasing, beginning at R176bn.
Capital expenditure on rail infrastructure
The export lines are not assumed to contribute to the capital expenditure due to
freight modal shift (approximately R100bn of total expenditure relates to these
6
Although replacement of vehicles which have reached the end of their useful lives needs to contin-
ue.
19You can also read