Building the Future:

The economic and fiscal impacts of making homes
energy efficient
←
→
Page content transcription
If your browser does not render page correctly, please read the page content below

Building the Future: The economic and fiscal impacts of making homes energy efficient
Document type:               Report

Client:                      Energy Bill Revolution, E3G

Client contact:              Ed Matthew

Other details:               ed.matthew@e3g.org

Title:                       Building the Future: Economic and fiscal impacts of making homes
                             energy efficient

Date:                        October 2014

Authors:                     Pratima Washan, Jon Stenning, Max Goodman

QA:                          Duncan Price, Phil Summerton

Author contact details

Email:                       pratima.washan@vercoglobal.com

Telephone:                   +44 (0)20 3598 9770

This report was kindly sponsored by the Energy Bill Revolution, Kingfisher plc, Mineral Wool
Insulation Manufacturers Association, Sustainable Energy Association, UK Green Building
Council, and Willmott Dixon.
Contents
Executive Summary ................................................................................................... 4
1. Introduction................................................................................................. 11
2. Investing in domestic energy efficiency ....................................................... 12
2.1 Energy efficiency investment scenario ........................................................ 12
2.2 Investment required to upgrade homes to EPC C standard ........................ 13
2.3 Approach to technical modelling and key constraints .................................. 20
3. Modelling the macroeconomic impact of energy efficiency investment ....... 21
3.1 Summary of findings ................................................................................... 21
3.2 Approach to economic modelling ................................................................ 21
3.3 Macroeconomic benefits of investing in domestic energy efficiency ............ 22
3.4 Government balance sheet ......................................................................... 24
4. Energy Efficiency – An infrastructure priority .............................................. 26
4.1 Summary .................................................................................................... 26
4.2 Approach to assessing Value for Money ..................................................... 26
4.3 Value for Money ......................................................................................... 28
4.4 Improved energy independence and economic resilience ........................... 29
4.5 Avoided cost of environmental externalities ................................................ 30
4.6 Avoided health costs................................................................................... 31
4.7 Benefits to local economy ........................................................................... 32
5. Conclusions ................................................................................................ 36
6. Appendices ................................................................................................. 37
6.1 Appendix 1 – Data sources ......................................................................... 37
6.2 Appendix 2 – MDM-E3 Model Description .................................................. 38
6.3 Appendix 3 – Technical modelling methodology ......................................... 39
6.4 Appendix 4 – Programme investments by year ........................................... 43
3 Economic and fiscal impacts of making homes highly energy efficientExecutive Summary
High energy bills are causing considerable financial hardship in the UK, with millions of people living in
fuel poverty. One of the biggest causes of the fuel poverty crisis is the poor condition of the UK
housing stock, which is one of the least energy efficient in Western Europe.
Improving the energy efficiency of UK homes is an effective way to bring down energy bills, and offers
a long term solution to fuel poverty. In addition, it is important to drive carbon emissions reductions,
with buildings responsible for almost 37% of all UK carbon emissions.1
At the same time, the building insulation market contracted by 22% in 2013,2 as the installation of
cavity wall insulation fell by 46%, the installation of loft insulation fell by more than 87%, and the
installation of solid wall insulation fell by 30%, compared with the number of measures installed under
the Carbon Emissions Reduction Target (CERT) in 2012.3 The Energy Bill Revolution is calling for a
radical new approach to home energy efficiency. They are calling for all low income homes to be
given measures, by 2025, to bring them up to Band C on an Energy Performance Certificate (EPC), 4
and for all other households to be offered 0% interest loans to improve them to an equivalent EPC
standard by 2035; delivered as part of a major infrastructure investment programme.
This report has undertaken detailed modelling to assess the economic, fiscal, and environmental
impacts of this programme. It concludes that the economic case for making the energy efficiency of
the UK housing stock a national infrastructure priority is strong.
In addition to making all low income households highly energy efficient, and reducing the level of fuel
poverty, the modelling has established that this energy efficiency programme would deliver:
£3.20 returned through increased GDP per £1 invested by government
0.6% relative GDP improvement by 2030, increasing annual GDP in that year by £13.9bn
£1.27 in tax revenues per £1 of government investment, through increased economic
activity, such that the scheme has paid for itself by 2024, and generates net revenue for
government thereafter
2.27 : 1 cost benefit ratio (Value for Money), which would classify this as a “High” Value for
Money infrastructure programme
Increased employment by up to 108,000 net jobs per annum over the period 2020-2030,
mostly in the service and construction sectors. These jobs would be spread across every
region and constituency of the UK.
1
Committee on Climate Change, Meeting Carbon Budgets – 2014 Progress Report to Parliament, July 2014
2
Mintel, Policy changes are putting a chill into the thermal insulation market, October 2014
http://www.mintel.com/blog/mintel-market-news/policy-changes-are-putting-a-chill-into-the-thermal-insulation-market
3
Association for the Conservation of Energy, Energy Bill Revolution: ECO and the Green Deal, 2014
http://www.energybillrevolution.org/wp-content/uploads/2014/07/ACE-and-EBR-fact-file-2014-06-ECO-and-the-Green-
Deal.pdf
4
Energy Performance Certificates (EPCs) are a measure of the level of energy efficiency of a home. The ratings span from
A to G. A-rated homes would have relatively low energy bills, whereas G-rated homes would have high energy bills, and be
expensive to heat. An EPC band of C represents a reasonably good level of energy efficiency. The average EPC rating in
England and Wales is currently D. Increasing the energy efficiency rating (or EPC) delivers a warmer, healthier, and more
comfortable home for the resident, whilst reducing the energy bills.
4 Economic and fiscal impacts of making homes highly energy efficient £8.61 billion per annum in total energy bill savings across housing stock, after comfort take
(including energy price inflation)
Net benefit of £4.95 billion per annum from the total energy bill savings across the housing
stock (after able-to-pay energy efficiency loans have been repaid)
23.6MtCO2 reductions per annum by 2030, after accounting for direct, indirect, and
economy-wide rebound effects. This is roughly equivalent to cutting the CO2 emissions of the
UK transport fleet by one third.
Improved health and reduced healthcare expenditure, due to warmer and more
comfortable homes, and improved air quality. For every £1 spent on reducing fuel poverty, a
return of 42 pence is expected in National Health Service (NHS) savings. 5 6
A more resilient economy, less at risk of shock changes in gas prices, as the economy
becomes less reliant on fossil fuels. Investment in energy efficiency in the domestic sector will
result in a 26% reduction in imports of natural gas in 2030, worth £2.7bn in that year.
Background
The Government’s energy efficiency strategy acknowledges that improving energy efficiency is
fundamental to decarbonising the UK economy, combating fuel poverty, maintaining secure energy
supplies, reducing domestic energy bills, reducing the need for new electricity generation capacity,
and increasing the productivity of businesses. However, successive governments have failed to put in
place policies or investment which could realise this opportunity. Within this context, this research
seeks to quantify the macro-economic benefits of investing in energy efficiency in the UK building
stock, based on the programme objectives of the Energy Bill Revolution campaign. The Energy Bill
Revolution is a major alliance campaign to end fuel poverty which is supported by 200 major UK
stakeholders.
This study assesses three main areas:
Quantifying the scale of investment required to upgrade all UK homes to EPC band C by 2035,
with all low income homes treated by 2025, and associated energy bill and CO2 savings from
installed energy efficiency measures;
Modelling tax implications and macro-economic benefits from investment in energy efficiency
Developing the quantitative and qualitative evidence to support investment in energy efficiency
as an infrastructure priority
As such, this analysis represents a comprehensive assessment of the impacts of a substantive
programme of investment, considering the (inter-related) impact on macroeconomic indicators and the
Value for Money indicators used for infrastructure project assessment in standard cost-benefit
analyses.
5
C. Liddell, Estimating the impacts of Northern Ireland's warm homes scheme 2000-2008, University of Ulster, 2008,
http://eprints.ulster.ac.uk/26173/1/FPcostbenefitsonweb.pdf
6
Chief Medical Officer, 2009 Annual Report, 2009. http://www.sthc.co.uk/Documents/CMO_Report_2009.pdf
5 Economic and fiscal impacts of making homes highly energy efficientDomestic energy efficiency retrofit: Investment and bill savings
The domestic energy efficiency retrofit programme presented in this research shows the investment
required, and beneficial impacts of improving the energy performance of the whole UK housing stock
to EPC band C by 2035. The improvements are financed via grants to low income homes, and
10-year interest free loans to able-to-pay homes. The programme is proposed to be rolled out using a
street-by-street delivery model,7 starting with areas with a high proportion of low income households,
to ensure the effective targeting of low income homes, and to exploit economies of scale.
Discussions with key industry experts and stakeholders have concluded that the level of activity and
ramp-up rates presented are realistic, and the industry can scale up to deliver this level of activity.
Additional regulatory drivers and financial incentives, such as mandatory energy performance
standards, council tax and stamp duty rebates, may need to be considered to drive uptake of energy
efficiency retrofits in able-to-pay homes.
The energy bill savings from the energy efficiency programme are shown in Table 0-1.
Table 0-1: Energy bill savings associated with the energy efficiency investment programme
Average energy bill savings for low £408 per annum
8
income homes £245 per annum after accounting for comfort take
Average energy bill savings for able- £416 before loan repayment
to-pay homes (after energy efficiency Net benefit of £203 per annum (after able-to-pay energy efficiency
9
loan repayments) loan repaid)
Total energy bill savings across the £8.61 billion per annum
housing stock, after comfort take Net benefit of £4.95 billion per annum (after able-to-pay
(includes energy price inflation) energy efficiency loans repaid)
The investment in the retrofit programme, both by the Government and the private sector, is shown by
parliamentary term in Table 0-2.10 The Government investment consists of grants for low income
homes, covering the installation of measures and cost of carrying out the energy assessments. For
able-to-pay homes, the Government investment pays for the interest rate subsidy from 8% to 0%, over
a 10-year loan term, plus the cost of energy assessments.11
7
R Platt, J Aldridge, P Washan, and D Price; Help to Heat: A solution to the affordability crisis in energy; IPPR Nov 2013.
8
Homes with fuel poor residents often tend to be under-heated due to the high costs associated with heating. This means
that modelling of energy demand and energy savings can be over-estimates, as they do not account for the behaviour and
energy use patterns of the residents. It can be that, after energy efficiency measures have been installed, the residents
increase the warmth of their homes (due to the reduced costs of achieving the warmer temperature), rather than achieving
the predicted energy bill savings associated with energy efficiency. This is known as ‘comfort take’ – and assumed to
account for a 40% reduction in the predicted energy bill savings for the purpose of this research.
9
This figure represents energy bill savings averaged over a 20-year lifetime for a package of measures. The loan repayment
would be twice as large for the first 10 years after retrofit, reducing to £0 thereafter, once the loan has been repaid.
10
The investment in the retrofit programme is shown by year in Appendix 4 – Programme investments by year.
11
The interest rate subsidy is calculated as the cost to government of guaranteeing the energy efficiency loans (taking the
effective loan interest rate form 8% to 5%) plus the cost of direct subsidies (taking the effective interest rate from 5% to 0%)
over a 10-year period.
6 Economic and fiscal impacts of making homes highly energy efficientFor the first parliamentary term, the total investment required for the low income scheme is £8.1bn,
and the Government contribution for the able-to-pay scheme is £4.9bn. As an indication of scale, this
compares to over £100bn of committed public investment in infrastructure projects over the next
parliamentary term (2015-2020), which includes £24 billion for road building, with £16 billion set aside
for new roads. The Government has also committed to the building of High Speed 2 (HS2) which is
budgeted at £42.6bn for the construction of the rail link, and an additional £7.5 billion for rolling
stock.12
Table 0-2: Programme investment made by the Government and by the private sector, for each parliamentary term
Government
contribution to
able-to-pay Private sector
Investment in scheme investment in Government
low income (undiscounted able-to-pay investment in Total
scheme sum of interest scheme all schemes investment
Parliamentary (undiscounted) payments) (undiscounted) (undiscounted) (undiscounted)
Term (£bn) (£bn) (£bn) (£bn) (£bn)
13
15/20 £8.1 £4.9 £13.1 £13.0 £26.1
20/25 £18.1 £8.4 £22.3 £26.4 £48.7
25/30 £0.0 £9.9 £26.6 £9.9 £36.5
30/35 £0.0 £4.2 £11.2 £4.2 £15.3
Total £26.1 £27.4 £73.2 £53.5 £126.7
Value for money and tax implications of investing in domestic energy efficiency
The economic scenario analysis was undertaken using Cambridge Econometrics’ MDM-E3 model of
the UK economy and energy system.
The energy efficiency scenario differs from the baseline in investment expenditure and fuel use, as a
result of efficiency measures. Investment in dwellings leads to a positive economic impact on
industries supplying the construction sector with energy efficiency products. Changes in expenditure
on energy affect consumption outlays and thus revenues of consumer-facing industries and their
supply chains. The primary impacts that are modelled in this study are:
Change in investment including expenditure of measures financed through funding provided
for low income homes as well as loans for able-to-pay homes.
Higher energy efficiency of homes leads to lower energy demand and therefore lower energy
bills. The reduction in demand for gas in heating (and for gas used in the power sector which is
then consumed by homes for heating) would substantially reduce imports of natural gas.
Lower energy bills (after accounting for comfort take – which leads to a range of health
benefits, as discussed in Section 4.5) lead to higher expenditure on other goods and services.
In the case of able-to-pay homes, this is at first largely offset by loan repayments in the first 10
years following treatment.
12
HM Treasury, Investing in Britain’s future, June 2013,
https://www.gov.uk/government/uploads/system/uploads/attachment_data/file/209279/PU1524_IUK_new_template.pdf
13
This excludes £2bn Energy Companies Obligation (ECO) funding, expected to be invested by the utilities for 15/16 and
16/17, to meet ECO targets. Assuming similar level of ECO investment per annum to 2020, the additional investment
required in the first parliamentary term is £3.1bn.
7 Economic and fiscal impacts of making homes highly energy efficientThe Value for Money assessment is summarised in Table 0-3 (the calculations supporting each item
are discussed in Section 4.2).
Table 0-3: Summary of modelling results
Total discounted benefit of energy efficiency investment programme, of which: £91,186m
Discounted net benefit to consumer spending £60,651m
Discounted benefit of net government balances £9,960m
Discounted benefit of net increase in company profits £15,111m
Discounted benefit of net increase in savings £337m
Discounted benefit of reduced emissions £5,127m
Total discounted investment in energy efficiency programme by government £40,214m
Cost Benefit Ratio (CBR) (total benefit / total investment) 2.27
The Cost Benefit Ratio (Value for Money) indicator of the programme is estimated to be 2.27:1, which
classifies the infrastructure programme as “High” Value for Money. The value of health benefits of
improved efficiency from the comfort, warmth, and improved air quality in homes, is uncertain to
quantify in monetary terms, and has therefore not been included in the formal Cost Benefit Ratio.
However, there is evidence that significant health benefits will arise which would add to the central
estimate of 2.27.
In terms of GDP, the programme would generate a return of £3.20 per £1 invested in energy efficiency
measures by government. For value added, the return is £3.00 per £1 invested. In relative terms, as a
result of the energy efficiency investments, GDP will be 0.6% higher in 2030.
The programme results in a net increase in annual employment of up to 108,000 over the period
2020-2030, with most jobs created in the services and the construction sectors.
Investment in energy efficiency in the domestic sector will result in a 26% reduction in imports of
natural gas in 2030, worth £2.7bn in that year. As the economy becomes more fossil fuel efficient, the
more resilient it becomes to shock changes in gas prices. A 50% gas price spike in 2030, leads to a
0.2% GDP decrease in the baseline scenario, but only a 0.15% decline in the Energy Efficiency
scenario. For consumers directly, the gas price spike leads to an increase in energy bills of £220 per
home (in 2030) in the baseline. As a result of the efficiency measures, this is reduced by £60 to £160
per home.
Both the direct impact (construction jobs at the installation sites) and many of the indirect impacts
(extra employment generated by the spending of additional wages in the economy) stimulate
employment and economic activity in close proximity to the sites where the energy efficiency
measures are introduced. Given that the modelling demonstrates a net positive impact on output and
jobs in the UK, the impacts are therefore fairly evenly distributed across the country (whether looking
8 Economic and fiscal impacts of making homes highly energy efficientat a regional, local, or constituency level): the increase in employment in 2030 ranges between 0.14-
0.22% in each of the twelve nations and regions of the UK (against a UK average of 0.19%).
The funding investment and incentivising of take-up of energy efficiency measures by governments is
self-financing. The increased economic growth leads to higher tax intake, cumulatively £51.1bn by
2030, or £1.27 per £1 invested throughout the whole period (in discounted terms). In Parliamentary
Terms, the Government would be slightly worse off in the period 2015-20, but the investments would
yield dividends to governments in the 2020-25 period and considerable payback in the 2025-30
period.
Table 0-4: Government balances (undiscounted)
Government investment in Additional government tax Net impact on government
Parliamentary all schemes revenue (undiscounted) balance sheet
Term (undiscounted) (£bn) (£bn) (undiscounted) (£bn)
15/20 £13.0 £11.0 £-1.9
20/25 £26.4 £30.4 £4.0
25/30 £9.9 £28.7 £18.8
30/35 £4.2 not modelled not modelled
Total £53.5 >£70.2 >£16.7
Table 0-5: Government balances (discounted)
Government investment in Net impact on government
Parliamentary all schemes (discounted) Additional government tax balance sheet
Term (£bn) revenue (discounted) (£bn) (discounted) (£bn)
15/20 £11.4 £9.7 £-1.8
20/25 £20.1 £23.0 £2.9
25/30 £6.4 £18.4 £12.0
30/35 £2.3 not modelled not modelled
Total £40.2 >£51.1 >£10.9
The wider co-benefits
The energy efficiency programme will contribute towards economy-wide emissions reductions of
23.6MtCO2 per annum by 2030, after accounting for direct, indirect, and economy-wide rebound
effects. The Committee on Climate Change has predicted the policy gap in emissions reduction
targets from the building (residential and non-residential) sector, required to meet the fourth carbon
budget in 2025, to be 17MtCO2.14 This gap is based on an analysis of the potential across different
sectors in the economy and positive action in the buildings sector has been acknowledged as an
essential component of meeting our medium to long term carbon targets. The programme modelled in
this research delivers 16MtCO2 pa by 2025, which is a similar scale to the predicted gap.
14
Committee on Climate Change, Meeting Carbon Budgets – 2014 Progress Report to Parliament, July 2014 (Figure 3)
http://www.theccc.org.uk/wp-content/uploads/2014/07/CCC-Progress-Report-2014_web_2.pdf
9 Economic and fiscal impacts of making homes highly energy efficientImproved air quality, and warmer, more comfortable homes will improve health and allow for reduced healthcare expenditure. According to recent evidence, for every £1 spent on reducing fuel poverty, a return of 42 pence can been seen in NHS savings. 15 16 The programme would result in a more resilient economy, less at risk of shock changes in gas prices, and less reliant on fossil fuels, as described above. Investing in energy efficiency – a “high” infrastructure priority To conclude, the targeted programme of upgrading the energy performance of the housing stock, as proposed by the Energy Bill Revolution, would generate a three-fold return in GDP for every pound invested by government, deliver a high Value for Money infrastructure programme, provide warmer homes with lower healthcare expenditure, provide a long term solution to mitigate fuel poverty, create local jobs, reduce gas imports by a quarter, while creating a resilient economy in the medium to long term, and delivering substantial environmental benefits. These benefits can be realised through a programme that will effectively be a net revenue generator for the Government, by 2024. 15 C. Liddell, Estimating the impacts of Northern Ireland's warm homes scheme 2000-2008, University of Ulster, 2008, http://eprints.ulster.ac.uk/26173/1/FPcostbenefitsonweb.pdf 16 Chief Medical Officer, 2009 Annual Report, 2009. http://www.sthc.co.uk/Documents/CMO_Report_2009.pdf 10 Economic and fiscal impacts of making homes highly energy efficient
1. Introduction

The Government’s energy efficiency strategy acknowledges that improving energy efficiency is
fundamental to decarbonising the UK, maintaining secure energy supplies, reducing domestic energy
bills, and increasing the productivity of businesses.17 The strategy also acknowledges the benefits of
energy efficiency in mitigating the health detriments associated with cold homes, purporting energy
efficiency as one of the most cost-effective ways of making a sustained reduction in domestic heating
costs, and removing homes from fuel poverty.

However, successive governments have failed to put in place policies which can meet the scale of
opportunity. The building insulation market contracted by 22% in 2013, 18 as the installation of cavity
wall insulation fell by 46%, the installation of loft insulation fell by more than 87%, and the installation
of solid wall insulation fell by 30%, compared with the number of measures installed under the Carbon
Emissions Reduction Target (CERT) in 2012.19

The Energy Bill Revolution alliance of 200 national organisations has been advocating for energy
efficiency to be made a national infrastructure investment priority with a programme to make every low
income home highly energy efficient.

Within this context, this research seeks to quantify the macro-economic costs and benefits of investing
in energy efficiency in UK building stock, and to analyse the impact of making energy efficiency an
infrastructure priority. The analysis is carried out based on a programme to upgrade all of UK’s
housing stock to an EPC C standard20 by 2035, through a combination of grants and low interest
loans, with all low income homes treated by 2025.

The study assesses three main aspects:

1.      Quantifying the scale of investment required to upgrade all UK homes to EPC band C by 2035,
        and associated energy bill and CO2 savings from installed energy efficiency measures;

2.      Modelling tax implications and macro-economic benefits from investment in energy efficiency

3.      Developing the quantitative and qualitative evidence to assess investment in energy efficiency
        as an infrastructure priority

As such, this analysis represents a comprehensive assessment of the impacts of a substantive
programme of investment, considering the (inter-related) impact on macroeconomic indicators and the
Value for Money indicators used for infrastructure project assessment in standard cost-benefit
analysis. All monetary values in the report are expressed in 2013 real terms, unless otherwise stated.

17
   Department of Energy and Climate Change, The Energy Efficiency Strategy: The Energy Efficiency Opportunity in the UK,
November 2012
18
   Mintel, Policy changes are putting a chill into the thermal insulation market, October 2014
http://www.mintel.com/blog/mintel-market-news/policy-changes-are-putting-a-chill-into-the-thermal-insulation-market
19
   Association for the Conservation of Energy, Energy Bill Revolution: ECO and the Green Deal, 2014
http://www.energybillrevolution.org/wp-content/uploads/2014/07/ACE-and-EBR-fact-file-2014-06-ECO-and-the-Green-
Deal.pdf
20
   Energy Performance Certificates (EPCs) gives a home an energy efficiency rating from A (most efficient) to G (least
efficient)

11 Economic and fiscal impacts of making homes highly energy efficient
2. Investing in domestic energy efficiency 2.1 Energy efficiency investment scenario The energy efficiency investment scenario that underpins the macro-economic modelling was developed in discussions with the Energy Bill Revolution (EBR), and was informed by a consortium of organisations supporting the campaign. The scenario sets out target dates, minimum energy performance standards, and proposed financing routes, for delivering a programme of works in both low income and able-to-pay homes. It was developed taking into account the scale of ambition required to deliver meaningful reductions in domestic bills and meet medium term carbon reduction targets, as well as the capacity of the retrofitting industry to deliver the expected level of activity. The scenario builds on the proposals outlined in the recent paper by Citizen’s Advice ‘Raising standards, cutting bills’,21 and the Institute for Public Policy Research (IPPR) report ‘Help to Heat’.22 It consists of a programme to upgrade all UK housing to EPC band C, financed via energy efficiency grants for low income homes, and a 0% interest rate loan for able-to-pay homes, both capped at £10k. The £10k cap is indicative, and has been set on the basis of ensuring most homes treated can get up to EPC band C. In practise, the cap could be varied depending on the type of housing stock in each local authority area. Previous research has analysed the cost of improving fuel poor and low income homes to various EPC standards. EPC C was chosen as a relatively cost-effective standard for the UK housing stock, while delivering meaningful energy bill savings for residents. Improving all low income homes to EPC C standard is also an effective way to tackle fuel poverty as these households are most vulnerable to energy prices rises. It is worth highlighting that the average EPC rating in England and Wales is currently D and the average rating for a fuel poor home is EPC band E.23 A local authority led, street-by-street approach to delivery is intended to ensure effective targeting and drive consumer demand for energy efficiency by engaging households within certain areas, initially low income areas. Trusted local intermediaries market the scheme, provide information and advice and make sure every household receives a free energy efficiency assessment, similar to the current Green Deal assessment. The area-based nature of the scheme would encourage social awareness on the benefits of energy efficiency, as well as reduce costs due to economies of scale. Local bodies would receive funds from national government to oversee the delivery of area-based programmes and make sure programmes are tailored to meet local circumstances, in a similar way to the Green Deal Communities scheme. 21 W Baker, Raising standards, cutting bills: Healthy homes: a costed proposal to end fuel poverty through higher standards and fairer funding, Citizens Advice Bureau, June 2014 22 R Platt, J Aldridge, P Washan, D Price, Help to heat: A solution to the affordability crisis in energy, Nov 2013 23 Department of Energy and Climate Change, Annual Fuel Poverty Statistics Report, 2014 12 Economic and fiscal impacts of making homes highly energy efficient
Key dates and targets are as outlined below.
Proposed UK domestic energy efficiency investment scenario
All low income homes to be retrofitted to EPC C standard by 2025 through energy efficiency
grants capped at £10k24
All able-to-pay homes to be retrofitted to EPC C standard by 2035 financed through 10 year
interest free loans capped at £10k
500,000 low income houses retrofitted per year by 2018,25 with 2 million treated to EPC C
standard by 2020.
One million deep retrofits supported per year by 2020 in able-to-pay homes
The programme ramp-up rates (numbers of homes retrofitted each year) is shown in Figure 2-2.
Although the proposed programme sounds ambitious, discussions by Energy Bill Revolution with
industry experts and stakeholders have indicated that the level of activity and ramp-up rates
presented are realistic, and the industry can scale up to deliver this level of activity. Additional
regulatory drivers and incentives, such as mandatory energy performance standards, council tax
rebates, and stamp duty incentives, may need to be considered to drive uptake of energy efficiency
retrofits in able-to-pay homes.
This is not an entirely new approach. There is a precedent in Europe of delivering energy efficiency
activity at scale in the domestic sector through a combination of low interest loans and other financial
incentives. For instance, in response to the KfW loan and grant programmes for energy efficient new
buildings and refurbishments in Germany, the industry was able to ramp up the installation rate of
energy efficiency measures from 280,000 homes in 2008 (€6.3bn of loans), to 617,000 homes in 2009
(€8.9bn of loans – of which 65% was allocated for the energy efficiency programme).
2.2 Investment required to upgrade homes to EPC C standard
For the purpose of the macro-economic analysis, the first step was to analyse the investment required
to upgrade homes to EPC C standard, and an associated package of energy efficient measures. The
energy efficiency measures in the package represent a cost-effective route to achieving the target
SAP score,26 based on a marginal abatement cost (MAC) curve; the most cost-effective measures are
prioritised to be installed earlier in a package, before the less cost-effective measures are considered.
The upfront investment for the measures, and the split between government investment and private
sector investment from the home, are summarised below (all expressed as investment per home).
24
This proposed target is the result of analysis undertaken by the Energy Bill Revolution campaign. For previous work, see
the Citizens Advice report, Help to Heat Mark 2: Cutting energy bills now, 2014. The campaign includes key industry
stakeholders, including from major construction sector organisations, and large social housing landlords.
25
UCL Energy Institute, The KfW experience in the reduction of energy use in and CO2 emissions from buildings: operation,
impacts and lessons for the UK, 2011
26
The Standard Assessment Procedure (SAP) is the methodology used by the Government to assess and compare the
energy and environmental performance of dwellings. Its purpose is to provide accurate and reliable assessments of dwelling
energy performances that are needed to underpin energy and environmental policy initiatives.
13 Economic and fiscal impacts of making homes highly energy efficient Low income homes:
o Investment required to upgrade homes to EPC C: £4,376 (£4,256 for measures, plus
£120 energy assessment fee)
o Government investment: The full £4,376 is modelled to be subsidised by a government
grant
Able-to-pay homes:
o Investment required to upgrade homes to EPC C: £4,385 (£4,265 for measures, plus
£120 energy assessment fee)
o Government investment support: £1,595 (£1,475 for interest rate subsidies27 plus £120
energy assessment fee) is modelled to be covered by the Government.
o Investment by the home / private sector: £4,265, modelled to be covered by the home-
owner in instalments over 10-years – i.e. the principal loan value of the retrofit works
Figure 2-1 shows the spread of investment within the housing stock for low income homes.
Figure 2-1: Spread of investment within the housing stock
The methodology for calculating the investment requirement is summarised in Section 2.3 and
detailed further in Section 6.3. Example packages of measures are shown in Appendix 3 – Technical
modelling methodology.
27
For the able-to-pay homes, the current scenario assumes that the Government does not act as the loan provider. Instead,
the Government is using a combination of guarantees and direct public subsidies to reduce the interest rate to 0%. This is
done by the Government guaranteeing the debt of the Green Deal Finance Company (reducing the interest rate to the
consumer from 8% to 5%), and then directly subsidies the remaining loan interest over a 10-year period (i.e. taking the
effective interest rate from 5% to 0%). The total government investment is shown as the undiscounted value of both the
guarantee and the direct subsidy and assumed to be incurred in the year the measures are installed. In effect, if the direct
subsidy is spread out over the 10-year period, the NPV of the Government investment will be smaller.
14 Economic and fiscal impacts of making homes highly energy efficient28 Figure 2-2: Programme ramp-up rates, in terms of the number of homes retrofitted 28 The uptake of cavity wall insulation (CWI) and solid wall insulation (SWI) through the Carbon Emissions Reduction Target (CERT) scheme, in UK homes (excluding Northern Ireland (NI)) is taken from two data sources. For the period 2008/09, it is taken from Energy Saving Trust, CERT Summary Report (Q16) by Local Authority, 2012, http://www.energysavingtrust.org.uk/Publications2/Housing-professionals/HEED-PDFs/HEED-publications-for-UK/CERT-reports-Q16/CERT-Summary-Report-Q16-by-Local-Authority For the period 2012/13 it is taken from DECC, Statistical release: Experimental statistics, Estimates of Home Insulation Levels in Great Britain: July 2013, https://www.gov.uk/government/uploads/system/uploads/attachment_data/file/240190/statistical_release_estimates_home_insulation_levels_gb_july_13.pdf 15 Economic and fiscal impacts of making homes highly energy efficient
2.2.1   Total investment in upgrading all UK homes

The investment in the retrofit programme each year, by both the Government and the private sector (i.e. investment made by Green Deal Providers or
households themselves in energy efficiency improvements), is shown in Figure 2-3 (and shown in table format, in Appendix 4 – Programme
investments by year). For the whole UK housing stock, the total government investment in the low income scheme is £26.1bn, and in the able-to-pay
scheme is £27.4bn. In the first two years of the programme, the investment made by the Government, and the private sector investment, are each of a
similar scale to the current ECO funding.
                                                                                    29
Figure 2-3: Programme investment by the Government and the private sector

29
  For the able-to-pay homes, the graph shows the £1,595 investment from the Government, in the year that the retrofit works are done. The investment from the private sector in able-to-
pay homes is also shown in the year that the retrofit works are done. As a result, the graph shows the up-front investment in retrofit activity, rather than the value of the loan repayments
spread over 10 years.

16 Economic and fiscal impacts of making homes highly energy efficient
The investment in the retrofit programme, by both the Government and the private sector, is shown by
parliamentary term in Table 2-1. For the first parliamentary term, the total investment in the low
income scheme is £8.1bn, and the Government contribution to the able-to-pay scheme is £4.9bn.
Table 2-1: Programme investment requirements from government and private sector, by parliamentary term
Government
contribution to
able-to-pay Private sector
investment in scheme investment in Government
low income (undiscounted able-to-pay investment in Total
scheme sum of interest scheme all schemes investment
Parliamentary (undiscounted) payments) (undiscounted) (undiscounted) (undiscounted)
Term (£bn) (£bn) (£bn) (£bn) (£bn)
30
15/20 £8.1 £4.9 £13.1 £13.0 £26.1
20/25 £18.1 £8.4 £22.3 £26.4 £48.7
25/30 £0.0 £9.9 £26.6 £9.9 £36.5
30/35 £0.0 £4.2 £11.2 £4.2 £15.3
Total £26.1 £27.4 £73.2 £53.5 £126.7
2.2.2 Domestic energy bill savings
The energy bill savings generated from the energy efficiency retrofit packages are shown in Table 2-2.
As the measures are proposed to be financed using grants for low income homes and interest free
loans for the able-to-pay homes, the net energy bill savings are calculated differently for the two
groups. Also, the re-bound effect (also termed as comfort take31) is likely to impact the net benefit to
fuel poor homes. This phenomenon is explained below:
For the low income homes, the savings include in-use factors32 and a ‘comfort
take’ factor of 40%33
For the able-to-pay homes, the savings include in-use factors and are net of the energy
efficiency loan repayments. During the 10 years duration of the loan, some homes may be
paying more in loan repayments, than they receive in energy bill savings, as the analysis was
done without applying the ‘Golden Rule’ (savings in each year being greater than the loan
repayment for that year). However, after year 10, the homes will receive 100% of the savings.
30
This excludes £2bn Energy Companies Obligation (ECO) funding, expected to be invested by the utilities for years 15/16
and 16/17, to meet ECO targets. Assuming similar level of ECO investment per annum to 2020, the additional investment
required in the first parliamentary term is £3.1bn.
31
Once energy efficiency measures are installed, the expected energy savings may not be realised as fuel poor homes can
now afford to heat their homes adequately. The proportion of energy savings from energy efficiency measures that are not
realised due to homes now heating homes for longer or to a higher temperature is referred to as ‘comfort take’. There is a
range of important health benefits associated with comfort take, as discussed in Section 4.5.
32
In-use factors have the effect of reducing the predicted energy savings from energy efficiency measures, by a specified
percentage per measure. The percentage reduction is based on the application of evidence and research and expert
recommendation, as adopted by the Department of Energy and Climate Change for the Green Deal and Energy Companies
Obligation.
33
Programmes such as CESP (that focus on low income areas and are likely to impact a higher number of homes in fuel
poverty) allow for a 40% comfort take when predicting CO2 savings. A similar ‘comfort take’ factor has been used for the
purpose of this analysis and applied to all low income homes as a conservative assumption.
17 Economic and fiscal impacts of making homes highly energy efficientThe energy bill savings include energy price inflation over time, in line with DECC’s central energy
forecast scenario.34
Table 2-2: Energy bill savings associated with the energy efficiency investment programme
Average energy bill savings for low £408 per annum
income homes £245 per annum after accounting for comfort take
Average energy bill savings for able- £416 before loan repayment
to-pay homes (after energy efficiency Net benefit of £203 per annum (after able-to-pay energy efficiency
35
loan repayments) loan repaid)
Total energy bill savings across the £8.61 billion per annum
housing stock, after comfort take Net benefit of £4.95 billion per annum (after able-to-pay energy
(includes energy price inflation) efficiency loans repaid)
2.2.3 CO2 savings
The CO2 savings generated from the energy efficiency retrofit packages are shown in Table 2-3. The
CO2 savings take account of grid decarbonisation over time, in line with the Interdepartmental
Analysts' Group Guidance for Policy Appraisal.36 The yearly profile of carbon savings is shown in
Table 4-2.
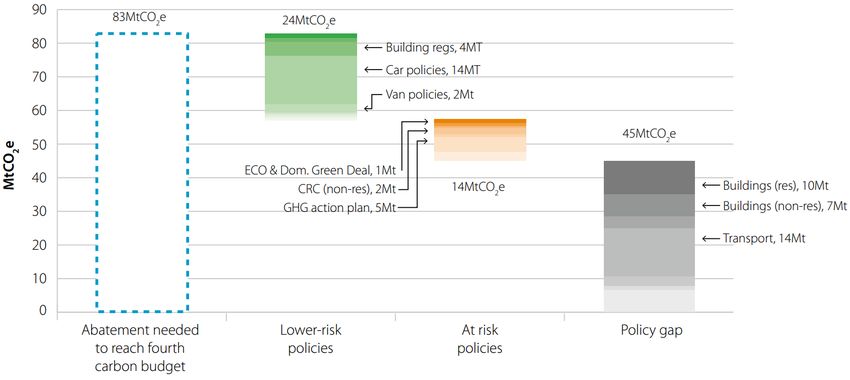
The Committee on Climate Change has published analysis of the abatement needed to meet the
fourth carbon budget in 2025. The predicted ‘policy gap’37 is 10MtCO2 for residential buildings, and
7MtCO2 for non-residential buildings, as shown in Figure 2-4. The programme modelled in this
research delivers 16MtCO2 pa by 2025 (as shown in Table 4-2). This is a similar scale to the predicted
gap in emissions reduction from the building sector (both domestic and non-domestic).38
The CO2 savings associated with the energy efficiency programme are shown in Figure 2-3. To put
the total CO2 savings across the housing stock into context, the carbon savings are equivalent to the
net annual carbon emissions reductions from 3,840 large (3MW) offshore wind turbines, or 13,380
intermediate (850kW) on-shore wind turbines. Alternatively, the annual CO2 savings would be
equivalent to the annual carbon emissions reductions from removing 10.4m cars (36% of the cars in
Great Britain) from the road.39
34
Department of Energy and Climate Change, Updated energy and emissions projections 2013, September 2013,
https://www.gov.uk/government/uploads/system/uploads/attachment_data/file/239937/uep_2013.pdf
35
This figure represents energy bill savings averaged over a 20-year lifetime for a package of measures. The loan
repayment would be twice as large for the first 10 years after retrofit, reducing to £0 thereafter, once the loan has been
repaid.
36
Department of Energy and Climate Change, Inter-departmental Analysts' Group (IAG) Guidance for Policy Appraisal, 2011
37
The term ‘policy gap’ is used by the Committee on Climate Change to express the difference between the emissions
projections under current policies, and the emissions projected by the cost-effective path that would meet the fourth carbon
budget, i.e. the ‘gap’ in emissions reductions resulting from insufficient policy framework.
38
Committee on Climate Change, Meeting Carbon Budgets – 2014 Progress Report to Parliament, July 2014 (Figure 3)
http://www.theccc.org.uk/wp-content/uploads/2014/07/CCC-Progress-Report-2014_web_2.pdf
39
Calculation based on average CO2 emissions per km driven, average annual car mileage, and total number licensed cars
on the road, taken from the following sources:
18 Economic and fiscal impacts of making homes highly energy efficientTo provide a comparison with the average CO2 savings for individual homes, as shown in Table 2-3,
the carbon emissions from one passenger’s one-way flight from London to New York, would be
approximately 626 kgCO2. 40
Table 2-3: Carbon savings associated with the energy efficiency investment programme
Total (net) CO2 savings across economy 23.6 million tonnes CO2 per annum
1,092 kgCO2 per annum
Average CO2 savings for low income homes
(655 kgCO2 per annum including comfort take)
Average CO2 savings for able-to-pay homes 1,079 kgCO2 per annum
41
Figure 2-4: Getting from the DECC pre-2009 policy baseline to the fourth carbon budget in 2025
Department for Environment & Rural Affairs, 2013 Government GHG Conversion Factors for Company Reporting, July 2013,
https://www.gov.uk/government/uploads/system/uploads/attachment_data/file/224437/pb13988-emission-factor-
methodology-130719.pdf
Department for Transport, National Travel Survey: 2012, September 2013,
https://www.gov.uk/government/uploads/system/uploads/attachment_data/file/243957/nts2012-01.pdf
Department for Transport, Vehicle Licensing Statistics, Great Britain: Quarter 2 2012, September 2012,
https://www.gov.uk/government/uploads/system/uploads/attachment_data/file/9290/vls-q2-2012.pdf
40
Calculation based upon 5,540 km distance, and 113 gCO2/km for a long distance flight [H. Auvinen, Average passenger
aircraft emissions and energy consumption per passenger kilometre in Finland 2008, LIPASTO,
http://lipasto.vtt.fi/yksikkopaastot/henkiloliikennee/ilmaliikennee/ilmae.htm Accessed 23 September 2014]
41
Committee on Climate Change, Meeting Carbon Budgets – 2014 Progress Report to Parliament, July 2014 (Figure 3)
http://www.theccc.org.uk/wp-content/uploads/2014/07/CCC-Progress-Report-2014_web_2.pdf
19 Economic and fiscal impacts of making homes highly energy efficient2.3 Approach to technical modelling and key constraints The analysis has been carried out using 2012 English Housing Survey (EHS) data to assess the investment required to improve all homes to an EPC C standard. Each home in the EHS dataset is assigned an ‘energy archetype’, based on its baseline energy consumption and key physical characteristics. Energy efficiency improvement measures are modelled incrementally to determine the most suitable package of measures for each archetype. The energy efficiency measures in the package represent a cost-effective route to achieving the target SAP score, based on a marginal abatement cost (MAC) curve; the most cost-effective measures are prioritised to be installed earlier in a package, before the less cost-effective measures are considered. The modelling methodology is explained in detail in Appendix 3 – Technical modelling methodology. As the analysis is based on English Housing Survey data, it does not provide a detailed picture of the investment requirement to improve homes in the devolved nations. Investment in improving homes in devolved nations has been extrapolated based on average investment in improvement for homes in England. The £10,000 cap42 on both grants and interest-free loans is intended to avoid a large amount of money potentially being spent on improving a relatively small number of extremely ‘hard-to-treat’ homes. As a result of this, some homes are not retrofitted to EPC C standard.43 15% of low income homes, and 16% of able-to-pay homes, do not achieve EPC band C, due to the limit of investment support per home. This is often due to the home having a particularly poor energy efficiency rating before the retrofit, or in need of solid wall insulation; hence requiring a high level of investment to achieve the minimum performance standard. However, despite the cap, these properties would still see a significant improvement in their energy performance. 42 The £10k cap is indicative, and has been set on basis of ensuring most homes treated can get up to EPC band C. The cap could be varied in practice, depending on type of housing stock in local areas, and could vary by local authority. 43 Energy efficiency measures are modelled to be added to the package of measures, until either: the home is modelled to have achieved EPC C, or the package of measures reaches its maximum investment value, before going over the £10k cap. 20 Economic and fiscal impacts of making homes highly energy efficient
3. Modelling the macroeconomic impact of energy efficiency investment
3.1 Summary of findings
In terms of GDP (Gross Domestic Product), Cambridge Econometrics modelling estimates a
return of £3.20 per £1 invested in energy efficiency measures by government. In relative
terms, as a result of the energy efficiency investments, GDP will be 0.6% higher in 2030
(£13.9bn).
The investment in funding and incentivising take-up of energy efficiency measures by
governments is self-financing. The increased economic growth leads to higher tax intake,
cumulatively £51.1bn by 2030 or £1.27 per £1 invested throughout the whole period (in
discounted terms).
Cambridge Econometrics estimate a net increase in annual employment of up to 108,000 over
the period 2020-2030, with most jobs created in the services and the construction sectors.
3.2 Approach to economic modelling
A scenario analysis was undertaken using the MDM-E3 model of the UK economy and energy
system. A baseline scenario was set to compare the alternative investment policy scenario against.
The baseline scenario was constructed using the latest data from the Office of National Statistics
(ONS) from 2012. For the years over 2013-2018, the latest economic projections for all components of
final expenditure, income, employment, wages, and inflation, were obtained from the recent economic
growth forecast from the Office of Budgetary Responsibility (OBR)44. These OBR growth rates were
applied to the latest historical data to obtain a series of consistent projection to 2018. For later years
where no official projections were available, Cambridge Econometrics’ updated economics forecast
was used to extend the projections to 2030. Energy demand projections and end-user domestic prices
for gas and electricity were derived from the most-up-to-date central projections from DECC over
2013-2030 (updated in September 2013).45
The energy efficiency scenario differs from the baseline in investment expenditure and domestic fuel
use as a result of efficiency measures. Investment in dwellings leads to a positive economic impact on
industries dependent on the construction sector. Changes in expenditure on energy affect
consumption outlays and thus revenues of consumer-facing industries and their supply chains.
Change in overall output also affects government tax intake through several avenues. Impact on
consumer expenditure affects consumption tax intake (primarily VAT). Changes in industry revenues
are reflected in wages and profits, these in turn affect government revenue through taxation of labour
(income tax and national insurance contribution) and profits (corporate tax).
The various measures modelled have different time horizons, which results in different impacts arising
from the timing of investments and energy savings:
Energy efficiency measures affect the construction sector (and supply chain) primarily at the
time the measure is implemented
44
OBR’s latest economic projections released in November 2013 were used
45
https://www.gov.uk/government/publications/updated-energy-and-emissions-projections-2013
21 Economic and fiscal impacts of making homes highly energy efficient Resulting benefits to consumers, in the form of lower energy bills and improved health persist
over the lifetime of the measures46
Capital repayments by able-to-pay homes are evenly spread over a ten-year period after the
investment is made.
In order to assess the macroeconomic impacts on the UK economy, the modelling must explain all the
relevant flows of income and expenditure in the economy. The main channels (as explained by MDM-
E3) are:
Change in investment includes expenditure of measures financed through funding provided for
low income homes as well as loans for able-to-pay homes
Higher energy efficiency of homes leads to lower energy demand and therefore lower energy
bills. The reduction in demand for gas in heating (and for gas used in the power sector which is
then consumed by homes for heating) would substantially reduce imports of natural gas.
Lower energy bills (after accounting for comfort take) lead to higher expenditure on other
goods and services. In the case of able-to-pay homes, this is at first largely offset by loan
repayments in the first 10 years following retrofit
In total, there is £127.5bn of investment in energy efficiency measures over a 20-year period. This
constitutes £73.2bn from able-to-pay homes (supported by £27.4bn of loan support schemes from the
Government) with the rest being direct government funding to low income homes (£26.9bn). This
investment thus does not directly affect the spending of low income homes; it does however affect
expenditure in able-to-pay homes throughout the period of repayment. By paying for the interest and
guarantees, the Government makes the loans 27% cheaper on average for able-to-pay homes.
3.3 Macroeconomic benefits of investing in domestic energy efficiency
The combination of the construction stimulus and lower energy bills outweigh the repayment costs,
leading to an increase in GDP of 0.6% in 2030 (13.9bn). The reduced expenditure on gas and
electricity is displaced by repayment of the capital investment in the energy efficiency measures and,
where net savings arise, spending on other goods and services in the economy.
In the short-to-medium term, there is therefore a positive stimulus in the construction sector (and
supply chain) to manufacture and install the various energy efficiency measures (at the expense of the
gas and electricity sectors, and supply chains). This yields positive macroeconomic benefits, since
gas is heavily imported, whereas the demand generated by the energy efficiency programme yields
output and jobs in the construction sector and supply chain (which is predominantly UK based).
In the longer term, as the energy savings accumulate, there is a considerable net saving to homes
(after paying for the efficiency measures) allowing homes to spend much more on other goods and
services in the economy. Although a proportion of these goods and services are supplied by imports,
a considerable proportion is supplied by UK based businesses. Towards the end of the period
modelled the increased sector output and employment is predominantly in the service sectors of the
46
The weighted average lifetime of a package of measures comes to 20 years. Some measures have a short lifetime (for
example, 10 years for draught proofing), and some measures have a long lifetime (for example, 42 years for cavity wall
insulation). Measure lifetimes taken from the Department of Energy and Climate Change guidance document, Energy
Companies Obligation (ECO): Measures Table, 2014
https://www.ofgem.gov.uk/ofgem-publications/83100/copyofecomeasurestable-mar2014url.pdf
22 Economic and fiscal impacts of making homes highly energy efficientYou can also read