World Energy Investment 2021 - Methodology Annex - NET
←
→
Page content transcription
If your browser does not render page correctly, please read the page content below
World Energy Investment
2021
Methodology Annex

World Energy Investment 2020: Methodology Annex                                                                                Table of contents

Table of contents

World Energy Investment 2021: Methodology Annex .......................................................... 1
  Table of contents..................................................................................................................... 2
  Introduction ............................................................................................................................. 3
  Measuring investment in the power sector ............................................................................. 5
  Measuring investment in fuel supply....................................................................................... 8
  Measuring investment in energy efficiency........................................................................... 10
  Energy financing and funding trends .................................................................................... 13
     Measuring the sources of finance for investments................................................................... 13
     The role of capital markets ....................................................................................................... 16
  R&D and Technology Innovation .......................................................................................... 19
  Annexes ................................................................................................................................ 21
     Abbreviations, units and acronyms .......................................................................................... 21
     Glossary ................................................................................................................................... 24

List of tables
                    Sub-sectors and assets included in power sector investment ................................... 5
                    Sub-sectors and assets included in fuel supply investment....................................... 9
                    Sub-sectors and assets included in end-use ........................................................... 11
                    Sources for the compilation of energy R&D spending 2012-2020 ........................... 19

List of figures
Figure 1            Financial flows in energy investment ....................................................................... 14
                                                                                                                                                       IEA. All rights reserved.

                                                                    PAGE | 2
World Energy Investment 2020: Methodology Annex Introduction
Introduction
Comments and questions are welcome and should be addressed to:
Energy Supply and Investment Outlook Division, International Energy Agency
9 rue de la Fédération, 75739 Paris Cedex 15, France
Telephone: (33-1) 40 57 65 12; Email: investment@iea.org
The way investment is measured across the energy spectrum varies, largely
because of differences in the availability of data and the nature of expenditures.
This document explains the methodology used to ensure that the estimates are
consistent and comparable across sectors in the World Energy Investment 2021
(WEI 2021) report and the Special Report on Financing the Clean Energy
Transition in Emerging Market and Developing Economies (FCET).
In WEI 2019, the definition of investment changed from the previous editions of
WEI where investment was defined as overnight capital expenditure. In WEI 2020
and beyond, investment is again measured as the ongoing capital spending on
assets. For some sectors, such as power generation, this investment is spread
out evenly from the year in which a new plant or upgrade of an existing one takes
a final investment decision (FID), i.e. when a project reaches financial close or
begins construction) to the year in which it becomes operational. For other
sources, such as upstream oil and gas and liquefied natural gas (LNG) projects,
investment reflects the capital spending incurred over time as production from a
new source ramps up, or to maintain output from an existing asset.
For energy efficiency, the measurement task is more complex and much of the
expenditure is by consumers for whom purchases of more efficient goods are not
investments per se. In WEI 2021 and FCET, as in other recent IEA reports,
investment in energy efficiency includes the incremental spending by companies,
governments or individuals to acquire a piece of equipment that is more efficient
than the local market average. Due to the different possible methodologies
available, this estimate of energy efficiency investment is not definitive but still
included to provide a comparison with the scale of investment in energy supply.
Fossil fuel and power sector investments are those that raise or replace energy
supply, while energy efficiency investments are counted as those that reduce
energy demand.
IEA. All rights reserved.
PAGE | 3World Energy Investment 2020: Methodology Annex Introduction
Investment estimates are derived from International Energy Agency (IEA) data for
energy demand, supply and trade, and estimates of unit capacity costs, analysis
of which benefits from extensive interaction with industry. By default, investment
data are given in year 2019 US dollars, adjusted using country-level gross
domestic product (GDP) deflators and 2019 exchange rates. Unless otherwise
stated in WEI 2021 or FCET, all time series and historical comparisons are
presented in real 2019 US dollar terms, adjusted for inflation.
Overall, this approach to investment represents an approximation of real-world
practice and is aligned with the concept of capital expenditure in financial reporting
and accounting. In reality, varying time lags and spending patterns characterise
the period between the FID and the operation of an energy project. As such, where
available, measures of financial performance, financial flows and physical energy
changes are also provided to give a more complete picture of the turnover of the
energy asset base as well as decisions to commit new capital. Other areas of
spending – including operating and maintenance expenditures, research and
development, financing costs, mergers and acquisitions or public markets
transactions – remain important for energy sector development, and are analysed
on a standalone basis in IEA investment work, but are not included in the
investment calculations of WEI 2021.
IEA. All rights reserved.
PAGE | 4World Energy Investment 2020: Methodology Annex Measuring investment in the power sector
Measuring investment in the power
sector
The estimates of electricity investment presented in WEI 2021 and FCET
correspond to annual capital spending on new power plants, battery storage and
network assets, or the replacement of old assets. Investment outlays are spread
evenly from the year that an asset takes a final investment decision (i.e. it reaches
financial close or begins its construction) until the year it becomes operational.
Thus, the investment for 2020 reflects spending carried out in assets that will
become operational in the future, too. The construction period is estimated from
data on reported primary financing transactions, sanctioning dates and operational
dates at a project-level by technology and by region in a given year.
Sub-sectors and assets included in power sector investment
Sub-Sector Assets
Coal-fired power
Coal-fired power with CCUS
Fossil-fuel based power generation Gas-fired power
Gas-fired power with CCUS
Oil-fired power
Nuclear power plants (greenfield)
Nuclear power generation Refurbishments and upgrades of existing plants for long-
term operations
Bioenergy
Hydropower
Wind (onshore and offshore)
Renewable power generation Geothermal
Solar PV (utility-scale and buildings)
Solar thermal
Marine
Transmission
Electricity grids Distribution
Public EV chargers
Battery storage Utility-scale and buildings
Investment estimates reflect IEA analysis on annual capacity additions and unit
investment costs, derived in part from surveys with industry, IEA (2020), S&P
Global Platts (2021), BNEF (2021), IRENA (2021), Clean Horizon (2021), Lazard
(2020) and other organisations. The methodology represents an approximation of
real-world practice. In reality, capital outlays on new plants also spread over the
IEA. All rights reserved.
PAGE | 5World Energy Investment 2020: Methodology Annex Measuring investment in the power sector
years preceding installation and capital expenditures are often incurred during the
life of a plant, even if this spending does not result in a change to capacity.
Nuclear power presents particular challenges given the long lead times and
spending patterns associated with plant development. For new nuclear power
plants, spending corresponds to the even allocation from the year in which the unit
takes final investment decision to the year in which the unit is connected to the
grid. WEI 2021 includes estimates for upgrades to existing nuclear plants to
extend lifetime operation. Investment in existing plants is estimated by reviewing
plants reaching a 40-year lifetime in a given year and assessing their reported
operational plans going forward.
Investment in electricity networks includes transmission and distribution, and
spending on digital equipment for the smart monitoring and operation of the grid
(e.g. smart meters, automation and public electric vehicles charging stations). The
data corresponds to the capital spending methodology and reflects three key
drivers: investment in new infrastructure to accommodate new demand (increased
connections and consumption), investment to replace ageing infrastructure and
investment required to integrate renewables in the power system.
Past investments in transmission and distribution assets and estimates for 2021,
where possible, are based in publicly available data from utilities, regulators and
other domestic entities. Networks investment to accommodate new demand is
calculated based on the commissioning of new transmission and distribution lines
and on the analysis of data provided by the NRG Expert Transmission and
Distribution Database (NRG, 2020). The applied unit investment costs are based
on past capital expenditures and data from industry surveys. Investment in asset
replacement assumes an average lifetime of 40 years for assets already in
operation. Unit replacement costs are derived from costs of new infrastructure.
Investment costs of transmission and distribution networks required for
renewables integration are derived from renewable integration costs based on
literature reviews.
The analysis of investments in the digitalisation of the electricity grid is based on
analysis of NRG (2020), BNEF (2018). Electric Vehicle (EV) charging stations
investment is based on combining estimates of public and private charger
installations with prevailing cost information, based on IEA (2021a). Spending on
public EV charging infrastructure is included in the investment of distribution
assets, while investment in private EV charging infrastructure is included in end-
use.
IEA. All rights reserved.
PAGE | 6World Energy Investment 2020: Methodology Annex Measuring investment in the power sector
Additionally, investment in grid-scale battery storage and behind-the-meter
storage is based on the capacity deployment reflected in the Energy Storage
Association (2021), the Clean Horizon Project Database (Clean Horizon, 2021),
BNEF (2020a), the analysis of data from the China Energy Storage Alliance Global
Energy Storage Market Analysis (China Energy Storage Alliance , 2020), and data
provided by governments. Investment in pumped-hydro storage, the largest
component of global storage investment, is included in the hydropower data of
WEI 2021 and FCET. Behind-the-meter storage is derived from BNEF (2021) and
data provided by governments.
Finally, data on final investment decisions (FIDs), where available, are also shown
to give a more complete picture of the turnover of the capital stock. WEI 2021 has
undertaken an analysis of FIDs for power generation based on awarded
equipment contracts from data provided by McCoy Power Reports (2021)
(including coal power, gas power and hydropower) and reported (nuclear)
construction starts based on data from the International Atomic Energy Agency,
Power Reactor Information Systems (PRIS) (2021), Clean Energy Pipeline (2021)
and other sources. These data may not capture projects below 5 MW (below 10
MW for hydropower). However, WEI 2021 has made estimates for investments
and FIDs (treated as the same) in small-scale generator sets, based on Global
Data (2018) and other publicly available information.
IEA. All rights reserved.
PAGE | 7World Energy Investment 2020: Methodology Annex Measuring investment in fuel supply
Measuring investment in fuel
supply
In line with the other energy sectors, the investment estimates for oil, gas and coal
represent capital spending, i.e. the total amount of investment costs incurred in
any given year. They are derived from IEA data for demand, supply and trade,
plus industry data on investment costs, where available. In the case of upstream
oil and gas investment, global spending estimates are based on the announced
spending of over 80 leading oil and gas companies. The investment activities of
these companies, which represent over three-quarters of global oil and gas
production, have been surveyed and adjusted to estimate the global spending. For
the oil refining sector, spending estimates are calculated based on project-level
information on new refineries and upgrading projects in 108 countries. The
investment estimates for the midstream sectors such as oil and gas pipelines and
shipping transport were made to correspond to the IEA data for demand, supply
and trade for oil and gas products. This follows the new methodology of the World
Energy Model (WEM), used to produce the projections in the IEA’s annual World
Energy Outlook report.
The investment in LNG liquefaction terminals is based on reported or estimated
annual spending for nearly 60 projects that reached FID between 2000 through
the first quarter of 2021. Analyses rely on a wide range of publicly available
sources. IEA estimates have been made where detailed information is not
available, such as disaggregated spending by type of activity and capital spending
plans by unlisted companies.
The investment for biofuels (including liquid biofuels and biogases) is based on
capacity expansion plans for production facilities and assumptions on plant costs.
Biofuels investment does not include additional spending on the production and
supply of agricultural feedstocks. In this way, the biofuels investment estimate is
more comparable to that for downstream fuel supply (e.g. refining and gas
processing) activities than to upstream activities.
Key financial performance metrics for the Majors (including BP PLC, Chevron
Corporation, ConocoPhillips, Eni S.p.A., ExxonMobil Corporation, Royal Dutch
Shell, and Total SE) were assessed from Bloomberg Terminal (2021). Metrics
were assessed based on market capital-averages at the time of metric reporting.
IEA. All rights reserved.
PAGE | 8World Energy Investment 2020: Methodology Annex Measuring investment in fuel supply
Sub-sectors and assets included in fuel supply investment
Sub-Sector Assets
Upstream oil
Upstream gas
Midstream oil (pipelines)
Oil and Gas Midstream gas (pipelines and LNG)
Refining (greenfield)
Refining (upgrade and maintenance)
Coal mining
Coal supply Coal transportation
Biogases
Low-carbon fuels Liquid biofuels
Hydrogen production
WEI 2021 has undertaken an analysis of asst finance FIDs for clean energy
investments made by a subset of oil and gas companies including the Majors (as
above), ADNOC, CNPC (China National Petroleum Corporation), CNOOC,
Equinor, Gazprom, Kuwait Petroleum Corporation, Lukoil, Petrobras, Repsol,
Rosneft, Saudi Aramco, Sinopec and Sonatrach. The estimated share of total
capex in 2021 is based on projects announced through 9 May 2021 and assumes
that this pace of investment is maintained through the year. These were gathered
from Bloomberg (2021), Bloomberg NEF (2021) and Clean Energy Pipeline
(2021). The level of clean energy investment is adjusted to company (or
subsidiary) relative holdings in the entitiy that made the investment. Total capex
spending is estimated from bottom-up analysis of company reporting and Rystad
(2021).
IEA. All rights reserved.
PAGE | 9World Energy Investment 2020: Methodology Annex Measuring investment in energy efficiency
Measuring investment in energy
efficiency
Defining and measuring investment in energy efficiency is far less straightforward
than for investment in energy supply. The IEA defines an energy efficiency
investment as the incremental spending to acquire equipment that consumes less
energy than would otherwise have been used to provide the service, such as
lighting, heating or mobility, had the consumer not bought a more efficient option
(i.e. the baseline). The additional cost of a more efficient alternative can represent
a small share of the total spending on a particular energy-related good or service.
Furthermore, spending is typically carried out on the balance sheets of many
millions of households and firms, often without external financing. As much as
possible, a bottom-up analysis using data on sales of efficient goods is used.
In the buildings sector, the incremental investment for new or renovated buildings
is the change in cost for services (design, delivery, installation) and products
(lighting, appliances, equipment and materials) that achieve increased energy
efficiency performance beyond the investment required for the minimum
performance legally allowed. Thus, in principle, the full cost of a renovation that is
associated with energy efficiency improvements is included. For building types
and products that have legal requirements on the performance of buildings,
buildings services or building products, this cost is the incremental spending
beyond what is needed to achieve the minimum energy performance standards,
energy efficiency regulations or building energy codes. For building types and
products that do not have energy requirements, this cost is the incremental
spending on energy-efficient services and products beyond what would have
otherwise been spent, which in some cases is no spending.
The incremental investment in buildings achieved as a result of a recent
improvement in energy efficiency policies is calculated as the difference between
the total spending required to achieve the new policy and the total cost required
to comply with the previons regulation. The spending for residential and
commercial buildings is compiled from published national reports, including those
of various government departments, agencies and public institutions. If not
counted elsewhere in the buildings sector estimate, energy efficiency obligations,
loans and funds established by policy are also considered as incremental
IEA. All rights reserved.
PAGE | 10World Energy Investment 2020: Methodology Annex Measuring investment in energy efficiency
spending. The estimate also draws upon industry sources, construction-sector
indices and studies of capital cost requirements.
For the industry sector and freight transport sectors, the incremental investment
is calculated based on the average technology efficiency in a recent base year.
The result is modelled on a regional basis and based on the realised level of
energy savings in a sector and energy saving cost curves in the World Energy
Model (WEM), included in the IEA’s annual World Energy Outlook report (IEA,
2020). Added to this is published data on investment in industrial energy
management systems that improve system-wide efficiencies in manufacturing and
heavy industry.
The baselines that are used to represent the likely alternative investment option,
i.e. had the more efficient good not be purchased, are specific to each sector and
sub-sector (Table 1.1).
Sub-sectors and assets included in end-use
Sector Sub-sector Assets
Energy efficiency Building materials (envelope and interior)
Appliances and lighting
HVAC (heating, ventilation, and air conditioning)
Smart meters
Buildings Electrification Heat pumps
Renewables Bioenergy
Geothermal
Solar home systems
Other renewables
Energy efficiency Industrial energy management systems
Fuel efficiency
Electrical efficiency
Industry Heat pumps
Renewables Bioenergy
Geothermal
Thermal solar
Other end uses Industry CCUS
Energy efficiency Road vehicles (passenger light duty vehicles, light
commercial vehicles, heavy-freight traffic vehicles,
medium-freight traffic vehicles and other road
Transport vehicles)
Other end uses Road electric vehicles
Private EV chargers
In the light duty vehicles sector, spending is taken to be the additional price of
each efficient vehicle sold (defined as those in the top 25% for fuel economy in
IEA. All rights reserved.
PAGE | 11World Energy Investment 2020: Methodology Annex Measuring investment in energy efficiency
their size and power class, according to the Worldwide Harmonised Light Vehicles
Test Procedure [WLTP]) compared to the average price of vehicles in eight size
and eight power classes in each country in that year. Different size and power
classes are considered to take into account expressed consumer preferences and
to maintain the principle of reduced energy demand for the same level of energy
service provided. Electric light duty vehicles – both battery electric vehicles (BEV)
and plug-in hybrid electric vehicles (PHEV) are included in this exercise with their
electricity consumption converted to litres of gasoline equivalent on a WLTP basis.
Underlying data is derived from IHS Markit (2018) and supplemented with public
data sources and Marklines (2021), according to the general methodology of the
Global Fuel Economy Initiative (GFEI, 2019). This price-based approach differs
from cost-based approaches that estimate the total cost of the improving efficiency
of the car fleet rather than the incremental consumer spending only. Cost-based
approaches are commonly used in modelling exercises and aim to quantify the
additional costs associated with improved fuel economy in future years, such as
those incurred by manufacturers.
It is worth noting that Investment levels presented in WEI2021 and FCET include
a different accounting of efficiency improvements in buildings, transport and
industry than reported in the Net Zero by 2050 report (IEA, 2021) and so differ
from the numbers presented there.
IEA. All rights reserved.
PAGE | 12World Energy Investment 2020: Methodology Annex Energy financing and funding trends
Energy financing and funding
trends
IEA investment work analyses trends related to financial flows, ownership and the
sources of funding and finance – the structure of financing arrangements used to
finance assets and their geographic location – for different energy sectors, as well
as analysis of these issues from the perspective of companies, banks and
investors.
The FCET report also provides an estimate of how the primary sources of finance
would evolve over the 2020-2030 decade under different energy pathways. The
FCET characterises the sources of finance across four broad parameters:
type of financing structure (off-balance sheet [project finance] or on-balance sheet
[corporate finance]);
type of provider (private or public);
type of instrument (according to capital structure - debt or equity);
origin of provider (international or domestic sources).
The assumptions and analytical approach of the the FCET are included below.
Measuring the sources of finance for
investments
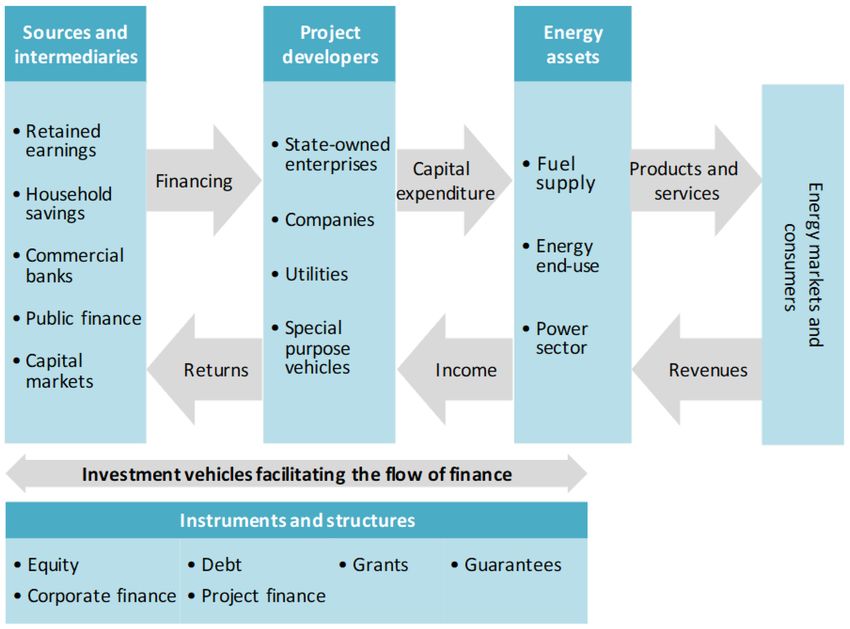
Capital spending on energy assets is first disaggregated between balance sheet
and project financing, which are carried out by a variety of intermediaries and
project developers (Figure 1). The main data sources used to estimate project-
financed investment are IJGlobal (2021), the World Bank Public Participation in
Infrastructure Database database (2021), Clean Energy Pipeline (2021) and
specific transaction announcements. Balance sheet financing is estimated as the
residual of total investment less the contribution from project finance.
An analysis of the sources of finance by private and public provider, capital
structure (debt and equity sources) and origin of funds (international and domestic)
is also carried out. For the project finance portion, this is done on a project-by-
project basis – based on the characteristics of the debt providers and equity
sponsors – while in the corporate finance portion this is done on a company basis.
The latter is based mainly on information from publicly listed-companies, using
data from Bloomberg (2021) and Reuters (2021), though also from publicly
IEA. All rights reserved.
PAGE | 13World Energy Investment 2020: Methodology Annex Energy financing and funding trends
available data of other non-listed companies (e.g. financial statements, annual
reports, etc). For example, to define whether finance is coming from public or
private sources, for balance sheet finance the analysis categorises the type of
company carrying out spending on its balance sheet as a state-owned enterprise
(if a government or government entitiy owns at least 50% of the shares) or private
sector actor, while for project finance categorisations are made of the debt
providers and equity sponsors.
To translate financing data into investment spending, reported primary financing
data, financial close date (proxy of the sanctioned date) and actual or estimated
operational date at project-level are combined in a given year. Given the difficulties
in synthesising complex data, which are not always complete or transparent, the
results should be seen as providing a broad indication of trends.
Figure 1 Financial flows in energy investment
IEA 2020. All rights reserved.
*
Projecting the sources of finance
The FCET includes an estimation of how the sources of finance would evolve
under different energy pathways. Generally, under an energy pathway based on
today’s policy settings, as in the STEPS, the sources of finance reflect the
IEA. All rights reserved.
PAGE | 14World Energy Investment 2020: Methodology Annex Energy financing and funding trends
continuation of recent financing trends across sectors and geographies. With the
enhanced policies and measures that deliver the ambitions needed to deliver
investments under climate-driven scenarios the outlook for finance shifts, and
reflects a better availability of clean energy projects with risk-adjusted returns that
attract a wider range of structures and investors; more efficient capital allocation,
especially from public sources; and the development of local capacity to invest in
clean energy.
Estimates are made through adjusting the ratios of on-balance and off-balance
sheet financing, private and public financing, debt and equity, and international
and domestic sources based on assumptions made on a sector- and
geographical-level. These assumptions include-
The role of private, international financing and debt generally increases for clean
energy under climate-driven scenarios. More ambitious, clear policies – as well as
improved regulation – help to improve the investment case for clean energy
assets. Under these conditions, perceived risks are seen to be lower and private
sector participation would be higher, as well as the willingness to commit higher
shares of debt and the ability to raise international finance. In addition, capital from
public sources, including public finance institutions (PFIs), is assumed to be more
effective in mobilising private finance for new assets and projects.
Within a given sector (e.g. utility-scale solar PV or wind), the role of private
financing is usually smaller in markets at initial stages of deployment compared
with more mature markets, and the role of PFI financing is higher. In both types of
markets – learning effects, as well as policy and regulatory improvements – have
the impact of improving the role of private finance and well as the use of debt over
time.
Specific project risks are also taken into account. For example, the role of PFIs
often remain larger in hydropower or geothermal projects compared to wind and
solar PV, given higher upfront challenges related to project development.
Technologies at a lower level of maturity, such as low-carbon hydrogen and CCUS
initially rely more heavily on state-owned enterprises and balance sheet finance,
even under climate-driven scenarios.
For electricity networks, the role of PFI and private capital in transmission and
distribution investment increases under climate-driven scenarios, as PFIs become
more focused on these assets and as a slightly higher share of private sector
participation would be required to mobilise investments.
Within end-use, sector-specific assumptions are also reflected in the sources of
finance estimation. In transport, the SDS assumes a faster growth in car leasing
and auto loan services for efficient, clean transport modes, translating into higher
shares of off-balance sheet and debt financing. In buildings, growth is assumed
for off-balance sheet and public financing as energy service companies (ESCOs)
IEA. All rights reserved.
PAGE | 15World Energy Investment 2020: Methodology Annex Energy financing and funding trends
become more prominent and as PFIs play an increasing role in financing green
buildings.
The role of capital markets
IEA investment work includes analysis on the role of capital markets and
institutional investors. With over USD 100 trillion under management, institutional
investors – including asset managers, infrastructure funds, insurance companies,
pension funds, private equity and venture capital funds and sovereign wealth
funds – are a large potential source of finance for the energy sector. Past editions
of WEI have noted that 90% of energy investments are financed on a primary
basis from the balance sheets of companies and consumers, with a smaller role
for project finance (mostly loans from banks).
But such mechanisms also depend on having a robust interconnected system of
secondary financial sources and intermediaries and diverse investment vehicles
to facilitate flows. Although a number of well-capitalised industry players (e.g.
some integrated oil and gas, utility and state-owned companies) are able to make
investments from retained earnings alone, there are economic benefits to tapping
into wider pools of finance, at a lower cost of capital, and especially in an era of
lower interest rates. Moreover, banks often face limits on their lending, particularly
with regulatory constraints emerging in recent years, such as Basel III.
In the FCET and WEI 2021, this analysis includes tracking of sustainable finance
trends including the recent dramatic rise of sustainable financial flows, and related
regulatory developments, and how this trend relates to energy investment.
For equity markets, the FCET tracked new capital raised by initial public offerings
(IPOs), project finance and clean energy funds in clean energy sectors, based on
disclosed transaction data from Bloomberg (2021), IJ Global (2021) and Preqin
(2021). It also analysed the financial performance of listed equity portfolios in the
energy sector.
For fixed-income, sustainable debt securities – including labelled green bonds,
green and sustainable loans and sustainability-linked debt – may provide investors
the clearest route to capital allocation for clean energy. They may also be
particularly suited for small-scale renewables and efficiency investments, which
are difficult for investors to fund directly. These advantages stem from labelling
and certification (under frameworks such as Green Bond Principles, and more
specific evaluations, e.g. Climate Bonds Standard). Still, frameworks are not
always harmonised across markets, and as labelled securities grow beyond green
bonds, their impact and uses become more complex to evaluate. These trends
IEA. All rights reserved.
PAGE | 16World Energy Investment 2020: Methodology Annex Energy financing and funding trends
are assessed using disclosed data from BNEF (2020b) with benchmarking against
other sources, including Climate Bonds Initiative and issuer reporting.
References
Bloomberg (2021), Bloomberg Terminal (accessed multiple times during March-
May 2021).
BNEF (Bloomberg New Energy Finance) (2020a), Battery storage database
(accessed April 2020).
BNEF (Bloomberg New Energy Finance) (2020b), Sustainable Finance database
(accessed multiple times during March-May 2021).
BNEF (Bloomberg New Energy Finance) (2018), Smart Meter Market Size
(accessed April 2020).China Energy Storage Alliance (CNESA) (2020),
Global Energy Storage Market Analysis, http://en.cnesa.org/
Clean Energy Pipeline (2021), database, London.
Clean Horizon (2020), Energy Storage Project Database, www.cleanhorizon.com
(accessed multiple times during March-May 2020).
Environmental Finance (2021), EF Bond Database, www.environmental-
finance.com/
Energy Storage Association (2020), https://energystorage.org/
GFEI (Global Fuel Economy Initiative) (2019), Fuel Economy in Major Car Markets:
Technology and Policy Drivers 2005-2017, https://www.iea.org/reports/fuel-
economy-in-major-car-markets.
Global Data (2018), Diesel Generators Update, https://www.globaldata.com/.
IAEA (International Atomic Energy Agency) (2020), Power Reactor Information
System (PRIS), IAEA, Vienna, Austria, https://www.iaea.org/pris/.
IEA (2020), World Energy Outlook 2020, Paris, https://www.iea.org/topics/world-
energy-outlook.
IEA (2021), Net Zero by 2050, A Roadmap for the Global Energy Sector, Paris,
https://www.iea.org/reports/net-zero-by-2050
IEA (2021a), Global EV Outlook 2021, Paris, https://www.iea.org/reports/global-ev-
outlook-2021.
IEA (2021b), Energy Technology RD&D Budgets: Overview, Paris,
https://www.iea.org/reports/energy-technology-rdd-budgets-overview.
IEA (2019), World Energy Investment 2019, Paris, www.iea.org/reports/world-
energy-investment-2019.
IJGlobal (2021), Transaction data (web page), https://ijglobal.com/data/search-
transactions
IHS Markit (2018), Vehicle registrations and other characteristics at model level
(database), https://ihsmarkit.com/btp/polk.html.
IRENA (International Renewable Energy Agency) (2020), IRENA Renewable
Costing Alliance, dataset, http://costing.irena.org/irena-renewable-costing-
alliance.aspx.
IEA. All rights reserved.
PAGE | 17World Energy Investment 2020: Methodology Annex Energy financing and funding trends
MarkLines (2021), Vehicle sales data (database),
www.marklines.com/en/vehicle_sales (accessed 14 May 2020)
McCoy Power Reports (2020), dataset, Richmond, www.mccoypower.net.
Mission Innovation (MI) (2019), “Mission Innovation country highlights”,
http://mission-innovation.net/wp-content/uploads/2019/05/MI-Country-
Highlights-2019.pdf, (accessed April 2020).
NRG (NRG Expert Energy Intelligence) (2020), Electricity Transmission and
Distribution Report and Database, www.nrgexpert.com/energy-market-
research/electricity-transmission-and-distribution-report-and-database/.
Platts (2020), World Electric Power Plants Database, Platts, Washington
D.C.Thomson Reuters Eikon (2021), (accessed multiple times during March-
May 2021).
Preqin (2021), Funds Database, https://pro.preqin.com/discover/funds (accessed
multiple times during March-May 2021).
World Bank (2020), Public Participation in Infrastructure Database,
https://ppi.worldbank.org/en/ppi (accessed April 2020).
IEA. All rights reserved.
PAGE | 18World Energy Investment 2020: Methodology Annex R&D and Technology Innovation
R&D and Technology Innovation
The approach taken is a bottom-up tracking exercise based on publicly reported
data. While it is acknowledged that definitions can vary, especially between the
public and private sectors in terms of how capitalised assets are included, the
reported numbers and their allocations between technology areas are generally
taken at face value. Interpolations, estimations and extrapolations are used
sparingly. The main breakdowns and sources of data are presented in Table 1.2.
Sources for the compilation of energy R&D spending 2012-2020
Funding Type Region/Country Source
IEA member Data submitted annually to IEA, broken down by
governments, plus technology area and published in the IEA Energy
Brazil Technology RD&D database. See IEA (2020b, 2011)
Statistics Yearbook on Science and Technology Activities of
Industrial Enterprises; China Statistical Yearbook on Science
China
Public and Technology; data submission to the Mission Innovation
(MI) Secretariat; state-owned enterprise annual reports
Research budgets of energy-related ministries; data
India
submission to the Mission Innovation (MI) Secretariat
South Africa Budget reports of the Department of Energy and SANEDI
Reported R&D spending in annual company disclosures,
allocated per energy sub-sector according to share of
Corporate
revenue from that activity unless otherwise stated by the
company
Private
Series A, series B and seed funding by technology area from
Early stage venture
the Cleantech Group i3 database, reclassified to align with
capital
IEA energy technology categories and sectors of investors.
Corporate financial reports of over 1 250 companies active in energy sector
industry classifications are included in the sample. These classifications include:
fossil fuel extraction, transport, conversion and services; electricity generation,
including production, equipment manufacture and services; electricity, gas and
district heating utilities; electricity and gas networks and smart grids; electric
mobility; LEDs; insulation; electricity storage, hydrogen and fuel cells; non-
electricity renewable energy, including production and equipment manufacture.
R&D budgets of companies that are active in multiple sub-sectors are allocated
on the basis of the share of revenue in these sectors (including non-energy
sectors), complemented by interviews with major companies and details in
IEA. All rights reserved.
PAGE | 19World Energy Investment 2020: Methodology Annex R&D and Technology Innovation
corporate annual reports in some cases. These attempts to capture only energy-
relevant R&D budgets are particularly important in the case of companies whose
primary sectoral classification is not well-aligned with the full extent of their market
and innovation activities.
One notable caveat is that this methodology makes it challenging to capture
corporate research into efficient buildings, appliances and industry. Such R&D is
undertaken within the R&D activities of these other sectors for which energy
efficiency cannot be separated from their other research activities. However, we
know that energy research in other sectors is substantial (IEA, 2017).
Furthermore, non-listed companies comprise a non-trivial component of total
energy R&D spending and these are not captured by our methodology.
Low-carbon energy technology spending is separated wherever possible to
include all technologies (for the public sector and venture capital) and all industry
sub-sectors (for the corporate sector) related to: renewables; nuclear; CCUS;
smart grids; electric mobility; LEDs; electricity storage, insulation.
IEA. All rights reserved.
PAGE | 20World Energy Investment 2020: Methodology Annex Annexes
Annexes
Abbreviations, units and acronyms
ABS asset-backed securities
B30 diesel containing 30% biodiesel
BEV battery-electric vehicles
boe barrel of oil equivalent
Bt billion tonnes
C&S Central & South America
CAD Canadian dollar
cal calorie
CCUS carbon capture, utilisation and storage
CO2 carbon dioxide
CTO coal-to-olefin
DAC Direct Air Capture
DDI Development Finance Institution
E15 ethanol blend 15 (gasoline containing 15% ethanol)
E20 ethanol blend 20 (gasoline containing 20% ethanol)
EBITD
earnings before interest, depreciation and amoritization
A
EMDEs Emerging market and developing economies (excluding China)
EOR enhanced oil recovery
EPC energy performance certificate
EPC engineering, procurement and construction
ESCO energy service company
EUR euro
EV electric vehicle
FID final investment decision
FYP Five-Year Plan
g gram
GBP British pound sterling
GDP gross domestic product
GJ gigajoule
GW gigawatt
GW gigawatt
IEA. All rights reserved.
PAGE | 21World Energy Investment 2020: Methodology Annex Annexes
GW e gigawatt of electrical energy
GWh gigawatt hour
GW th gigawatt of thermal energy
HVO hydrotreated vegetable oil
ICT Information and communication technology
IPP independent power producers
IRR internal rate of return
IT information technology
JPY Japanese Yen
kb/d thousand barrels of oil per day
kg kilogram
km kilometre
ktoe thousand tonnes of oil equivalent
kV kilovolt
kWh kilowatt hour
LCFS Low Carbon Fuel Standard
LCOE levelised cost of electricity
LLC limited liability company
LNG liquified natural gas
LPG liquified petroleum gas
MBS mortgage-backed security
MBtu million British thermal units
mb/d million barrels of oil per day
MDB multilateral development banks
MENA Middle East and North Africa
MI Mission Innovation
Mt million tonnes
MTO methanol-to-olefin
Mtoe million tonnes of oil equivalent
Mtpa million tonnes of coal equivalent per year
Mtpa million tonnes of natural gas equivalent per year
MW megawatt
MW e megawatt of electrical energy
MWh megawatt hour
MW th megawatt of thermal energy
NOC National Oil Company
NZE The IEA Net Zero Emissions Scenario
IEA. All rights reserved.
PAGE | 22World Energy Investment 2020: Methodology Annex Annexes
OECD Organisation for Economic Co-operation and Development
OFSE oil field service and equipment
OPEC is an intergovernmental organization of 13 oil-exporting developing
OPEC
nations
OPEC+ OPEC, plus ten other cooperating countries
PACE property-assessed clean energy
PDH propane de-hydrogenation
PHEV plug-in hybrid electric vehicle
PLDVs passenger light duty vehicles
PLN Perusahaan Listrik Negara
PPA power purchase agreement
PV (Solar) photovoltaic
R&D research & development
RD&D research, development & demonstration
RFS2 Renewable Fuel Standard 2
ROIC return on invested capital
SDS The IEA Sustainable Development Scenario
SHC-
Solar Heating and Cooling Technology Collaboration Program
TCP
SOE state-owned entity
PFI Public finance instutition
SDS The IEA Sustainable Development Scenario
SPV special purpose vehicle
STEPS The IEA Stated Policies Scenario
SUV sport utility vehicle
toe tonne of oil equivalent
TTF title transfer facility
TWh terawatt hour
UHV ultra-high voltage
UICI IEA upstream Investment Cost Index
USD United States Dollar
USICI IEA upstream Shale Investment Cost Index
VC venture capital
WACC weighted average cost of capital
WEI IEA World Energy Investment
WEO IEA World Energy Outlook
WLTP Worldwide Harmonised Light Vehicles Test Procedure
WTI West Texas Intermediate
YTD year to date
IEA. All rights reserved.
PAGE | 23World Energy Investment 2020: Methodology Annex Annexes
Glossary
Sustainable fuels produced from non-food crop feedstocks, which are
capable of delivering significant lifecycle greenhouse gas emissions
savings compared with fossil fuel alternatives, and which do not directly
compete with food and feed crops for agricultural land or cause adverse
Advanced biofuels:
sustainability impacts. This definition differs from the one used for
“advanced biofuels” in the US legislation, which is based on a minimum
50% lifecycle greenhouse gas reduction and which, therefore, includes
sugar cane ethanol.
OECD regional grouping and Bulgaria, Croatia, Cyprus, Malta and
Advanced economies:
Romania.
An asset-backed security (ABS) is an investment security that is
Asset-backed security: backed by a pool of assets, e.g. loans (home, auto, student), leases,
credit card debt, royalties, or other financial asset receivables.
Involves the explicit financing of assets on a company’s balance sheet
using retained earnings from business activities, including those with
regulated revenues, as well as corporate debt and equity issuance in
capital markets. To some extent, it measures the degree to which a
Balance sheet finance:
company self-finances its assets, though balance sheets also serve as
intermediaries for raising capital from external sources. The WEI and
FCET also refer to ‘Corporate finance’ when describing balance sheet
financing.
A broad category of development finance arrangements that blend
relatively small amounts of concessional donor funds into investments,
in order to mitigate specific investment risks. This can catalyse
important investments that would otherwise be unable to proceed under
Blended finance:
conventional commercial terms. These arrangements can be structured
as debt, equity, risk-sharing or guarantee products. Specific terms of
these arrangements, such as interest rates, tenor, security or rank, can
vary across scenarios.
Borrowing cost are the costs incurred by a company resulting from the
Borrowing costs:
borrowing of funds e.g. interest.
The buildings sector includes energy used in residential, commercial
and institutional buildings, and non-specified other. Building energy
Buildings:
use includes space heating and cooling, water heating, lighting,
appliances and cooking equipment.
Costs to develop and construct a fixed asset such as a power plant and
grid infrastructure or execute a project, excluding financing costs. For
Capital costs:
power generation assets, capital costs include refurbishment and
decommissioning costs.
Capital structure is the particular combination of debt and equity used
Capital structure:
by a company to finance its overall operations and growth.
Includes both primary coal (including lignite, coking and steam coal)
and derived fuels (including patent fuel, brown-coal briquettes, coke-
Coal:
oven coke, gas coke, gas-works gas, coke-oven gas, blast-furnace
gas and oxygen steel furnace gas). Peat is also included.
Co-generation: The combined production of heat and power.
Resources extended at terms more favourable than those available in
the market. This can be achieved through one or a combination of the
following factors: interest rates below those available on the market;
Concessional financing: maturity, grace period, security, rank or back-weighted repayment
profile that would not be accepted/extended by a commercial financial
institution; and/or by providing financing to the recipient otherwise not
served by commercial financing.
IEA. All rights reserved.
PAGE | 24World Energy Investment 2020: Methodology Annex Annexes
Community choice
Municipal-level entities that procure bulk power.
aggregators (CCAs):
Equity investments in start-ups that are developing a new technology
or service by companies whose primary business is not venture
capital nor other equity investments. In addition to playing the
traditional role of a venture capital investor, corporate venture capital
Corporate venture capital: investors often provide support to the start-ups via access to their
customer base, R&D laboratories and other corporate resources.
Corporate venture capital is used by companies as part of their energy
innovation strategies to enter new technology areas or learn about
technologies more quickly than developing them in-house.
Current ratio: Current assets divided by current liabilities.
Bonds or loans issued or taken out by a company to finance its growth
Debt:
and operations.
Dispatchable low-carbon power refers to technologies whose power
Dispatchable low-carbon output is derived from low-carbon sources and can be readily
power: controlled - increased to maximum rated capacity or decreased to
zero - in order to match supply with demand.
Refers to technologies whose power output can be readily controlled –
Dispatchable power
increased to maximum rated capacity or decreased to zero – in order
generation:
to match supply with demand.
An insulated network that delivers hot water or steam from co-
District heating: generation (the combined production of heat and power) or heat-only
sources via pipelines to space heating or hot water users in buildings.
Dividend coverage ratio: The ratio of a company's dividend payout relative to its net income.
The proportion of a company's net income that is paid out to
Dividend pay-out ratio:
shareholders in dividends.
Generally the first three venture capital fundraising rounds involving
external investors in a start-up, referred to as seed, series A and series
B. These investments accept a significant share of of technology risk
Early-stage venture
and are a major source of risk capital that support innovation in many
capital:
clean energy technologies. The values generally increase from up to
USD 2 million for a seed round, to USD 10 million or more for a series
B round, but can be smaller or much larger.
Earnings before interest, tax, depreciation and amortization (EBITDA)
is a measure of a company's operating performance. EBITDA allows
EBITDA:
for comparison between companies without needing to take
differentiate financial, accounting and tax considerations.
Refers to water electrolysers designed for the production of hydrogen
Electrolyser:
via electrolysis using electricity and water inputs.
For the purpose of the WEI and FCET report, this group includes all
Emerging market and emerging market and developing economies except for OECD
developing economies member countries Chile, Colombia and Mexico, and excluding China,
(EMDEs): as the dynamics of investment in China are quite distinctive and is
also a major outward investor in EMDEs.
End-use investment includes investment in three categories on the
End-use investment: demand side: energy efficiency, end-use renewables and other end-
use.
Capital spending on bioenergy, geothermal and thermal solar, which
End-use renewable
are directly consumed by residential and service buildings and
investment:
industry.
IEA. All rights reserved.
PAGE | 25World Energy Investment 2020: Methodology Annex Annexes
The incremental spending on new energy-efficient equipment or the
full cost of refurbishments that reduce energy use. The intention is to
Energy efficiency
capture spending that leads to reduced energy consumption. Under
investment:
conventional accounting, part of this is categorised as consumption
rather than investment.
Research and development related to improving the performance or
Energy Research and
reducing the costs of the production, storage, transportation,
development (R&D):
distribution and-use of all forms of energy.
Common stock, preferred stock, or retained earnings that a company
Equity:
uses to finance its growth and operations.
The cash flow available to the company’s investors (e.g. shareholders
and bondholders) after all operation expenses are paid and investments
Free cash flow:
are made. It is calculated by subtracting capital expenditure from
operating cash flow.
A green bank is a public, quasi-public or non-profit entity established
Green bank: specifically to facilitate private investment into domestic low-carbon,
climate-resilient infrastructure.
A green bond is a type of fixed-income instrument created to fund
Green bond:
projects that have positive environmental and/or climate benefits.
A mortgage or loan with the intended purpose to improve existing
Green mortgage-backed
properties to achieve increased energy efficiency or decreased water
securities (MBS):
usage.
A type of private equity investment, usually a minority investment, in
relatively mature companies that are looking for capital to expand or
restructure operations, enter new markets or finance a significant
acquisition without a change of control of the business. While it
Growth equity:
involves less technology risk than early-stage venture capital, it is one
of the ways in which energy technology start-ups scale up innovative
technologies. It is a strategy of corporate venture capital investing to
develop new technologies.
The energy content of the electricity produced in hydropower plants,
Hydropower: assuming 100% efficiency. It excludes output from pumped storage
and marine (tide and wave) plants.
The discount rate that makes the present value of investment cost
Internal rate of return
(cash outflow) equal to that of benefits (cash inflow), whereby making
(IRR):
the net present value of the project equal to 0.
In WEI 2021 and FCET, all investment data and projections reflect
actual spending across the life cycle of a project, i.e. the capital spent
is assigned to the year when it is incurred. Investments for oil, gas and
coal include production, transformation and transportation; those for
the power sector include refurbishments, uprates, new builds and
replacements for all fuels and technologies for on-grid, mini-grid and
off-grid generation, as well as investment in transmission and
Investment:
distribution, and battery storage. Investment data are presented in real
terms in year 2019 US dollars unless otherwise stated.
Note that the definition was effective beginning in 2019. Previously,
the investment data reflected “overnight investment”, i.e. the capital
spent is generally assigned to the year production (or trade) is started,
rather than the year when it is incurred.
The amount of time from the start of a project to its commissioning. Lead
times refer to the time between the final investment decision and the
Lead times:
start-up for oil and gas projects and construction time for power
generation assets.
Leverage, or gearing, is the relative amount of debt a company uses
Leverage:
to raise capital needed to fund its activities.
IEA. All rights reserved.
PAGE | 26World Energy Investment 2020: Methodology Annex Annexes
A light-duty vehicle is a road vehicle with at least four wheels and with
Light-duty vehicles: a kerb weight below 3.5 tonnes. This broadly covers the UN categories
of M1 and N1.
Liquidity: The availability of liquid (cash) assets.
Long-term debt, also called non-current liabilities, are a company's
Long-term debt:
financial obligations will mature after a year.
Low-carbon power comes from methods that produce substantially
less carbon (or carbon equivalent) emissions than fossil fuel power
Low-carbon power: generations. Low carbon power includes power generation from wind,
solar, hydro, nuclear, geothermal, marine, bioenergy, and fossil fuel
with CCUS.
Market capitalisation represents to the total value of a company as
Market capitalisation: determined by the stock's present share trading value multiplied by
the total number of shares.
A global initiative of over 20 countries to accelerate clean energy
innovation. Initiative members aim to double their government and/or
Mission Innovation (MI):
state-directed clean energy RD&D investment over five years from
2015 to 2020, among other goals. See the MI website for details.
Crackers designed to alter their feedstock mix depending on market
Mixed feed crackers:
conditions.
A mortgage-backed security is a sub-type of an asset-backed security
Mortgage-backed security:
that is comprised of a bundle of home loans.
The total debt of a company less its available cash. Net debt
Net debt: compares how much debt a company could pay-off utilizing its liquid
assets.
The Net‐Zero Emissions by 2050 Scenario (NZE): An IEA Scenario
that shows what is needed for the global energy sector to achieve net‐
zero CO2 emissions by 2050. It also aims to minimise methane
emissions from the energy sector and it contains concrete action on
Net Zero Emissions the energy‐related United Nations Sustainable Development Goals.
Scenario (NZE) The NZE does not rely on action in areas other than the energy sector
to achieve net-zero emissions, but with corresponding reductions in
emissions from outside the energy sector, it is consistent with limiting
the global temperature rise to 1.5 °C without a temperature overshoot
(with a 50% probability).
Nominal (value or terms) is a financial and economic term that
indicates the statistic in question is measured in actual prices that
Nominal (terms):
exist at the time. nominal value of any economic statistic means the
statistic is measured in terms of actual prices that exist at the time.
Refers to electricity produced by wind turbines that are installed in
Offshore wind:
open water, usually in the ocean.
An option-adjusted spread is the the calculated spread between a
Option-adjusted spread: computed index of all bonds in a given rating category and its risk-
free counterpart.
Other end-use investment: Capital spending on transport electrification and industry CCUS.
An agreement with the United Nations Framework Convention on
Climate Change ratified by almost 190 countries to tackle climate
change. It aims to strengthen the global response to keep a global
Paris Agreement: temperature rise this century well below 2 °C above pre-industrial
levels. All Parties to the Agreement are required to put forward their
best efforts through Nationally Determined Contributions and to
strengthen the efforts in the years ahead.
Refers to the period of time required to recover the amount invested in
Payback period:
a project from its benefits (cash inflows).
IEA. All rights reserved.
PAGE | 27You can also read