RENEWABLES IN CITIES 2021 GLOBAL STATUS REPORT - CASE STUDIES - REN21
←
→
Page content transcription
If your browser does not render page correctly, please read the page content below
RENEWABLES IN CITIES
2021 GLOBAL STATUS REPORT
 CASE STUDIES
RENEWABLES IN CITIES
2021 GLOBAL STATUS REPORT
CASE STUDIES
TABLE OF CONTENTS
Adelaide, Australia. . . . . . . . . . . . . . . . . . . . . . . . . . . . . . . . . . . . 1
Cape Town, South Africa. . . . . . . . . . . . . . . . . . . . . . . . . . . . 2
Cocody, Côte d’Ivoire 3
. . . . . . . . . . . . . . . . . . . . . . . . . . . . . . .
8 Dakar, Senegal. . . . . . . . . . . . . . . . . . . . . . . . . . . . . . . . . . . . . . . . . 4
17 11
5 Heidelberg, Germany. . . . . . . . . . . . . . . . . . . . . . . . . . . . . . . . 5
15 Jakarta, Indonesia. . . . . . . . . . . . . . . . . . . . . . . . . . . . . . . . . . . . . 6
Kampala, Uganda. . . . . . . . . . . . . . . . . . . . . . . . . . . . . . . . . . . . . 7
10
13 Malmö, Sweden . . . . . . . . . . . . . . . . . . . . . . . . . . . . . . . . . . . . . . . 8
4 North Lombok Regency, Indonesia. . . . . . . . . . . . . 9
3 16 18 Orlando, United States. . . . . . . . . . . . . . . . . . . . . . . . . . . 10
7 Oxford, United Kingdom. . . . . . . . . . . . . . . . . . . . . . . . . 11
14 6 9 Palmas, Brazil . . . . . . . . . . . . . . . . . . . . . . . . . . . . . . . . . . . . . . . 12
Rajkot, India . . . . . . . . . . . . . . . . . . . . . . . . . . . . . . . . . . . . . . . . . 13
12 Recife, Brazil. . . . . . . . . . . . . . . . . . . . . . . . . . . . . . . . . . . . . . . . . 14
2 15
1 Seoul, Republic of Korea. . . . . . . . . . . . . . . . . . . . . . . . .
Tsévié, Togo. . . . . . . . . . . . . . . . . . . . . . . . . . . . . . . . . . . . . . . . . . 16
Vancouver, Canada. . . . . . . . . . . . . . . . . . . . . . . . . . . . . . . . 17
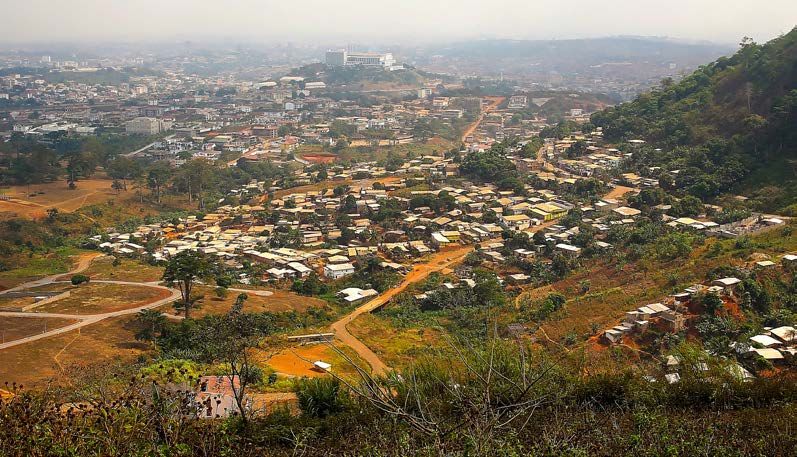
Yaoundé IV, Cameroon. . . . . . . . . . . . . . . . . . . . . . . . . . . 18
For further details and access to the full report and references, visit www.ren21.net/cities
See Endnotes and Methodological Notes in the full REC for further details on the information presented in this document.
REPORT CITATION | REN21 (2021), Renewables in Cities 2021 Global Status Report (Paris: REN21 Secretariat).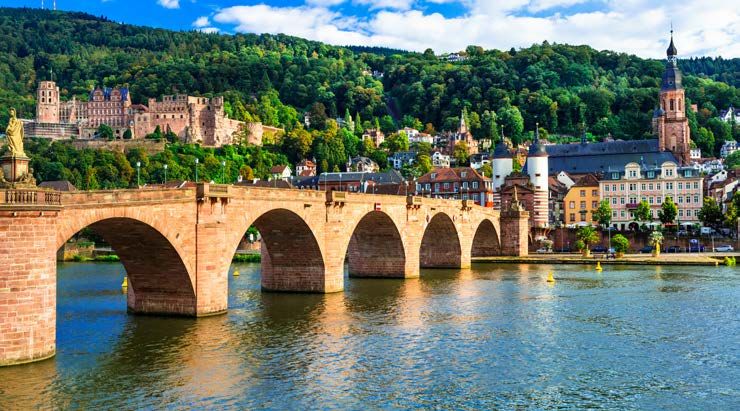
CITY SNAPSHOTS

ADELAIDE
AUSTRALIA
        Land area               Population size                       Greenhouse gas emissions
        (km2)                   (2019)
                                                                GHG
                                                                      (CO2 equivalent)
                                                                                                                 1
        15.6                    1.3 million                           360,759 tonnes

As part of a power purchase agreement, the City of Adelaide’s              In addition, the Carbon Neutral Adelaide Action Plan provides
municipal operations have been powered by 100% renewables                  incentives to create new economic opportunities and to support
since July 2020, using electricity generated from wind farms               the business sector. Building upgrade finance provided by private
in mid-north South Australia and new solar PV farms on Eyre                financiers in partnership with the local council helps to improve
Peninsula and in the South East. This long-term commitment                 the energy, water and environmental efficiency of non-residential
supports the Adelaide Carbon Neutral Strategy 2015-2025,                   buildings and infrastructure. This mechanism offers loans from
which sets a target for carbon neutrality by 2025.                         the financier to building owners, which are repaid by the local
As a step towards achieving this goal, the City adopted the                council. Upgrading the infrastructure provides financial returns
Carbon Neutral Adelaide Action Plan 2016-2021 to reduce                    and has the potential to reduce electricity use 43% by 2030.
greenhouse gas emissions. The plan sets out 104 actions for                The Sustainability Incentive Scheme and the CitySwitch Green
council and local government under several low-emission                    Office support city residents with financial incentives for the
pathways: energy-efficient built form, promoting walking                   uptake of sustainability practices, technology and trends for
and cycling, hybrid and electric vehicles for individuals and              low-carbon living. Rebates of up to AUD 5,000 (USD 3,831)
businesses, “zero-emission” transport, towards 100% renewables             are available for households, businesses and car parks for the
with solar PV and solar hot water, reducing emissions from waste           installation of energy-saving technologies, solar PV systems, EV
and water use, and offsetting carbon emissions. The projects               charging, solar hot water systems and energy storage systems.
under the 100% renewable pathway generate cost savings for
                                                                           The City of Adelaide also is assessing adaptation actions to
residents and businesses along with reducing emissions. In
                                                                           increase the energy self-sufficiency of its wastewater treatment
total, the city had installed 8.3 MW-peak of solar PV capacity
                                                                           plants by harnessing biogas to generate renewable electricity.
as of 2019, including 2,362 kilowatts (kW) at city-owned and
                                                                           A total of 39,000 megawatt-hours (MWh) was generated from
-operated sites.
                                                                           wastewater biogas in 2018-19. In parallel, the local government
Local government investments in energy storage support                     has been exploring the potential of carbon offset projects. In 2017,
the deployment of new affordable storage technologies.                     a demonstration carbon sequestration site was established near
For example, the Hornsdale Power Reserve, referred to as                   Adelaide High School to provide the community with a practical
South Australia’s Big Battery, was established in 2017 with                example of a carbon sink.
100 MW-peak, and another 50 MW-peak had been added in
early 2020. Located next to the 316 MW Hornsdale Wind Farm,
the Power Reserve is one of the world’s largest lithium-ion
batteries, providing grid services that enable the penetration of
variable renewable energy sources like wind and solar power.

Source: See endnote 24 in the Urban Policy Landscape chapter.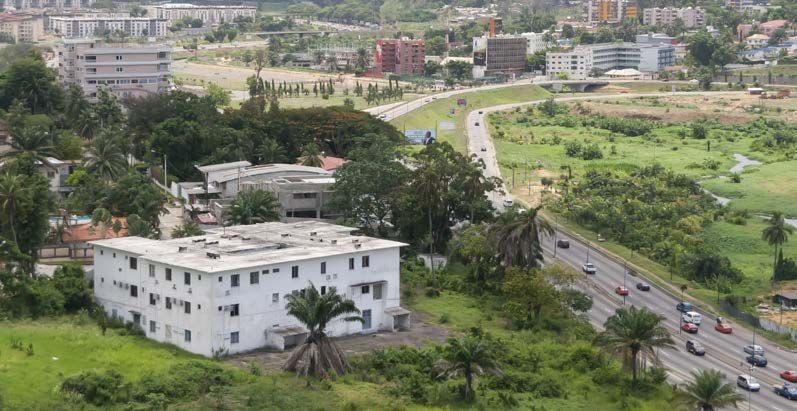
CITY SNAPSHOTS

CAPE TOWN
SOUTH AFRICA
                                  Population                                                Total final
        Land area                 density                                                   energy demand
        (km2)                     (per km2)                 Population size                 (million GJ)
                                                                                                                                      2
        400                       1,700                     4.2 million                     145.3

Cape Town is South Africa’s second largest economic hub, with                      Electricity is the main energy carrier in Cape Town’s non-
a population of around 4.2 million in 2018 and a land area of more                 transport sectors, and because most of the electricity in South
than 400 square kilometres. Cape Town contributed 9.8% of                          Africa comes from high-carbon coal-fired power plants, the built
the national economic output in 2018 and is dominated by the                       environment accounted for 55% of the city’s greenhouse gas
service sector, with significant finance, insurance, real estate and               emissions in 2018. Residential electricity use in Cape Town is split
business activities.                                                               largely across cooking, lighting and space heating applications,
Coal contributed 83% of South Africa’s electricity generation                      while in the commercial sector electricity use is dominated by
capacity in 2016 (latest available data), with nuclear power and                   lighting, heating and ventilation in office buildings.
natural gas representing 4% and 5% respectively and renewable                      The City of Cape Town has been a pioneer in providing more
energy making up the remaining 8%. The government aims to                          affordable and secure energy access and in reducing the city’s
increase the renewable share in the generation mix to around 40%                   carbon footprint while also tackling rapid urbanisation and
by 2030 through various policy instruments, as promulgated in the                  associated energy poverty, urban sprawl and vulnerability to
Integrated Resource Plan (IRP)i of 2019.                                           climate change. Cape Town’s long history of renewable energy
The City of Cape Town has taken an active leadership role in                       efforts includes the establishment of a dedicated energy and
renewable energy deployment, emphasising not just technology                       climate change unit. As early as 2000, an energy advisor
change but also the need to improve governance and institutions                    was seconded to the City as part of the Sustainable Energy
and to engage key players in the energy transition, from national                  for Environment and Development (SEED) programme of
government to business and civil society. The decoupling of                        Sustainable Energy Africa (SEA), bringing an energy lens to City
electricity demand from economic growth in the Metropolitan                        operations and service delivery. In 2003, with technical support
Municipality over the last decade is attributed to energy efficiency               from SEA, Cape Town completed its first State of Energy report,
and renewable energy interventions in the face of soaring electricity              and in 2006 it became the first African city to approve a municipal
prices and insecure electricity supply in South Africa.                            Energy and Climate Change Strategy, setting an initial target for
                                                                                   10% renewable and clean energy by 2020.
The transport sector, which relies almost exclusively on petrol and
diesel, accounts for 62% of Cape Town’s total final energy demand                  The city benefited from learning by doing. Catalysed by the Energy
and contributes a third (32%) of the Metro area’s greenhouse gas                   Efficiency and Demand Side Management Programme, launched by
emissions. The sector’s high energy use is largely a result of the                 South Africa’s Department of Mineral Resources and Energy, Cape
city’s sprawling and segregated form, which reflects the legacy of                 Town began an extensive and ambitious drive in 2008 to improve
apartheid’s spatial planning. The commercial sector is the second                  the energy efficiency of municipal operations, saving a cumulative
most energy-intensive sector (14% of total final energy demand)                    ZAR 225 million (USD 16 million) through 2019. The City began
followed by households (12%) and industry (12%).                                   supporting small-scale “embedded generation” in 2011, making it

i The IRP provides a medium-term plan for expanding electricity generation in South Africa. It aims to guide sector investment to allow the country to meet its
  forecasted electricity demand at the least cost and accounting for considerations such as environmental sustainability and water use. The plan incorporates
  objectives such as affordable electricity, reduced greenhouse gas emissions, diversified generation sources, localisation and regional development.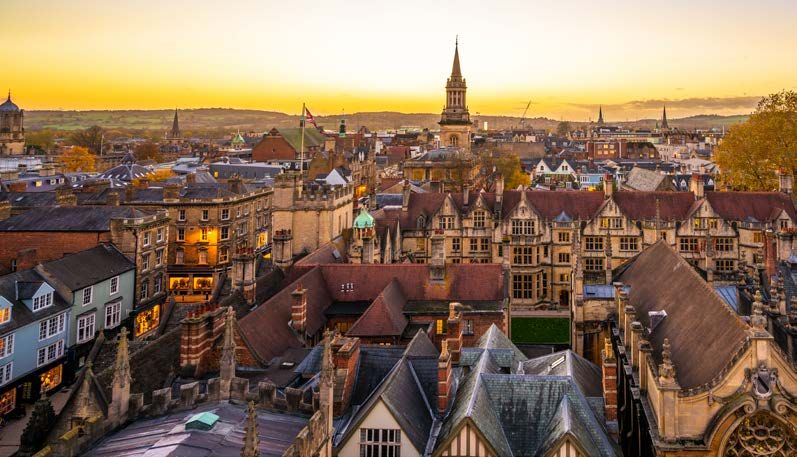
South Africa’s first city to develop tariffs and rules for distributed              Integrated Development Plans (which guide overall planning and
renewables and serving as a blueprint for the rest of the country.                  development for municipalities in South Africa).
In 2013, when South Africa had no national standards in place                       The City of Cape Town has begun laying the foundations for
for solar PV on buildings, Cape Town published guidelinesi                          supplying renewable energy at scale. Based on a legislative
promoting the safe and legal installation of distributed renewables                 change in late 2020, the municipal government is exploring the
in commercial and residential settings. By 2019, the City had the                   commercial, legal and technical aspects of a municipal-level
highest concentration of registered rooftop solar PV systems                        Renewable Energy Independent Power Procurement Programme
nationwide. In total, between 2011 and 2020, Cape Town approved                     (REIPPP) and is developing a guide on how to engage with
the installation of nearly 42 MW of rooftop solar PV and installed                  industries in procuring energy from IPPs. As of 2020, the City was
0.6 MW on City buildings through its rooftop PV programme.                          working on a Zero Carbon 2050 action plan (and related policies)
These systems feed into the local electricity distribution network,                 as well as developing low-income energy services, a framework
helping to reduce reliance on coal-fired power from the national                    for electric vehicles and innovative financing opportunities for
grid. Similar processes, guidelines and tariffs have since been                     engaging households in small-scale rooftop solar PV.
adopted in more than 40 other South African municipalities.
                                                                                    Cape Town is also honouring its international commitments to
Building on earlier roll-outs of solar water heaters in low-income                  climate action. It is a signatory to various initiatives including
communities, in 2013 Cape Town implemented a programme to                           the Mexico City Pact, CDP, the carbonn Climate Registry,
promote this technology more widely, helping to reduce energy                       the Covenant of Mayors in Sub-Saharan Africa and the C40
from one of the highest electricity-consuming end-uses for city                     Cities Leadership Programme. The City also has committed to
households, water heating. By 2015, some 46,000 solar water                         achieving carbon neutrality by 2050, recognising that this will
heaters had been installed city-wide, saving 128,000 MWh                            require ambitious actions across all sectors. To translate these
per year, creating employment equivalent to 1,300 job-yearsii ,                     commitments into action, Cape Town has woven them into its
contributing more than ZAR 380 million (USD 27 million) to the                      Integrated Development Plan for the period 2017-2022.
local economy and reducing more than 132,000 tonnes of carbon
                                                                                    The City’s transport plan includes exploring the potential
emissions per year.
                                                                                    production and use of biofuels in transport, using renewables for
In 2015, the Cape Town Energy 2040 Vision, developed through                        infrastructural facilities such as depots and transport interchanges,
an extensive process of energy modelling and stakeholder                            and replacing the municipal diesel bus fleet with electric buses
engagement, set ambitious city-wide targets for increasing                          (which eventually would be powered with renewables). In a pilot
energy access, improving energy efficiency and reducing carbon                      project in early 2018, the City’s “MyCITI” bus rapid transport
emissions. It also set a target to achieve at least 500 MW of                       service added 11 locally manufactured electric buses to its fleet.
renewable and clean energy capacity by 2040. To help achieve
                                                                                    Cape Town is working to prepare its power grid for high EV
this ambition, the City of Cape Town elevated the role of energy
                                                                                    penetration in the near future. The Electric Vehicle Framework
institutionally, combining its two energy-related divisions
                                                                                    includes leveraging EV roll-out and charging to increase the share
(one focused on energy and climate change and the other on
                                                                                    of renewables in final energy consumption, and is considering
electricity generation and distribution) into a single new Energy
                                                                                    requiring public EV charging stations that exceed a specific
and Climate Change Directorate.
                                                                                    demand threshold to operate on renewable energy. This energy
This change also signaled Cape Town’s intention to expand its                       is expected to be either generated from local solar PV capacity or
role in local electricity supply. In 2017, the City entered into a court            purchased through a contractual arrangement.
challenge with the national government to enable it to purchase
electricity from independent power producers (IPPs) and not be
confined to procuring coal-fired power from Eskom, the centrally
controlled national energy utility. In a landmark step in October
2020, South Africa’s Department of Mineral Resources and
Energy amended the
country’s          electricity
regulations to enable                The City of Cape Town
municipalities in good               has taken an
financial standing to
develop their own power
                                        active
generation projects, as                 leadership
                                        role
a way to ensure security
of energy supply in a
co-ordinated         manner          in renewable energy
aligned to the national              deployment.
IRP and the municipal

Source: See endnote 24 through 59 in the Feature: Renewable Energy in Sub-Saharan African Cities chapter.
i The guidelines, which are non-binding, outline a comprehensive list of City-approved suppliers of inverters, the steps for installing solar systems and the
  application process for registering and selling electricity to the City.
ii A job-year refers to one of year of work for one person.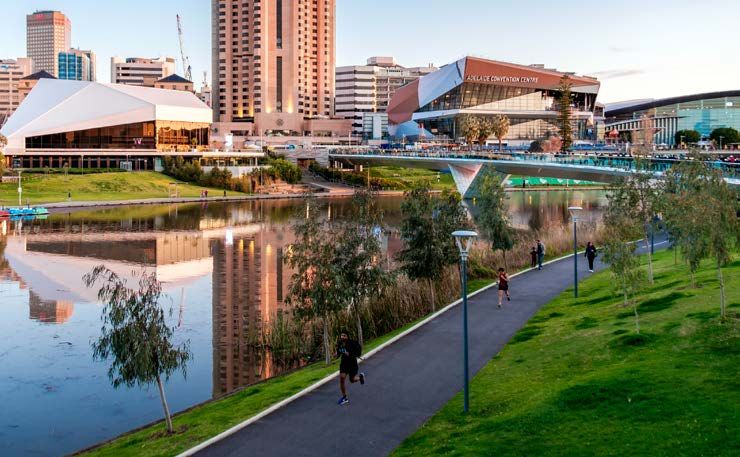
CITY SNAPSHOTS

COCODY
CÔTE D’IVOIRE
Land area                 Population size
(km2)                     (2018)
                                                                                 3
135                       800,000

The City of Cocody, located north of Abidjan on the coast of Côte      emissions include distributing to households 300,000 efficient
d’Ivoire, released its Green City Plan in 2017, pledging to reduce     cook stoves that run on ethanol procured locally from sugarcane
carbon emissions 70% by 2030 to combat climate change. The             manufacturers, producing 1,000 solar dryers for community
city established the pledge to complement efforts to achieve the       women, distributing solar water heaters and setting up four wind
national goal of 42% renewable electricity generation by 2030,         farms on the banks of Ebrie lagoon.
as put forward in Côte d’Ivoire‘s 2016 Nationally Determined
Contribution towards reducing emissions under the Paris                The Cocody Green City plan also emphasises the development
Agreement. Achieving the city’s emissions reduction target             of sustainable transport and mobility plans through a Transport
will be challenging due to Cocody’s rising energy demand, which        Demand Management scheme that aims to remove 1,000 old
is caused largely by rapid urban development and economic              vehicles annually from city roads to improve local air quality and
growth.                                                                eliminate some 50 million tonnes of CO 2 emissions per year. In
                                                                       addition, a used vehicle repair centre has been created to provide
Cocody Green City is an ambitious plan that aims to
                                                                       100,000 catalytic exhaust systems for polluting vehicles.
minimise local greenhouse gas emissions while also creating
100,000 direct jobs and 400,000 indirect jobs, promoting
women’s empowerment and increasing citizen participation
in adopting sustainable living. This community-based climate
action plan aims to reduce CO2 emissions by up to 90% by
2030, using renewable energy and carbon sequestration efforts.
The city has set up a Reforestation and Carbon Sequestration
Program that includes the development of green spaces and the
restoration and replanting of 2 million mangrove trees to protect
local climate health.

The Green City plan takes a holistic approach towards upgrading
energy use and generation, transport, habitat restoration and land
use, conservation and protection of water resources, community
sensitisation and adoption. As of 2017, 23 measures were under
development, including using solar energy to power large public
buildings, installing 5,000 solar lamp posts, installing 1,600 solar
traffic lights at 400 crossroads and supplying 200,000 solar PV
power kits to households. Other measures to reduce carbon

Source: See endnote 36 in the Markets and Infrastructure chapter.
CITY SNAPSHOTS

DAKAR
SENEGAL
                                   Population                                                    Total final
          Land area                density                                                       energy demand
          (km2)                    (per km2)                   Population size                   (million GJ)
                                                                                                                                4
          83                       15,278                      1.3 million                       28.6

Dakar is the capital of Senegal in West Africa and is located at                     The transport sector dominates the city’s energy demand –
the western tip of the country. It is an Atlantic port city covering                 accounting for 55% of total energy consumption – followed
an area of 83 square kilometres with an estimated population                         by the industrial (34%) and residential (8%) sectors. Despite
of more than 1.3 million inhabitants. As of 2016, the greater                        Dakar’s high electrification rate of more than 95%, household
Dakar region was home to 50% of Senegal’s urban population,                          electricity use remains low at around 153 kWh per capita annually
95% of its industrial and commercial companies, 80% of its                           (compared to 10,649 kWh per capita in the United States), with
infrastructure and services and 87% of its formal employment;                        lighting as the main end-use application. Liquefied petroleum
as a consequence, Dakar contributed an estimated 68% of the                          gas (LPG) is the primary energy source for cooking (averaging
country’s gross domestic product (GDP).                                              12 kilograms per month per household), followed by charcoal
                                                                                     (0.2 kilograms per person per day) and some use of firewood.
As of 2019, Senegal had around 864 MW of total installed
                                                                                     The high energy demand for transport reflects Dakar’s
electricity capacity, 13% of which was renewable (7% from
                                                                                     deteriorating road infrastructure, inefficient public transport
hydropower and 6% from solar PV). The National Energy
                                                                                     networks and ageing vehicle fleet, with 80% of on-road vehicles
Development Plan (Lettre de Politique de Développement
                                                                                     estimated to be more than five years old. This has led to urban
du Secteur de l’Energie, or LPDSE), signed in 2012, targets
                                                                                     mobility challenges, including permanent traffic jams at peak
increasing the renewable share in power generation from 10% in
                                                                                     hours that contribute to high air pollution and negatively affect
2016 to 15% in 2020i . The country’s national economic and social
                                                                                     residents’ economic competitiveness, health and well-being, and
development plan (Plan Senegal Emergent, PSE 2025) aims for
                                                                                     quality of life. In response, the national transport entity, Conseil
a 23% share of on-grid renewables in power generation by 2030.
                                                                                     Exécutif des Transports Urbains de Dakar (CETUD), piloted the
The City of Dakar reinforces these objectives through municipal                      city’s mobility and urban planning strategy, the PDUD 2008-
policies and strategies such as the Environmental Action Plan                        2025. The plan articulates three ambitious infrastructure projects
(P.ACT.E.) and the Master Plan for Urban Development of Dakar                        – the Express Transit Train (TER), bus rapid transit and renewal
and Its Surroundings (PDU 2035). The PDU aims to achieve                             of the on-road transport fleet – with a common goal of increasing
15% local electricity production from renewables by 2035 and                         the share of electrification and reducing fossil fuel dependence
to reduce reliance on diesel power generation from 90% in 2013                       across these three transport modes while also reducing air
to 5% in 2035. The City intends to finalise (by March 2021) its                      pollution from on-road transport emissions by 2030.
Plan Climate Energie Territorial (PCET), which will be the integrated                Although the local authority has control over municipal buildings
energy and climate change development plan informing Dakar’s                         only, the City recently completed a pilot energy audit of all municipal
short- and long-term renewable energy roadmap. The PCET is                           and public buildings, as the first phase of an ambitious target to
being developed as a result of Dakar’s commitment under the C40                      equip more than half of municipal buildings with grid-connected
Cities Leadership Programme to be net-zero carbon by 2050.                           distributed rooftop solar PV by 2030, as envisaged in the PCET.

See endnote 60 through 74 in the Feature: Renewable Energy in Sub-Saharan African Cities chapter.
i As of late 2020, no reporting had been identified to verify that this renewable energy target had been met.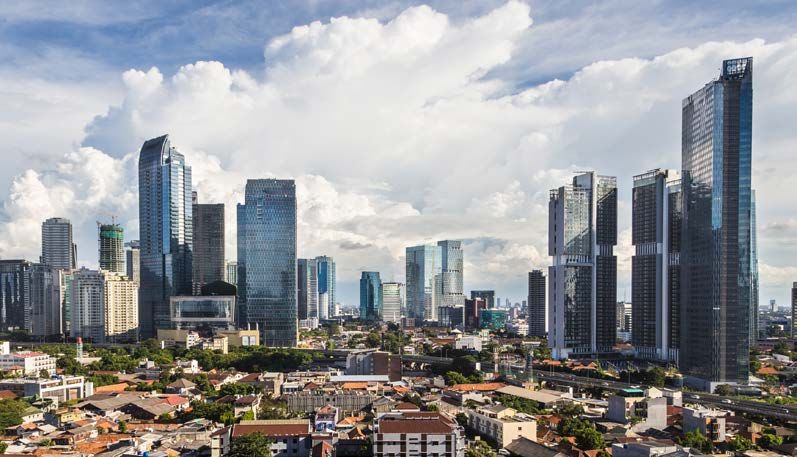
CITY SNAPSHOTS

HEIDELBERG
GERMANY
       Land area                 Population size
       (km2)                     (2019)
                                                                                                       5
       108                       160,000

Heidelberg is a German frontrunner on energy and climate              Since early in the year, the municipal district heating network has
issues. The city aims to become climate neutral by 2050, and          run on 50% renewable energy, with the goal of achieving climate-
in 2019 it was one of the first cities in the country to declare a    neutral district heating and phasing out the use of coal by 2030.
climate emergency. In part in response to this climate emergency      In addition, the city aims to produce a third of its heating capacity
declaration, Heidelberg passed its Climate Action Plan,               locally by 2025.
complementing the city’s 2014 masterplan for 100% climate
                                                                      Due to land scarcity within Heidelberg, in 2020 the municipal
protection.
                                                                      utility started co-operating with utilities in other municipalities
The Climate Action Plan sets out 30 actions for the city to achieve   to expand the city’s solar PV and wind power supply. Thanks to
its climate protection goal. These actions include a focus on         this co-operation, Heidelberg plans to achieve its goal of adding
energy-efficient buildings and on renovation of old building stock;   25 MW of renewables by 2030, with an interim goal of 14 MW
passive house standards and renewable energy requirements for         by 2024.
new neighbourhoods; scaling up renewables in district heating
                                                                      To further scale up solar PV within city boundaries, in late 2020
and the municipal power utility; improving public transport and
                                                                      the city council passed a policy to provide financial support for
increasing green spaces; and sustainable consumption.
                                                                      distributed solar PV on all residential and commercial buildings
Despite facing challenges from the COVID-19 pandemic,                 (up to EUR 250, or USD 307, per kW-peak, depending on the
Heidelberg was able to realise several of these actions in 2020.      building size and type). In addition, the city government passed
                                                                      a mandate requiring solar PV on all new buildings built on
                                                                      municipal plots, and requiring it on existing buildings in some
                                                                      neighborhoods. With this mandate, Heidelberg joins other
                                                                      German cities such as Amberg, Freiburg, Hamburg, Konstanz
                                                                      and Waiblingen that have similar solar PV requirements.

                                                                      To decarbonise the transport sector, Heidelberg has joined the
                                                                      C40 Fossil Fuel-Free Streets Declaration and pledged to reduce
                                                                      the number of polluting vehicles on its streets and to transition
                                                                      away from fossil fuel vehicles. The city offers financial support for
                                                                      hydrogen vehicles as well as electric and hybrid vehicles. In 2020,
                                                                      the municipal utility started building up EV charging infrastructure
                                                                      throughout Heidelberg. To further support decarbonisation,
                                                                      the city also has expanded bike infrastructure and bike parking
                                                                      facilities.

                                                                      Source: See endnote 126 in the Urban Policy Landscape chapter.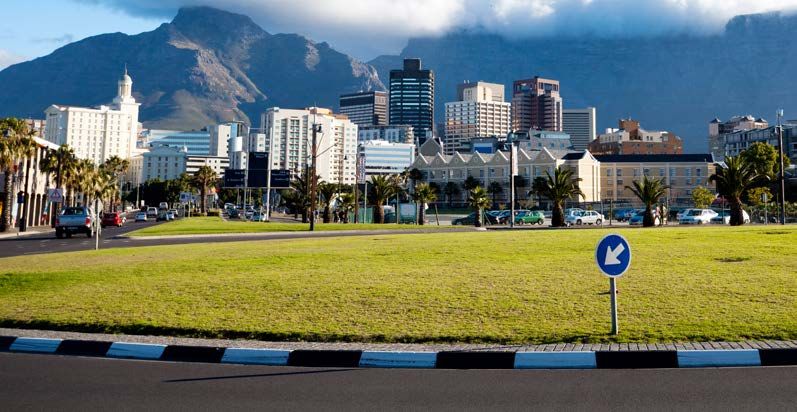
CITY SNAPSHOTS

JAKARTA
INDONESIA
                                                                       Greenhouse gas
        Land area                   Population size
                                                                                                 6
                                                                       emissions
        (km2)                       (2019)                             (CO2 equivalent)

                                                                       34.5    million
                                                                GHG

        7,639                       10.1 million                               tonnes

As the capital of Indonesia, Jakarta is taking effective action to
reach its goal of reducing the city’s greenhouse gas emissions
30% by 2030, a target set in 2012. The local action plan serves as
a means to help achieve Indonesia’s national emission reduction
target of 29% by 2030, with a focus on renewable energy.
Jakarta also committed in 2016 to reducing its water and energy
consumption 30% and to achieving 30% renewables in its energy
mix by 2030. To meet this latter target, the municipal government
plans to increase its solar panel capacity by 600 kW-peak per
year and to develop waste-to-energy plants.
The local government also is actively engaging citizens and
stakeholders in the formulation of the Ikhtiar Jakarta (“city
promise”) initiative, which outlines Jakarta’s commitments in the
areas of energy, green buildings, transport, clean water, waste
and disaster management. Six public consultations with a total of
300 attendees were conducted in 2018-19 to promote sustainable
lifestyles and support the initiative. Jakarta also is developing a
Regional Energy Plan (RUED-P), which contributes to achieving
the targets set in the National Energy General Plan (RUEN) and
the National Energy Policy (KEN).
In 2019, Jakarta implemented Governor Instruction No. 66, which
mandates the city’s Transmigration, Manpower and Energy
Agency to install rooftop solar on large public buildings, including
all schools, sport facilities, hospitals and government buildings
during 2019-22. In 2019, a total solar capacity of 2,060 kW-peak
was installed on 98 schools, bringing the combined rooftop
                                                                                                              In Jakarta

                                                                                            citizens have
solar capacity on schools and government buildings to
2,675 kW-peak and showcasing the great potential to minimise
local carbon footprints.

                                                                                          actively helped
Source: See endnote 100 in the Citizen Participation chapter.                       shape the city’s climate action plan.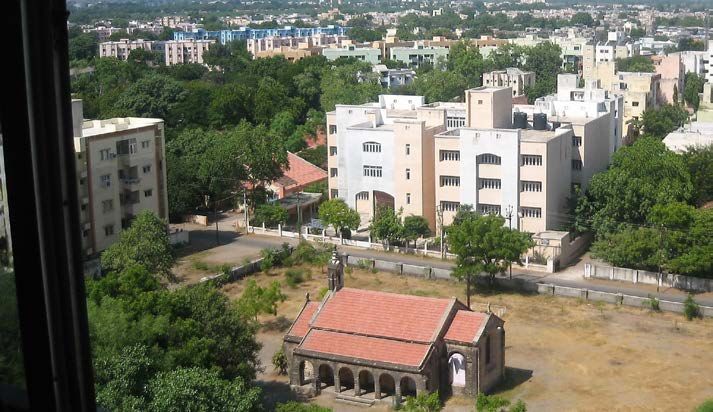
CITY SNAPSHOTS
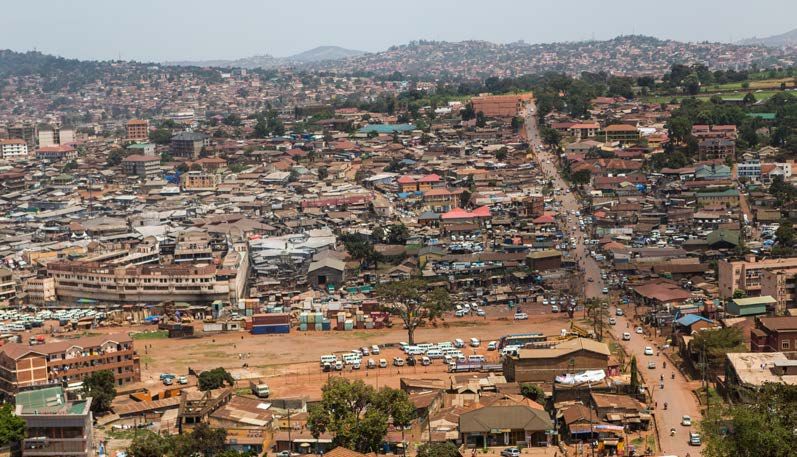
KAMPALA
UGANDA
Population Total final
Land area density energy demand
(km2) (per km2) Population size (million GJ)
7
189 8,021 1.7 million 35.8
Kampala is the capital city and largest urban centre of Uganda, The transport sector’s large share of energy consumption is
with more than 1.7 million inhabitants in 2020. As the country’s seemingly in contrast with Kampala’s service-based economy.
economic hub, it accounted for 80% of Uganda’s industrial and However, the service sector has low energy intensity, in part
commercial activities in 2016 and generated around 65% of because 57% of businesses in the city were informal as of 2017,
national GDP that year. City operations fall under the responsibility focused mainly on non-tradeable services such as retail, transport
of the Kampala Capital City Authority (KCCA). and restaurants. Informal roadside vending has added to city
KCCA is a pioneer signatory to the Covenant of Mayors in Sub- congestion, and significant passenger travel also occurs through
Saharan Africa (joining in 2015), through which the city developed its inefficient transport modes such as motorcycles (boda boda) and
first energy and climate action plan – the Kampala Climate Change private cars, which together accounted for 70% of total passenger
Action Strategy – in 2016. This strategy frames KCCA’s approach transport energy demand in 2016.
to furthering the deployment of renewables through assessing These transport and mobility challenges helped shape KCCA’s
the local renewable energy potential, supporting the city’s green Climate Change Action Strategy 2016 and the Kampala City
economy, promoting the implementation of a feed-in tariff system Strategic Plan 2025, which hinges on the principle of SMART
and reducing the use of individual motorised transport in favour of mobilityi to improve the efficient movement of people and goods
non-motorised mobility and green and public transport. KCCA’s within and through Kampala City. The City established an air
strategy is consistent with the Draft National Energy Policy of 2019, quality monitoring and assessment system and is promoting
which promotes the deployment of non-hydropower renewable electric mobility to gradually replace conventional commercial
generation sources to diversify the energy mix and thereby motorcycles as a way to reduce noise and air pollution, petrol
mitigate Uganda’s over-reliance on hydropower, which accounted demand and traffic jams.
for 90.5% of the national electricity supply in 2018. KCCA’s leadership has enabled successful public-private
The transport sector dominates Kampala’s energy demand, partnerships, and by 2020 start-ups such as Bodawerk and Zembo
accounting for 45% of the total in 2016, followed by the residential had resulted in the use of more than 200 new and retrofitted
(23%), industrial (21%) and services (11%) sectors. The majority of electric motorcycles for public transport in the city (charged mostly
this energy demand is fuelled by fossil fuels used in transport (55%) from the hydropower-dominant grid). Electric mobility through
and by (mainly traditional) biomass used for cooking and water e-motorcycles provides a framework for KCCA to contribute to
heating (36%). After biomass, electricity (90% of which comes national and international climate change mitigation efforts by
from hydropower) is the second largest non-transport energy deploying renewables in the transport sector. Because electric
carrier, accounting for 17% of total final energy consumption; it is motorcycles require little infrastructure, are silent and produce
used across the industrial, services and residential sectors, mainly virtually no emissions (thereby improving air quality levels), they
for lighting, cooling and the powering of heavy machines. hold promise for successful uptake among boda boda riders.
Source: See endnote 74 through 87 in the Feature: Renewable Energy in Sub-Saharan African Cities chapter.
i The SMART mobility strategy, detailed in the Transport Master Plan for the Kampala Metropolitan Area, supports the construction and operation of a Mass
Rapid Transit System based on buses, rail and cable cars by 2040.CITY SNAPSHOTS
MALMÖ
SWEDEN
Greenhouse gas
Land area Population size emissions
(km2) (2018) (CO2 equivalent)
8
52.7 million
GHG
76.8 344,000 tonnes
The City of Malmö has a track record of urban development a combination of biomass and fossil fuels. To help reduce fossil-
initiatives that have led to its recognition as a pioneering based energy use, all of the municipalities in southern Sweden
sustainable city. The most well-known examples in the city are send their waste to Malmö, where it is processed and converted
the Western Harbour district (Västra Hamnen), which has to heat that is fed into the district heating network. For example, at
operated on 100% renewables since at least 2012, and the Sysav waste-to-energy facility, the waste is reduced through
Augustenborgin, an industrial area that has 450 square metres thermal treatment processes to produce energy in the forms of
of solar thermal panels connected to the central heating system. electricity and heat.
Malmö’s goal is to make all city government activities climate Additionally, Malmö is constructing a 50 MWth geothermal
neutral by 2020 and to ensure that the entire city runs on 100% deep-heat plantii, which is expected to start operation in 2022.
renewables by 2030. Malmö plans to achieve its 100% renewable The city plans to build a total of five geothermal heat plants by
energy goal from a mix of renewable sources, waste-to-energy 2028, each with an installed capacity of 50 MWth , to replace the
and recycled energy. As of 2020, around 43% of Malmö’s energy use of biofuels and biogas for heat generation. The estimated
was from renewable sourcesi, primarily wind energy. budget for this pilot project is EUR 5.4 million (USD 6 million),
The city has identified two challenging sectors that need to be with the Swedish Energy Agency providing EUR 1.2 million
addressed to stay on track to achieving the 2030 goal: transport (USD 1.34 million). The city’s partners include E.ON, a privately
and district heating. Sweden’s substantial district heating owned energy supplier that is investigating the geological
network was built in the 1950s, and many cities in the country conditions, as well as the Swedish Geological Survey and the
have extensive systems. Malmö’s district heating system runs on University of Uppsala.
Malmö is replacing the use
of biofuels and fossil fuels
in heat generation with
geothermal heat
in order to achieve its energy
and climate goals.
Source: See endnote 137 in the Markets and Infrastructure chapter.
i This includes organic waste incineration and industrial waste heat.
ii Boreholes will be in the range of five to seven kilometres deep, and the temperature of around 160°C is expected to be sufficient to directly enter the district
heating network. This project will be one of Europe's first geothermal power plants to extract heat from such a depth at the industrial level.CITY SNAPSHOTS
NORTH LOMBOK
REGENCY
INDONESIA
Land area (km2) Population size
9
776.3 200,000
North Lombok is the youngest regency (municipality) in the As of 2020, some 1,152 household-scale biogas units using organic
Indonesian province of West Nusa Tenggara, located on Lombok waste had been installed in the North Lombok region through
Island. Energy demand in West Nusa Tenggara totalled more this scheme. The cost of one unit of biogas is IDR 13 million
than 1,950 GWh in 2019 and was growing by 5.9% annually. With (USD 933), and the local government shares this amount by
increased economic development in the region, energy demand contributing IDR 4-5 million (roughly USD 290-360) per unit
is expected to continue to grow rapidly to 2030. (30-40%). To support the technical portion of the project, Hivos
To reduce greenhouse gas emissions in the city and to support / Yayasan Rumah Energi provide high-quality biogas digesters
the provincial target to generate 35% of electricity from to the users as well as three years of after-sales service for civil
renewable sources by 2025, the local government has set buildings and one year for pipe and stove installations.
ambitious goals to deploy renewables in a cost-efficient and
sustainable manner. North Lombok has rich potential for cheap
biomass residues and opportunities to harness wind and solar
energy. Out of 8.97 MW of operating power plant capacity in
North Lombok, 8.82 MW is derived from renewables, primarily
micro-hydropower (the 7 MW Segara and 1 MW Santong plants)
and solar energy in Gili Islands.
To support local communities, the North Lombok government
developed a Cost-sharing Financing Scheme for Household-
scale Biogas to simultaneously reduce dependence on
traditional biomass and cut greenhouse gas emissions in
the residential sector. Although this scheme was originally
an initiative of the provincial government, the North Lombok
government has taken measures to adopt it in the city region.
The cost is shared between the local government and Hivos /
Yayasan Rumah Energi, along with the household users of the
biogas, who pay a small amount to ensure citizen participation
and ownership.
Source: See endnote 29 in the Financing and Investment in Cities chapter.CITY SNAPSHOTS
ORLANDO
FLORIDA (UNITED STATES)
Land area Population size Greenhouse gas emissions
(km2) (2020) (CO2 equivalent) 10
295 280,000
GHG
over 6,994,170 tonnes
The City of Orlando has a strong reputation for its city-wide Orlando also is home to more than 1 MW peak of floating
achievements in sustainability and resilience. Over the last solar PV and has been a pioneer in this new application since
decade, the Green Works Orlando initiative has revolutionised 2017. The OUC will to continue to study the performance and
the city by adding a sustainability chapter to the local municipal scalability of floating solar PV in collaboration with the National
code. The implementation of sustainability policies and plans Renewable Energy Laboratory thanks to a USD 1 million grant
has made the city a leader in developing environmentally from the US Department of Energy. In 2020, the City of Orlando
friendly communities. unveiled the new “floatovoltaics” at its international airport,
In 2020, the Orlando Utilities Commission (OUC) began showcasing this unique solar application. The local government
developing its Electric Integrated Resource Plan, with the aim has installed several “solar sculptures” and “solar trees” in
of becoming carbon neutral by 2050 (with interim CO 2 emission the city to generate electricity and educate customers on the
reduction targets of 50% by 2030 and 75% by 2040). The plan benefits of solar power.
also acts as a pillar to achieve the mayor’s ambitious goal of
100% renewable electricity generationi in the city by 2050. It
supports the phase-out of coal by 2027 and provides a roadmap
to diversify the city’s existing electricity mix. Although solar PV
will remain the main source of new energy, Orlando will invest
in energy storage and other related technologies to ensure
reliability and resilience.
The OUC has a major role in making solar energy affordable and
accessible in the city and has found innovative ways to harness
power from the sun. In 2017, it established long-term power
purchase agreements to buy power from the 12.6 megawatt
(MW) Kenneth P. Ksionek Community Solar Farm, the first in the
country to include a solar PV array that sits atop a by-product
landfill. In 2020, the OUC backed the construction of two new solar
PV farms – the Harmony Solar Energy Center in St. Cloud and
the Taylor Creek Solar Energy Center in east Orange Countyii ,
together capable of powering 30,000 homes – and started
purchasing power from them.
Source: See endnote 5 in the Urban Policy Landscape chapter.
i According to the CDP-ICLEI Unified Reporting System, the share of renewables in electricity generation in Orlando was 2% (no date specified).
ii These are two of five projects being developed in the context of the Florida Municipal Solar Project, a partnership between the Florida Municipal Power
Agency and 16 Florida public power utilities, including the OUC.CITY SNAPSHOTS
OXFORD
UNITED KINGDOM
Greenhouse gas
Land area Population size emissions
(km2) (2019) (CO2 equivalent) 11
718,082 tonnes
GHG
45.6 152,450
In January 2019, Oxford City Council unanimously declared a The GBP 41 million (USD 53.8 million) project will help
climate emergency in Oxford and agreed to create a Citizens’ accelerate the use of electric vehicles in Oxford, by providing
Assembly to help consider new carbon targets and additional charging points powered by the spare capacity of the
measures to reduce emissions in the city. As a result, Oxford battery to City Council depots and key businesses including
aims to become a net-zero carbon emitter by 2030, a full local bus companies, taxi providers and commercial fleet
20 years ahead of the UK national target. In addition, Oxford depots. The project also aims to develop the first rapid
City Council pledged to achieve net-zero carbon emissions in its charging hub in Oxford, making available around 20 ultra-rapid
own operations by the end of 2020, after the Citizens’ Assembly EV chargers for public use. Charging speeds will range between
requested such a move. Oxford City Council is a member 10 and 30 minutes.
of Low Carbon Oxford, a network of 40 public and private
The project scope also includes a “Trial before you buy”
organisations that aimed to reduce city-wide emissions 40%
programme by the City Council for taxi drivers in Oxford. This
below 2005 levels by 2020. Oxford also is part of the UK100, a
will help the taxis transition from 100% diesel to 100% electric
network of local government leaders who have pledged to shift
by 2025. In total, the ESO pilot project will last for 36 months;
to 100% clean energy by 2050.
once successful, the technology is to be expanded to up to
To decarbonise energy in transport and heat systems (the major 44 other sites across the United Kingdom.
sources of carbon emissions in Oxford) and to achieve the 40%
emission reduction, the City Council has facilitated an energy
storage project, the Energy Superhub Oxford (ESO). It expected
to be the world’s largest hybrid energy storage system, with
a 50 MW grid-scale batteryi that will support a 10-kilometre
network of EV charging points and ground-source heat pumps
for around 300 households.
The ESO project, which started construction in 2020, will
help reduce 20,000 tonnes of CO 2 annually by 2021 and
44,000 tonnes of CO 2 annually by 2032. The project will be
capable of integrating multiple sources of energy to manage
energy demand, including renewables. Because Oxford is part
of the UK100 network, by 2050 the ESO is to run entirely on
renewable energy.
Source: See endnote 248 in the Markets and Infrastructure chapter.
i The battery, connected to the Cowley sub-station in Blackberry Lane, South Oxford, will store and deliver electricity (including renewable electricity) to
electricity suppliers and help balance the local requirements for the grid. Electricity will be stored at times of low demand and then resupplied back to the
grid when demand peaks. The technology is capable of shifting demand to periods of low prices, minimising consumers’ energy bills and overcoming local
network constraints.CITY SNAPSHOTS
PALMAS
BRAZIL
Land area Population size
(km2) (2020) 12
100.6 306,000
Palmas City, the capital of the state of Tocantins in north- For Palmas, the tax incentives did not affect public revenue because
central Brazil, aims to generate 100% of its electricity from solar the project was launched right after a tax increase, foreseeing that
power by 2022 and to have 100% of its local electricity energy a share of municipal revenue would be allocated to this project.
supply based on solar energy by 2035 (foregoing the use of Three private banks, Banco da Amazônia, Banco do Nordeste
hydropower from the regional grid). Hydroelectric dams located and Banco do Brasil, have helped finance any remaining costs.
on the Tocantins River account for nearly 97% of the electricity The programme has led to the creation of a solar PV market with
consumed in the city, in addition to providing power elsewhere more than 20 local enterprises selling and installing imported or
in the country. However, electricity bills in Palmas are among the locally manufactured solar panels. As of October 2020, the city had
highest in Brazil, and growing uncertainties about hydropower’s granted discounts totalling BRL 415,785 (around USD 103,000) and
stability and climate and environmental risks have heightened supported 3.8 MW of installed decentralised generation capacity
interest in exploring the local solar resource. under the Palmas Solar programme.
The Palmas Solar project, established in 2015, provides tax In parallel, Palmas implemented the Parque Solar project. During
incentives for companies and households to install solar phase 1 of the project in 2018, the government-owned bank Caixa
PV panels and to feed surplus generation to the electricity Econômica Federal provided financing to install solar panels on
grid. The benefits include reducing the city’s dependence on public schools, saving the municipality an estimated BRL 5,000
hydropower and non-renewable energy sources, improving (USD 1,240) per month. Phase 2 involves building a 5 MW solar
air quality and reducing greenhouse gas emissions. The main farm to power all municipal buildings with solar energy, although
drivers for reducing hydropower are rising energy bills and the funding is yet to be secured.
environmental risks of this generation source.
At first, the project focused on solar PV installations only in
new buildings, but it has since extended city-wide. Users are
encouraged to install solar panels in exchange for a discount
of up to 80% on two municipal taxes – the Property and Urban
Land Tax and the Real Estate Transfer Tax – for a period of five
years. The costs for private users are drastically reduced, as the
solar power they generate is fed into the grid and discounted
from their energy bills. The local utilities maintain the distribution
infrastructure, for which users pay a minimal equipment cost.
Source: See endnote 6 in the Financing and Investment in Cities chapter.CITY SNAPSHOTS
RAJKOT
INDIA
Land area Population size Greenhouse gas emissions
(km2/2015) (2018)
GHG
(CO2 equivalent) 13
129.2 1.8 million 1,887,684 tonnes
Rajkot, the fourth largest city in the western Indian state Because of its efforts in low-carbon action and community
of Gujarat, has committed to reducing its greenhouse gas engagement, Rajkot Smart City was selected as the national
emissions 14% by 2022-23 (from 2015-16 levels). Energy winner of WWF’s Global One Planet City Challenge in 2020.
consumption in residential buildings totalled 606 million Other noteworthy initiatives in Rajkot that support this award
kWh in 2015-16, accounting for around half of all electricity include: the installation of 9,629 kWh of grid-connected solar
consumption and contributing 35% of greenhouse gas PV systems on residential buildings (with a further proposed
emissions from economy-wide activities in the city. Recent 500 kWh on municipal buildings); retrofitting of 63,178 public
efforts have focused on reducing energy consumption and street lights with light-emitting diodes (LEDs), resulting in
enhancing energy efficiency in residential buildings. The annual energy savings of 11.5 million kWh; the implementation
Capacity Building for Low Carbon and Climate Resilient City of Smart Ghar III, an affordable green home concept aimed
Development project (CapaCITIES) has helped maximise the at maintaining indoor thermal comfort with minimal climate
use of renewables in the city, reducing the need to tap into the impact; and plans to replace diesel buses with electric ones,
predominantly coal-based national grid. along with the provision of solar PV charging.
The Krantiveer Khudiram Bose social housing complex (known
as 11A) consists of five buildings with a total of 140 dwelling
units. At full occupancy, common amenities (lifts, lights,
pumps, etc.) consume 3,000 kWh of electricity per month.
To encourage the adoption of solar PV, a 31.5 kW-peak grid-
connected solar PV system is being installed on-site and will
be operated and maintained by the contractor/developer for a
period of 10 years. The system consists of 100 polycrystalline
solar PV panels of 315 watt-peak capacity each, mounted
on a frame at a 21-degree panel tilt. It will generate around
3,780 units of electricity per month (45,360 kWh per year)
and has the potential to reduce 37 tonnes of CO 2 -equivalent
greenhouse gas emissions annually. Overall responsibility for
the safety, security and periodic cleaning of the panels will
lie with the township’s Residential Welfare Association, which
has been trained on panel maintenance.
Source: See endnote 124 in the Urban Policy Landscape chapter.CITY SNAPSHOT:
SNAPSHOTS
RECIFE
BRAZIL
Greenhouse gas
Land area Population size emissions
(km2) (2018) (CO2 equivalent)
14
GHG
million
218 1.6 million 2.9 tonnes
Recife, an Atlantic seaport in north-eastern Brazil, is the first city
in the country to formally declare a climate emergency. According
to the Intergovernmental Panel on Climate Change, Recife is
the 16th most vulnerable city in the world to climate change.
Drastic changes in the local weather have motivated the local
government to make commitments towards a low-carbon future.
In 2019, in response to its climate emergency declaration, Recife
committed under the City Climate Action Plan to becoming
carbon neutral by 2050. The local government also aims to
achieve 100% renewable energy in city-wide operations by 2037.
In 2013, Recife created two municipal fora, Comclima and
Geclima, to formulate climate change and sustainability policies.
As a part of the Urban LEDS project, the city also has developed
measures to reduce its greenhouse gas emissions. Under the
Urban LEDS network, Recife was selected to receive support
from the climate finance laboratory to install a pilot 17 kW-peak of the National Electrical Energy Agency (ANEEL) – provides
solar PV system at the Women’s Hospital of Recife (HMR), which 0.4% of the net operating revenue of local energy companies to
is expected to be operational by 2021. In addition, Recife City has fund research and development projects and the implementation
approached a local energy company, Companhia Energética of energy efficiency and renewable energy measures in the city.
de Pernambuco (CELPE), to finance an initial investment of To promote greater citizen participation, CELPE holds public
EUR 200,000 (around USD 225,000) to help define model hearings where it presents the plans and results of renewables
financing for energy efficiency measures, distributed generation and efficiency projects in the region. Through public calls, it
and replicability of actions in other buildings in the municipality. seeks partners to promote the development of new technologies,
To assist the city’s sustainable development efforts, the Energy transform energy efficiency markets and create rational habits
Efficiency Program (PEE) – promoted by CELPE in the regulations and practices for the use of electricity.
Source: See endnote 139 in the Citizen Participation chapter.CITY SNAPSHOTS
SEOUL
REPUBLIC OF KOREA
Land area Population size Greenhouse gas emissions
(km2) (2020) (CO2 equivalent)
GHG 15
605 9.9 million 46,685,000 tonnes
In July 2020, Seoul, the capital of the Republic of Korea, Seoul 2050 climate neutrality plan, Seoul is identifying new
responded to the country’s commitment to achieve climate installation sites (including urban infrastructure); increasing
neutrality by 2050 by developing an integrated policy approach the standards for solar generation in zero-energy buildings;
focused on five key areas: buildings, mobility, forestry, clean providing subsidies for building-integrated PV; extending the
energy and waste management. Seoul’s vision is to be a feed-in tariff system to on-site solar power generators and
sustainable city where “human, nature and future co-exist”. supporting new solar PV technology.
The Republic of Korea’s policy approach towards climate
neutrality mirrors the EU’s Green Deal to achieve net-zero
emissions and respond to climate change. By 2025, the Korean
government will invest around USD 37 billion in Green New Deal
policies and a further USD 7 billion in carbon-cutting measures.
Seoul has put forward two intermediate goals ahead of the
2050 climate-neutrality goal: to achieve 40% emission reduction
by 2030 and 70% emission reduction by 2040 (compared to
2005 levels).
Since 2012, Seoul has adopted policies to reduce its dependency
on nuclear energy through two phases of the One Less Nuclear
Power Plant Project. In 2017, Solar City Seoul was launched
with the goal of adding 1 GW-peak of solar power capacity
by supplying PV panels to 1 million households by 2022. The
programme, which has a budget of around USD 1.46 billion
(funded mostly by public investment), aims to reduce CO 2
emissions by 544,000 tonnes annually and to add 4,500 new
jobs by 2022. The programme exceeded its intermediate
goal by installing a total of 357.1 MW of solar panels for
285,000 households by 2019.
One of the challenges facing the Solar City Seoul programme
is securing enough space at buildings and public facilities to
install solar panels. As part of the green energy initiative of the
Source: See endnote 137 in the Urban Policy Landscape chapter.CITY SNAPSHOTS
TSÉVIÉ
TOGO
Population density Total final energy
(per km2) Population size demand (million GJ)
16
596 103,000 0.4
Tsévié, a small town 35 kilometres north of Togo’s capital Lomé, had the Covenant of Mayors in Sub-Saharan Africa, with the goal of
a population of around 103,000 in 2017, growing at a rate of 2.8% developing a community-wide energy and climate action plan
annually. The town has minimal industrial activity, and its economy (the Plan d’Action en faveur d’un Accès à l’Energie Durable et du
is built largely on agricultural activities centred on crop production Climat (PAAEDC) de la commune de Tsévié). Under this flagship
and livestock farming, generating a low annual economic output of programme, the municipality aims to achieve its sustainability
USD 519 per capita. ambitions in four strategic areas: 1) sustainable biomass use,
Togo’s electricity infrastructure development plan, as outlined in 2) deployment of distributed rooftop solar PV, 3) increased
the national Electricity Sub-Sector Strategic Plan of 2010, is based adoption of electric motorcycles and 4) a modal shift to public
on a least-cost electricity supply and demand balance, taking into transport.
account security of supply and the environment. This led to the Under the PAAEDC framework and with funding from the
development of the Togo National Action Plan for Energy Efficiency European Union, Tsévié led a series of pilot projects in 2018-2020
(PANEE) and the Togo National Renewable Energy Action Plan to boost energy access and development and increase the share
(PANER), which respectively define the country’s objectives for of renewables in energy consumption. To improve access to clean
energy efficiency and renewable energy deployment by 2030. The cooking facilities, the municipality distributed 8,200 improved and
national objective for renewables is to increase the share of solar efficient cook stoves in the town and its environs as a means to
PV in total final energy consumption to 10% in 2030, including both limit the prolific household use of traditional biomass for cooking
on- and off-grid PV. and water heating (and thus improve indoor air quality and human
Due to Tsévié’s low levels of industrialisation and electricity access well-being). The city also sought to bridge the electricity access
(estimated at 24% in 2017), traditional biomass in the form of wood gap and to improve lighting solutions by installing 75 solar street
and charcoal is the single most important fuel in the peri-urban lamps for public lighting, distributing 95 solar home systems to
settlement. Traditional biomass accounts for 64% of total final the most vulnerable households and installing five community
energy consumption and is used to meet household cooking and solar kits in schools.
water heating needs. The residential sector is responsible for 73%
of total final energy consumption, followed by the transport sector
(25%) and the town’s few commercial facilities (2%). Because of
the low levels of electrification, the town’s street network is largely
To boost local energy access and
unilluminated, limiting potential economic activity in the evenings.
development, Tsévié implemented a
To boost local energy access and development, Tsévié implemented
a three-year municipal energy programme (2017-2020) under
three-year municipal
Source: See endnote 88 through 100 in the Feature: Renewable Energy in
Sub-Saharan African Cities chapter.
energy programme.CITY SNAPSHOTS
VANCOUVER
CANADA
Land area Population size Greenhouse gas emissions
(km2) (2017)
GHG
(CO2 equivalent) 17
115 675,000 2,440,000 tonnes
The City of Vancouver has gained global attention for its overall plan for 100% renewable energy by 2050, which calls for
sustainable urban development strategies in recent decades. all district energy systems to run on 100% renewables by 2050.
Many cities have attempted to transfer the “Vancouver model” The Strategy has helped develop additional neighbourhood
– comprising an integrated policy approach to sustainable energy systems supplying centralised heating, hot water
urban development – to their local contexts. Vancouver aims and cooling for multiple buildings throughout Vancouver.
to generate 55% of its total energy from renewables by 2030 Vancouver’s climate work also relies on a Climate and Equity
and 100% by 2050. Currently, the share is 31%, primarily from Working Group to ensure that new policies strive to support
hydropower and a small percentage of biomass, biofuels, wind the local economy and improve equityi.
and solar energy. As part of its Climate Emergency Response, the city also
Vancouver’s integrated policy approach links energy use and adapted a long-term climate target of being carbon neutral
improved infrastructure with sustainable urban development. before 2050, complementing its 100% renewable energy
The Renewable City Strategy, published in 2015, addresses target. In 2020, the city council approved a ban on fossil fuel
the energy question in the context of environmental, economic appliances for all residential buildings. The bylaw requires
and social sustainability. The urban development goal of the zero-emission space and water heating for all residential
City of Vancouver is to plan a liveable and sustainable city, buildings of three storeys or less as of January 2022.
and energy use is an integral part of it. To achieve this, the Also in Vancouver, the Sewage Heat Recovery Expansion
City has implemented complementary strategies such as Project will increase the capacity of the Neighbourhood
the Neighbourhood Energy Strategy (2012) and the Climate Energy Utilityii to provide buildings in the False Creek area
Emergency Response (2019). with low-carbon heat and hot water using waste thermal
The Neighbourhood Energy Strategy aims to accelerate energy captured from sewage. The project recycles waste heat
several measures, including: reducing the number of trips via and uses a mix of renewable and conventional natural gas to
single-occupancy vehicles and shifting to more sustainable reduce emissionsiii. Expansion plans approved in 2018 would
modes of travel; building public EV charging infrastructure; result in 2.1 million square metres of city building space being
and improving energy efficiency in buildings through green served, with an expected reduction of 14,000 tonnes of CO 2
building policies, bylaws, plans and design standards. The equivalent per year by 2021.
Neighbourhood Energy Strategy is aligned with the city’s
Source: See endnote 184 in the Urban Policy Landscape chapter.
i To support the city’s climate targets, in 2020 the Vancouver City Council approved an ambitious CAD 500 million (USD 383 million) climate action plan that aims
to reduce natural gas heating in existing buildings, discourage vehicle use and explore less-polluting ways to produce and transport construction materials.
ii The utility is self-funded, simultaneously providing a return on investment to city taxpayers and affordable rates to customers. The utility began operations in
2010 and as of 2019 had served 534,000 square metres of building space.
iii This mix eliminates more than 60% of the greenhouse gas pollution associated with heating buildings in the city.You can also read