Heritage Park Mall Redevelopment Scenarios - Midwest City, Oklahoma March 2017 - City of ...
←
→
Page content transcription
If your browser does not render page correctly, please read the page content below
Heritage Park Mall
Redevelopment
Scenarios
Midwest City, Oklahoma
March 2017
This page was intentionally left blank

ACKNOWLEDGMENTS
City Leadership
Matt Dukes - Mayor
Susan Eads- Ward 1
Pat Byrne - Ward 2
Rick Dawkins - Ward 3
Sean Reed - Ward 4
Christine Allen - Ward 5
Jeff Moore - Ward 6

City Staff
J. Guy Henson, City Manager
Tim Lyon, Assistant City Manager
Kay Hunt, Public and Media Relations Specialist
Robert Coleman, Economic Development Director
Kathy H. Spivey, GIS Coordinator
Billy Harless, Community Development Director
Julie Shannon, Comprehensive Planner
Kellie Gilles. Planning Manager

Consultant Team
Catalyst Commercial
Jason Claunch
Reid Cleeter
Sue Walker
Monica James

Special Thanks
The City and Catalyst Team acknowledges stakeholders that participated in this study including residents, property owners, developers, and real estate brokers.

                                                                                                                                                                  3
This page was intentionally left blank
7    INTRODUCTION

12   MARKET TRENDS

20   MARKET DEMAND

38   COMMUNITY INPUT

42   CASE STUDIES

48   POTENTIAL SCENARIOS

54   FISCAL ANALYSIS
1. Introduction
e s t C i t y Po p u l a
dw
Mi
ti o
n THE GREATER OKLAHOMA CITY
58,210 REGION
Population
Stillwater
(2016)
Hennessey Yale
PAYNE
24,093 Perkins
Cushing
Households
Crescent
KINGFISHER LOGAN
Langston
Guthrie
Kingfisher
st City Dayti me Po
we pu §
¨¦ 35
id la
M
Chandler
23,260 §
¨¦
ti o
Edmond Luther 44
LINCOLN
n
Employees CANADIAN
El Reno OKLAHOMA
Jones
§
¨¦ Spencer
(2016)
40 Yukon
§
¨¦
235
Choctaw
Harrah Prague
Oklahoma City
« Midwest City
McLoud
1,878 Employers Union City Mustang Will Rogers
World Airport §
Tinker AFB
¨¦
240
§
¨¦
40
Moore
Shawnee
Minco
Tuttle
CLEVELAND Bethel Acres
POTTAWATOMIE
Pink Tecumseh
Newcastle
Norman Lake
Thunderbird
st City Household §
¨¦
44 Noble
we
Goldsby
Inc
M
id o
Chickasha
§
¨¦
35 Slaughterville
m
e
GRADY
Lexington
$47,094 Ninnekah
Median Income MCCLAIN
$58,352 Rush Springs
Average Income LEGEND
10,000
Source: Greater OKC Chamber
Source: ESRI, STI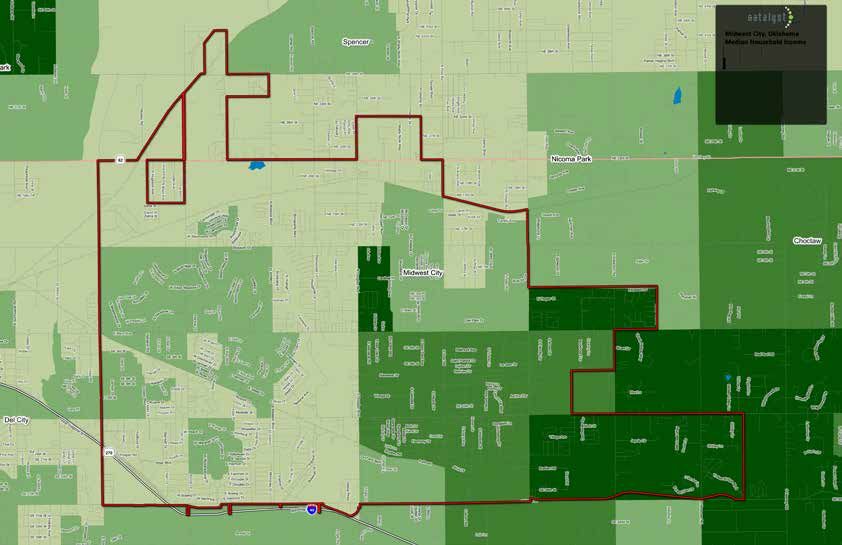
Introduction
PURPOSE                                                                      will contribute to the health and vitality of the adjacent neighborhoods by     which is attached to the mall, for $1.5 million in 2007 from Midland
                                                                             providing local services and shopping options and increased economic            Capital LLC. LifeChurch.tv renovated the space for a satellite church
The City engaged Catalyst Commercial to explore redevelopment                benefits to the owners, residents and City. Redevelopment could also            and regional distribution center for it’s other facilities in 2011. Also, in
scenarios for Heritage Park Mall. Heritage Park Mall sits mostly vacant      integrate connectivity and walking trails to improve social health of the       2011, Ahmad Baheini, an Oklahoma City based investor, purchased the
on the northwest corner of East Reno Avenue & Air Depot Boulevard in         residents and greater integration into the adjacent neighborhoods.              232,000-square-foot inline section of the mall for $1.3 million.
Midwest City. The existing uses at the mall include LifeChurch, Sears,
and Pelican’s Wharf restaurant.                                              In addition to economic consequences, the failed Heritage Park Mall             Most of the former shoppers of Heritage Park Mall have shifted to the
                                                                             also has social consequences. Heritage Park Mall once served as a               Westgate Outlet Mall, Downtown Oklahoma City, Classen Curve, Quail
As part of this process, Catalyst completed interviews with Sears,           community gathering space; now mostly vacant, the mall has a higher             Springs Mall, and Penn Square Mall. In addition, as the retail has shifted
LifeChurch.tv and Ahmad Baheini, the major landowners, to inform             propensity for criminal activity and creates a negative perception for the      locally, the national conditions are also affecting the viability of malls
this study. Catalyst also examined both local and regional economic          community.                                                                      nationally.
conditions and conducted a physical tour of the area to understand
local context and potential impacts of adjacent uses on redevelopment        BACKGROUND                                                                      ABOUT MIDWEST CITY
scenarios.                                                                   The 650,000 square foot Heritage Park Mall opened in 1978 and thrived           Midwest City is located along Interstate 40 and near “America’s
                                                                             during the 1970’s and 1980’s, as Midwest City boomed. Initial anchors           Crossroads” of Interstate 35, Interstate 40 and Interstate 44. Midwest
The current vacancy factor of Heritage Park Mall has created significant     at Heritage Park Mall included national anchors such as Sears, Dillards,        City was founded in 1941, due to Tinker Air Force Base. The increased
economic and social implications. Activating the mall will increase          Montgomery Wards, and Wilson’s. Other tenants in the mall included              population created demand for major retail developments, growth of
economic opportunites for consumers and improve the heath and vitality       Spencer’s Gifts, Hickory Farms, Olga’s Kitchen, Musicland Records,              high quality neighborhoods and many cultural attractions, such as the
of the area. Vacancy also has a significant impact on the fiscal health      Disc Jockey, and Jeans West.                                                    performing arts theatre. Midwest City is also less than 15 minutes away
of the City. Heritage Park Mall once generated more than $1 million                                                                                          from downtown Oklahoma City, Bricktown, the Oklahoma City Museum
in annual property taxes. According to Oklahoma County records, the          Heritage Park Mall once served a large regional population until Shawnee        of Art, Oklahoma City Zoo, Science Museum Oklahoma, Remington Park,
mall currently only generates approximately $70,000 in fiscal impacts        Mall was built in 1989 and Quail Springs Mall opened in 1980. In addition,      National Cowboy & Western Heritage Museum, Oklahoma State Capitol,
annually. There are also indirect economic losses due to the existing        the 1980’s included the Penn Square Mall upgrade and expansion. This            State Fair Park, and historic areas of Stockyards City and Frontier City.
vacancy, such as wage loss, missed visitor spending and loss of              additional competition and shifting population began to affect Heritage
operational revenue associated with the vacant commercial space.             Park Mall by the late 1990’s. Montgomery Ward closed in 1999 due to             Midwest City is located near the Oklahoma Welcome Center, Senior
                                                                             national bankruptcy and Service Merchandise also closed in 2000, due            Center, Water Park, championship golf and nature and a number of
Research has shown that commercial quality is one of the greatest            to bankruptcy. In 2007 Dillard’s closed, and by 2010, Sears and only 6          recreational trails. The City recently updated it’s Park Master Plan to
contributing factors impacting neighborhood quality. Heritage Park Mall      other stores remained. The mall finally went dark in February of 2010.          extend additional trails and add parks to the system.
serves as a strategic gateway to adjacent neighborhoods, and therefore
is likely affecting adjacent property values. Improving Heritage Park Mall   LifeChurch.tv bought the former 100,000 square foot Dillard’s building,         Throughout the year, Midwest City programs many special events, which

                              1978                                    1999                                2007                                     2010                                    2011

               Heritage Park Mall opens                 Montgomery Ward’s and Service Mer-               Dillards closes            Heritage Park Mall shops close          Ahmad Baheini purchases Heritage Park
               with Sears, Dillard, Montgomery Wards    chandise close                                                              Sears is only tenant that remains       Mall
               and Wilson’s.                                                                                                                                                LifeChurch.tv opens church in former
                                                                                                                                                                            Dillard’s

                                                                                                                                                                                             Heritage Park Mall Redevelopment       9
draws regional tourists, such as the Star Spangle Salute in July, Made
in Oklahoma Festival and the Holiday Lights Spectacular.

The Midwest City-Del City School District is one of the largest districts
in the State with over 14,600 students. Midwest is also home to Rose
State, one of the states’ premier two-year colleges, with over 8,000
students located on a 116-acre campus.

The Oklahoma City region also is home to the University of Oklahoma,
University of Central Oklahoma, Oklahoma City University, Oklahoma
Christian University, Oklahoma Baptist University, St. Gregory’s
University, Southern Nazarene University and Oklahoma State
University - OKC.

Midwest City enjoys the greatest concentration of technology
companies in the State of Oklahoma. Midwest City has a symbiotic
relation ship to Tinker Air Force Base, a 5,000-acre military base,
which forms Midwest Cities southern border. Tinker Air Force Base is
the largest single-site employer in the state and has the largest civilian
workforse of any US base. Midwest City is also home to Boeing, Pratt
& Whitney, and Rolls Royce.

10
2. Market Trends
National Mall Trends
NATIONAL MALL TRENDS                                                           has increased from 4% to 8.3% (Q1 2010 to Q4 2016).                                 would be through offering samples to customers as they browse the store.
                                                                                                                                                                   Some sporting goods stores have incorporated putting greens or even
Retail shoppers have seen a paradigm shift in purchasing preferences over      While there is a shift towards online purchases, the fact remains that              rock climbing walls to bring customers into their store to try the equipment.
the last few years, with the most pronounced results coming in the form of     traditional brick and mortar generates 91% of the total retail sales. The           Retailers like REI offer lectures and instructional classes that deepen
large-footprint retailers downsizing or closing altogether. In 2016, Macy’s    largest impact on malls is the emergence of mixed-use centers which are             relationships with the customer, and make them feel as though they are
announced plans to close 100+ stores. In February, J.C. Penny announced        a confluence of retail, residential, office and other formats that offer greater    not just buying materials, but joining an organization they believe in. Home
that they would close nearly 140 stores in 2017. Some of the most notable      choices in more engaging formats. Omnichannel retail is the experience              improvement stores offer do-it-yourself classes while appliance stores offer
closures in 2016 were; Sports Authority (450), Office Depot/Office Max         that combines online and in-store purchases, exchanges, and returns.                cooking classes to display their products.
(400), Macy’s (100), Sears (50), and Walmart (35).                             ICSC research indicates that 73% of consumers want to try on or touch
                                                                               merchandise befpre they purchase. the omnichannel approach produces                 This shift in retail typology means developers and property owners must see
                                                                               higher net sales, almost 20% higher than online retailers without a physical        traditional retail through a new lense. Certain types of retail goods are more
                                                                               presence.                                                                           likely to be purchased online, while others have drawn a clear preference
                                                                                                                                                                   to in-store purchase. Goods like furniture, sporting goods, and cosmetics
                                                                                                                                                                   tend to attract more in-store purchases because the consumer wants to
                                                                                                                                                                   touch and feel the product first. These cultural shifts and format trends will
                                                                                                                                                                   have long-tem impacts on retail and mall sustainability. According to Green
                                                                                                                                                                   Street Advisors, “department-store sales per square foot are down nearly
                                                                                                                                                                   20 percent since 2006 and 800 more department stores, or 20 percent
                                                                                                                                                                   of U.S. mall anchor space, would need to close in order to achieve the
                                                                                                                                                                   productivity level of a decade ago.”

There are two dominant factors affecting malls. The first is a shift towards
mixed-use lifestyle centers and secondly due to soft goods shifting towards
e-commerce. While physical stores are still relevant, according to research
conducted by the International Council of Shopping Centers (ICSC), now
one in twenty consumers make a purchase after browsing an online store.
E-commerce has also taken a bite out of the mall market share. According       However, the type of retail that exists in traditional brick and mortar buildings
to research conducted by ICSC, consumers purchase at online retail             has changed significantly. According to Cushman & Wakefield research, the
websites an average of 2.2 times per month. Companies like Amazon are          amount of inline retail in a mall has dropped from 60% to 45% over a ten
commanding large portions of the ecommerce retail. According to Yahoo          year period from 2007 to 2017. During that same time the category of
and Google Finance, Amazon’s 2016 market value of $356B was greater            entertainment, food & beverage has increased 200%, to now almost 20-
than Sears, JC Penney, Nordstrom, Kohl’s, Macy’s, Best Buy, Target, and        30% of total floor space.
Walmart together.
                                                                               Consumers are seeking a more experience-oriented shopping with an
According to the US Census Bureau, ecommerce as a percent of total retail      emphasis on experience. Examples of retailers creating an experience

  12
Regional Conditions
REGIONAL CONDITIONS RETAIL DEVELOPMENT
The Oklahoma City metro is home to several college and universities Retail has been the strongest industry sector in 2016. GBT Developmennt The Oklahoma City retail vacancy rate was 10.4% at end of 2016. Low
including Oklahoma City University, Oklahoma State University - OKC, and is completed phase one of The Market at Czech Hall in Oklahoma City. energy prices and low income growth have reduced retail sales in recent
University of Oklahoma. From 1970 to 2005, the Oklahoma City region Initial anchors include Academy, Ross, Marshalls, Petsmart, Ulta and Five years. The value-oriented retailers, such as TJ Maxx, Ross, and various
experienced a 1.1 percent annual growth rate, adding approximately Below with the first phase a total of 180,000 square feet and seven pad dollar stores have favored under these conditions and are likely going to
430,000 people during that timeframe. However, since 2005, the annual sites. The total project will be approximately 450,000 square feet. continue to be active as well.
growth increased to 1.6 percent annually. Today, the Oklahoma City metro
population contains over 1.38 million people. The Shoppes at Quail Springs was recently developed. This is a The Midwest City submarket vacancy rate is currently estimated at 17% at
91,000-square-foot, two-story multitenant retail and office center at May Q4 2016, down from 17.5% in Q2 2016. This is due to a number of factors,
In the next five years, the metro is expected to grow even faster at 1.66 Avenue and the Kilpatrick Turnpike developed by Mazaheri Properties. a large percentage of the existing retail space is older, and like Heritage
percent annually, reaching 1.5 million by 2021. Since 2010, the Oklahoma Shoppes at Quail Springs will be mixed-use with retail, office and restaurants. Park Mall, are prime for reinvestment. There are at least six retail centers
City MSA is the 10th fastest growing large metro in the country (more than in the Midwest City submarket that have at least 30% vacancy. However,
1 million population) and has grown more than twice as fast as the nation. Winco Foods is under construction in Moore and Midwest City and will Winco Foods and the Sooner Rose project and several other projects in the
Given current growth rates, the Oklahoma City metro will exceed 2 million start construction soon in two additional OKC locations. Trader Joes also pipeline will improve these numbers.
population before the year 2040. recently opened in Nichols Hills Plaza.
MULTI-FAMILY ACTIVITY
Oklahoma City’s population continues to grow at an average annual rate Chisholm Creek at Western and Kilpatrick Turnpike is home to many The multifamily velocity has slowed due to poor economic conditions, but
of 1.6 percent trending towards 1.4 million by 2018. Slowing income national retailers such as Cabela’s, Top Golf and Ifly. In 2016 the developers there are number of projects still in construction phase that will continue
growth combined with population gains are projected to leave per capita added 76,000 in Tract 30 to be anchored by Yokozuna and other niche to add to existing inventory. There has been a large increase in multi-
income unchanged in 2016 at $46,064. Per capita income is expected to restaurants. Additional restaurants include Republic Gastropub, Torchy’s family permits until 2014. A majority of this growth as occured near the
return to growth in 2017 and 2018 at rates of 2.2 percent and 1.6 percent Tacos, Fuzzy’s Tacos, Potbelly Sandwiches, and Sidecar Barley and Wine urban core. Currently multi-family occupancy is close to 90%. However,
respectively. Baseline expectations are for per capita income to reach Bar.. according to Price Edwards, the average apartment rental rate increased
$47,818 by the end of the forecast period. 3.46 percent, even in light of slower absorption. This shows the resiliency of
In addition to these projects, Lifetime Fitness will be taking the former market demand and the propensity for Oklahomian’s to live near the urban
Energy and livestock are major components of Oklahoma City’s growing Macy’s location at Quail Springs Mall. According to Price Edwards, Aldi, center.
economy. Recent fall in commodity prices for oil and gas have negatively Homegoods, Mattress Firm, Five Below are all active on the Oklahoma City
impacted the energy industry, which has affected regional economic region. New supply in Oklahoma City includes 300 additional units at the Cottages
conditions. Historically, the OKC market has risen and fallen with energy at Quail Springs Apartments, just north of Quail Springs Mall. The $30
and lifestock conditions. Within Midwest City, the Sooner Rose project located on 8.73 acres at million project will have one- and two-bedroom apartments ranging from
Southeast 15th & Sooner is anchored by Academy and Hobby Lobby with 789 to 1,267 square feet and rent for $799 to $1,299 per month, with
OFFICE TRENDS three pad sites fronting on 15th Street, the developer is working with the average costs per unit at $100,000. Price Edwards tracked over 3,400
The Oklahoma City office market experienced 521,000 SF of negative city on approving a TIF for an additional $60M phase, which would include new apartments completed in 2016 within the Oklahoma City, of which
absorption in 2016. According to Price Edwards, the vacancy rate increased a 10-screen theater and additional restaurant and regional entertainment/ 25% were downtown. A survey reflected less than 50% or only 1,454 were
from 12.3% to 15.5% year over year. The greatest subarea affected is the retail opportunities. rented.
Northwest submarket, which contributed to 57% of the overall negative
absorption. The average vacancy rate increased from 10% to 17.2%, and Within Midwest City, the Boulevard at Lakeside is a new 216 unit multifamily
class A vacancy increased from 7% to 25%. Average rental rates dropped “Midwest City has potential for more retail. project located just east of South Westminister Road on Southeast 15th
from $18.33 per SF to $18.30 per SF. Street. Both Price Edwards and ARA Newmark projected a steep drop in
Current examples include Midwest City Town delivery of new units this year. Price Edwards estimates only 2,200 units will
Some of the largest contributors to the vacancies include RKI Exploration be constructed.
who acquiredy WPX Energy which created almost 70,000 square feet
available in Oklahoma Tower. Williams Communications, merged with
Center and the new entertainment activity.” SINGLE FAMILY TRENDS
Access Midstream Partners, which was located in Central Park, created
100,000 square feet of space. Range Resources also cut 100 jobs and - Jim Parrack, S.V.P at Price Edwards & Co. According to BuilderOnline, new home closings Oklahoma City dropped in
closed it’s 80,000 square feet office in Enterprise Plaza. 2017, but the percentage decrease was less, suggesting the market may
Heritage Park Mall Redevelopment 13improving. New home closings decreased to 242. A total of 3,196 new is currenly $261,305. The Average mortgage size on a new homes is
homes were sold from August 2016 to August 2017, down from 3,270 for $225,653, as of August 2016.
previous annual number in the preceeding month.
There was no change in the composition of the new home market with
regard to the types of properties sold in August 2016. Single-family home
closings have accounted for 98.3% of new home closings while attached
unit closings have represented 1.7% of closings. The average unit size of a
new home is to 2,251 square feet.
Overall the housing market in the greater Oklahoma City market is
anticipated to see moderate growth. While the greatest percentage of
demand is for single-family, the areas with the greatest growth are areas
near downtown and around concentrations of retail. The Heritage Park
Mall site could be formatted to create greater housing choices around
commercial uses and support greater transition between the mall site and
the adjacent neighbhood. Housing could also be integrated to reduce the
amount of commercial required to redevelop the site, since the majority of
retail has shifted near Interstate 40.
New home closings made up 9.3% of overall housing closings. According
to BuilderOnline, this is a decrease of 11.7% compared to last year. Resales
and REO’s also increased since 2016.
The average price for new home construction in the Oklahoma City market
Source: XX
14Local Context
Heritage Park Mall is located on the northwest corner of Reno and Air
Depot. The Heritage Park Mall consists of approximately 39 acres. Currently
the mall has two anchores, Sears and LifeChurch. LifeChurch occupies
approximately 8.5 acres and Sears is approximately 8 acres.
RETAIL
The greatest concentration of retail is near the Interstate 40 corridor, with
most retail near the Air Depot and I-40 intersection. Town Center Plaza, a NE 36th St NE 36th St
mixed-use lifestyle center, contains the greatest amount of national tenants.
These include Dicks, Best Buy, Lowe’s, Kohl’s, PetsMart and Target. The
I-40 and Sooner Road intersection also is home to Wal-mart, Home Depot
and Academy Sports+Outdoors. Just West of Heritage Park Mall, the
former Target is being converted to a Winco Foods at Midwest and Reno. NE 23rd St NE 23rd St
While Midwest City has a significant amount of retail, the Heritage Park Mall
Midwest Blvd
N Sooner Rd
N Douglas Blvd
location is situated to support local retail needs and regional retail demand.
N Air Depot Blvd
MULTI-FAMILY
Just north of Heritage Park Mall, a planned multi-family development NE 10th St NE 10th St
named Legacy Corners is developing new apartments. Additional multi-
N Post Rd
family is also planned at 10th and Westminster and 9th and Post. While Midwest City
a majority of the multi-family demand is centered around the urban core
of Oklahoma City, the Heritage Park Mall site could accomodate a limited
S Anderson Rd
S Hiwassee Rd
about of residential, including high density apartments if integrated into a Gateway Shopping Center
Reno Avenue Reno Avenue
mixed-use format.
N Douglas Blvd
S Westminster Rd
N Post Rd
Midwest Blvd
MEDICAL
The greatest concentration of medical is St. Anthony’s. Integris Health
System also recently announced expansion into Midwest City. Midtown SE 15th St
Town Center Plaza
SE 15th St
Development at 15th and Douglas is also anchored by medical. Mercy, one
of the largest Oklahoma City healthcare operators, has a facility at 15th
N Air Depot Blvd
and Douglas for a regional laboratory for it’s patient base. The Heritage
N Sooner Rd
Park Mall site could support the growing medical needs and leverage the
existing medical base. SE 29th St SE 29th St
Heritage Park Mall Redevelopment 15TRAFFIC PATTERNS
Traffic counts for Midwest City were compiled through the
Association of Central Oklahoma Governments (ACOG) database
to understand traffic patterns at key locations. While Heritage Park 4,804
Mall counts are lighter than some areas in the region, there is a
great level of connectivity to the greater Oklahoma City region
via Reno and Air Depot. This is evidenced through growing
traffic counts in a west-to-east direction as traffic flows towards City Limits
Oklahoma City. Traffic Count
Interstate 40 is a major thoroughfare that connects the eastern 21,726
portion of the Oklahoma City metro area and beyond to Interstate
35. This connection is vital to the mobility and flow of traffic in the
5,895
region, as well as the nation. Traffic volumes just north of Interstate
40 along S Sooner Rd. register at 18,902 ADT, while just east of
Interstate 40 along SE 29th St. they register at 22,391 ADT.
NE 23rd Street (US Hwy. 62) runs through the northern portion 15,190 4,002
of Midwest City west into Oklahoma City. Traffic counts along NE Location CrossRoad Count
23rd Street are recorded at 21,726 ADT at the intersection of N S Douglas Blvd North of SE 29th St 27,284
Post Road. NE 10th Street volumes grow from 4,002 ADT at the SE 29th St West of S Air Depot Blvd 22,391
intersection of N Post Road on the eastern portion of the City, to 14,333
15,190 ADT at the intersection of North Air Depot Boulevard. NE 23rd St West of N Post Rd 21,726
19,247 E Reno Ave West of N Air Depot Blvd 19,247
11,855 5,497
Continuing the trend of growing traffic volumes in an east-to-west S Sooner Rd North of I-40 18,902
15,517
manner, traffic volumes along East Reno Avenue experienced
growth from 11,855 ADT at South Post Road to 19,247 ADT SE 15 St East of S Douglas Blvd 15,953
just west of Heritage Park Mall. Just north of Heritage Park Mall, S Midwest Blvd South of Reno Ave 15,517
volumes of 14,333 ADT can be observed along N Air Depot Blvd. NE 10th St East of N Air Depot Rd 15,190
at the intersection of N Meadow Lane. While Heritage Park Mall
does not have the highest traffic counts in the city, the location is 15,953 N Air Depot Blvd North of N Meadow Ln 14,333
strategic in terms of traffic counts relative to the traffic within the 18,902 E Reno Ave West of S Post Rd 11,855
region, and should be attractive to higher intensity commercial or S Post Rd South of SE 15th St 11,355
mixed-use options.
11,355 SE 29th St East of S Post Rd 11,219
27,284
N Sooner Rd South of NE 23rd St 5,895
22,391 S Westminster South of Reno Ave 5,497
Rd
NE 36th St East of RR 4,804
11,219
NE 10th St East of N Post Rd 4,002
16Demographics
POPULATION
Midwest City continues to experience population growth consistent with
the greater region. Midwest City is projected to grow by 7.5% from 2016 to
2021. This population growth is higher than other major cities in the region by Block Group
with the exception of Edmond, which is expected to grow by 10.7% over City Limits
the same time frame. 3,000 or Greater
2,000 to 3,000
1,000 to 2,000
Currently, Midwest City has approximately 24,093 households with a 500 to 1,000
Less than 500
population of 58,210. Based on these population projections the population
will surpass 62,500 by 2021. As the population continues to increase,
there will be more demands for additional housing choices and additional
commercial services. The Heritage Park Mall is well positioned to capture
future retail demand as well as a potential option for mixed-housing in a
mixed-use format.
Source: STI, ESRI
Heritage Park Mall Redevelopment 17INCOME
Midwest City has a median households income of $47,094 slightly lower
than Oklahoma City with a median income of $50,511. Approximately 21%
of households earn $50,000 to $75,000, 16.1% earn $35,000 to $50,000, by Block Group
and 12.8% earn between $75,000 and $100,000. City Limits
$75,000 or Greater
$60,000 to $75,000
$40,000 to $60,000
$20,000 to $40,000
Less than $20,000
Midwest City Income Level (2016)
Number Percent
Less than $15,000 736 12.1%
$15,000 to $24,999 644 12.1%
$25,000 to $34,999 1,127 12.2%
$35,000 to $49,999 1,381 16.1%
$50,000 to $74,999 2,303 21.3%
$75,000 to $99,999 3,179 12.8%
$100,000 to $149,999 1,773 10.1%
$150,000 to $199,999 1,634 2.1%
$200,000 or more 557 1.3%
Total Households 13,334 100.0%
Source: U.S. Census 2010; 2008-2012 American Community Survey 5-Year Estimates,
ESRI
18RACE AND ETHNICITY
Racial and ethnic composition in Oklahoma has changed only slightly in
the past. In Midwest City, 63% of 2016 residents are identified as White,
followed by 21.9% that identify as African-American, 7.3% as Two or More
Races, 2.9% American Indian, and 2.0% Asian. Of these categories, 6.8%
identify as of Hispanic origin.
AGE
Midwest City is home to a large number of young families. Nearly 60% of the
population is under 45, and 27% is between 25 and 44. Millennials (ages 15
to 34) make up the largest portion of the overall population, followed closely
by Generation X (ages 35 to 54)
Heritage Park Mall Redevelopment 19INTERSECTION CHARACTERISTICS
As part of this analysis, Catalyst explored purchasing power at various four-
corner intersections within Midwest City. Purchasing Power is comprised of
the population density coupled with the income associated within the study
by Purchasing Power
area. Retail spending is directly affected by both population and income.
Regional averages reflect that area households spend approximately 24%
of their total income on retail goods and services.
City Limits
% deviance from average
To evaluate the region, in context of retail spending potential, each
-10% or more
intersection’s purchasing power was calculated and then grouped in -10% to 0%
comparison to the average purchasing power for the intersections within Average to +10%
the City. The average intersection purchasing power for Midwest City is +10% or Greater
$2.5M. The greatest purchasing power was found at 15th and Air Depot
and Air Depot and Interstate 40. The lowest purchasing power was found
along Midwest Ciy’s northern corridor at NE 23rd due to the low density of
population.
The Reno and Air Depot intersection, where Heritage Park Mall is located,
scored just below average at $2.45M. A gap analysis also reveals that
Midwest City also has a large base of existing retail, which has shifted near
I-40 and Air Depot, therefore retail demand is limited in Midwest City overall.
As the population increases, the demand for retail will increase proportionally,
however the population is not anticipated to increase substantiallly at this
location since most of the residential is already established.
Going forward, to capture a greater market share merchandising will need
to compliment existing retail base and new development should align with
new consumer preferences of mixed-use and experience in order to be
competitive in a market with limited retail demand.
203. Market Demand
Demand
                                                                                                                                          Midwest City 20min PTA Retail Demand Chart
RETAIL DEMAND                                                                             Category                                                               Student       Workforce   Commuter    Residential    2016 Total
There are over 247,000 workers within a 20-minute drive of Heritage Park Mall.                                                                                   Demand        Demand      Demand       Demand         Demand
The existing workforce population may be leveraged to support existing and new
retailers located in and near the mall. A capture of 1% of existing retail expenditures   Auto Parts, Accessories & Tire Stores                             1,108                          282        49,452         50,842
may generate $16.8 million in retail expenditures for the subject site, which will        Furniture Stores                                                                                            79,906         79,906
support 55,691 square feet.
                                                                                          Home Furnishings Stores                                                                                     36,150         36,150
Currently, there are 112,000 vehicles per day that pass by the subject site.              Electronics & Appliance Stores                                                                              190,188        190,188
Commuters spend and average of $131 per week on retail goods and services.                Bldg Material & Supplies Dealers                                                                            191,322        191,322
A capture of 0.25% of the existing traffic flow would create $2.3 million retail
expenditures excluding gas, and support an additional 6,996 square feet of retail.        Lawn & Garden Equip & Supply Stores                                                                         28,466         28,466
                                                                                          Grocery Stores                                                    1,361          48,832          1,010      384,609        436,024
Rose State College is located in Midwest City 2.5 miles from the mall. There are
                                                                                          Specialty Food Stores                                                                                       89,816         89,816
approximately 6,612 students enrolled as of the 2015-16 academic year. The existing
student population and spending patterns create a potential for $24 million in off-       Beer, Wine & Liquor Stores                                                                                  51,298         51,298
campus expenditures. The majority of this spending is on groceries, restaurants, and      Health & Personal Care Stores                                     902            94,231                     284,948        380,595
drinking places. A destination that creates a vibrant walkable retail experience may
capture 10% of existing student expenditures. The $2.4 million in retail expenditures     Gasoline Stations                                                                5,000           3,527      6,385          16,418
would support an additional 6,600 square feet of retail and restaurants.                  Clothing Stores                                                   386            17,572          388        121,697        140,236
                                                                                          Shoe Stores                                                       708            24,162          711        40,912         67,062
The primary trade area for Heritage Park Mall is a 20-minute drive time. The primary
trade area is the geographic area where 65% of customers originate. The PTA contains      Specialty Retail (i.e. Jewelry, Luggage & Leather Goods Stores)   337            18,409                     31,964         50,981
over 98,400 houesholds with a population of 254,524. The combined PTA has an              Sporting Goods/Hobby/Musical Instr Stores                                        10,470          355        80,289         91,114
aggregate income of $5.6 billion with retail expenditures of $2.7 billion. Midwest City
is the eastern gateway to Oklahoma City. US-62 and I-40 are the major corridors           Book, Periodical & Music Stores                                                                  355        33,891         34,246
carrying residents living the eastern Oklahoma County into the Downtown corridor.         Department Stores Excluding Leased Depts.                                        31,410                     964,476        995,886
Midwest City may capture a large portion of the retail expenditures for much of these
                                                                                          Other General Merchandise Stores                                                 144,970         533        425,380        570,883
households. Existing retail expenditures in the PTA is $2.6 billion. Capture rates
based on geography and distance from existing residential developments indicates          Florists                                                                                         355        7,802          8,158
retail expenditures that support 3.8 million square feet of retail and restaurants.       Office Supplies, Stationery & Gift Stores                                        35,437          355        44,783         80,576
                                                                                          Used Merchandise Stores                                                                          711        17,049         17,760
                                                                                          Other Miscellaneous Store Retailers                                                              496        220,259        220,755
                                                                                          Full-Service Restaurants                                          852            46,049          598        204,397        252,322
                                                                                          Limited-Service Eating Places                                     772            62,015          847        229,639        293,876
                                                                                          Special Food Services                                                                                       6,489          6,489
                                                                                          Entertainment                                                     61             -                                         330
                                                                                          Lodging                                                                                                                    1,466
                                                                                          Drinking Places - Alcoholic Beverages                                                                       9,072          9,072
                                                                                          Total Demand (SF)                                                 6,487          538,557         10,523     3,830,637      4,392,237

  22
MULTI-FAMILY DEMAND
The Oklahoma City multifamily experienced decreasing rents in 2016 primarily due to increases in local supply. Effective rents declined by 0.8% to $0.84 per square foot year over year. However, the decline in rents will likely be short
lived as these new units are absorbed. Occupancy rates are up from 87.5% to 88% since July 2016. Occupancy continues to increase, up 0.5% to 88% occupied units over the past year. The existing vacancy rates have created a
competitive market increasing the properties offering concessions by 56.4%, with a total of 34% of existing properties offering concessions.
Within the Midwest City Submarket there are 42 properties with a total of 6,929 units. Effective rents are $0.78 per square foot. There are development within the submarket commanding much higher rents and occupancy rates than
average. Midwest City Depot built in 1985 is 97% occupied with effective rents of $0.96 per square foot. Chapel Ridge at Tinker built in 2005 is 90% occupied with effective rents of $0.89 per square foot.
Oklahoma County will gain 5.201 new households annually over the next five years. This household growth will create an annual demand of 1,679 new rental units. Turnover of existing owner-occupied households will generate demand
for an additional 5,211 units throughout Oklahoma County. Turnover of existing rental households will generate demand for 27,003 rental units. Approximately 20% of the demand generated will be for new rental units creating a potential
demand of 6,889 new multifamily units throughout the county. Based on recent trends, Midwest City will likely capture 1% of this demand.
Estimated Annual Demand Potential for Multifamily
Based on 2016 - 2021 County Demographic Trends
Monthly Rent $500 $750 $1,000 $1,500 $2,000
$750 $1,000 $1,500 $2,000 And Up
Qualifying Income Less Than $35,000 $50,000 $75,000 $100,000 Total
$35,000 $50,000 $75,000 $100,000 And Up
2016 Total Households1 311,617
2021 Total Households1 337,621
Avg. Annual Household Growth 5,201
New Household Growth
% Income Qualified 29% 13% 16% 11% 18% 87%
Renter Propensity 56% 43% 36% 23% 12% 37%
Qualified New Households 845 291 300 132 112 1,679
Sources: ESRI1
US Census American Community Survey2
US Census American Housing Survey3
US Census Building Permits Survey4
Heritage Park Mall Redevelopment 23Monthly Rent $500 $750 $1,000 $1,500 $2,000
$750 $1,000 $1,500 $2,000 And Up
Existing Owner Household
Total Households1 311,617 311,617 311,617 311,617 311,617 311,617
Owner Propensity2 41% 54% 62% 76% 88% 53%
Total Owner Households 37,051 21,876 30,912 26,051 49,360 165,250
Qualified Owners in Turnover 2594 1531 1855 1042 4442 11464
Estimated % Rent vs. Purchase3 81% 71% 34% 27% 25% 45%
Estimated Owners in Turnover that Rent 2,101 1,087 631 281 1,111 5,211
Existing Renter Households
Total Households1 311,617 311,617 311,617 311,617 311,617 311,617
Renter Propensity2 56% 43% 36% 23% 12% 32%
Total Renter Households 50,607 17,419 17,949 7,884 6,731 100,590
Annual Turnover Rate2 38% 34% 35% 32% 33% 36%
Qualified Renters in Turnover 19,231 5,923 6,282 2,523 2,221 36,179
Estimated % Rent vs. Purchase3 85% 78% 65% 44% 38% 75%
Estimated Renters in Turnover that Rent 16,346 4,620 4,083 1,110 844 27,003
Income Qualified Households
Total Potential Demand 19,291 5,998 5,014 1,523 2,067 33,893
Percent New Renters3 15% 23% 19% 27% 59% 20%
Total Potential Demand for New Units 2,945 1,378 930 413 1,223 6,889
City Capture Rate3,4 1% 1% 1% 1% 1% 1%
Total Potential New Multifamily Demand 29 14 9 4 12 69
24SINGLE FAMILY DEMAND
Oklahoma County is projected to gain 5,201 new households annually over the next five years. This household growth will create an annual demand of 2,755 new homes. Turnover of existing owner-occupied households will generate
demand of 5,339 home transactions throughout Oklahoma County. Turnover of existing rental households will generate demand for 7,147 new homes. The total projected demand for new homes is 9,902 countywide.
Across all income categories, our projection shows that Midwest City has the potential to capture over 220 new buyers annually. Of which, there is demand for more than 50 homes valued above $200,000. This can come in the form of
smaller patio homes, townhomes, condo’s and smaller custom homes, and integrated into a development that has a wide range of housing types to eliminate large developments with isolated housing types and values.
Estimated Annual Demand Potential For Purchase Residential
Based on 2016 - 2021 County Demographic Trends
Home Value less than $100,000 $150,000 $200,000 $250,000 $300,000 $400,000 $500,000
$100,000 $150,000 $200,000 $250,000 $300,000 $400,000 $500,000 and above
Qualifying Income less than $40,000 $65,000 $90,000 $110,000 $125,000 $150,000 $200,000 Total
$40,000 $65,000 $90,000 $110,000 $125,000 $150,000 $200,000
2016 Total Households1 311,617
2021 Total Households1 337,621
Avg. Annual Household Growth 5,201
New Household Growth
Total Annual New Households1 5,201 5,201 5,201 5,201 5,201 5,201 5,201 5,201 5,201
% Income Qualified 34% 19% 13% 7% 3% 3% 4% 4% 87%
# Income Qualified 1,768 988 676 364 156 156 208 208 4,525
Owner Propensity 43% 59% 69% 85% 81% 80% 94% 91% 61%
Qualified New Households 760 583 467 309 126 125 196 189 2,755
Sources: ESRI1
US Census American Community Survey2
US Census American Housing Survey3
US Census Building Permits Survey4
Heritage Park Mall Redevelopment 25Home Value less than $100,000 $150,000 $200,000 $250,000 $300,000 $400,000 $500,000
$100,000 $150,000 $200,000 $250,000 $300,000 $400,000 $500,000 and above
Existing Owner Household
Total Households1 311,617 311,617 311,617 311,617 311,617 311,617 311,617 311,617 311,617
% Income Qualified2 34% 19% 13% 7% 3% 3% 4% 4% 87%
Owner Propensity2 43% 59% 69% 85% 81% 80% 94% 91% 53%
Total Owner Households 45,558 34,932 27,952 18,541 7,572 7,479 11,717 11,343 165,095
Annual Turnover Rate2 7% 5% 6% 5% 14% 4% 17% 6% 7%
Qualified Owners in Turnover 3189 1747 1677 927 1060 299 1992 681 11572
Estimated % Rent vs. 18% 28% 42% 51% 65% 95% 78% 84% 46%
Purchase3
Estimated Owners in Turnover 574 489 704 473 689 284 1,554 572 5,339
that Rent
Existing Renter Households
Total Households1 311,617 311,617 311,617 311,617 311,617 311,617 311,617 311,617 311,617
% Income Qualified2 34% 19% 13% 7% 3% 3% 4% 4% 87%
Renter Propensity2 54% 39% 30% 15% 17% 20% 5% 9% 32%
Total Renter Households 57,213 23,091 12,153 3,272 1,589 1,870 623 1,122 100,933
Annual Turnover Rate2 38% 34% 33% 18% 43% 46% 24% 32% 36%
Qualified Renters in Turnover 21,741 7,851 4,011 589 683 860 150 359 36,243
Estimated % Rent vs. 9% 26% 40% 47% 57% 67% 58% 60% 20%
Purchase3
Estimated Renters in Turnover 1,957 2,041 1,604 277 390 576 87 215 7,147
that Rent
Income Qualified Households
Total Potential Demand 3,291 3,113 2,775 1,059 1,205 985 1,836 976 15,241
Percent New Renters3 83% 84% 75% 55% 43% 71% 15% 41% 65%
Total Potential Demand for New 2,717 2,624 2,071 586 516 701 282 405 9,902
Units
City Capture Rate3,4 2% 2% 2% 2% 2% 2% 2% 2% 2%
26Small Office Demand Analysis - Midwest City
SMALL OFFICE DEMAND
Currently, there are 1,878 businesses employing over 23,260 workers throughout Midwest City. Of the existing Firms Employees Employees/Firm
business, there are 706 firms that reside in small office spaces, and employee 5,902 of the existing workforce. Finance & Insurance 206 826 4
These businesses occupy approximately 590,200 square feet, 71%, of the existing office space.
Real Estate 132 982 7
Absorption of Class A & B office space has averaged 1,447 square feet per year over the last five years. Based Professional, Scientific & Tech Services 97 687 7
on these trends, there is likely to be positive absorption of 1,030 square feet of small office space annually. A well-
planned development at the subject site with access to retail and restaurants may capture 258 square feet of new Legal Services 28 138
office demand. Health Services 238 3,053 13
Additionally, the site may capture turnover from existing office space. Approximately 29,510 square feet, 5% of Arts & Entertainment 21 216 10
existing office inventory, turn over annually due to business relocations. Assuming the subject site captures 15% of Total 722 5,902 8
turnovers, the site may capture an additional 3,800 square feet of space annually.
Avg. SF per Employee 100
Total Small Office SF 590,200
Total Office SF 828,964
Small Office Portion of Office Space 71%
Avg. Submarket Class A + B SF Absorption 1,447
Potential Small Office Class A +B SF Absorption 1,030
Estimated Subject Site Capture Rt. 5%
Potential Capture SF from Absoprtion 52
Potential Turnover 5%
Potential Turnover SF 29,510
Avg. Vacancy Rate 15%
Total Occupancy from Turnover 25,069
Estimated City Capture Rt. 15%
Potential Capture SF from Turnover 3,760
Total Potential SF 3,812
Source: ESRI, Xceligent
Heritage Park Mall Redevelopment 27Market Overview – Midwest City, OK
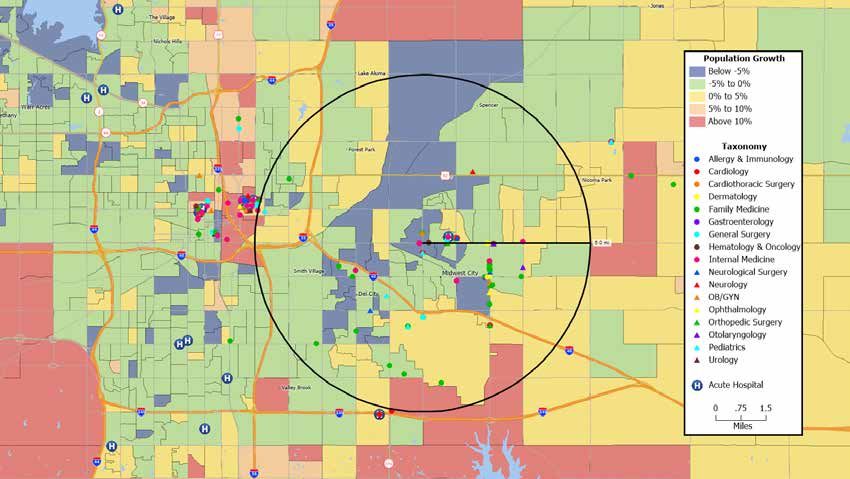
MEDICAL DEMAND
AllianceHealth Midwest, located in Midwest City on the eastern
edge of Oklahoma County, provides comprehensive medical care
from diagnosis to treatment for a full range of illnesses, injuries, and
disorders. With nearly 300 primary care specialty physicians on the
MARKET ACUTE CARE HOSPITALS
medical staff, services are provided through hospital divisions such The following map represents the Midwest City market area and displays current population by census block group as well as the location of nearby Acute
as the Oklahoma Regional Heart Pavilion, Midwest Mental Health, Care hospitals.
Midwest Rehab/Sports Medicine, Diagnostic Imaging Center and
Renaissance Women’s Center of Midwest City. The facility is a 255-bed
acute care facility with over 1,400 employees. There were over 13,600
admitted patients in 2001 and over 46,000 emergency room visitors.
5 miles
The information provided herein is deemed reliable and is subject to errors, omissions, change of terms and/or conditions. Page 6 Market Analysis
28Market Overview – Midwest City, OK Market Overview
MEDICAL DEMAND MARKET SHARE ANALYSIS
MARKET ACUTE CARE HOSPITALS
To understand the characteristics of the local medical service
area, a census of acute care facilities were located, in and around MARKET ACUTE CARE HOSPITALS – market
MARKET SHARE ANALYSIS
AllianceHealth Midwest and Saint Anthony Hospital currently service
over 50% of the share for the Midwest City primary service
Midwest City. For the purpose of this analysis, a five-mile service area.
area was establised as the primary service area for Midwest City. The following table represents the Medicare patients that are being captured from within the zip codes of the Midw
hospitals. The divide in market share provides a potential opportunity for health systems to expand their footprint in
Below is a description of the acute care hospitals located in and around the Midwest City market area.
Distance Patient
Hospital Name Health System (Miles) Beds Address City State ZIP Gross Revenue Discharges Days
AllianceHealth Midwest Community Health Systems 0.8 237 2825 Parklawn Drive Midwest City OK 73110 $1,172,347,147.00 8,977 39,838
Hospitals Market Cases Market Share
Oklahoma Heart Hospital South 5.2 46 5200 East I-240 Service Road Oklahoma City OK 73135 $499,646,509.00 4,442 17,319 AllianceHealth Midwest 2,359 29.64%
Oklahoma University Medical Center HCA 5.2 705 700 North East 13th Street Oklahoma City OK 73104 $4,538,951,519.00 34,575 212,075 Saint Anthony Hospital 1,881 23.64%
Oklahoma City VA Medical Center Department of Veterans Affairs 5.5 0 921 Northeast 13th Street Oklahoma City OK 73104 $0.00 0 0
Oklahoma University Medical Center 1,120 14.07%
Saint Anthony Hospital SSM Health Care 6.7 545 1000 North Lee Avenue Oklahoma City OK 73102 $1,630,745,338.00 17,642 103,050
Bone & Joint Hospital at St. Anothony SSM Health Care 6.7 33 1111 North Dewey Avenue Oklahoma City OK 73103 $90,201,994.00 1,461 3,743 INTEGRIS Southwest Medical Center 727 9.14%
Surgical Hospital Of Oklahoma 7 12 100 Southeast 59th Street Oklahoma City OK 73129 $70,731,697.00 160 345 Oklahoma Heart Hospital South 606 7.61%
INTEGRIS Southwest Medical Center INTEGRIS Health 7.6 336 4401 South Western Avenue Oklahoma City OK 73109 $1,095,232,839.00 9,852 50,411
INTEGRIS Baptist Medical Center 570 7.16%
One Core Health Orthopedic Hospital 7.8 8 1044 Southwest 44th Street Oklahoma City OK 73109 $68,343,165.00 225 557
Southwest Orthopaedic and Reconstructive Specialists 8.5 14 8100 South Walker Avenue Oklahoma City OK 73139 $204,174,500.00 750 1,760 Mercy Hospital Oklahoma City 206 2.59%
INTEGRIS Baptist Medical Center INTEGRIS Health 10.5 542 3300 Northwest Expressway Oklahoma City OK 73112 $2,804,403,069.00 21,395 123,404 Norman Regional Hospital 107 1.34%
AllianceHealth Deaconess Community Health Systems 10.9 231 5501 North Portland Avenue Oklahoma City OK 73112 $655,640,482.00 5,136 24,192 AllianceHealth Deaconess 100 1.26%
Community Hospital of Oklahoma 11 49 3100 Southwest 89th Street Oklahoma City OK 73159 $410,798,317.00 1,778 5,400
Northwest Surgery Hospital 11.4 9 9204 North May Avenue Oklahoma City OK 73120 $75,964,391.00 388 773 Valir Rehabilitation Hospital 84 1.06%
McBride Clinic Orthopedic Hospital 74 0.93%
Curahealth - Oklahoma City 45 0.57%
Midwest City Specialty Hospital 35 0.44%
The Department of Veterans Affairs does not release operations data.
Oklahoma Heart Hospital North 31 0.39%
Select Specialty Hospital - Oklahoma City 13 0.16%
Page 7 Market Analysis Page 8
Heritage Park Mall Redevelopment 29Market Overview – Midwest City, OK
SERVICE AREA BENCHMARKS
As part of this analysis, service area benchmarks were established to
understand how regional growth trends will affect the future market
needs for the Midwest City primary service area. Over the next five
years, the population increase within the service area is anticipated to
SERVICE AREA BENCHMARKS
exceed 7.04%. Currently the population volume is 112,648 patients,
this is anticipated to increase to over 130,584. As the population
The Midwest City market area in a benchmark analysis shows the following characteristics in comparison to the U.S., state of Oklahoma, and
volume increases, the primary facilities will have to develop capacity for Oklahoma County. “Current” indicates 2016 and “Projected” indicates 2021.
the additional volume. This also creates demand for new facilities which
might be able to be integrated into Heritage Park Mall redevelopment
plans.
2016 2021
Page 9 Market Analysis
30Market Overview – Midwest City, OK
POPULATION CHARACTERISTICS
Over the next five years the greatest cohort increase will be seniors GENERAL POPULATION CHARACTERISTICS
(65+) at over 19.61% growth rate Seniors only represent 15.14% of the
population base today. Seniors have the greatest percentage of health The graphs below represent the age distribution of the patients in the Midwest City market area.
issues such as, obesity, hypertension, and personal care assistance.
Seniors have a greater need for long-term care services such as adult
day services, home health, assisting living, memory care and nursing
home communities.
The second highest increase is anticipated to occur within the 35-
44 year olds, at 14.93%. This group only represents 11.73% of the
population today.
2016 2021 2016 2021 2016 2021 2016 2021 2016 2021 2016 2021
Page 10 Market Analysis
Heritage Park Mall Redevelopment 31Market Overview – Midwest City, OK
INSURANCE COVERAGE
Insurance coverage is a major contributing factor to healthcare INSURANCE COVERAGE
utilization. The percentage of uninsured will affect the proposenity
for healthcare. There has been substantial research showing that The following graphs represent the percentage of the population with various insurance coverage types in comparison to the U.S., State of
people who cannot afford health care services, either private pay, Oklahoma, and Oklahoma County.
or social health insurance (such as Medicare), or public programs
such as Medicaid, or other means (enlisted military), may not
receive needed services. Over 80% of the primary service area
has insurance coverage, and 50% of this group has commmercial
insurance, which is attractive to specialty services and independent
providers.
Page 11 Market Analysis
32Physician Need Analysis – Midwest City, OK
MEDICAL DEMAND
As part of this analysis, a census of existing pysicians was conducted PHYSICIAN LAYOUT
by type to identify the existing supply of services against the projected
demand of patient volume. The following map displays the Midwest City market area, projected population growth (2016-2021) by census block group, and the location of market
physicians.
5 miles
The information provided herein is deemed reliable and is subject to errors, omissions, change of terms and/or conditions. Page 13 Market Analysis
Heritage Park Mall Redevelopment 33PHYSICIAN DEMAND Physician Need Analysis – Midwest City, OK
The dominant need within the Midwest City primary service
area is for internal medicine, ob/gyn, and pediatric services.
The adjacent chart reflects the current physician demand and
projected physician demand by specialty. PHYSICIAN NEED – PRIMARY CARE
The graph below shows the need for additional primary care physicians in the Midwest City market area. This need is based on the patient demand
for services and the capacity of each physician specialty.
Page 14 Market Analysis
34Physician Need Analysis – Midwest City, OK
MEDICAL DEMAND
PHYSICIAN NEED – SPECIALTY PHYSICIANS
The Physician Needs Analysis reflects the greatest patient demand for:
1. dematology The graph below shows the need for additional specialty physicians in the Midwest City market area. This need is based on the patient demand for
2. gastroeterology services and the capacity of each physician specialty.
3. nuerology
4. opthamology, and
5. urology.
Page 15 Market Analysis
Heritage Park Mall Redevelopment 35This page was intentionally left blank
4. Community Input
Community Input
OWNERSHIP INPUT
Catalyst met with Sears representatives on Septermber 26, 2016 at Sears Holdings Corporation offices in Hoffman Estates, Il. This meeting included
Sue Walker of Catalyst Commercial, Jason Claunch, President of Catalyst Commercial and Sherry Devoe, real estate strategist for Sears. Sears did
not indicate any short-term plans for the location in Midwest City. They outlined that a typical process, if we had any interest, would be to submit
any preferred terms in writing, they would review with the Sears real estate department and would reply if they had any interest. They indicated that
the Midwest City Sears was profitable and was owned by Sears Holdings Corporate and not the REIT that purchased a number of non-performing
locations.

Catalyst met with LifeChurch on October 27, 2016. The church indicated that they have close to $10m in the upgraded facility, including land costs.
The church currently uses the facility for church services and distribution/warehouse to support the other church locations. The church would consider
exploring various scenarios if it supported the community needs, but did not have any plans to close or relocate. They would consider making
additional investments in the site if it promoted the community.

Catalyst toured the mall with city staff and Ahmad Bahreini on October 27, 2016. Mr. Bahreini indicated he purchased the mall as an investment and
continues to market and maintain the mall. He has engaged a local development partner and engineer to explore potential redevelopment scenarios.
One option would be to create storefront/exterior entrances on the Reno side to lease to traditional in-line tenants to bring in revenue and activate the
mall as he sources anchors for the remainder of the space.

  38
COMMUNITY WORKSHOP
On February 6, 2017, Catalyst hosted a community-wide workshop to              14. We need a major anchor, such as Ikea, to replace the vacant tenants.
discuss community desires and needs for Heritage Park Mall. This event
was attended by over 75 local leaders, city staff, citizens and business       15. To access the mall currently, you have to drive. There needs to be
owners. In addition, representatives from LifeChurch, Sears and the mall       better connectivity from the adjacent neighborhood.
attended the workshop. The following are key topics that came from the
attendees:

1. The community desires unique, destination-oriented uses to replace the
vacant mall.

2. There is a need for additional open-space/parks in Midwest City and this
location could provide some sort of community gathering place.

3. The city needs places for young families. The mall could be developed
with families in mind such as a skating rink, entertainment center, small
theater.

4. The city needs additional specialty grocers, such as Trade Joes, like the
one at Nichols Hills.

5. The site could accomodate medical to serve the older population in
Midwest City.

6. The redevelopment plans should consider the potential rail connection
being planned south.

7. The mall could be redeveloped for senior housing, memory care or
assisted living.

8. The development strategy could include active living, such as an indoor
pool, recreating center, or fitness.

9. Food trucks would be a great use to serve the neighborhood and provide
different food options for area residents and cater to after church guests.

10. The area needs a bookstore.

11. There needs to be more nightlife in Midwest City. A bar could provide
after dinner entertainment or a place to gather after movies.

12. The site would be a great use for additional retail such as Bed Bath and
Michaels which offer high quality goods and value oriented pricing.

13. We need more local restaurants.

                                                                                                                                                          Heritage Park Mall Redevelopment   39
This page was intentionally left blank
5. Case Studies
Red Bird Mall - Dallas, Texas
Site Details: 120 Acres

Cost: +/- $20M

Scope/Services: Redevelopment

CHALLENGE
DeBartolo Development expanded its activity in the Dallas area and opened Red Bird Mall in south Dallas
in 1975. This was another mall developed around the existing Sears store. Eventually a Dillard’s was
added and more recently a Macy’s.

In 1996 -97 the owners did a major remodel and made a name change to Southwest Center Mall. However
the name change was more confusing than helpful as most local people still called it Red Bird. In 1998
an $18M food court was added. Over the years, there was a fracture in ownership. The Dillard’s added
50K to their footprint.

OUTCOME
In 2015 a local Dallas investor named Peter Brodsky (HBC Investments) acquired the majority of the mall.
Construction plans to develop a Marriott Courtyard, tech incubator, new office, green space, and upscale
apartments are expected to take off in 2018. Ownership is negotiating with Macy’s to purchase their
building as well. By converting the mall to a mixed-use development where people also live and work,
Brodsky said, it can be successful.
Valley View Mall - Dallas, Texas
Site Details: 450 Acres

Cost: $4B

Scope/Services: Redevelopment

CHALLENGE
Valley View mall resides in North Dallas along I-635 & Preston Road, just east of the Galleria and Dallas
North Tollway.

Until 2012, Valley View housed anchors such as Sears, Dillard’s, Foley’s, Macy’s, and Sanger-Harris. There
is an AMC Theater that opened in 2004, and still operates within the mall. In 2012 the mall was purchased
by Beck Ventures out of bankruptcy.

OUTCOME
Beck Ventures is the master developer of what will be called Dallas Midtown Redevelopment. They
have spent the past several years designing and planning a $4 billion development with a 450 acre
redevelopment zone.

Plan highlights include:
•       Hike and bike trails connecting to White Rock Lake
•       Outdoor shopping
•       Restaurants & entertainment
•       AMC Theater 10 screen
•       Office towers
•       Upscale residential units
•       2 high-end hotels hotel
•       Interactive water feature

The City of Dallas is allocating approximately $36M in TIF funds for the project and construction is expected
to be completed in 2019.
You can also read