Core US Timberland Timberland Investment Group 2017
←
→
Page content transcription
If your browser does not render page correctly, please read the page content below
Core US Timberland
Timberland Investment Group

2017

Error! Reference source not found.
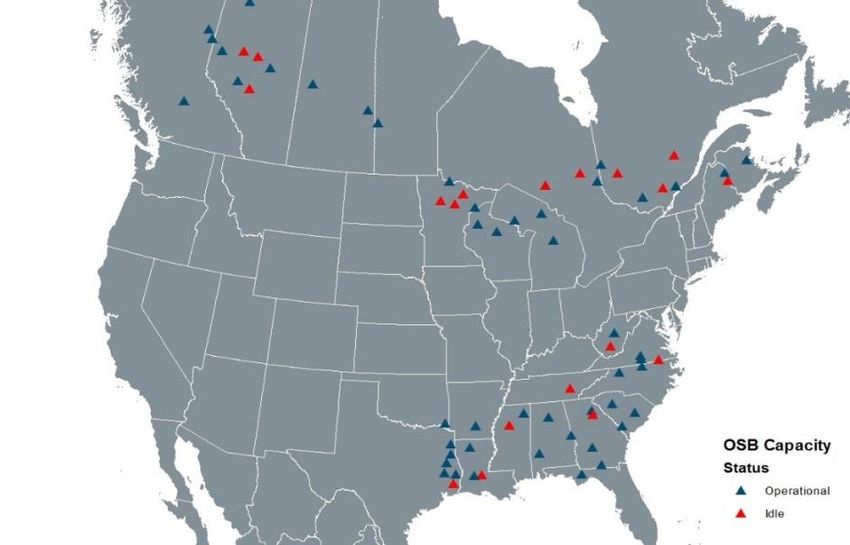
Table of Contents

Executive Summary ............................................................................................................................................................... 3
     US Forest Resource Base and Forest Products Industry........................................................................................................ 3
     Key Factors Affecting Institutional Timberland Markets in the US ....................................................................................... 4
     Investment Strategy .............................................................................................................................................................. 4
The US Timberland Resource ................................................................................................................................................. 5
The US Forest Products Industry ............................................................................................................................................ 6
     US Lumber ............................................................................................................................................................................. 7
     Wood Pulp ............................................................................................................................................................................. 9
     Wood Based Panels ............................................................................................................................................................. 10
     Other Segments: Pellet Plants in the US South Have Tightened Pulpwood Supply/Demand Dynamics ............................ 12
Institutional Timberland Investment in the US .................................................................................................................... 16
      Change in Ownership of Commercial Forests ..................................................................................................................... 16
      US Timberland Market Liquidity.......................................................................................................................................... 17
Key Factors Affecting Institutional Timberland Markets in the US ....................................................................................... 18
     Housing................................................................................................................................................................................ 18
     Pine Sawtimber Inventories ................................................................................................................................................ 19
     Pacific Rim Softwood Log and Lumber Markets .................................................................................................................. 20
     Timber Supply in Canada ..................................................................................................................................................... 21
     Canadian Lumber Producers Have Been Expanding Operations into the US South ........................................................... 21
     Growing Hardwood Lumber Markets .................................................................................................................................. 22
Investment Strategy ............................................................................................................................................................ 23
     Pre-Merchantable Pine Plantations in the US South ........................................................................................................... 23
     Commodity Hardwood Forests in Eastern Hardwood Regions ........................................................................................... 24
     Younger, Intensively Managed Douglas-fir and Whitewoods in the US Pacific Northwest ................................................ 25
     TIG’s Proposed Investment Allocation ................................................................................................................................ 26
     Risk / Return for Targeted Regions ..................................................................................................................................... 26
Conclusion ........................................................................................................................................................................... 27
Disclaimer ............................................................................................................................................................................ 28

BTG Pactual | Timberland Investment Group                                                                                                                                            2 of 29
Executive Summary
     BTG Pactual’s Timberland Investment Group (“TIG”) believes that long-term exposure to core United States
(US) commercial timberlands can be an important element of a diversified institutional timberland portfolio. An
effective US core timberland investment strategy will consider the structure of the US forest resource and the US
forest products industry, developments in the role of institutional investors in US commercial timberlands, and
key factors affecting US timberland and forest product markets.

US Forest Resource Base and Forest Products Industry

     The US is the world’s leading timber producer, and contains approximately 521 million acres of commercial
timberland, defined by the US Forest Service as timberland that is capable of yielding merchantable timber. In
aggregate, the US supports over 27 million metric tons (“MT”) of commercial growing stock inventory. Softwood
species comprise about 14 million MT (51.3%) and hardwood species comprise about 13 million MT (48.7%)1.
With the exception of tropical and short rotation hardwood species (such as teak and eucalyptus), US commercial
timberlands supply all major forest product end-markets including sawnwood, structural panels, pulp and paper
products, high quality furniture, flooring, and energy. With softwood lumber production capacity of 41.1 billion
board feet (“bbf”) and shipments of 31.4 bbf, the US is the largest softwood lumber producing country in the
world and one of the largest global producers of wood panels, softwood market pulp, and woodchips.

Figure 1: US Forest Resource Base

Source: TIG Analysis

1
 The US Forest Service reports inventory in metric tons. To convert: for softwood, each metric ton is equivalent to 0.153 thousand board feet; for hardwood,
each metric ton is equivalent to 0.125 thousand board feet.

BTG Pactual | Timberland Investment Group                                                                                                           3 of 29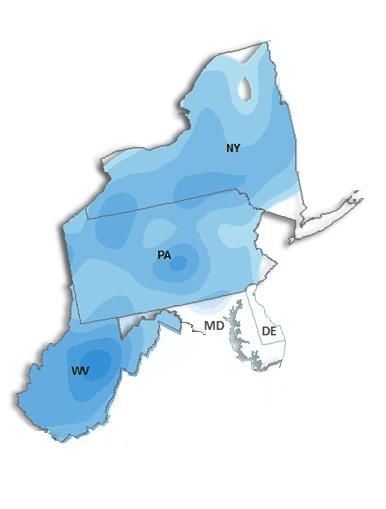
Key Factors Affecting Institutional Timberland Markets in the US
TIG believes that there are six key factors affecting institutional timberland markets in the US in the near-to-
medium term:
1) US housing. Post Great Recession, the US housing market has been on an upward, although somewhat
uneven, trend to its historical average, resulting in lower than historically average wood and timber
consumption.
2) US South pine inventories. The standing inventory of softwood sawtimber in the US South has
increased over the past 10 years as many timberland owners deferred harvests during the Great
Recession in anticipation of a more robust housing environment and higher sawlog pricing.
3) Expansion of Canadian lumber producers into the US South. Canadian sawmill operators have
expanded into the US South to benefit from the ongoing modest housing recovery and a wide spread
between lumber and log prices. A declining timber supply in Canada has also encouraged Canadian
lumber producers to move to the US South.
4) Declining Canadian timber supply. Given declining timber supply in Canada stemming from the
Mountain Pine Beetle in British Columbia and reduced annual allowable cut in Eastern Canada, demand
for US timber will likely increase.
5) Pacific Rim softwood log and lumber demand. Unlike other regions, the US Pacific Northwest has the
ability to export logs and lumber to Asia given its proximity to those markets which has resulted in higher
wood demand. There also will likely be increased wood demand from the Pacific Northwest due to
western Canada’s timber supply problems.
6) Growing hardwood lumber markets. While Europe had been the primary market of US precious
hardwood exports, China and Southeast Asia have emerged to dominate the hardwood lumber trade,
resulting in greater exports of commodity hardwoods.
Investment Strategy
TIG believes that an effective US timberland investment strategy will focus on a diversified portfolio of
properties, located in deep and diverse market baskets, and that seek to take advantage of the trends in timber
supply, demand and inventories described above. Specifically, TIG is focused on:
Pre-merchantable pine plantations in the US South.
Commodity hardwood forests in Eastern Hardwood Regions.
Younger, intensively managed Douglas-fir and whitewoods in the US Pacific Northwest.
BTG Pactual | Timberland Investment Group 4 of 29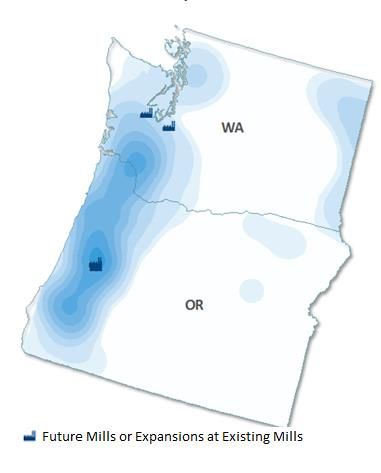
The US Timberland Resource
     Compared to many other countries, the US has a notable amount of forest cover. The US has a total land
area of nearly 2.3 billion acres of which 766 million acres (33.9%) are forested land. Within forested land, around
521 million acres (68.0%) are considered commercial timberland by the USDA Forest Service (non-reserved
forests capable of yielding merchantable timber). An additional 245 million acres of reserved and “other” forests
provide watershed protection, wildlife habitat, recreational demand, and other goods and services.

      The 521 million acres of US commercial timberland is held by a variety of private and public entities. The
majority (48%) is privately owned by non-corporate entities, primarily small, independent land owners, many of
whom may not actively manage their timberland for commercial production. Corporate entities including
institutional investors account for the second largest ownership category, followed by National Forests (19%) and
other public ownerships (state forests, wilderness areas, other federal and Native American-owned lands, etc.).
Public ownership tends to be concentrated in the western US, while private timberland ownership is highest in
the South. The South also has by far the largest area of private corporate ownerships which includes the holdings
of institutional investors.

        Figure 2: Ownership of Commercial Timberland in the United States 2012 (000s acres)

        Source: USDA Forest Service

     In aggregate, the US supports over 27 million metric tons (“MT”) of commercial growing stock inventory with
softwood species comprising about 14 million MT (51.3%) and hardwood species comprising about 13 million MT
(48.7%)2. The US supports some of the most diverse forest resources in the world, growing a large number of

2
 The USDA Forest Service reports data in cubic feet. The present analysis assumes a softwood conversion ratio of 38.8 cubic feet per MT and a hardwood
conversion ratio of 31.8 cubic feet per MT.

BTG Pactual | Timberland Investment Group                                                                                                     5 of 29
species to serve a wide spectrum of end-markets. In the Pacific Northwest, Douglas-fir is the dominant
commercial species, representing 54% of growing stock followed by western hemlock at 14%. In the US South,
loblolly and shortleaf pines dominate, followed by longleaf and slash pines. In the North region (including the
Northeast and Lake States), there is a mixture of softwoods and hardwoods, with softwoods comprising 19% of
the growing stock and hardwoods comprising 81%. Dominant softwood species include white and red pines while
dominant hardwood species include soft and hard maple and select white oaks. Nearly 40 different species
groups are distinguished by the US Forest Service inventory system.

     Commercial timber in the US is utilized in all major forest product end-markets from sawnwood and
structural panels, through softwood and hardwood pulp and paper products, to high quality furniture and flooring,
and utility post and pole markets. No other timberland investment geography offers the depth and diversity of
the US forest products market.

    Table 1: End Market Breakdown by Region

                  Region                      South          Pacific Northwest              Eastern Hardwood Regions                     Value
                                         Pine, Oak, Yellow                          Utility: White and
                                                                Douglas Fir,                               Precious: Cherry, Hard      Market Size
              Primary Species              Poplar, Mixed                             Red Oak, Yellow
                                                                Whitewoods                                      Maple, Ash              (US$ bn)
                                            Hardwood                                  Poplar, Aspen
                           Industrial
                           Timber               ●                     ●                     ●                                            US$ 25+
                           Structural
                           Lumber               ●                     ●                                                                 US$ 15-20

                           Wood Pulp            ●                     ●                                                                 US$ 5-10
                           OSB /
     Primary End    Plywood                     ●                     ●                     ●                                           US$ 5-10
    Market Exposure
                           Flooring             ●                                           ●                        ●                   US$ 5-8

                           Furniture                                                        ●                        ●                    US$ 5
                           Composite
                           Panels               ●                                           ●                                            US$ 3-5

                           Biomass              ●                                           ●                        ●                  US$ 1-1.5
                                            Wood Pulp,                               Logs, Flooring,
     Primary Export Europe               Biomass, Flooring                             Furniture
                                                                                                          Logs, Flooring, Furniture

    Market Exposure Asia                   Wood Pulp
                                                         Structural Lumber, Logs, Logs, Flooring,
                                                                                                          Logs, Flooring, Furniture
                                                                 Wood Pulp             Furniture
    Source: USDA Forest Service; American Home Furnishings Alliance; Flooring Cover Weekly; RISI; TIG Analysis; Market value represents annual sales

The US Forest Products Industry
    The world’s production of industrial roundwood in 2015 has been estimated by The Food and Agriculture
Organization (“FAO”) of the United Nations to be 1.844 billion MT in 20153. Of this, 51% or 939 million MT is
3
 The FAO reports data in cubic meters. The present analysis assumes a softwood conversion ratio of 1.1 cubic meters per MT and hardwood conversion ratio
of 0.9 cubic meters per MT.

BTG Pactual | Timberland Investment Group                                                                                                              6 of 29
conifer or softwood, and 49% or 905 million MT is non-conifer or hardwood. The FAO reports US industrial
roundwood production at 355.9 million MT or 19% of the world total.
More specifically, the FAO estimates US softwood industrial roundwood production at 241.5 million MT
(26% of the world total) and hardwood production at 114.4 million MT (13% of the world total). Based on FAO
data and our own calculations, we estimate 2015 industrial roundwood production by end-product sector in the
US as follows:
Table 2: US Roundwood Production (000s m3)
Source: FAO; TIG Analysis
US Lumber
With softwood lumber production capacity of 41.1 bbf and shipments of 31.4 bbf, the US is the largest
softwood lumber producing country in the world. US softwood lumber consumption is primarily driven by housing
starts (as shown in Figure 3) with each single family housing start utilizing around 15,000 board feet of lumber
and each multi-family start utilizing around 5,000 board feet. Since the Great Recession, there has been an
increase in the proportion of multi-family starts. Repair and remodeling also drives softwood lumber consumption.
Hardwood lumber is used in cabinets, furniture, flooring, moldings, and other millwork.
BTG Pactual | Timberland Investment Group 7 of 29Figure 3: US Housing Starts vs. Lumber Demand
Housing Starts (000s SAAR)
70 2,400
Lumber Demand (mmbf)
60 2,000
50 1,600
40 1,200
30 800
20 400
1989
1987
1991
1993
1995
1997
1999
2001
2003
2005
2007
2009
2011
2013
2015
Lumber Demand Housing Starts
Source: US Census Bureau; RISI
The Pacific Northwest’s forest economy is more highly concentrated in softwood lumber production than
is the US South. Given the higher operating cost structure in the Pacific Northwest and higher quality species such
as Douglas-fir and whitewoods (which are used mainly in construction), the industry is focused on production of
value-added products such as lumber. In the US South, logging costs are lower, private ownership dominates, and
there is greater proximity to major population centers and port access to Europe. As a result, the southern forest
products industry can afford to provide roundwood products to a wide range of end-markets.
Historically, the Pacific Northwest and US South have contributed roughly equally to total US lumber
production. However, since the Great Recession, lumber production in the US South has slightly overtaken
production in the Pacific Northwest (see Figure 4), partly as a result of competitive production costs and resource
availability.
BTG Pactual | Timberland Investment Group 8 of 29Figure 4: US Lumber Production by Region
2,000
1,500
MMBF
1,000
500
-
2014
2000
2001
2002
2003
2004
2005
2006
2007
2008
2009
2010
2011
2012
2013
2015
2016
US West US South US Other
Source: RISI
Wood Pulp
Wood pulp is an intermediate product in the paper production chain and can be generated from wood chips
(e.g., roundwood converted into chips) or from sawmill residuals, a byproduct of other primary processing. The
structurally strongest wood pulp is typically bleached or unbleached softwood kraft pulp (“BSK” or “UBSK”) which
is commonly used in packaging materials and paper, and produced from softwood species such as pine, spruce,
and fir, and is predominantly produced in the northern hemisphere. RISI estimates global BSK and UBSK
production in 2015 at 69.1 million MT, nearly evenly divided between bleached and unbleached grades. The US is
the world’s largest producing region for this grade of pulp with 2015 production estimated by RISI at over 31
million MT, or 46% of the world total.
BTG Pactual | Timberland Investment Group 9 of 29Table 3: Global Paper Grade Wood Pulp Production
Source: RISI
Market pulp refers to pulp that is not used by integrated pulp and paper companies in their own operations,
but is instead sold in the open market. Hardwood market pulp represents around 49% of global market pulp
consumption while softwood market pulp comprises around 39%. The remainder is comprised of mechanical pulp
(7%), unbleached kraft pulp (4%), and sulfite pulp (1%). Since 2000, global market pulp consumption has grown
from 43.3 million MT to over 62 million MT, a compounded annual growth rate (“CAGR”) of 2.5%, and market
pulp capacity has grown from 46.8 million MT to 69.3 million MT, a CAGR of 2.6%.
Wood Based Panels
Wood based panels consist of two primary grades: Structural (Plywood and Oriented Strand Board (“OSB”)),
and Non-Structural (particleboard, medium density fiberboard (“MDF”), and insulation board). Panels are
predominantly used in new home construction and repair and remodel with specific applications in structural
sheathing, subflooring, underlayment, webstock for I-beam floor joists, furniture stock, and other building
components. In 2015, US OSB capacity was around 16 billion square feet (“bsf”) while demand from US mills was
around 14 bsf. In plywood, capacity was around 11 bsf while demand from US mills was around 9 bsf.
BTG Pactual | Timberland Investment Group 10 of 29Figure 5: US Housing Starts vs. OSB Demand
16 2,400
Housing Starts (000s SAAR)
15
OSB Production (mmsf)
2,000
14
13 1,600
12
11 1,200
10
800
9
8 400
1997
2012
2000
2003
2006
2009
2015
OSB production (mmsf) Housing starts (000s SAAR)
Source: US Census Bureau; RISI
OSB has a raw materials cost advantage over traditional plywood as OSB can be manufactured from younger,
less expensive pulpwood logs, while providing comparable performance. For this reason, OSB has gained market
share from plywood in most home construction markets, with OSB production exceeding plywood production for
the first time in 2000. As seen in the above chart, OSB demand is closely associated to US housing starts. At
present, OSB represents around 64% of the structural panel market.
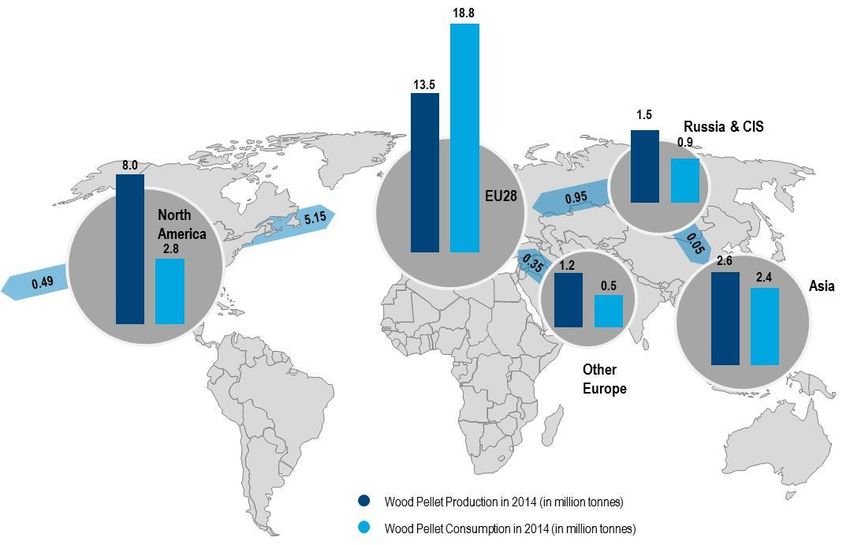
As Figure 6 illustrates, there are more than 50 OSB mills in North America, with around 35 mills in the US, of
which 28 are situated in the US South. Mills in the US South utilize pine pulpwood as a raw material, while
northern mills utilize both softwood species and low density hardwood such as Aspen. Therefore, TIG believes
that the concentration of OSB operations in the US South will provide additional markets for small diameter pine
throughout the region, and a diversifying end market for pine thinnings and top wood.
BTG Pactual | Timberland Investment Group 11 of 29Figure 6: North American OSB mills
Source: Forest Economic Advisors; TIG Analysis
Other Segments: Pellet Plants in the US South Have Tightened Pulpwood Supply/Demand Dynamics
Over the last decade, pulpwood demand in the US South has benefited from an expansion of fuelwood pellet
manufacturing. Fuelwood pellet demand is driven by European energy policy, which prescribes renewable energy
targets for European Union (“EU”) members to achieve by 2020. Specifically, these policies require a 20%
reduction in greenhouse gases, a 20% increase in renewable energy, and a 20% increase in energy efficiency. One
of the alternatives available to established utilities to help meet these targets is the replacement of coal with
fuelwood pellets in base-load power plants. The vast majority of fuelwood pellets currently manufactured in the
US South are being exported to converted coal burning power plants within the EU. Wood pellet usage is also
expected to increase in Japan and South Korea as those countries increasingly target renewable energy. In Japan,
the country is trying to lessen its reliance on nuclear energy and imported fossil fuels while South Korea is
targeting 10% of its power generation from renewable sources by 2024.
The global wood pellet market can be broken down into two separate markets: industrial and
residential/commercial. Industrial pellet demand (around 14 million MT) is driven by electricity generators and
utility-scale combined heat and power (“CHP”) plants whereas residential/commercial (around 15 million MT) is
used for home and office heating. Growth in the broader pellet market is largely driven by growth in industrial
pellet demand. Residential/commercial pellet demand is growing more modestly. For example, industrial pellet
demand increased 41.7% to 13.6 million MT in 2015 from 9.6 million MT in 2013 while residential/commercial
pellet demand increased 13.7% to 14.9 million MT in 2015 from 13.1 million MT in 2013 per Hawkins Wright.
BTG Pactual | Timberland Investment Group 12 of 29While pellet demand in the US tends to be dictated by home heating, the market in the EU tends to be both
residential and industrial, although the industrial market is the primary recipient of government subsidies.
Figure 7: Worldwide Industrial Pellet Producers (000 MT per year)
Enviva (U.S.)
Pinnacle Pellet (Canada)
Drax Biomass (U.S.)
Georgia Biomass (U.S.)
FRAM Renewable Fuels (U.S.)
Rentech (Canada)
German Pellets (U.S.)
Pacific Bioenergy (Canada)
Portucel (Navigator) (U.S.)
Tanac (Brazil)
Zilkha Biomass (U.S.)
Westervelt (U.S.)
0 600 1200 1800 2400 3000
Source: Enviva December 2016 Investor Presentation; (1) German Pellets is in bankruptcy and has successfully auctioned its
Louisiana pellet facility to Drax. However, the auction process for its Texas pellet plant has been postponed.
Figure 8: Regional Production (000 MT per year)
United States
Canada
Baltic States
Europe
Russia and East Europe
Rest of the World
0 2000 4000 6000 8000 10000
Current Capacity Under Contruction or Financed for Completion by 2017
Source: Enviva December 2016 Investor Presentation
BTG Pactual | Timberland Investment Group 13 of 29Wood pellets have become an increasingly traded global commodity as local sourcing has proven challenging
in many countries. While around 50% of the global trade takes place within and amongst EU members (the EU
produces around 50% of its own needs), the US, Canada, and Russia are significant exporters to the EU, which is
responsible for around 70-80% of total global demand.
Specifically, the US South has been able to capitalize on its favorable softwood fiber position, as softwood
fiber is the preferable furnish for wood pellets. Further, cheap, abundant residual wood supply from sawmill
operations, as well as an abundant, low grade pulpwood supply with relatively low transportation costs supports
export pellet production. In 2014, the US comprised around 60% of wood pellet exports to the EU. Since 2010,
export wood pellet demand to the EU from the US has increased at a 38.5% CAGR.
Figure 9: Main Suppliers of Wood Pellets to EU (000 MT per year)
7,000
Main suppliers of wood pellets to EU (000s
6,000
5,000
4,000
MT)
3,000
2,000
1,000
0
2010 2011 2012 2013 2014
US Canada Russia Ukraine Belarus Other
Source: USDA Foreign Agricultural Service Global Agricultural Information Network – EU Biofuels Annual 2015
BTG Pactual | Timberland Investment Group 14 of 29Figure 10: World Production / Consumption and Tradeflows of Pellets in 2014
Source: EPC Survey; Hawkins Wright; FAO; AEBIOM Statistical Report 2015
Continued growth of the fuelwood pellet industry is likely to depend on policy, rather than economics, as
the current availability of cheap fossil fuels works against the economic use of wood as an industrial scale energy
source. The global push to reduce the use of fossil fuels is expected to support existing fuelwood pellet capacity in
the US South and potentially lead to the installation of additional pellet production capacity. The combined
demand for residuals from the wood pulp and non-structural panel industries in the region is expected to
continue to support the price of residuals to the point where sourcing low grade roundwood for pellet production
remains a viable option. Therefore, TIG believes that demand for smaller diameter pulpwood from non-housing
related industry sectors will be strong in the near-to-medium term.
BTG Pactual | Timberland Investment Group 15 of 29Institutional Timberland Investment in the US
Change in Ownership of Commercial Forests
BTG Pactual’s Timberland Investment Group (“TIG”) traces its history back to 1981 when First National Bank
of Atlanta began investing in timberland. Beginning in the late 1990s, the interest in owning timberland gained
further traction as integrated paper/forest companies including Georgia-Pacific, Louisiana-Pacific, International
Paper, MeadWestvaco (now WestRock) and Temple-Inland (eventually purchased by Georgia-Pacific, West Fraser,
and International Paper) divested their timberland holdings from their paper and wood products converting
businesses. Some of the acres were divested to more streamlined companies such as timber REITs, but the
majority of holdings were sold in the mid-2000s to timberland investment management organizations (“TIMO”)
that source, acquire, and manage timberlands on behalf of institutional capital.
Figure 11: Change in top Timberland Owners / Managers
Top Timberland Owners/Managers (1981)
Crown Zellerbach, 5%
Bowater, 7% Total acres: 37.1 million
Great Northern
Nekoosa, 8% International Paper,
19%
Scott Paper, 8%
Weyerhaeuser, 16%
Boise Cascade, 8%
Champion Georgia-Pacific, 12%
International, 8% St. Regis Paper, 9%
Sierra Pacific
Industries, 6%
Top Timberland Owners/Managers (2015)
BTG Pactual TIG, 4%
Molpus Woodlands Total acres: 33.4 million
Group, 6%
Resource
Management Service, Weyerhaeuser, 36%
7%
Rayonier, 7%
FIA, 7%
Campbell Global, 7%
The Forestland
Group, 8% Hancock Timber, 12%
Source: TimberMart-South; Note: (1) Weyerhaeuser reflects both legacy Weyerhaeuser and Plum Creek, which Weyerhaeuser acquired in February 2016
BTG Pactual | Timberland Investment Group 16 of 29US Timberland Market Liquidity
The US timberland market is the most liquid in the world as evidenced by the number of transactions. Since
2000, a total of 45 million acres have transacted for over US$ 51 billion equating to an annual average of 2.65
million acres at an average price of around US$ 1,150/acre. Even during the Great Recession the US timberland
market was active with 3.4 million acres and 1.7 million acres transacting in 2008 and 2009, respectively, at
average prices of US$ 1,515/acre and US$ 1,256/acre, respectively.
As described above, institutional investment in timberland accelerated in the late 1990s, and peaked in the
mid-2000s. Many of these properties were acquired by closed-end fund vehicles with 10-12 year terms. TIG
believes that a large volume of properties that were acquired in 2005-2008 are likely to come into the market
between 2015 and 2020 as these funds are liquidated.
Figure 12: Timberland Acres Sold in the Past 10 Years and Hypothetical Forecast for next Six Years
7000 Sales volumes returning to normal levels after
bottoming
6000
5000
Acres sold (x1000)
4000
3000
2000
1000
0
1995
1996
1997
1998
1999
2000
2001
2002
2003
2004
2005
2006
2007
2008
2009
2010
2011
2012
2013
2014
2015
2016
2017
2018
2019
2020
2021
2022
North Cental Northeast South West
Low periods tend to precede periods of high volume sales
Source: RISI; analysis performed by BTG Pactual. There is no guarantee that the cyclicality presented above will occur again
BTG Pactual | Timberland Investment Group 17 of 29Key Factors Affecting Institutional Timberland Markets in the US
The following are several of the most important macro-trends that TIG believes will impact US
institutional timberland portfolios in the near- and mid-term.
Housing
Post Great Recession, the US housing market has been on an upward, although somewhat uneven, trend to
its historical average. This slower, inconsistent trajectory back to a more normalized level of housing starts has
resulted in lower wood products consumption than what has occurred in prior housing recoveries. In 2015, total
US housing starts were 1.108 million (single-family starts of 713,000) resulting in US lumber demand of 43.5 bbf
and US panel demand of 27.3 bsf. During more normalized housing environments (e.g., 1994-1997) when housing
starts were around 1.4-1.5 million, US lumber demand was around 49 bbf and US panels demand was around
31.5-32.0 bsf.
Part of the reason for this lower demand is that there is a greater degree of multi-family housing today than
in the past. In March 2017, multi-family starts accounted for around 32.4% of the total versus 23.0% since 1990.
On average, a multi-family unit utilizes around 30-40% of the wood used in a single-family home, given shared
walls and exteriors. The increase in the proportion of multi-family starts could be a sign that potential
homeowners, particularly those who are at the point of buying their first homes, prefer to rent rather than own.
Other factors may include a trend of home buyers choosing to live a more urban, “multi-family” lifestyle rather
than a “single family” suburban lifestyle. This trend may also indicate that home prices, which continue to
increase, and lending standards, which remain tight, may be keeping many first-time buyers out of the market.
Figure 13: Historical Single-family and Multi-family Housing Starts
100%
80%
60%
40%
20%
0%
1990
1992
1994
1996
1998
2000
2002
2004
2006
2008
2010
2012
2014
2016
Single Family as % of total Multi-family as % of total
Source: US Census Bureau
BTG Pactual | Timberland Investment Group 18 of 29There is also a trend of growing use of engineered wood products in home construction. Engineered wood is
manufactured by binding wood strands, particles, fibers, veneers or boards of wood together with adhesives (e.g.,
resins) to form larger composite materials. These products tend to have improved structural characteristics versus
traditional lumber and use wood fiber more efficiently. As a result, I-joists are replacing 2x10s and 2x12s as floor
joists. The key implication here is that the growing use of engineered products increases demand for smaller
diameter roundwood as opposed to larger diameter logs as a primary raw material.
Pine Sawtimber Inventories
Since the Great Recession, the standing inventory of softwood sawtimber has increased as many owners
deferred harvests in anticipation of higher lumber demand (and thus higher sawlog prices) once the economy
recovered. In particular, in the US South, inventory on the stump has grown by around 21 bbf since 2009 per RISI.
Another recent inventory estimate by the US Forest Service identifies a buildup of as much as 60 bbf between
2009 and 2015. This compares to an annual harvest of around 14 bbf per RISI. As housing continues on its slow
upward march, this inventory continues to build and has the potential to constrain increases in sawlog pricing,
even if housing begins to grow at a more rapid pace.
Figure 14: Southern Sawtimber Inventories
280
Southern Softwood Sawtimber
270
Inventory (bbf)
260
250
240
230
220
1996
1997
1998
1999
2000
2001
2002
2003
2004
2005
2006
2007
2008
2009
2010
2011
2012
2013
2014
2015
Source: RISI
The accumulation of softwood sawtimber inventory has been less pronounced in the Pacific Northwest given
log and lumber export markets which support regional demand for sawtimber despite the modestly growing US
housing market (see “Housing” above).
Overall, the impact of this inventory accumulation could be a delayed price response to improving sawlog
demand as housing improves. The “overhang” has grown so large that several years of starts at or in excess of 1.5
million units might be needed to begin to tighten the supply/demand dynamics of the US South. As a result, an
investment strategy that focuses on pre-merchantable timberland assets might perform better than a strategy
BTG Pactual | Timberland Investment Group 19 of 29based on the acquisition of properties heavily stocked with sawtimber volume, especially if a buyer is able to
purchase assets toward the lower bound value of the “holding premium” (difference between discounted cash
flow value and immediate liquidation value) of pre-merchantable timber. Simply put, the goal of this strategy
would be to purchase assets as cost-effectively as possible in order to capture the upside from organic growth.
Pacific Rim Softwood Log and Lumber Markets
Unlike the US South which has few export opportunities at present and higher phytosanitary constraints, the
Pacific Northwest has the ability to export logs and lumber to Asia given its proximity to those markets and lower
phytosanitary constraints. China generally uses wood for industrial applications like pallets and concrete forms,
while Japan has demand for high-quality logs (e.g., Douglas-fir for structural applications; western hemlock for its
construction industry). South Korea imports logs primarily for its plywood and sawmilling industries.
In the early 1990s, the Pacific Northwest was exporting around 2-3 bbf per year of softwood logs to Japan,
China, and South Korea per the USDA Forest Service. Conditions began changing in the mid / late 1990s due to: 1)
declining sales from federal and state lands set aside for the protection of Threatened and Endangered Species; 2)
lower Japanese demand for logs after the Asian economic crisis of the late 1990s lowered Japanese housing
demand and increased Japanese consumer price sensitivity; and 3) globalization of wood markets which resulted
in increased competitiveness from other regions, such as New Zealand, Russia, Scandinavia, and Chile.
Softwood log export activity started to increase again in the mid-2000s, particularly as China’s economy
went through a period of rapid urbanization facilitated by government policies. Log exports to China increased to
around 1 bbf in 2011 before peaking around 1.3 bbf in 2013. Since then, log exports to China have somewhat
softened as China’s economy cooled. In 2015, softwood log exports to China were around 813 million board feet,
down almost 35% year-over-year. In aggregate, Pacific Northwest softwood log exports declined around 21%
year-over-year in 2015.
Figure 15: Softwood Log Exports from the US
2,500
Softwood log exports from US
Northwest (mmbf, Scribner
2,000
1,500
scale)
1,000
500
0
1990
1995
2000
2005
2010
2015
South Korea China Japan
Source: USDA Forest Service
BTG Pactual | Timberland Investment Group 20 of 29Although we believe that log exports to China will continue to dominate the Pacific Rim trade, we also
recognize a shift in demand from logs to finished lumber in the region. This shift could provide a unique
opportunity for the US Pacific Northwest, as western Canada’s timber supply problems could prevent it from
remaining a significant supplier to this off-shore market.
Timber Supply in Canada
Canada has historically provided around 35-40% of all the lumber used in the US. This share is expected to
decline by 10-15% as a result of a reduction in Canadian timber supply due to mortality associated with the
Mountain Pine Beetle. According to the government of British Columbia, since the early 1990s, the Mountain Pine
Beetle has been attacking lodgepole pine in British Columbia and has killed about 50% of the commercial
lodgepole pine in the province, impacting an area of over 43 million acres. British Columbia has increased harvest
levels to try and salvage the remaining timber, much of which is then shipped to China to be used for industrial
applications. Currently the Mountain Pine Beetle has expanded beyond its historic range and moved into
northern British Columbia and eastward in the boreal forest of north-central Alberta. The pine beetle is also now
attacking jack pine, a prevalent species of the boreal forest.
Given the depleted Canadian timber resource and its inability to be used in structural framing, the Pacific
Northwest and US South will have to compensate for this lumber shortage and increase production as the US
housing market continues to improve. The ability of western Canada, a significant player currently, to export
softwood lumber to the Pacific Rim market will also be diminished, resulting in greater market opportunities for
the US Pacific Northwest.
Separately, in Eastern Canada, the government of Québec reduced the annual allowable cut by 20% in the
mid-2000s to address historic overharvesting. As the harvest volume has declined, a number of sawmills, pulp
mills, and paper mills have permanently closed.
Canadian Lumber Producers Have Been Expanding Operations into the US South
Over the last several years, a number of large Canadian lumber producers including West Fraser, Interfor,
and Canfor have acquired sawmill operations in the US South. These expansions afford these companies the
ability to benefit from the modest ongoing US housing recovery and a potential widening spread between lumber
and log prices given the timber inventory overhang in the US South. Further, given the proximity to end markets,
these companies should also benefit from lower freight costs and avoidance of potential US anti-dumping and
countervailing duties (on their US mills) associated with the expiration of the Softwood Lumber Agreement.
BTG Pactual | Timberland Investment Group 21 of 29Table 4: Recent Canadian Expansions into the US South
Capacity (million board
Acquisition Date Buyer Seller Sawmills
feet [“mmbf”])
2015 Interfor The Price Companies Monticello, AR 100
Tacoma, WA; Longview, WA; 750
2015 Interfor Simpson Lumber
Meldrim, GA; Georgetown, SC
2014 Interfor Tolleson Ilim Lumber Perry, GA; Preston, GA 450
2013 Interfor Keadle Lumber Enterprises Thomaston, GA 80
Baxley, GA; Swainsboro, GA; 360
2013 Interfor Rayonier's lumber business
Eatonton, GA
2014 West Fraser Bibler Brothers Russellville, AR 160
2014 West Fraser Travis Lumber Mansfield, AR 150
2015 Canfor Anthony Forest Products Eldorado, AR 150
2015 Canfor Southern Lumber Co Hermanville, MS 90
Balfour / Beadles Lumber 210
2015 Canfor Thomasville, GA; Moultrie, GA
Company
Mobile, AL; Fulton, AL; Jackson, 440
2013 Canfor Scotch & Gulf Lumber
AL
Source: TIG Analysis
Canadian investment in new US South sawmilling capacity could improve the speed and magnitude of a price
response for southern sawtimber once housing demand more notably improves. Historically, Canadian lumber
producers typically have used circular sawmill technology in Canada because it is faster with smaller diameter
wood that is the common resource in Canada. In all likelihood, these producers will continue to employ similar
technology at that mills they’ve acquired in the US South.
Growing Hardwood Lumber Markets
The United States is the world’s largest hardwood lumber exporter. During the 20th century, exports were
dominated by the export of precious hardwoods to European furniture producers, including such species as
cherry, ash, maple and walnut. Early in the 2000s China and southeast Asia emerged primarily as buyers to
dominate the hardwood lumber trade, and shifted demand toward more commodity hardwoods such as red and
white oak, and yellow poplar. Importantly, Asia’s emergence has translated into more pronounced demand for
hardwood lumber, which has been captured by US timberland owners. In fact, the US is the largest exporter of
temperate hardwood lumber in the world, and the largest supplier of primarily commodity hardwoods to the
Chinese market. Looking ahead, there is the potential for commodity hardwood lumber demand to remain strong
in light of continued growth of the Asian market, and continued pressure on tropical hardwood lumber suppliers
in Asia, Africa, and Latin America to provide sustainably managed lumber products.
BTG Pactual | Timberland Investment Group 22 of 29Investment Strategy
TIG favors a US investment strategy that seeks to take advantage of the aforementioned trends in timber
supply, demand, and inventories. Although our approach is geographically diversified such that assets will be
acquired in all major timberland regions of the US, we will emphasize certain sub-regions, species and age-classes
to take advantage of investment opportunities we see materializing over the next 5-10 years. Specifically, the
strategy will focus on: 1) pre-merchantable pine plantations in the US South, 2) commodity hardwood forests in
Eastern Hardwood Regions, and 3) young, intensively managed Douglas-fir and whitewood planation forests in
the Pacific Northwest. Each is discussed below.
Pre-Merchantable Pine Plantations in the US South
As mentioned previously, recent estimates of softwood sawtimber being “stored on the stump” in the US
South range from 21 bbf to as much as 60 bbf. An increase in housing starts from 1.2 million to 1.5 million per
year increases the use of structural lumber and panels by approximately 4.3 bbf or roughly 8.6 bbf of logs.
Therefore, it could take anywhere from 3-7 years to work off the excess sawtimber inventory to the point that
prices begin to respond to increasing demand, assuming no other conditions change, that US housing ultimately
normalizes at 1.5 million housing starts, and that all 8.6 bbf of logs come exclusively from Southern timberland
sources. In light of the current oversupply, a near-term rebound in pine sawlog stumpage prices in the US South
would seem unlikely.
In contrast, pine plantations were heavily thinned during the recession, and demand for smaller diameter
timber may be very strong due to demand from: 1) the pine-based pulp industry which remains globally
competitive and export oriented, 2) pellet manufacturers, 3) OSB manufacturing and new small-sawlog sawmill
operations which have recently been built in the region. As a result, timberland heavy to smaller diameter timber
stands may be better priced than tracts heavy to ready-to-cut sawtimber, and pricing of smaller diameter wood
may be relatively stronger over the next 5-10 years as a result of the current sawtimber supply/demand
imbalance.
BTG Pactual | Timberland Investment Group 23 of 29Figure 16: US South Heat Map and Future Sawmills or Expansions at Existing Mills
Source: UGA: CFB (Center For Forest Business); TIG Analysis
Based on this work, we are targeting an allocation of 45% of our US investment portfolio to pine plantations
in the US South, with an emphasis on pre-merchantable and early merchantable stands. We are also focusing on
areas within the South that offer excellent growth characteristics, deep markets, and expanding sawmill capacity.
Commodity Hardwood Forests in Eastern Hardwood Regions
The US is by far the largest hardwood lumber exporter in the world, with 2015 exports reported at around
1.5 bbf or 17% of the world total (per the FAO). The next largest hardwood lumber exporter is Thailand (11%),
followed by Malaysia, Russia, and Laos.
The emergence in the last decade of Asia as the primary destination for hardwood lumber exports (thereby
replacing Western Europe) has also changed the species mix of exports. While “precious hardwoods” such as
cherry, walnut, and ash have the highest value on a per m3 basis, more commodity hardwood species such as
white and red oak and yellow poplar now make up the majority of the temperate hardwood lumber trade. White
and red oak and yellow poplar accounted for nearly 60% of US hardwood lumber exports in 2016 (USDA FAS).
Hardwood lumber is primarily exported from the eastern US ports of Norfolk, New York, Baltimore,
Charleston and Savannah. Proximity to these ports, or rail links to these ports, increases export exposure and net
stumpage prices for exports. The largest concentration of commodity hardwood species is found in the Mid-
Atlantic states and southern Appalachians.
BTG Pactual | Timberland Investment Group 24 of 29Figure 17: Eastern Hardwood Regions
Heat Map
As a result, hardwood investments in Eastern Hardwood Regions
would seem likely to have the highest exposure to export markets, as
well as retain the desirable characteristics of hardwood timberland
investments which include multiple income streams (hunting lease
and small tract sale income), low property management costs, and low
timberland investment return correlations with softwood timber
markets in the US South and US Pacific Northwest.
We are targeting an allocation of 30% of our US investment
portfolio to establishing a position in Eastern Hardwood Regions of the
US. Other eastern hardwood opportunities will be considered, but the
intent is to position the portfolio to take advantage of the hardwood
lumber drivers that have been identified through our analysis.
Source: UGA: CFB (Center For Forest Business); TIG Analysis
Younger, Intensively Managed Douglas-fir and Whitewoods in the US
Pacific Northwest
Figure 18: Pacific Northwest Heat Map The US Pacific Northwest has the smallest area of privately held
timberland in the US due to large government holdings in the region. TIG
believes that there is less of a sawtimber inventory overhang in this
region despite a modestly improving US housing market as softwood log
and lumber exports to the Pacific Rim increased from approximately
680,000 m3 in 2007, to over 6 million m3 in 2014 per the FAO.
In particular, TIG expects demand for softwood lumber imports in
the Pacific Rim to continue to increase, though at a more moderate pace.
The US has been a minor player in this market (exports to China in 2014
were around 1.1 million m3 per the FAO) but could play a more significant
role as western Canada reduces it exports (Canada exported 7.5 million m3
of softwood lumber to China in 2014), and significant additional lumber
production capacity would seem unlikely from New Zealand, Chile or
Australia. The US Pacific Northwest will largely be competing with Russia
for incremental demand in the Pacific Rim softwood lumber market over
the next five years.
Source: UGA: CFB (Center For Forest Business); TIG
Analysis The “pine beetle” epidemic has had a devastating effect on the
softwood forests of western Canada. Although exact timber availability
projections vary, it is clear that there will be a significant reduction in the availability of softwood timber in this
region for several decades as the forests recover from the insect infestation. This will impact not only western
Canada’s ability to participate in Pacific Rim markets, but also its ability to service western US lumber.
BTG Pactual | Timberland Investment Group 25 of 29We are targeting an allocation of 25% of our US portfolio to US Pacific Northwest properties heavy to pre-
merchantable and younger timber to take advantage of a modest rebound in lumber demand from the US
housing market, the declining ability of western Canada to export softwood lumber into the western US market,
and a moderately growing softwood lumber market in the Pacific Rim.
TIG’s Proposed Investment Allocation
TIG’s proposed initial investment allocation for a portfolio is seen below. Given targeted nominal, gross
returns between 7.0% and 7.5% for each timber region, TIG believes that a blended target return is 7.1%. This
allocation not only provides geographic diversification, but also provides diversity in terms of roundwood
products (logs, lumber, composite panels, and wood pulp), and exposure to export markets for softwood lumber
(Pacific Northwest) and hardwood lumber (Eastern Hardwood Regions).
Figure 19: Proposed Investment Allocation
Source: TIG Analysis
Risk / Return for Targeted Regions
To determine an appropriate rate of return, we analyzed regional quarterly National Council of Real Estate
Investment Fiduciaries (“NCREIF”) returns and the covariance of those returns by region over the last decade. The
annual standard deviation of nominal, gross returns in the South was around 5.7%, in the Pacific Northwest was
around 12.9%, and in Eastern Hardwood Regions was around 4.3%. Based on regional returns and covariance of
returns, the annual standard deviation of a theoretical portfolio is around 5.3%.
BTG Pactual | Timberland Investment Group 26 of 29Figure 20: Risk / Return for Targeted Regions
15%
South
Annual Standard Deviation
Pacific
10% Northwest
Target
Portfolio Eastern
Hardwood
5% Regions
Target
Portfolio
0%
6% 7% 8% 9%
Annual Expected Return (Gross Nominal)
Source: TIG Analysis
Conclusion
TIG believes that exposure to core US commercial timberlands should be a necessary part of a diversified
institutional timberland portfolio. Given unique regional and end market dynamics in key timberland markets
throughout the US, we have designed a strategy that capitalizes upon these different drivers. Based on our
analysis, we are targeting: 1) pre-merchantable pine plantations in the US South, 2) commodity hardwood forests
in Eastern Hardwood Regions, and 3) young, intensively managed Douglas-fir and whitewood planation forests in
the Pacific Northwest.
BTG Pactual | Timberland Investment Group 27 of 29Disclaimer This document has been prepared by BTG Pactual Asset Management US, LLC and BTG Pactual Timberland Investment Group, LLC (collectively, “BTG Pactual”) for the exclusive use of the party to whom BTG Pactual delivers this material (together with its subsidiaries and affiliates, the “Company”) using information provided by the Company and other publicly available information. This material does not constitute a Research Report according to Regulation AC, FINRA Rule 2241 and 2242 and should not be considered as such. Although the information herein is believed to be reliable and has been obtained from sources believed to be reliable, as of the date on which this material was issued and obtained from public sources, neither BTG Pactual nor any of its affiliates makes any representation or warranty, expressed or implied, with respect to the fairness, correctness, accuracy, reasonableness or completeness of the information and opinions. Prices in this material are believed to be reliable as of the date on which this material was issued and are derived from one or more of the following: (i) sources as expressly specified alongside the relevant data; (ii) the quoted price on the main regulated market for the security in question; (iii) other public sources believed to be reliable; or (iv) BTG Pactual's proprietary data or data available to BTG Pactual. BTG Pactual has no obligation to update, modify or amend this material and communication or to otherwise notify a recipient in the event that any matter stated herein, or any opinion, projection, forecast or estimate set forth herein, changes or subsequently becomes inaccurate. All and any information, opinions and amount indicated are subject to change, without prior warning. Any estimates or projections as to events that may occur in the future (including projections of revenue, expense, net income and stock performance) are based upon the best judgment of BTG Pactual from the information provided by the Company and other publicly available information as of the date of this material. Certain information contained in this material constitutes forward-looking statements, which can be identified by the use of forward-looking terminology such as “may,” “will,” “should,” “expect,” “anticipate,” “target,” “project,” “estimate,” “intend,” “continue,” or “believe,” or the negatives thereof or other variations thereon or comparable terminology. The analysis contained herein, as projections, scenarios, investments, etc. are based on numerous assumptions. Different assumptions could result in materially different results. Additional information relating to the financial instruments, models, projections and scenarios discussed in this material are available upon request. There is no guarantee that any of these estimates or projections will be achieved. Actual results may vary from the projections and such variations may be material. The figures contained in performance charts refer to the past; past performance is not a reliable indicator of future results. BTG Pactual does not undertake that investors will obtain profits, nor accept any liability for any investments losses. Performance information and/or results, unless otherwise indicated, are un-audited and their appearance in this material reflects the estimated returns net of all expenses, including the management and performance fees. Past performance is not indicative of future results. Due to various risks and uncertainties, actual events or results or the actual performance of the investments described herein may differ materially from those reflected or contemplated in such forward-looking statements. This material reflects the economic conditions at the time it was created and there is no guarantee that any future transaction will be under the same economic levels specified here. BTG Pactual expressly disclaims any and all liability relating or resulting from the use of this material. BTG Pactual makes no warranty or representation, whether express or implied, and assumes no legal liability for the accuracy, completeness or usefulness of any information contained herein. BTG Pactual does not accept any responsibility or liability whatsoever caused by any action taken in reliance upon this material and/or its attachments. Neither BTG Pactual nor any of its affiliates, nor any of their respective directors, employees or agents, accepts any liability for any loss or damage arising out of the use of all or any part of this report. Any opinion and/or projection in this material is related to the authors opinions; and do not represent the BTG Pactual institutional opinion. This material has been prepared solely for informational purposes and is not to be construed as a solicitation, offer, invitation or inducement to buy or sell any securities or related financial instruments. Any such offer or solicitation may only be made by means of delivery of an approved offering memorandum and only in those jurisdictions where permitted by law. The Company should not construe the contents of this material as legal, tax, accounting or investment advice or a recommendation. Before making an investment decision, investors are advised to (i) obtain independent financial advice on their own particular circumstances; (ii) thoroughly and carefully review the offering memorandum with their financial, legal and tax advisers to determine whether an investment such as this is suitable for them. This material does not purport to be all-inclusive or to contain all of the information that the Company may require. This material should not be the only source of information in any investor’s decision-making process. In all cases, investors should conduct their own investigation and analysis of such information before taking or omitting to take any action in relation to securities or markets that are analyzed in this report. The material should not be regarded by recipients as a substitute for the exercise of their own judgment. Investors are advised to carefully analyze all information and its risks vis-à-vis their personal objectives and its risk profile (“Suitability”). Nothing in this material constitutes a representation that any investment strategy or recommendation contained herein is suitable or appropriate to a recipient’s individual circumstances or otherwise constitutes a personal recommendation. An investment in the products described is not suitable for all investors. The information contained herein does not take into account the particular investment objectives or financial circumstances of any specific person who may receive it. BTG Pactual assumes that by acceptance of this material and/or attachments that the recipient understands the risks involved – including the loss of some or all of any investment that the recipient or the entity that he/she represents. Investments involve risks and investors should exercise prudence in making their investment decisions. If a financial instrument is denominated in a currency other than an investor’s currency, a change in rates of exchange may adversely affect the value or price of or the income derived from any security or related instrument mentioned in this report, and the recipient of this report assumes any currency risk. The physical assets are subject to nature events, weather damage, fire or market changes that can impact the property and returns. BTG Pactual, its subsidiaries and/or employees may hold long or short positions, trade on their own behalf, coordinate or manage transactions or offerings involving issuers discussed herein or make any other relevant investment. BTG Pactual and its affiliates have in place arrangements to manage conflicts of interest that may arise between them and their respective clients and among their different clients. Business areas within BTG Pactual and among its affiliates operate independently of each other and restrict access by the particular individual(s) responsible for handling client affairs to certain areas of information where this is necessary in order to manage conflicts of interest or material interests. BTG Pactual and its affiliates are involved in a full range of financial and related services including banking, investment banking, private equity and the provision of investment services. As such, BTG Pactual or its BTG Pactual | Timberland Investment Group 28 of 29
You can also read