Integrated Bayesian Approaches Shed Light on the Dissemination Routes of the Eurasian Grapevine Germplasm
←
→
Page content transcription
If your browser does not render page correctly, please read the page content below
ORIGINAL RESEARCH
                                                                                                                                                   published: 05 August 2021
                                                                                                                                              doi: 10.3389/fpls.2021.692661

                                             Integrated Bayesian Approaches
                                             Shed Light on the Dissemination
                                             Routes of the Eurasian Grapevine
                           Edited by:
                                             Germplasm
                           Leila Riahi,
        University of Manouba, Tunisia       Francesco Mercati 1*† , Gabriella De Lorenzis 2† , Antonio Mauceri 3 , Marcello Zerbo 1 ,
                         Reviewed by:        Lucio Brancadoro 2 , Claudio D’Onofrio 4 , Caterina Morcia 5 , Maria Gabriella Barbagallo 6 ,
                        Chograni Hnia,       Cristina Bignami 7 , Massimo Gardiman 8 , Laura de Palma 9 , Paola Ruffa 10,11 ,
    Ecole Supérieure d’Agriculture du        Vittorino Novello 11 , Manna Crespan 8* and Francesco Sunseri 3*
                             Kef, Tunisia
               Mériam Ben Romdhane,
                                             1
                                               Istituto Bioscienze e Biorisorse, Consiglio Nazionale delle Ricerche, Palermo, Italy, 2 Dipartimento di Scienze Agrarie ed
       Institut Préparatoire aux Études      Ambientali, Università degli Studi di Milan, Milan, Italy, 3 Dipartimento Agraria, Università Mediterranea degli Studi di Reggio
   Scientifiques et Techniques, Tunisia      Calabria, Reggio Calabria, Italy, 4 Dipartimento di Scienze Agrarie, Alimentari e Agro-ambientali, Università degli Studi di Pisa,
                                             Pisa, Italy, 5 CREA - Centro di Ricerca per la Genomica e la Bioinformatica, Fiorenzuola d’Arda, Italy, 6 Dipartimento di Scienze
                  *Correspondence:
                                             Agrarie e Forestali, Università degli Studi di Palermo, Palermo, Italy, 7 Dipartimento di Scienze della Vita, Centro
                   Francesco Mercati
                                             Biogest-Siteia, Università degli Studi di Modena e Reggio Emilia, Reggio Emilia, Italy, 8 CREA - Centro di Ricerca per la
         francesco.mercati@ibbr.cnr.it
                                             Viticoltura ed Enologia, Conegliano, Italy, 9 Dipartimento di Scienze Agrarie, Alimenti, Risorse Naturali e Ingegneria, Università
                     Manna Crespan
                                             degli Studi di Foggia, Foggia, Italy, 10 Istituto per la Protezione Sostenibile delle Piante, Consiglio Nazionale delle Ricerche,
           manna.crespan@crea.gov.it
                                             Torino, Italy, 11 Dipartimento di Scienze Agrarie, Forestali e Alimentari, Università degli Studi di Torino, Grugliasco, Italy
                   Francesco Sunseri
            francesco.sunseri@unirc.it

     † These
                                             The domestication and spreading of grapevine as well as the gene flow history had been
               authors have contributed
                    equally to this work     described in many studies. We used a high-quality 7k SNP dataset of 1,038 Eurasian
                                             grape varieties with unique profiles to assess the population genetic diversity, structure,
                   Specialty section:
                                             and relatedness, and to infer the most likely migration events. Comparisons of putative
         This article was submitted to
     Plant Systematics and Evolution,        scenarios of gene flow throughout Europe from Caucasus helped to fit the more reliable
               a section of the journal      migration routes around the Mediterranean Basin. Approximate Bayesian computation
            Frontiers in Plant Science
                                             (ABC) approach made possible to provide a response to several questions so far
            Received: 08 April 2021
            Accepted: 07 July 2021
                                             remaining unsolved. Firstly, the assessment of genetic diversity and population structure
          Published: 05 August 2021          within a well-covered dataset of ancient Italian varieties suggested the different histories
                             Citation:       between the Northern and Southern Italian grapevines. Moreover, Italian genotypes were
 Mercati F, De Lorenzis G, Mauceri A,        shown to be distinguishable from all the other Eurasian populations for the first time. The
Zerbo M, Brancadoro L, D’Onofrio C,
Morcia C, Barbagallo MG, Bignami C,          entire Eurasian panel confirmed the east-to-west gene flow, highlighting the Greek role as
   Gardiman M, de Palma L, Ruffa P,          a “bridge” between the Western and Eastern Eurasia. Portuguese germplasm showed a
 Novello V, Crespan M and Sunseri F
           (2021) Integrated Bayesian
                                             greater proximity to French varieties than the Spanish ones, thus being the main route for
       Approaches Shed Light on the          gene flow from Iberian Peninsula to Central Europe. Our findings reconciled genetic and
Dissemination Routes of the Eurasian         archaeological data for one of the most cultivated and fascinating crops in the world.
              Grapevine Germplasm.
         Front. Plant Sci. 12:692661.        Keywords: Vitis vinifera L. subsp. sativa, SNP array, genetic structure, LD decay, ancestry coefficients, migration
      doi: 10.3389/fpls.2021.692661          events

Frontiers in Plant Science | www.frontiersin.org                                      1                                            August 2021 | Volume 12 | Article 692661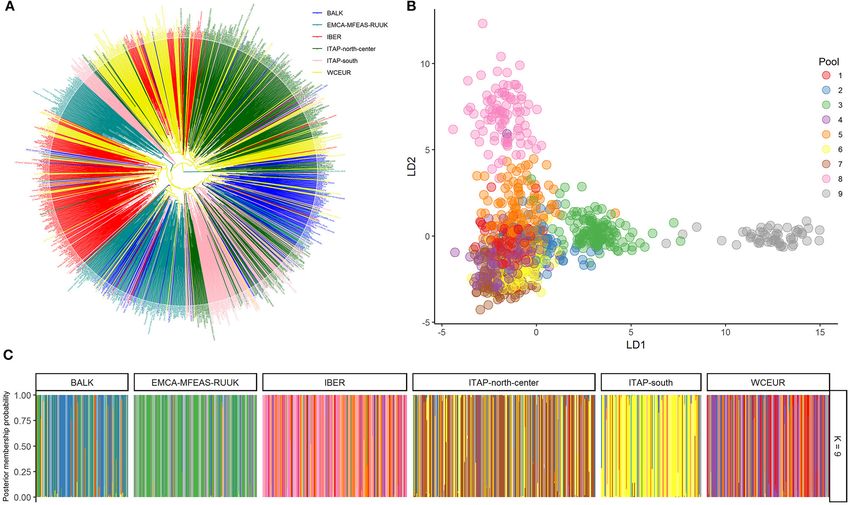
Mercati et al.                                                                                             Eurasian Grapevine Dissemination Routes

INTRODUCTION                                                               became as valuable as SSR in providing grapevine genetic
                                                                           diversity, structure information, pedigree analysis, gene
Grapevine (Vitis vinifera L. subsp. sativa) is one of the earliest         flow, and genome-wide association analysis (GWAS) with
domesticated and most cultivated crops worldwide, having a                 higher-throughput and cost-effectiveness than SSRs (Myles
great impact on the agri-food economy and prized for its fruits            et al., 2011; De Lorenzis et al., 2015, 2019; Mercati et al.,
and wines. Europe is the largest producer (primarily Italy,                2016; Marrano et al., 2017; Laucou et al., 2018; Sunseri et al.,
Spain, and France), followed by Asia and America. Nowadays,                2018).
worldwide grape production reaches nearly 78 M tons (http://                  Despite the large efforts to analyze the genetic variability is
faostat.fao.org/).                                                         available worldwide, a myriad of questions remains unsolved.
    Historical and archaeologica evidence dated grapevine                  First, the relationships within and among populations: What
domestication back to the Neolithic age (ca. 8,500–4,000 BC),              is the spreading history of Italian and the other Eurasian
when human populations began to collect and propagate                      populations? What was the role of Caucasian germplasm in
Vitis forms to improve fruit and wine production (McGovern                 shaping the grapevine populations cultivated worldwide? How
et al., 1986; Zohary and Hopf, 2000). Domestication took                   much did the ancient population affect the shape of the present
place in the region between the Caucasus and Mesopotamia                   ones? Does the grapevine genetic variability fit the human
(Georgia, Iran, Turkey), domesticating wild populations of                 migration routes around the Mediterranean Basin?
Vitis vinifera subsp. sylvestris, considered to be the ancestor of            To address the above questions, a comprehensive study on 384
the cultivated form, the subsp. sativa (Levadoux, 1956; Myles              varieties belonging to the Italian grapevine germplasm and 654
et al., 2011; De Andrés et al., 2012; McGovern et al., 2017).              additional varieties belonging to Eurasia were used to unravel the
From the oldest domestication sites, cultivated grapevines                 complexity of grapevine germplasm relationships.
disseminated westward into neighboring regions (Egypt                         The entire panel allowed us to improve the knowledge
and Lower Mesopotamia), reaching the Mediterranean                         on genetic diversity among grapevine populations and their
Basin, together with the development of human culture.                     dissemination routes by assessing the genetic structure and
Romans later spread grapevine cultivation in the temperate                 population relatedness, computing linkage disequilibrium (LD)
areas of Europe, following the main trade routes along                     decay, and ancestry coefficients, as well as, inferring migration
the major rivers Rhine, Rhone, and Danube. Islam then                      events through the evaluation of putative scenarios.
played an important role in spreading table grapes to
Northern Africa, Spain, and Middle East (This et al.,
2006).
                                                                           MATERIALS AND METHODS
    The Italian Peninsula seems to have had a key role in the
spreading of grapevine and viticulture practices from Greece to            Sample Collection and Genotype Calling
Central and Western Europe, due to its strategic position on the           Three-hundred-eighty and four grapevines (CREA—https://
Mediterranean Sea. In the eighth century BC, the establishment             www.crea.gov.it—and       AGER        consortium—https://www.
of Greek colonies in the Southern Italy was the main driver                progettoager.it) showing unique SNP profiles and covering most
of viticulture expansion and development in these areas. In                of the Italian germplasm were selected from 615 genotypes
the beginning, the settlers conceivably introduced vines from              firstly investigated for parentage analysis (D’Onofrio et al.,
their places of origin, nonetheless they plausibly also cultivated         2021). To provide an overview of grapevine dissemination
local populations crossed with Greek varieties (Buono and                  throughout Eurasia, 654 varieties from the available datasets
Vallariello, 2002; McGovern, 2003; Scienza, 2004; Marvelli et al.,         (De Lorenzis et al., 2015, 2019; Laucou et al., 2018) were
2013).                                                                     included (Supplementary Table 1). All the genotypes were
    In Europe, a long period of significant successes for                  characterized using the 18k SNP array (Laucou et al., 2018).
viticulture has been witnessed due to the human selection                  A stringent filtering [SNP NA rate > 1% and minor allele
of new and valuable cultivars, up to the current age. To                   frequency (MAF) < 5%; NA rate for each individual >5%; see
date, the Vitis International Variety Catalog (http://www.vivc.            D’Onofrio et al., 2021] was applied to ultimately obtain an SNP
de) and the Italian Register (http://catalogoviti.politicheagricole.       panel (Supplementary Table 1), then the duplicated profiles
it) list more than 13,000 and nearly 800 Eurasian grapevine                detected by calculating the pairwise percentage of mismatches
varieties, respectively.                                                   between (20% was used as cut-off) individuals were deleted.
    Genetic diversity and population structure of the cultivated           After filtering, 6,770 high-quality SNPs and 1,038 unique
varieties has been extensively assessed throughout highly                  genotypes were retained (Table 1 and Supplementary Table 1).
polymorphic microsatellite markers (simple sequence repeat,                Based on the previous information (Bacilieri et al., 2013; Laucou
SSR) (Cipriani et al., 2010; Laucou et al., 2011; Lacombe                  et al., 2018; De Lorenzis et al., 2019), 1,038 genotypes were
et al., 2012; Bacilieri et al., 2013; Emanuelli et al., 2013).             distinguished in six groups for geographic origin: (i) Balkans
Recently, by advanced next-generation sequencing, three                    (BALK); (ii) Eastern Mediterranean and Caucasus, Middle and
high-throughput Vitis genotyping chip arrays, including                    Far East, Russia and Ukraine (EMCA-MFEAS-RUUK); (iii)
9, 18, and 37k single nucleotide polymorphism (SNP) loci                   Iberian Peninsula (IBER); (iv) ITAP-Northern and Center Italy
were developed (Myles et al., 2010; Marrano et al., 2017;                  (north-center); (v) ITAP-Southern Italy (south); (vi) Western
Laucou et al., 2018). These new flexible and performing tools              and Central Europe (WCEUR).

Frontiers in Plant Science | www.frontiersin.org                       2                                   August 2021 | Volume 12 | Article 692661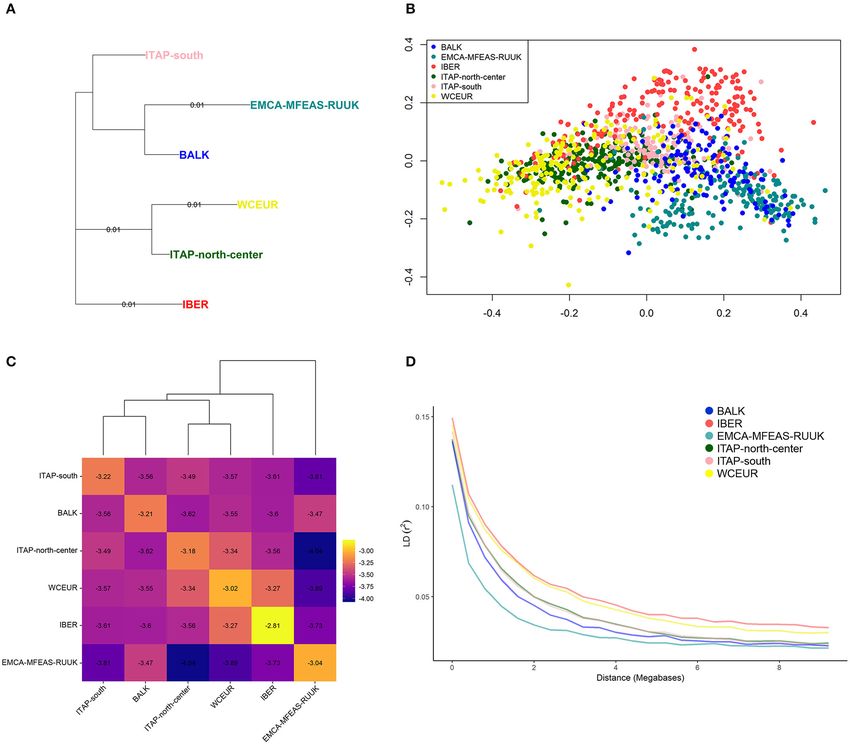
Mercati et al.                                                                                                           Eurasian Grapevine Dissemination Routes

TABLE 1 | Grapevine varieties collected across Europe, Caucasus, Middle, and Far East, genotyped by 18k SNP genotyping array and arranged based on their passport
data (for a detailed list, see Supplementary Table 1).

Group code                 Origin                                 Subgroup name                 Countries                                     Samples’ number

BALK                       Balkans                                Eastern Europe                ALB, BGR, HUN, RO                                    125
                                                                  Balkan Peninsula              BIH, CYP, GRC, HRV, MNE, SCG, SVN
EMCA-MFEAS-RUUK            Eastern Mediterranean and Caucasus     Caucasus and Turkey           AFG, ARM, AZE, GEO, TJK, TKM, TUR, UZB               167
                                                                  Near East                     ISR, LBN, SYR
                           Middle and Far East                    Middle East                   IRN
                           Russia and Ukraine                     Russia and Ukraine            MDA, RUS, UKR
IBER                       Iberian Peninsula                      Iberian Peninsula             ESP, PRT                                             196
ITAP-north-center          Italian Peninsula                      Italian Peninsula—North       ITA                                                  143
                                                                  Italian Peninsula—Center      ITA                                                  105
ITAP-south                                                        Italian Peninsula—South       ITA                                                  136
WCEUR                      Western and Central Europe             Western Europe                FRA                                                  166
                                                                  Central Europe                AUT, DEU, CHE, TCH

Total                                                                                                                                               1,038

Genetic Diversity and Population Structure                                            Identity by Descent Analysis and Linkage
Cluster and Principal Coordinates Analyses                                            Disequilibrium Decay
Phylogenetic analysis and principal coordinates analysis (PCoA)                       To identify the common ancestry of putative recent, identity
on both the Italian (384 genotypes) and whole (1,038) grapevine                       by descent (IBD) segments were detected in the whole dataset.
dataset were performed to estimate the overall relationship                           Relatedness analysis using IBD estimation was conducted
among the varieties. The distance-based dendrogram with Nei’s                         through R/SNPrelate (Zheng et al., 2012) using the Method
genetic distance (Nei, 1972), UPGMA algorithm (bootstraps                             of Moments (MoM) (Purcell et al., 2007), and an multi-
based on 1,000 re-samplings), and PCoA were developed                                 dimensional scaling (MDS) analysis was performed on the n ×
using R/poppr (Kamvar et al., 2015) and R/adegenet packages                           n matrix of genome-wide IBD pairwise distances. The shared
(Jombart, 2008), respectively.                                                        haplotypes between individuals with unknown relationships were
                                                                                      also evaluated, using PLINK with the default setting. The average
                                                                                      pairwise IBD between chromosomes from different individuals
Structure and Discriminant Analysis of Principal                                      in the groups was summarized by comparison in a heatmap.
Components                                                                                The estimation of LD as the Pearson’s squared correlation
The number of genetic pools (K) was computed for both datasets                        coefficient (r2 ) was calculated between each pair of molecular
using an admixture model performed through fastSTRUCTURE                              markers (Zhao et al., 2005) for the six groups (Table 1). To avoid
(Raj et al., 2014), using the input files (.bed,.bim, and.fam)                        distortions, a representative and equivalent number of samples
generated by PLINKv1.07 (Purcell et al., 2007) and the                                for each group was defined by the R/corehunter (Thachuk
structure.py python script. The best number of model complexity                       et al., 2009), using BALK population size (125 varieties) as the
(K) was chosen applying the algorithm for multiple choices,                           cutoff. The pairwise LD, r2 was calculated using PLINK and
chooseK.py. To extract the optimum K, the prediction error                            the parameters, such as -maf 0.05, ld-window-r2 set to zero, ld-
for each K was computed by the cross validation (CV)                                  window 99999, and ld-window-kb 10000 (Hill and Robertson,
function. Bayesian analyses for both datasets were performed                          1968). Bins of 100 kb among all pairwise combinations were
also by discriminant analysis of principal components (DAPC)                          determined based on the physical distance of each SNP pair.
implemented in the R/adegenet. The Bayesian information
criterion (BIC) method (Neath and Cavanaugh, 2012) was used                           Inference of Migration Events
to infer the K-means clustering. The analyses were performed                          The maximum likelihood (ML)-tree of data collected and
independent of geographic origin.                                                     a gene flow model among the geographic groups (Table 1)
                                                                                      were developed by TreeMix (Pickrell and Pritchard, 2012).
                                                                                      Stratified allele frequencies from PLINK were converted into
Wright’s Fixation Index and Neighbor-Joining Tree                                     the TreeMix format using the plink2treemix.py script and used
The Wright’s fixation index (Fst), a population pairwise index                        as input (https://speciationgenomics.github.io/Treemix/; Pickrell
(Wright, 1965), was computed to evaluate the genetic distances                        and Pritchard, 2012). Forty independent ML searches following
among the six groups outlined in Table 1 using R/HierFstat                            the procedure described by Zecca et al. (2020) were performed.
(Goudet, 2005). A neighbor-joining (NJ)-tree based on Fst-values                      The results were filtered based on their likelihood values using
was developed with R/adegenet.                                                        the R/cfTrees (Zecca et al., 2020), duplicates were deleted, and the

Frontiers in Plant Science | www.frontiersin.org                                3                                        August 2021 | Volume 12 | Article 692661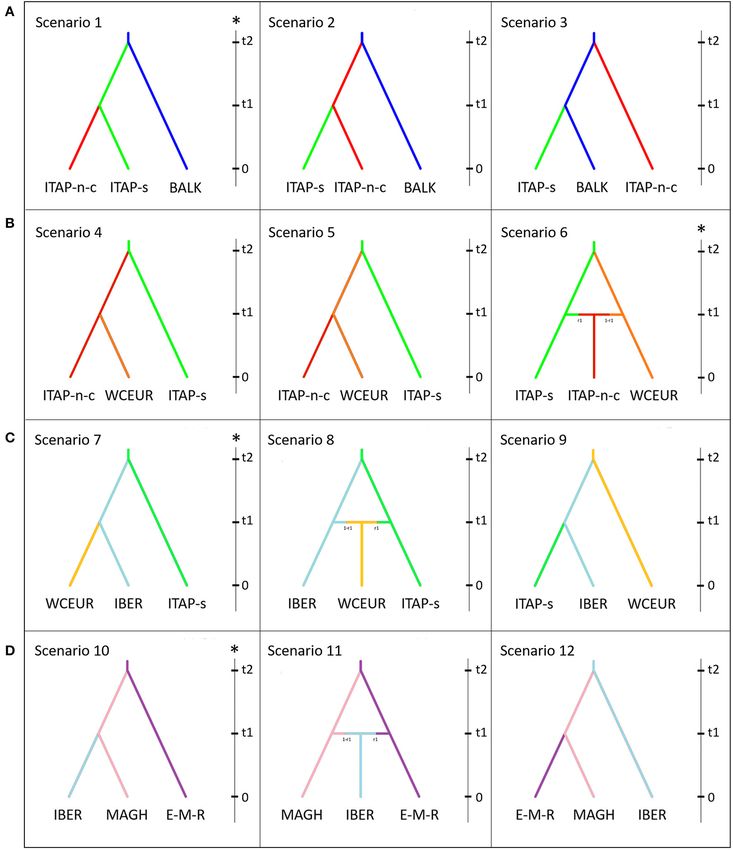
Mercati et al.                                                                                             Eurasian Grapevine Dissemination Routes

best-scoring ML tree was used. The gene flow model among the               assumed that ITAP-south and ITAP-north-center germplasm
groups was investigated through migration events (m). Migration            derived independently from BALK.
edges were tested 10 times from 1 to 5 with different random
seeds each time and using blocks (k) of 20 SNPs, to check for              The Gene Flow From Italy to the Western and Central
convergence in terms of the likelihood value of each model,                Europe
and the variance explained in each migration event was added.              The second hypothesis took into account the gene flow from Italy
Standard errors (SE) and bootstrap replicates (bootstrap) were             to the Western and Central Europe to dissect the relationship
used to assess the confidence in the inferred tree topology and the        among the Northern Italian and the Western-Central European
weight of migration events. To automate the choice of the best             germplasm (De Lorenzis et al., 2019). Three scenarios were
migration event, an ad hoc statistic based on the second-order             depicted: (i) Scenario 4 assumed that ITAP-south germplasm
rate of change in the likelihood weighted by SD was adopted                spread in the Northern-Central Italy and then WCEUR; (ii)
through R/OptM (Fitak, 2019). However, since the true model                Scenario 5 assumed that ITAP-south germplasm spread first in
was considered when the migration edges (m) explained 99.8% of             WCEUR and then in ITAP-north-center; (iii) Scenario 6 assumed
the variance in ancestry between groups, only the model showing            that an admixture event between ITAP-south and WCEUR
this cutoff was believed to be the best one (Pickrell and Pritchard,       genotypes flowed into ITAP-north-center germplasm.
2012). In addition, only the runs with all statistically significant
incorporated migration edges were considered. The residuals                The Gene Flow From ITAP-South to WCEUR Through
from the fitted models chosen for our data were visualized using           IBER
the R script plot_resid.                                                   The third case proposed the hypothesis of a gene flow from
                                                                           the Southern Italy to WCEUR via IBER (Buono and Vallariello,
Inference of Spatial Population Structure                                  2002); The three supposed scenarios are as follows: (i) Scenario
Through Ancestry Coefficient                                               7 assumed that grapevine germplasm from ITAP-south was
To assess the population structure and the putative different              introduced first into IBER and then into WCEUR; (ii) Scenario
grapevine spreading routes, a spatial ancestry estimation was              8 assumed that WCEUR genotypes derived from an admixture
performed using R/TESS3 (Caye et al., 2016). The ancestry                  event between ITAP-south and IBER genotypes; (iii) Scenario 9
coefficient was evaluated on the whole dataset by adding 21                assumed the contrary hypothesis of Scenario 7.
genotypes from the Maghreb, named MAGH(Laucou et al.,
2018), reaching 1,059 varieties (Supplementary Table 1). The               The Gene Flow From Middle and Far East to IBER
samples from Northern Africa appeared useful to verify their               Through Northern Africa
possible role as a bridge between the first domestication center,          Lastly, the hypothesis of a gene flow from the Middle and Far
EMCA-MFEAS-RUUK, and IBER. The MAGH group was not                          East to IBER through Northern Africa was verified. The three
included in the previous analysis due to its small size compared           scenarios were as follows: (i) Scenario 10 assumed a gene flow
to the other six groups (Supplementary Table 1). The number of             from EMCA-MFEAS-RUUK to Northern Africa (MAGH) and
the best K was chosen after a cross-entropy criterion evaluation           then to IBER (ii) Scenario 11 assumed that an admixture event
for each K (Frichot et al., 2014; Caye et al., 2016). The values of        between MAGH and EMCA-MFEAS-RUUK germplasm flowed
Q-matrix for the best K were interpolated on a geographic map.             into the IBER genotypes; (iii) Scenario 12 assumed a contrary
                                                                           hypothesis to Scenario 10.
Approximate Bayesian Computation
Analysis                                                                   Calculation Setting Up, Core Collections, and
An approximate Bayesian computation (ABC) approach                         Statistics
implemented with DIY-ABC 2.0 software was adopted to                       To reduce the computational power required to perform the
establish the most likely grapevine gene flow scenarios (Cornuet           ABC analysis, the dataset were pruned with PLINK, removing
et al., 2014). The genotypes belonging to the six groups (Table 1)         SNP loci pairs not in optimal LD, using a sliding window of 50
and Maghreb were used (Supplementary Table 1). Four groups                 bp and a step size of 5 SNPs, with a variance inflation factor 2
of hypotheses were evaluated.                                              (Orozco-terWengel et al., 2015). A core collection was also built
                                                                           for each population using the allele coverage allocation strategy
About the Origin of Southern Italian Genotypes                             implemented in R/corehunter, which are useful to maximize the
The first hypothesis aimed to clarify the origin of Southern Italy         allele proportion. One hundred thousand datasets were simulated
germplasm, assuming that grapevine was spread from Greek                   by do it yourself (DIY)-ABC, for a total of 12 × 105 simulated
shores to the Southern Italy and then to the Central and Northern          datasets, considering all scenarios. Mean gene diversity across
Italy (Buono and Vallariello, 2002; Scienza, 2004; Myles et al.,           all loci, mean across loci of Fst distances between pairs of
2011; Bacilieri et al., 2013; Riaz et al., 2018; De Lorenzis et al.,       geographic groups, and mean across loci of Nei’s genetic distances
2019). The three tested scenarios are as follows: (i) Scenario             between pairs of geographic groups were calculated. The most
1 assumed a flow of domesticated genotypes from BALK into                  appropriate scenario for each hypothesis was selected comparing
ITAP-south, and then into ITAP-north-center; (ii) Scenario 2               the summary statistics of simulated and observed datasets. The
assumed that domesticated grapevines from BALK first flowed                posterior probabilities [with 95% confidence interval (CI)] of
into ITAP-north-center, then to ITAP-south; (iii) Scenario 3               each competing scenario were also estimated following a logistic

Frontiers in Plant Science | www.frontiersin.org                       4                                   August 2021 | Volume 12 | Article 692661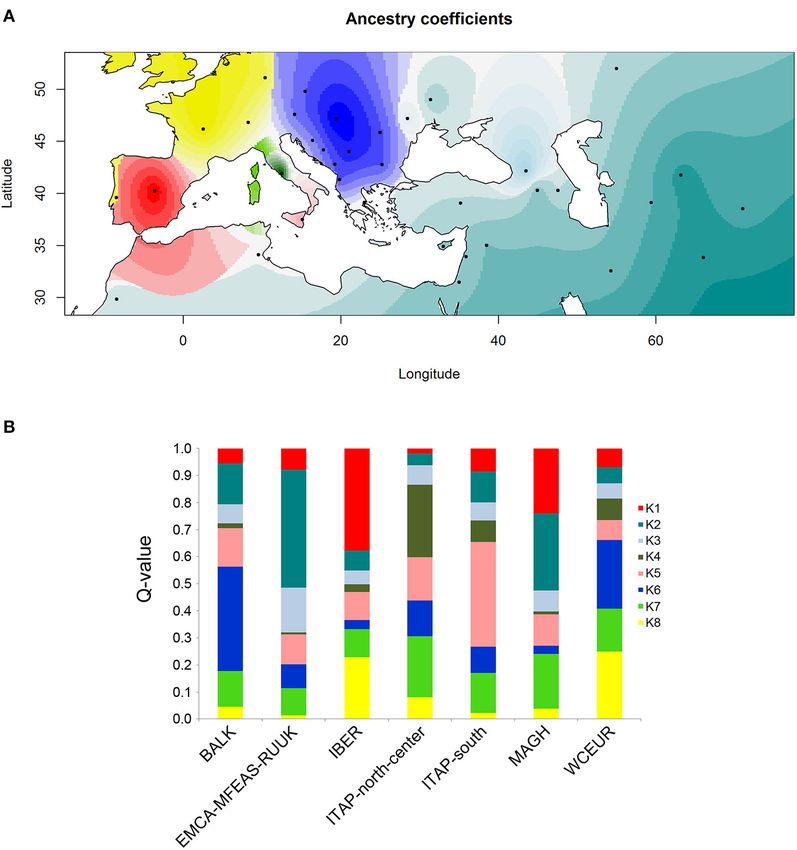
Mercati et al. Eurasian Grapevine Dissemination Routes
regression approach on the 1% of simulated datasets closest to the In agreement, DAPC analysis assigned 378 out of 384
observed dataset. The ability of ABC approach to discriminate (98.4%) Italian varieties to one of the three major pools,
between scenarios (ABC performance) was evaluated. Per each setting a cut-off of 70% posterior membership probabilities
scenario, Type I and II error probabilities were also estimated (Supplementary Table 3). Almost all the Italian varieties were
(Cornuet et al., 2014). assigned to a pool, with the highest percentage (99%) for both
Lastly, to validate the goodness-of-fit of the selected scenario, the ITAP-north (141 out of 143) and ITAP-south (135 out of
a model checking test was performed, carrying out the local 136) groups, according to Bayesian analysis (Figure 1C and
linear regression on the 1% of closest simulated datasets, after Supplementary Table 3). Although the best model was fixed
adopting a logit transformation to parameters, as suggested by at K = 3 (Figure 1), the same trend in the distribution of
the DIY-ABC user manual (Cornuet et al., 2014). Northern, Central, and Southern Italian genotypes was also
shown at K = 5, based on the cross-validation function
(Supplementary Figure 2).
RESULTS The DAPC results matched with that of PCoA and
the unweighted pair group method with arithmetic mean
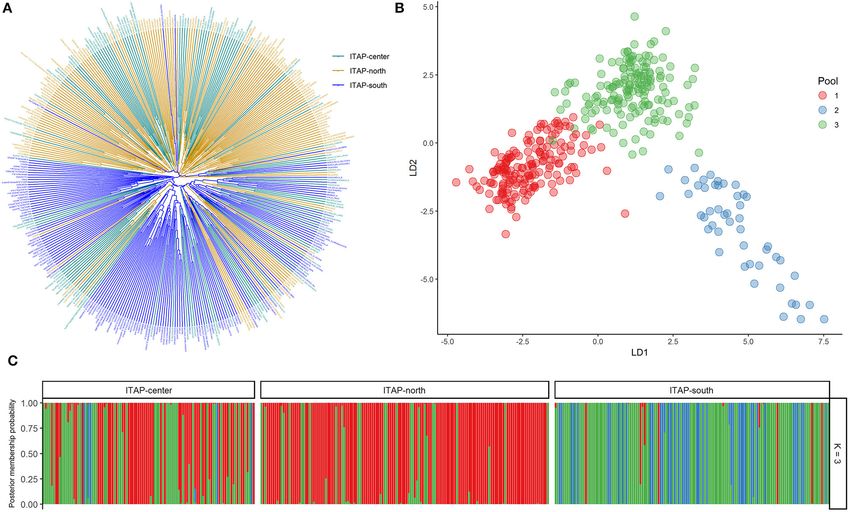
Italian Germplasm Genetic Diversity (UPGMA). According to these results, the Northern and Central
Phylogenetic and PCoA Analyses Italian genotypes were joined and named ITAP-north-center
Phylogenetic analysis among the Italian genotypes highlighted (Supplementary Table 1).
two main groups showing the distinction between Southern
and Northern Italian (ITAP-south and -north) varieties, except
for 14% of ITAP-south that clustered in the Northern Italian
group and vice versa for about 16% of the samples (Figure 1A). Genetic Relationship Among Eurasian
The Central Italian (ITAP-center) samples were divided between Grapevine Populations by the Whole
Northern (57%) and Southern (43%) clusters (Figure 1A). A Dataset
PCoA analysis confirmed the genetic relationships within the
Unweighted Pair Group Method With Arithmetic
Italian germplasm (Supplementary Figure 1), splitting ITAP-
Mean and PCoA Clustering
north and ITAP-south genotypes into two groups, with the ITAP-
Cluster analysis distinguished genotypes from the IBER, ITAP-
center samples divided between them.
north-center, and WCEUR in three clusters (Figure 2A). Nearly
50 Iberian samples (∼25%) clustered with WCEUR genotypes.
Structure and DAPC Analysis The ITAP-south, BALK, and EMCA-MFEAS-RUUK samples
The optimum K was firstly evaluated with fastSTRUCTURE, were grouped in a major assorted cluster, where a sub-
providing an optimal value between 2 and 6 (Model complexity cluster of ITAP-north-center genotypes was included (Figure 2A,
that maximizes the marginal likelihood = 6; Model components lower part). The ITAP-south varieties appeared more closely
used to explain structure in data = 2). Based on the prediction related to BALK than EMCA-MFEAS-RUUK genotypes. Another
error, the lowest model complexity within the range was significant cluster included EMCA-MFEAS-RUUK and ITAP-
explained at K = 5 (Supplementary Figure 2A). south genotypes, in the upper part of the dendrogram, as a bridge
The DAPC analysis was then performed to further investigate between IBER and WCEUR populations (Figure 2A).
the Italian germplasm and to confirm the group assignments. A similar distribution was obtained through PCoA analysis
K-means clustering was estimated using the BIC score, defining (Supplementary Figure 4), with the whole set divided into three
the best cluster number at K = 3 (Supplementary Figure 3 and main groups, with some expected overlapping: ITAP-north-
Supplementary Table 2). The scatter plot highlighted an ITAP- center samples grouped together with WCEUR genotypes and
north varieties cluster (mainly gathered in Pool 1, red) and separated by Principal Coordinate (PCo) 1; EMCA-MFEAS-
two clusters (Pools 2 and 3, blue and green) including ITAP- RUUK samples clustered together with BALK and ITAP-south
center and ITAP-south genotypes, respectively (Figure 1B). The groups resulting in complete separation from IBER varieties by
posterior probability at K = 3 underlined that nearly all ITAP- PCo2 (Supplementary Figure 4).
south genotypes shared both Pools 2 and 3; the ITAP-center
samples split in Pools 1 and 3, while ITAP-north group mainly
forms Pool 1 (Figure 1C). Structure and DAPC
In detail, 196 genotypes (51%) were attributable to a specific The optimum pool number was recorded at K = 9, using both
pool with a high percentage (ancestry membership >70%) prediction error and BIC method (Supplementary Table 2
by fastSTRUCTURE. About sixty-two (87%) out of 71 ITAP- and Supplementary Figure 5). Each population showed the
north samples formed Pool 1, the ITAP-center genotypes were prominent membership (>0.4) to an owner pool computed
mainly split between Pools 1 (28) and 3 (19), while Pool 2 through both fastStructure and DAPC, except WCEUR
is formed almost only by the ITAP-south genotypes (88%), (Supplementary Table 4). Moreover, Pool 5 is not owned
and four from ITAP-center (Supplementary Table 3). About by any population, with the highest membership related to
55% of ITAP-south genotypes were characterized by Pool 3, Moscato bianco (>0.99), the ancestor of muscat flavored
appearing as a bridge among the Italian varieties (Figure 1B and varieties (Cipriani et al., 2010; Ruffa et al., 2016). Pool 5
Supplementary Table 3). grouped varieties belonging to different populations, showing
Frontiers in Plant Science | www.frontiersin.org 5 August 2021 | Volume 12 | Article 692661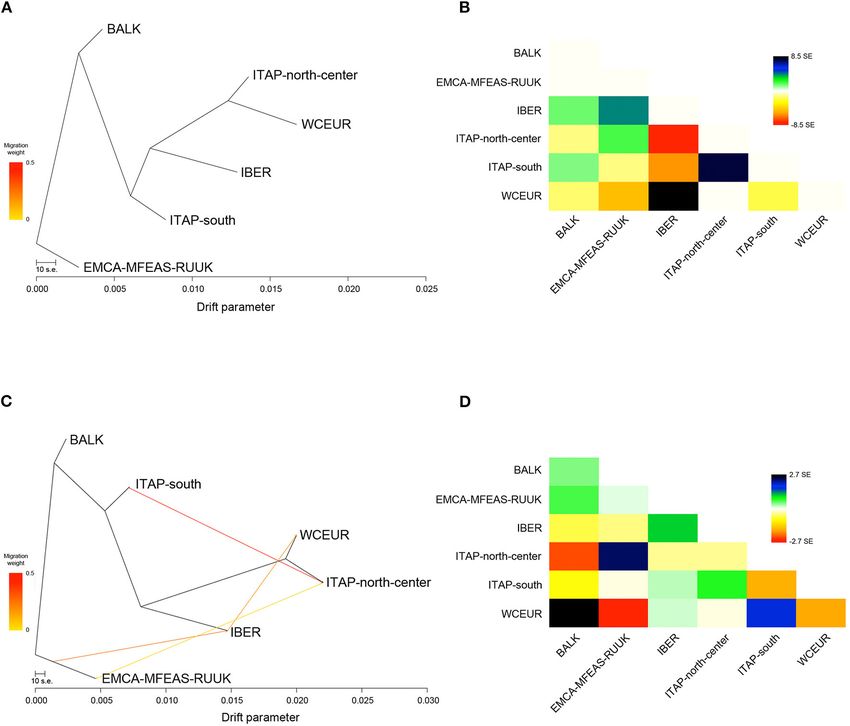
Mercati et al.                                                                                                                   Eurasian Grapevine Dissemination Routes

 FIGURE 1 | Genetic diversity and population structure on 384 Italian grapevine genotypes analyzed by 18k SNP array. (A) UPGMA dendrogram. The varieties were
 highlighted based on their geographical origin. (B) DAPC scatter plot based on the first and second (LD) at the best K (3). (C) Bar plot of the posterior probability for
 the best K (3) of group assignment for each sample belonging to different origins. UPGMA, unweighted pair group method with arithmetic mean; DAPC, discriminant
 analysis of principal components.

first- or second-degree relatedness with Moscato bianco                                  pairwise-value (0.009) was recorded between WCEUR and
(Supplementary Table 1).                                                                 ITAP-north-center groups, followed by EMCA-MFEAS-RUUK
    The DAPC scatter plot showed a triangle-shaped distribution,                         and BALK groups (0.011) and ITAP-south and BALK(0.011)
highlighting that Pool 9 is divergent from the others (Figure 2B).                       (Supplementary Table 5). The NJ tree developed by Fst-values
This pool mainly encompassed genotypes belonging to the                                  (Figure 3A) split up all the populations showing a structure
EMCA-MFEAS-RUUK population (58%, 98 out of 167                                           consistent with previous results. The EMCA-MFEAS-RUUK
genotypes), while the remaining 30% showed the highest                                   and BALK groups formed one branch and differed greatly
membership with Pool 3. Pools 2 and 3 encompassed the BALK                               from WCEUR and ITAP-north-center groups, both included in
germplasm with 60% (75 out of 125) and 20%, respectively                                 another main branch. The IBER and ITAP-south populations
(Figure 2 and Supplementary Table 4). The ITAP-south                                     are separated, with the last closely related to BALK samples, in
population showed a unique genetic structure (73%, 100 out                               agreement with PCoA (Supplementary Figure 4).
of 136) in Pool 6, according to DAPC results (Figure 2C and                                 Based on genome-wide IBD pairwise distances, the MDS
Supplementary Table 1). All the other populations were split                             analysis showed a distinctness of IBER (red), as well as EMCA-
into at least two main pools: ITAP-north-center genotypes shared                         MFEAS-RUUK (cyan), and BALK (blue) populations, while
Pools 6 and 7, IBER population belonged to Pools 5 and 8, while                          the other populations were not clearly separated (Figure 3B).
WCEUR genotypes encompassed Pools 1, 4, and 5, the last in                               The average amount of IBD shared between individuals in
common with IBER (Figure 2 and Supplementary Table 4).                                   the six populations underlined the relatedness between BALK
                                                                                         and ITAP-south genotypes, as well as between ITAP-north-
Fixation Index, IBD, and LD Decay                                                        center and WCEUR genotypes, while IBER and EMCA-MFEAS-
The EMCA-MFEAS-RUUK and WCEUR germplasm showed                                           RUUK populations showed the most consistent genetic distances
the highest genetic distance according to pairwise Fst-values                            (Figure 3C).
(0.033; Supplementary Table 5). Large genetic divergences were                              The average LD declined with the increase of physical distance
observed between EMCA-MFEAS-RUUK and IBER, as well                                       between markers and appeared fast in all the populations. The
as ITAP-north-center groups (Fst = 0.024). The lowest Fst                                fastest decay was observed in EMCA-MFEAS-RUUK population,

Frontiers in Plant Science | www.frontiersin.org                                     6                                           August 2021 | Volume 12 | Article 692661
Mercati et al. Eurasian Grapevine Dissemination Routes
FIGURE 2 | Genetic diversity and population structure on 1,038 grapevine accessions collected across Europe, Caucasus, Middle, and Far East, genotyped by 18k
SNP array. (A) UPGMA dendrogram; the varieties were highlighted based on their geographical origin (Table 1 and Supplementary Table 1). (B) DAPC scatter plot
based on the first and second LDs at the best K (9). (C) Bar plot of the posterior probability of group assignment for each accession analyzed. The samples are
grouped by origin. UPGMA, unweighted pair group method with arithmetic mean; DAPC, discriminant analysis of principal components.
followed by BALK and in the pair from ITAP (Figure 3D). In Supplementary Table 6). Furthermore, the residuals from the fit
contrast, a relatively slower LD decay was recorded for WCEUR of the selected model highlighted a not complete explanation
and IBER. Thus, the LD decay rate decreased with the increase of of different population ancestry (Figure 4B). Therefore, five
geographic distance from the Middle and Far East to the Iberian migration events (m) were added in sequence, showing the
Peninsula, in an East-to-West gradient. The average distance at saturation of the model likelihood at four additional migration
which the LD-value reached 0.05, varied among populations, edges (99.8% of variance explained; Supplementary Figure 6A).
indeed the distance accounted for ∼3.2 Mb in the varieties Overall, each run at m = 4 showed an improvement over
belonging to IBER population, while it decreased to ∼1 Mb and the tree without migration, and the model with the highest
1.8 Mb in the EMCA-MFEAS-RUUK and BALK populations, significance level (p < 0.001) for all migration edges recorded
respectively (Figure 3D). was chosen with the best fits at four inferred migration events
(Supplementary Table 7). These events were from ITAP-south
to ITAP-north-center (weight 44%, pMercati et al. Eurasian Grapevine Dissemination Routes
FIGURE 3 | (A) NJ-tree based on population pairwise Fst. Genetic distances were computed among populations (Table 1 and Supplementary Table 1). (B) MDS
analysis using IBD segments evaluated on 1,038 grapevine varieties, collected across Europe, Caucasus, Middle, and Far East. The varieties were highlighted based
on their geographical origin (Table 1 and Supplementary Table 1). (C) Heatmap of the log average proportion of genome shared IBD between a pair of individuals
belonging to groups analyzed. Colors are described in the palette on the right; higher values (less negative, toward the yellow end of the color scale) indicate higher
IBD sharing. Cluster obtained through the proportion of shared IBD was also visualized. (D) Decay of average LD (r 2 ) over distance (Mb) in the six groups (Table 1).
NJ, neighbor-joining; fst, fixation index; MDS, multi-dimensional scaling; IBD, identity by descent; LD, linkage disequilibrium.
highest f (0.998 vs. 0.992) and the lowest residual values (SE The analysis of ancestry through the cross-entropy criterion
± 2.7 vs. SE ± 6.8) (Figure 4D; Supplementary Figure 7B; and on the total 1,059 varieties estimated a single fixed K = 8
Supplementary Table 6) were obtained. (Supplementary Figure 8), confirming the distinctness among
grapevine populations as revealed above (Figure 5A).
The ancestry coefficients interpolated to the geographic
Grapevine Spreading Evaluation Through coordinates clearly showed the grapevine spreading from the
Ancestry Coefficient Analysis first domestication center (Caucasus) to the Mediterranean
The ancestry estimation was performed adding 21 Northern Basin (Figure 5A). Moreover, four out of the seven grapevine
African (MAGH) genotypes (Laucou et al., 2018) to the populations resulted in the ancestors of a specific pool, except
whole dataset to better overview the conceivable grapevine ITAP-north-center, WCEUR and MAGH populations, showing
migration routes. an admixed structure (Figure 5B and Supplementary Table 8).
Frontiers in Plant Science | www.frontiersin.org 8 August 2021 | Volume 12 | Article 692661Mercati et al. Eurasian Grapevine Dissemination Routes FIGURE 4 | (A) The ML-tree inferred by TreeMix. The scale bar shows 10 times the average SE of the entries in the sample covariance matrix. Drift parameter is shown on the x-axis. (B) Residual fit from ML-tree with SE ± 8.5. High standard errors suggest strong candidate groups for admixture events. Positive residuals characterize groups where the model underestimates the observed covariance; similarly, pairs of groups where the model overestimates the observed covariance showed negative residuals. Colors are described in the palette on the right. (C) ML-tree that best fits the data with 4 additional migration edges: EMCA-MFEAS-RUUK to IBER (p
Mercati et al.                                                                                                                Eurasian Grapevine Dissemination Routes

 FIGURE 5 | Ancestry coefficient evaluated by R/TESS3 for the whole grapevine germplasm including 21 samples from North Africa (Morocco and Tunisia) named
 MAGH. The number of ancestral populations (K = 8) was chosen after the evaluation of a cross-entropy criterion for each K (Supplementary Figure 9). (A) The
 values of the Q-matrix (K = 8) were interpolated on a geographic map, using the centroid for each country studied, except for Russia for a better graphic display.
 Likewise, the samples from Bosnia and Herzegovina, Croatia, Montenegro, and Serbia were grouped together for a clearer visualization. (B) Bar plot showing the
 ancestry proportions contributed by K ancestral source populations by calculating the average value of each of the 8 membership coefficients (Q-value) for each of the
 seven groups defined by geographic origin (Table 1 and Supplementary Table 1).

germplasm (Supplementary Figure 9B). Scenario 6 showed the                             germplasm from ITAP-south was firstly introduced into
highest and significant Pp-value (81%), with a 95% CI ranging                          IBER and then into WCEUR (Supplementary Figure 9C).
from 75 to 82%, 3 out of 9 statistics outlying from the                                Scenario 7 showed the highest Pp rate (88%, with 95% CI
observed values (Table 2 and Supplementary Table 9), 87% of                            from 82 to 91%), the lowest number of outlying statistics
performance evaluation, and Type I and Type II error rates
Mercati et al.                                                                                                                         Eurasian Grapevine Dissemination Routes

 FIGURE 6 | Schematic representation of scenarios depicting the grapevine gene flow in the Mediterranean basin, based on ABC approach. Scenarios were depicted
 to validate or rebut the gene flow. (A) from Balkans to Northern Italy, (B) from ITAP-south to Western and Central Europe, (C) from ITAP-south to WCEUR through
 IBER, and (D) from Middle and Far East to IBER through Northern Africa. The vertical bar in each box indicates the timescale (t2 > t1 > t0 ; t0 = present). For each
 hypothesis, the most likely scenario (*) was selected among the ones showing: (i) the highest values of logistic regression; (ii) the lowest number of outlying statistics; (iii)
 the highest value of posterior probability; (iv) the highest value of performance evaluation; (v) the mean values of Types I–II error lower than 20%, indicating an adequate
 power and sensitivity of ABC analysis (Chen et al., 2017). The samples named EMCA-MFEAS-RUUK (Table 1) was indicated as E-M-R, while ITAP-north-center and
 ITAP-south was named, ITAP-n-c and ITAP-s, respectively. ABC, approximate Bayesian computation; EMCA-MFEAS-RUUK; Eastern Mediterranean and Caucasus,
 Middle and Far East, Russia and Ukraine; ITAP-south, ITAP-Southern Italy; ITAP-north-center, ITAP-Northern, and Center Italy; WCEUR, Western and Central Europe.

logistic regression and assuming a gene flow from EMCA-                                      showed 75% Pp (with 95% CI from 71 to 79%), the lowest
MFEAS-RUUK to Northern Africa (MAGH) and then to                                             number of outlying statistics (4 out of 9), high value of
the IBER population (Supplementary Figure 9D). Scenario 10                                   performance evaluation (88%), and Type I and Type II error

Frontiers in Plant Science | www.frontiersin.org                                        11                                             August 2021 | Volume 12 | Article 692661
Mercati et al.                                                                                                                             Eurasian Grapevine Dissemination Routes

TABLE 2 | Summary of ABC results to define the most likely scenarios belonging to four hypotheses about the gene flow of grapevine genetic resources from
East-to-West.

Hypothesis 1                                                         Scenario 1                                         Scenario 2                                          Scenario 3

Pp (%)                                                                    74                                                 51                                                  43
95% CI                                                                  93–95                                              48–54                                               40–45
Number of outlying statistics
P< 0.05                                                                   1                                                   6                                                   2
P< 0.01                                                                   2                                                   0                                                   3
Hypothesis 2                                                         Scenario 4                                         Scenario 5                                          Scenario 6
Pp (%)                                                                    52                                                 57                                                  81
95% CI                                                                  46–53                                              55–64                                               75–82
Number of outlying statistics
P< 0.05                                                                   0                                                   2                                                   1
P< 0.01                                                                   4                                                   2                                                   2
Hypothesis 3                                                         Scenario 7                                         Scenario 8                                          Scenario 9
Pp (%)                                                                    88                                                 57                                                  38
95% CI                                                                  82–91                                              54–64                                               32–40
Number of outlying statistics
P< 0.05                                                                   1                                                   2                                                   2
P< 0.01                                                                   2                                                   2                                                   2
Hypothesis 4                                                        Scenario 10                                         Scenario 11                                        Scenario 12
Pp (%)                                                                    75                                                 46                                                  58
95% CI                                                                  71–79                                              42–48                                               57–60
Number of outlying statistics
P < 0.05                                                                  2                                                   3                                                   3
P < 0.01                                                                  2                                                   4                                                   2

Scenarios are defined in Figure 6. Pp, posterior probability; CI, confidence interval. Scenarios with highest Pp-value and lowest number of outlying statistics within each hypothesis are
in bold and italic.

rates
Mercati et al.                                                                                                Eurasian Grapevine Dissemination Routes

from two Italian projects (AGER and VIGNETO), resulting in                      The complex origin of ITAP-south germplasm was confirmed;
384 genotyped varieties using the 18k SNP genotyping array.                 indeed the pairwise fixation index, Fst was the same in both
Varieties belonging to Eurasia, from the Caucasus to Western                couples ITAP-south/BALK and ITAP-south/ITAP-north-center
Europe (De Lorenzis et al., 2015, 2019; Laucou et al., 2018), were          (Supplementary Table 5 and Figure 3A). The higher proximity
added for the final dataset of 1,038 unique SNP-profiles.                   of ITAP-south to BALK than to ITAP-north-center germplasm
                                                                            was inferred by other analyses, such as MDS with IBD, NJ tree,
                                                                            and TreeMix (Figures 3B,D, 4). Otherwise, ITAP-north-center
History of the Italian Population and                                       varieties showed a higher proximity to WCEUR germplasm
Distinctness From the Other Eurasian                                        (Figures 3A–C, 4C). The Fst in the couple ITAP-north-
Populations                                                                 center/WCEUR was the lowest among all pairwise comparisons
The origin of Italian viticulture dates to the Etruscans (around the        (Supplementary Table 5). Moreover, one major migration event
8th BC) and Greeks (7th -6th BC). The former domesticated wild              from Southern to Northern Italy, inferred with TreeMix analysis
grapevines in ITAP-north-center, while the Greeks introduced                (Figure 4C), is supported by a recent pedigree study (D’Onofrio
their varieties in ITAP-south. Differences between these areas              et al., 2021) and the possible “bridge” role of the varieties included
occurred in winegrowing, the choice of varieties, and in the                in Pool 3 (DAPC) (Figures 1B,C and Supplementary Table 1).
way to manage the vines (Buono and Vallariello, 2002), but                  In addition, Scenario 1 (ABC analysis) agrees with this
these differences were not highlighted yet by genetic analysis.             hypothesis, as the best supported scenario for a mixed origin
Furthermore, the Italian varieties did not appear distinguishable           of ITAP-north-center germplasm between ITAP-south and
from those of the other European regions. The first research                WCEUR genotypes (Figure 6B). The ITAP-north-center and
including a considerable panel of Italian varieties, genotyped              ITAP-south genotypes were distinguished, also when compared
at 34 SSR loci, was unable to cluster the germplasm based on                to the Eurasian dataset. Indeed, the DAPC on the whole SNP
their geographic origin (Cipriani et al., 2010). Later, 304 Italian         dataset (1,038 genotypes) split the ITAP germplasm in two
varieties, included in a large germplasm collection from the                groups (Figures 2B,C and Supplementary Table 1). Following
Information System of the National Institute for Agronomical                the posterior membership probabilities (>70%), Pools 6 and 7
Research (INRA), were characterized by using another panel                  included mainly varieties from WCEUR and ITAP-north/center,
of 20 SSR loci, resulting admixed by a weak genetic structure               respectively (Supplementary Table 1). Once again, ITAP-north
based on geographic origin (Bacilieri et al., 2013). Recently,              and ITAP-south varieties were distinguishable, while ITAP-
783 Eurasian varieties belonging to four grapevine repositories             center germplasm was split. Small groups of Italian varieties
were characterized with the 10k genome-wide SNPs and the                    were pinpointed in other pools, e.g., some Sardinian cultivars,
84 Italian cultivars clustered together with WCEUR genotypes,               historically racked from Spain to Sardinia (De Mattia et al., 2009),
confirming the indiscernibility of the Italian germplasm (Laucou            grouped in Pool 8, representative of the IBER germplasm. Some
et al., 2018). Then, 140 varieties from ITAP-south characterized            muscat flavored varieties grouped in Pool 5, where the offspring
by the same 18k SNPs showed similarity with genotypes coming                of the well-recognized major ancestor Moscato bianco/Muscat
from both Eastern Mediterranean Sea and France, although the                à petits grains blanc were placed (Cipriani et al., 2010; Ruffa
ITAP-south cluster appeared evident (De Lorenzis et al., 2019).             et al., 2016). Finally, the geographic location can account for some
D’Onofrio et al. (2021) highlighted that most of the Italian                cultivars from the Adriatic coast grouped into Pool 2, including
varieties, genotyped by SNPs, appeared structured in few main               BALK germplasm.
clusters with the first and second-degree relationship scattered                A slightly more complex picture was defined by ancestry
from the South to North of Italy.                                           coefficient analysis (R/TESS3) on the whole dataset, where
   Here, for the first time, the cluster analysis on 384                    ITAP-south germplasm resulted as the main contributor to K5,
Italian genotypes allowed us to distinguish the Northern and                while ITAP-north-center cultivars showed the highest values of
Southern genotypes, appearing clearly separated into two large              membership in two pools, K4 and K7, with K7 appearing as a
clusters by using both UPGMA algorithm (Figure 1A) and                      mixed pool (Figure 5 and Supplementary Table 8).
PCoA (Supplementary Figure 1). The observed distinctiveness
was better detailed by using a multiple Bayesian approach,
DAPC (Figures 1B,C and Supplementary Table 1). A significant
K = 3 was evidenced with a group (Pool 2) including                         Genetic Structure of the Eurasian
South-Italian varieties and two others overlapped, the first                Germplasm
mainly counting North-Italian varieties (Pool 1), and the                   The genetic distances among the six Eurasian populations
second (Pool 3) including varieties from all Italian areas                  (Figure 3A) indicated the highest divergence between EMCA-
(Figure 1B). In each pool, some ancestors can be recognized,                MFEAS-RUUK and WCEUR populations, which was also
such as Garganega/Grecanico dorato in Pool 1, Bombino and                   confirmed by the highest Fst index among all pairwise
Visparola in Pool 3 (D’Onofrio et al., 2021) and Mantonico                  comparisons (Supplementary Table 5). This result was expected
bianco and Sangiovese in Pool 2 (De Lorenzis et al., 2019;                  given the well-known gene flow from Eastern to Western
D’Onofrio et al., 2021) (Supplementary Table 1). These last                 Eurasia. Our results appeared in agreement with an evoked
could represent “bridge varieties” linking ITAP-south and ITAP-             divergence among the grapevine genetic structures in different
north-center populations.                                                   European grapevine-growing regions, firstly reported by Sefc

Frontiers in Plant Science | www.frontiersin.org                       13                                     August 2021 | Volume 12 | Article 692661
Mercati et al. Eurasian Grapevine Dissemination Routes
et al. (2000). Bayesian computations helped us depict a more Eastern varieties (Bacilieri et al., 2013). Through structure
detailed reconstruction of this history. analysis, ten IBER varieties (Supplementary Table 1) showed
The DAPC performed on the whole dataset highlighted nine a larger ancestry membership to Pool 3 (EMCA-MFEAS-
pools, attributable to the Eurasian populations (Figures 2B,C). RUUK) than pool 8 (IBER). They could have been derived
Seven out of nine pools appeared correlated with the main from the migration event from EMCA-MFEAS-RUUK to IBER,
geographic memberships (Supplementary Table 1). Indeed, highlighted by TreeMix analysis (Figure 4C) and mediated
Pools 6 and 7 included nearly all Italian varieties, Pool 8 included by MAGH, as hypothesized in Scenario 10 by ABC analysis
the highest number of varieties from IBER, Pools 3 and 9 (Figure 6D). The groups defined by DAPC and the ancestry
represented the EMCA-MFEAS-RUUK germplasm; noticeably, coefficient analyses sustained a major migration event from
the Georgian varieties were grouped in Pool 9, while Pools 1 and IBER to WCEUR population (TreeMix), explained by Portuguese
4 included many varieties from WCEUR population. Finally, varieties falling in Pool 4 (WCEUR) (Supplementary Table 1),
Pool 2 comprised many varieties of mixed geographic origin, Pool 5 (WCEUR and IBER) (Supplementary Table 4) and K8
two main parents, Gouais blanc/Heunischweiss and Blank (Supplementary Table 8), respectively. Moreover, the Scenario
Blauer/Vulpea, ascribed to WCEUR, but also a predominance of 7 from ABC analysis well-supported a gene flow from ITAP-
BALK varieties. The geographic membership of Pool 2 varieties south to IBER and then to WCEUR population (Figure 6C), as
is still questioned (Bowers et al., 1999; Crespan et al., 2020), and hypothesized by Buono and Vallariello (2002).
our results suggested their potential “bridge” role. Interestingly,
Pool 5 resulted mixed between IBER and WCEUR germplasm LD-Values Differed in the Six Geographic
putatively explaining the migration event from IBER to WCEUR Groups
population, highlighted by TreeMix analysis (Figure 4C) and Standard r2 -value used to perform LD measure is a parameter
supported in ABC results on Scenario 7 (Figure 6C). This suffering from bias when the individuals are dependent, or
appears to be a new finding in contrast with previous reports the analyzed populations evolved differently. In such cases,
that hypothesized a migration of some cultivars from WCEUR to long-range values for LD are obtained as admixed populations
IBER population after a secondary domestication event in IBER (Mangin et al., 2012). Therefore, the distinctiveness of the
(Arroyo-García et al., 2006). evolution of six grape populations in their different geographic
The ancestry coefficient analysis highlighted one less genetic contexts, leading to differences in the allele frequencies
pool than DAPC (K = 8) of which seven pools showed the affecting r2 -values appeared indubitable. Accordingly, shorter
highest ancestry membership values in agreement with the LD-values can account for a higher number of meiotic events
geographic origin. Similarly, Pools from 1 to 5 were assigned and recombination within the population, leading to limited
to IBER, EMCA-MFEAS-RUUK, Georgian, ITAP-north-center, relationships. By contrast, high levels of admixture, close
and ITAP-south populations, respectively (Figure 5B and relationships, and low recombination rates, lead to longer LD-
Supplementary Table 8). Pool 6 was mainly shared by the BALK values (Mangin et al., 2012).
varieties, deserving additional comments: three varieties from Providing that these observations are not significant on
Cyprus harbor a very low ancestry and should have been a time scale; according to LD trend, EMCA-MFEAS-RUUK
ascribed to EMCA-MFEAS-RUUK. Notably, the Greek varieties population showed a more natural and faster evolution, followed
showed multiple memberships, with similar ancestry values by BALK and ITAP germplasm, while IBER and WCEUR
for K2 (including EMCA-MFEAS-RUUK germplasm) and K6 varieties appeared more static and closely related (Figure 3C).
pools. Therefore, Greece appears to be the main bridge between The admixture within WCEUR and IBER populations, and the
Near Eastern germplasm and the Mediterranean Basin (ITAP), gene flow from WCEUR to IBER germplasm, were already
supporting the theory that grapevines were spread from the established by pedigree analyses (Bowers et al., 1999; Boursiquot
Greek shores to the Southern and then Northern Italian ones et al., 2009; Diaz Losada et al., 2010; Zinelabidine et al., 2015).
(Buono and Vallariello, 2002). The K7 pool resulted largely Moreover, archaeological research in France highlighted that
admixed, in which Swiss varieties showed the highest ancestry vines remain closely related to the Western European cultivars
value, followed by ITAP-north-center. The K8 pool encompassed used nowadays for winemaking. The varieties cultivated by the
the WCEUR germplasm. Unexpectedly, the Portuguese varieties Romans in ancient times were the same as those grown today
showed a greatest membership to K8 (Supplementary Table 8), or shown to be parent-offspring related with present varieties
higher than K1 (IBER pool), appearing to be the most plausible (Ramos-Madrigal et al., 2019).
candidate group for the genetic exchange between IBER and
WCEUR, highlighted by TreeMix computations and DAPC The East-to-West Grapevine Gene Flow
analysis. This hypothesis is also supported by ancestry coefficient Grapevine domestication seems to be related to winemaking,
analysis, where Portugal is painted with two colors (Figure 5A). although which process predated the other remains questionable
In summary, IBER germplasm appeared distinguished from (Terral et al., 2010). The pivotal role of Greece in the viticulture
the others indicating a complex history supported by genetic history is well-known. Indeed, the Greeks achieved mastery
relationship (Figure 2 and Supplementary Figure 4), IBD, and in grapevine cultivation and winemaking, elevating both to
NJ analyses (Figures 3B–D). The genetic structure analysis a cultural phenomenon. There is no reliable information on
stated that IBER varieties included two groups, one related the introduction of winemaking techniques in Greece. From
to WCEUR group and the other to Northern Africa and Greece, the culture of wine reached Western Europe through
Frontiers in Plant Science | www.frontiersin.org 14 August 2021 | Volume 12 | Article 692661Mercati et al. Eurasian Grapevine Dissemination Routes
Southern Italy and then France and Spain (Buono and Vallariello, was confirmed. We provide a sophisticated genetic model that
2002; Scienza, 2004). This migration flow from the East to is useful to ultimately attribute the role of frontier between the
West also involved grapevine cultivars, recently documented Western and Eastern Eurasia to the Italian and mainly to the
by genetic analysis (Myles et al., 2011; De Lorenzis et al., Magna Graecia germplasm.
2019; D’Onofrio et al., 2021). Our results confirmed this East- Our finding, reconciling genetic and archaeological data for
to-West gene flow. The population pairwise Fst estimation one of the most cultivated and fascinating crops in the world,
assigned the lowest genetic distance to ITAP-north-center has made a key contribution to defining the genetic relationships
and WCEUR pair, while the highest was found between among grapevine populations distributed in a wide geographic
WCEUR and EMCA-MFEAS-RUUK (Supplementary Table 5). area ranging from the Caucasus to the Iberian Peninsula.
The scaling of NJ-tree branches related to WCEUR population
reflected a more recent development (Figure 3A). What has DATA AVAILABILITY STATEMENT
happened in between has to be analyzed. The complex role
played by Italian germplasm evoked in this work, suggested a The datasets presented in this study can be found in online
key breakthrough to understanding the grapevine germplasm repositories. The names of the repository/repositories
evolution in Eurasia. Genetic data analysis (Figures 3A, 4) and accession number(s) can be found in the
confirmed gene flow events from EMCA-MFEAS-RUUK to article/supplementary material.
BALK and then to ITAP-south population. The novelty of
the findings is the relationship between ITAP-north-center and AUTHOR CONTRIBUTIONS
WCEUR populations (Figures 3A–C, 4). The ABC analysis
suggested that the admixture of ITAP-north-center germplasm FM, GDL, MC, and FS: conceptualization. FM and GDL:
could be derived by the gene flow from both ITAP-south and methodology, formal analysis, and writing—original draft. AM,
WCEUR varieties (Figure 6B, Scenario 6). MZ, CM, PR, LB, CD’O, MB, CB, LP, and VN: investigation.
The gene flow from ITAP-south to WCEUR throughout CM, PR, LB, CD’O, MB, CB, LP, and VN: resources. FM,
IBER population assigned an additional role to the Magna MC, and FS: supervision. CM, PR, LB, CD’O, MB, CB, LP,
Graecia (Figures 4C, 6C, Scenario 7). The complex structure FS, and VN: funding acquisition. All authors contributed to
of IBER population is also affected by the additional gene flow the writing—review and editing, article, and approved the
from EMCA-MFEAS-RUUK through the MAGH population, submitted version.
as highlighted by gene flow, ancestry evaluation, and ABC
analysis through Scenario 10 (Figures 4, 5, 6D). As expected, the FUNDING
WCEUR population was the last member of this chain, showing
the highest distance from the EMCA-MFEAS-RUUK group. In This work was supported by an Ager grant n 2010–2104:
turn, WCEUR varieties played a role in gene flow, receiving a An Italian Vitis database with multidisciplinary approach, for
contribution from IBER, and contributing to the ITAP-north- exploitation and valorization of the regional genotypes and the
center germplasm (Figures 4, 6, Scenario 6). CREA grant, Viticultural Characterization of the main Italian
After the first grapevine domestication event in the Caucasus, Grape Varieties and their Terroir (VIGNETO) project.
cultivated vines spread southwards to Anatolia and Egypt
5,000 years ago, as well as around the Mediterranean SUPPLEMENTARY MATERIAL
Basin, following the main civilizations (McGovern,
2003; This et al., 2006). In this scenario, the key role The Supplementary Material for this article can be found
of Italian germplasm in the grape genetic differentiation online at: https://www.frontiersin.org/articles/10.3389/fpls.2021.
(Grassi et al., 2003; Sunseri et al., 2018; De Lorenzis et al., 2019) 692661/full#supplementary-material
REFERENCES Bowers, J., Boursiquot, J.-M., This, P., Chu, K., Johansson, H., and Meredith,
C. (1999). Historical genetics: the parentage of chardonnay, gamay,
Arroyo-García, R., Ruiz-García, L., Bolling, L., Ocete, R., López, and other wine grapes of Northeastern France. Science 285, 1562–1565.
M., a, Arnold, C., et al. (2006). Multiple origins of cultivated doi: 10.1126/science.285.5433.1562
grapevine (Vitis vinifera L. ssp. sativa) based on chloroplast DNA Buono, R., and Vallariello, G. (2002). Introduzione e diffusione della vite (Vitis
polymorphisms. Mol. Ecol. 15, 3707–3714. doi: 10.1111/j.1365-294X.2006.0 vinifera L.) in Italia. Delpinoa 44, 39–51.
3049.x Caye, K., Deist, T. M., Martins, H., Michel, O., and François, O. (2016). TESS3: fast
Bacilieri, R., Lacombe, T., Le Cunff, L., Di Vecchi-Staraz, M., Laucou, V., Genna, inference of spatial population structure and genome scans for selection. Mol.
B., et al. (2013). Genetic structure in cultivated grapevines is linked to Ecol. Resour. 16, 540–548. doi: 10.1111/1755-0998.12471
geography and human selection. BMC Plant Biol. 13:25. doi: 10.1186/1471-222 Chen, M., Fontaine, M. C., Ben Chehida, Y., Zheng, J., Labbé, F., Mei,
9-13-25 Z., et al. (2017). Genetic footprint of population fragmentation and
Boursiquot, J.-M., Lacombe, T., Laucou, V., Julliard, S., Perrin, F.-X., Lanier, contemporary collapse in a freshwater cetacean. Sci. Rep. 7:14449.
N., et al. (2009). Parentage of Merlot and related winegrape cultivars of doi: 10.1038/s41598-017-14812-z
southwestern France: discovery of the missing link. Aust. J. Grape Wine Res. Cipriani, G., Spadotto, A., Jurman, I., Di Gaspero, G., Crespan, M., Meneghetti, S.,
15, 144–155. doi: 10.1111/j.1755-0238.2008.00041.x et al. (2010). The SSR-based molecular profile of 1005 grapevine (Vitis vinifera
Frontiers in Plant Science | www.frontiersin.org 15 August 2021 | Volume 12 | Article 692661You can also read