Urban Forestry Management Plan - City of Walla Walla, Washington June 2021
←
→
Page content transcription
If your browser does not render page correctly, please read the page content below
Urban Forestry
Management Plan
City of Walla Walla, Washington
              June 2021
            Prepared for:

       City of Walla Walla, WA
               July 2021

            Prepared by:

             ArborPro, Inc.
   22605 E. La Palma Ave Suite #509
       Yorba Linda, CA 92887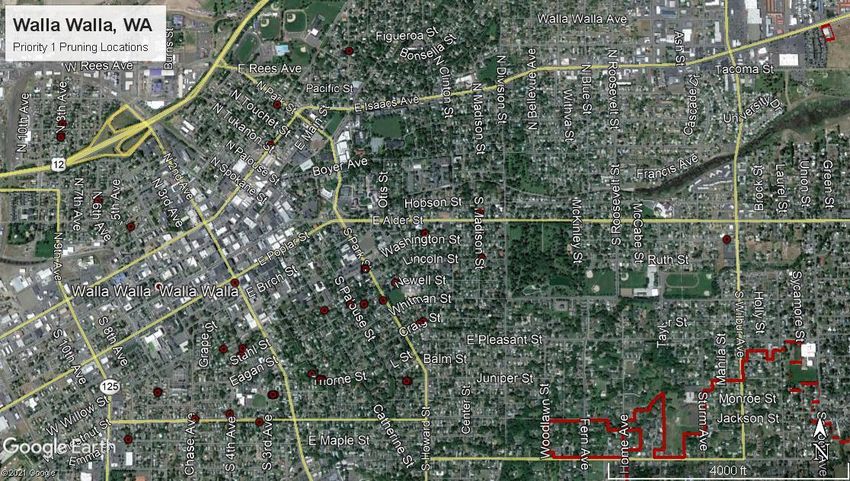
Table of Contents
Executive Summary............................................................................................................................... 1
  Significant Findings from the 2021 Inventory ....................................................................................... 1
  Tree Maintenance Needs ..................................................................................................................... 2
Introduction ........................................................................................................................................... 3
  Approach to Tree Management ........................................................................................................... 3
Section 1: Highlights and Results of Inventory Data............................................................................ 4
  Methods of Data Collection ................................................................................................................. 4
  Assessment of Tree Inventory Data ...................................................................................................... 4
  Size Characteristics .............................................................................................................................. 4
  Discussion............................................................................................................................................ 5
  Tree Condition ..................................................................................................................................... 6
  Species and Genus Distribution............................................................................................................ 8
  Clearance and Hardscape Analysis ....................................................................................................... 9
Section 2: Benefits of a Healthy Urban Forest.................................................................................... 13
  Air Quality ......................................................................................................................................... 13
  Carbon Dioxide Sequestration ........................................................................................................... 13
  Stormwater Control ........................................................................................................................... 13
  Total Replacement Value ................................................................................................................... 13
  Community Survey ............................................................................................................................ 14
Section 3: Tree Management............................................................................................................... 24
  Recommended Maintenance and Tree Risk ....................................................................................... 24
  Priority and Proactive Maintenance ................................................................................................... 26
  Priority Maintenance ......................................................................................................................... 26
  Importance of Tree Maintenance....................................................................................................... 35
  Importance of Updating Inventory Data ............................................................................................. 36
  Vacant Sites and Tree Planting ........................................................................................................... 36
  Canopy Cover .................................................................................................................................... 38
  Tree Planting ..................................................................................................................................... 40
  Maintenance Cycle ............................................................................................................................ 42
Conclusions .......................................................................................................................................... 44

List of Figures
Figure 1: Diameter class distribution........................................................................................................ 5
Figure 2: Height class distribution. ........................................................................................................... 5
Figure 3: Tree condition by count and percentage. .................................................................................. 7
Figure 4: Maintenance recommendations by condition. .......................................................................... 7
Figure 5: Tree distribution by percentage over 2%. .................................................................................. 8
Figure 6 Top Ten Species. ........................................................................................................................ 9
Figure 7: Count of Clearance by Category. ............................................................................................. 10
Figure 8: Hardscape Damage Count. ...................................................................................................... 11
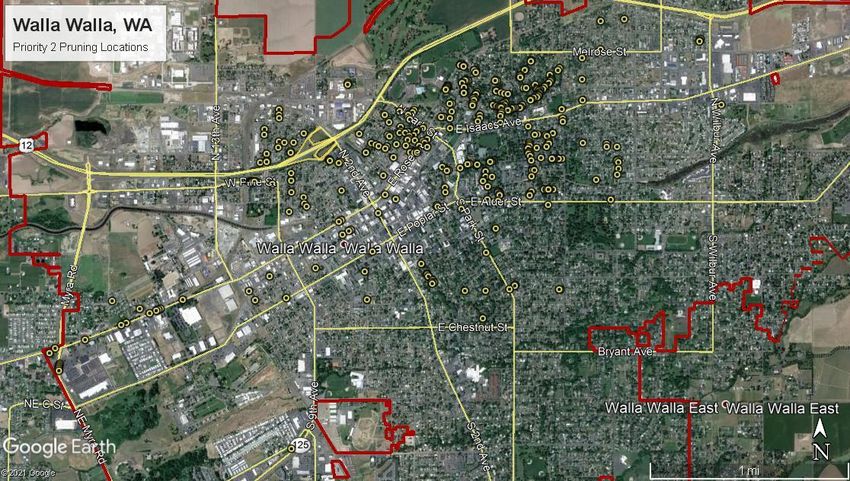
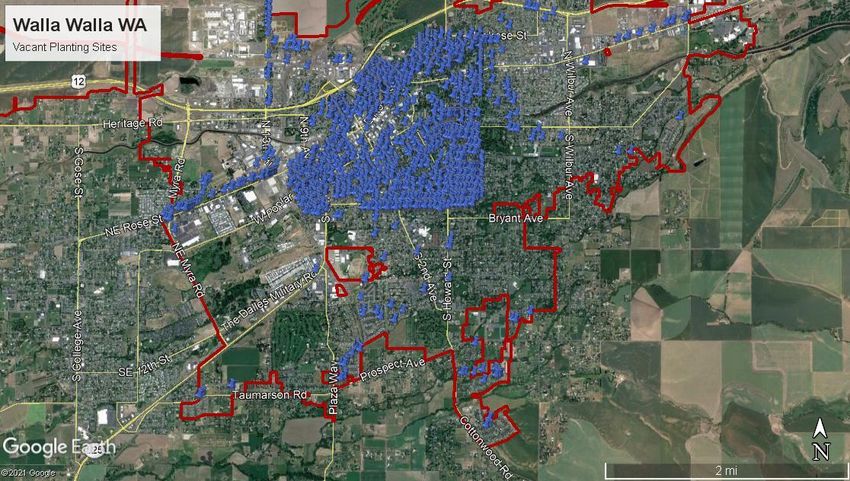
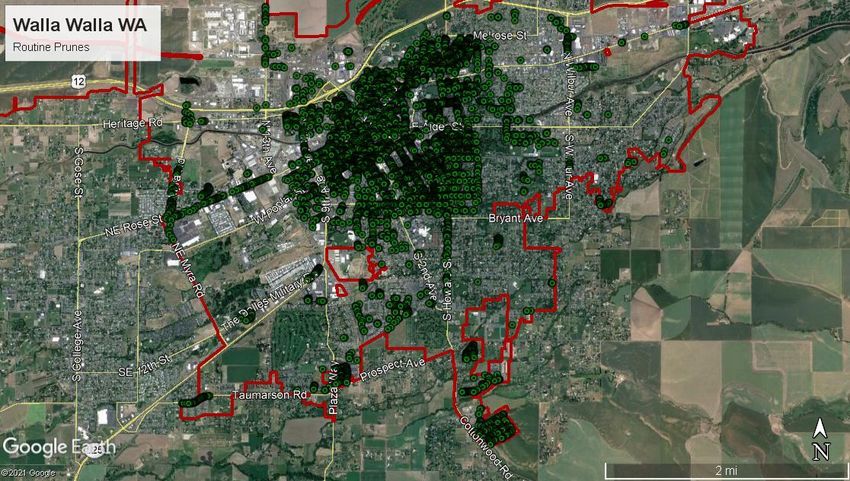
Figure 9: Observations. .......................................................................................................................... 12
Figure 10: Recommended Maintenance. ............................................................................................... 25
Figure 11: Priority removals by diameter class. ...................................................................................... 27
Figure 12: Priority 1 removals by diameter class. ................................................................................... 27
Figure 13: Priority 2 Removals by diameter class. .................................................................................. 28
Figure 14: Location of priority removals................................................................................................. 28
Figure 15: Priority pruning by diameter class. ........................................................................................ 29
Figure 16: Priority 1 Prunes by diameter class. ....................................................................................... 29
Figure 17: Priority 2 Prunes by diameter class. ....................................................................................... 30
Figure 18: Location of Priority 1 Prunes. ................................................................................................ 30
Figure 19: Location of Priority 2 Prunes. ................................................................................................ 31
Figure 20: Proactive maintenance by diameter class. ............................................................................. 32
Figure 21: Routine Prunes by diameter class. ......................................................................................... 33
Figure 22: Number of trees in the Small/Young Tree Training Cycle. ...................................................... 34
Figure 23: Location of Routine Prunes. .................................................................................................. 35
Figure 24: Vacant Planting Sites by size. ................................................................................................. 36
Figure 25: Vacant Planting Site locations ............................................................................................... 37
Figure 26: Planting Detail....................................................................................................................... 40
Figure 27: Five-year maintenance plan .................................................................................................. 43

List of Tables
Table 1: Tree Pruning and Removal Totals ............................................................................................... 2
Table 2: Tree Condition & Percentage of Population. ............................................................................... 6
Table 3: Ten most common genera by percentage and count of total population. ................................... 8
Table 4: Clearance Count and Percentage. ............................................................................................. 10
Table 5: Hardscape Count and Percentage. ............................................................................................ 11
Table 6: Observations. .......................................................................................................................... 11
Table 7: Top 10 Replacement values by species. .................................................................................... 14
Table 8: Recommended Maintenance.................................................................................................... 24
Table 9: Cost of priority maintenance. ................................................................................................... 42
Table 10: Recurring cost of proactive maintenance. ............................................................................... 42

List of Appendices
A. Species Frequency List
B. Suggested Species List for New Plantings
C. Five-year Budget
Executive Summary
ArborPro, Inc. developed this plan for the City of Walla Walla, Washington with a focus on both the
present and future tree management needs of the City. ArborPro completed a street tree inventory to
better understand the current state of the urban forest and to create a framework for future tree care and
maintenance planning. This Urban Forest Management Plan was developed by analyzing tree inventory
data in relation to the City’s current and future urban forestry goals. In addition to maintenance and
planning needs, this report addresses the economic, environmental, and social benefits that trees provide
to the city of Walla Walla.
Along with the newly updated and collected street tree inventory data this plan also incorporates data
from parks, a golf course and cemetery in the calculation of environmental benefits. This data was
supplied by the City and was not updated by ArborPro as part of the most recent inventory.

Significant Findings from the 2021 Inventory
The Winter 2021 tree inventory included trees, stumps, and vacant planting sites within the City along
public street rights-of-way (ROW). A total of 10,332 sites were recorded during the inventory which
included 7,965 trees (77.09%), 180 stumps and snags (1.74%), and 2,187 vacant sites (21.17%).
The five most common species found in Walla Walla are: Cornus florida (984 trees: 12.08%); Pyrus
calleryana (727 trees: 8.93%); Acer platanoides (548 trees: 6.73%); Malus species (436 trees: 5.35%);
Platanus x acerifolia (327 trees: 4.01%).
The three most common small trees (00-03” DBH) are: Cornus florida (238 trees); Pyrus calleryana (and
cultivars) (147); and Malus species and cultivar (62 trees).
The three most common large trees (over 25” DBH) are: Platanus x acerifolia (277 trees); Acer
saccharinum (190 trees); and Acer platanoides (148 trees).
A total of 174 distinct species of trees were recorded during the inventory.
69 % of Walla Walla’s tree population is in “good” or better condition.
Trees provide approximately $53,874.39 in annual environmental benefits.1*
Total Environmental Benefits
Tree Cover: 113.5 acres.
Stormwater interception: valued at $13,800/year.
Carbon sequestration: valued at $19,800/year.
Carbon Storage: valued at $1,860,000.
Pollution Removal: $20,300/year.

Total replacement cost for all trees is $40,800,000.

1
 Environmental Benefits are for trees inventoried in 2021 and Park, Cemetery and Golf Course data, supplied by the City of
Walla Walla.

1
Tree Maintenance Needs
Maintenance recommendations recorded during the tree inventory were tree removal (2%), pruning
(75%), stump removal (2%), and planting (21%).
While tree maintenance can be costly and time consuming, the benefits that trees provide justify the
expense. Proper pruning and regular maintenance help ensure that trees are providing maximum benefits
throughout their life span. In addition to maximizing benefits, regular maintenance mitigates tree-related
risk by removing hazardous limbs; reducing future storm damage clean-up; removing limb conflicts
with sidewalks and roadways; improving the overall appearance of urban trees; and promoting proper
growth patterns in small trees. Trees that pose the highest risk (Priority 1 removals and Priority 1
prunes) should be addressed first to properly mitigate risk and prioritize maintenance. After all Priority 1
maintenance has been completed, the Priority 2 removals and Priority 2 pruning should be addressed.
Several high-risk trees (Priority 1 Prune and Priority 1 Removal) were recorded during the inventory.
These should be pruned or removed soon to ensure public safety. Table 1 summarizes the number of
removals and pruning recommended.

                                           Priority 1 Removal = 69 trees
                        Tree Removal
                                           Priority 2 Removal = 152 trees
                           Priority        Priority 1 Prune = 44 trees
                          Pruning          Priority 2 Prune = 334 trees
                          Proactive        Routine Prune = 4,647 trees
                          Pruning          Training Prune = 2,725 trees
                                      Table 1: Tree Pruning and Removal Totals

A routine pruning cycle ensures that trees are inspected and pruned on a regular basis. The length of this
cycle may vary depending on budget and tree maintenance needs, but a five-year cycle is recommended
for established trees. For small trees, a three-year, tree training cycle is recommended to improve the
structure, form, and vitality of these trees. The City of Walla Walla has implemented a cyclical pruning
strategy with a 5–7-year pruning cycle goal. All the information pertaining to priority and routine
maintenance are recommendations that can be used to determine the cost and feasibility of completing
the prescribed work.
Maintaining a proactive pruning and tree training cycle means that small trees are pruned every three
years to correct structural issues and promote natural form while established trees are pruned every five
years to encourage a natural tree form suitable for the species and address other issues such as deadwood
or clearance conflicts. Walla Walla has a considerable number of small trees that would benefit greatly
from a 3-year pruning cycle. Proper small tree pruning will reduce structural defects and maintenance
needs as trees mature and become established. Investing the time and money to address these issues
while trees are young and small will reduce future pruning costs and help ensure the longevity of newly
planted trees. This report will later discuss long term planning and maintenance cycles.

2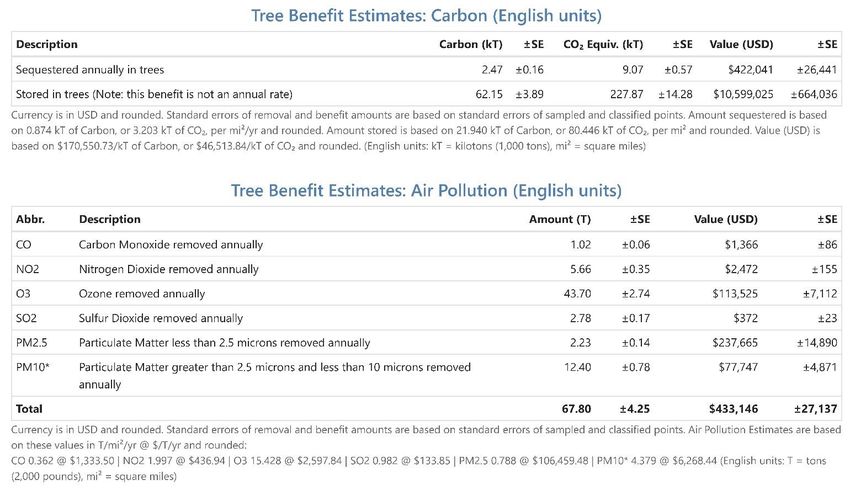
In addition to regular maintenance, tree planting is an important part of a comprehensive Urban Forest
Management Plan. Adding new trees to the landscape is necessary to promote canopy growth, offset loss
of trees due to natural mortality and other causes, and to increase biodiversity.

Introduction
The City of Walla Walla is home to more than 34,000 full-time residents. The City is responsible for
maintaining thousands of trees in parks, public spaces, and along street Rights-of-Way. The City of
Walla Walla is rich in both cultural and natural resources. Walla Walla has been a Tree City USA for
more than 28 years and continues to show a dedication to preserving and improving its urban forest.

Approach to Tree Management
The best approach to successfully managing an urban forest is to implement a proactive, organized
program that sets goals and monitor’s progress. The first steps in this process are to complete a tree
inventory and prioritize maintenance to guide short and long term planning. The City can utilize these
tools to establish tree care priorities; generate strategic planting plans; draft cost-effective budgets based
on projected needs; and ultimately reduce to a minimum the need for costly, reactive solutions to
emergency situations.
In the winter of 2021, The City of Walla Walla contracted with ArborPro to conduct a comprehensive
street tree inventory update and develop an updated Urban Forest Management Plan. This plan considers
the size characteristics, condition, and species distribution of the inventoried trees and provides a
prioritized system for maintaining all trees within the
survey area. The following tasks were completed:
                                                                   The Urban Forestry Management
Inventory of trees, stumps, and vacant sites along street          Plan addresses:
ROWs. Analysis of tree inventory data. Development of a
                                                                     •   Results of the inventory.
plan that prioritizes the recommended tree maintenance.
                                                                     •   Benefits of a healthy urban
Trees are an important part of a community’s green                       forest.
infrastructure — as essential as roads, bridges, or sewer         •      Prioritization of tree
mains. But trees, unlike other types of infrastructure,                  maintenance.
perform better and gain value over time. They are the only        •      Short and long term goals.
infrastructure that improves with age. An Urban Forestry
Management Plan, like a stormwater, street, or sewer management plan, protects an important
infrastructure on which the City depends. The Urban Forestry Management Plan outlines how Walla
Walla will protect and care for one component of its green infrastructure — its trees. The Management
Plan is divided into three sections:

Section 1: Highlights and Results of Inventory Data
Section 2: Benefits of a Healthy Urban Forest and Community Survey Results
Section 3: Tree Management

3
Section 1: Highlights and Results of Inventory Data
In the winter of 2021, ArborPro, Inc. assigned ISA Certified Arborists to inventory trees and vacant sites
along City street rights-of-way. A total of 10,332 sites were collected within the City of Walla Walla,
which includes 7,965 trees (77.09%), 180 stumps and snags (1.74%), and 2,187 vacant sites (21.17%).

Methods of Data Collection
Tree inventory data were collected using ArborPro’s proprietary software. The software, ArborPro
version 3.5.1, is loaded on pen-based tablets, equipped with geographic information systems (GIS), and
uses both aerial imagery and global positioning system (GPS).
The following data fields were collected at each tree location:

                          •   address               •   clearance
                          •   condition             •   parkway type and size
                          •   hardscape damage      •   tree height
                          •   mapping coordinates   •   recommended maintanence
                          •   notes                 •   side (front, side or rear)
                          •   observations          •   site number
                          •   tree diameter         •   species

Assessment of Tree Inventory Data
Professional judgment based on experience and industry standards is used to determine maintenance
recommendations during the data collection process. Data analysis is then used to summarize and
generalize the state of the inventoried urban forest. Understanding and recognizing this information will
help guide short and long term management planning. This section of the management plan summarizes
the following criteria of the inventoried tree population:
                                            Size characteristics
                                               Tree condition
                                       Species and genus distribution.

Size Characteristics
A tree’s general size provides insight into its age and value as well as the overall age of the urban forest.
The two industry-wide recognized size characteristics are height and diameter at breast height. While
height is self-explanatory, diameter at breast height (DBH) is determined by the measuring the diameter
of the tree at 4.5 feet above grade. DBH range distribution can be used as a proxy to analyze the relative
age distribution of an urban forest. Due to the lack of data regarding the DBH growth rate of various
species in any given location utilizing DBH as proxy for age is one approach. It is understood that while
the age/diameter relationship is generally consistent within a species the relationship is not the same for
all species. There are many factors affecting DBH growth rate and while not ideal, it is a metric from
which age can be inferred. This allows the City to adjust their planting plans to ensure that there are enough
young trees to replace aging and over-mature trees. It is important that all age classes are adequately
represented throughout the urban forest to ensure a healthy, vibrant tree canopy for future generations.
Figure 1 illustrates the distribution of the City of Walla Walla’s trees by diameter class while Figure 2
shows the distribution of its trees by height class.
4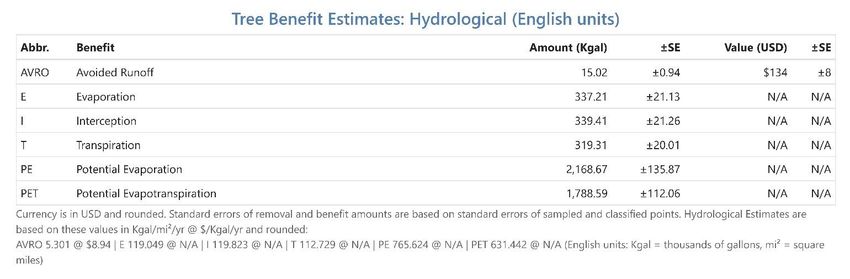
Diameter at Breast Height
                                                                             in Inches
                                         3,000
                                                                               2,525
                                         2,500
                      Number of Trees
                                         2,000
                                                                      1,609
                                         1,500                1,329
                                                                                       1,185
                                         1,000
                                                                                                535
                                                    500                                                 332                     237
                                                                                                                  210   183
                                                      0
                                                              00-03 04-06 07-12 13-18 19-24 25-30 31-36 37-42                   43+
                                                                                   Diameter at Breast Height

                                                                       Figure 1: Diameter class distribution.

                                                                            Tree Height in Feet
                                                    3,500                        3,156
                                                    3,000

                                                    2,500
                                  Number of Trees

                                                                  2,068
                                                    2,000
                                                                                               1,425
                                                    1,500

                                                    1,000                                                        724      772

                                                     500

                                                          0
                                                                  00-15          15-30         30-45          45-60       60+
                                                                                          Height in Feet

                                                                          Figure 2: Height class distribution.

Discussion
As the above graphs show, Walla Walla has a desirable distribution of size classes within the street tree
population. The diameter distribution is somewhat skewed towards small to semi-mature trees. While
this is not entirely ideal, the smaller to semi-mature trees will grow over time to provide a healthy
mature canopy, if effectively managed. While adding new trees will result in an increased ratio of small
to larger trees ArborPro nonetheless recommends continuing to plant new trees to further improve
canopy cover and air quality.

5
Tree Condition
Not necessarily about desirability, tree condition is a subjective, qualitative representation of overall
health, vigor, and structure. Likewise, appearance is not a complete indication of overall condition.
Table 2 and Figure 3 show the number of trees recorded in each condition category as well as the
percentage of the total population that they represent.
Excellent – The tree has no structural problems, no damage from diseases or pests; no mechanical
damage; a full, balanced crown; and normal twig
condition and vigor for its species. Trees in this category CONDITION COUNT PERCENTAGE
are 95-100% healthy.                                        Excellent              86          1.06%
                                                            Very Good             336          4.13%
Very Good – The tree has no structural problems, no         Good               5,058          62.10%
significant damage from diseases or pests; no mechanical    Fair               1,985          24.37%
damage; a full, balanced crown; and normal twig             Poor                  470          5.77%
condition and vigor for its species. Trees in this category Critical                5          0.06%
are 90-95% healthy.                                         Dead                   31          0.38%
Good – The tree has no major structural problems, no        Stump                 174          2.14%
significant damage from diseases or pests; no significant              Table 2: Tree Condition & Percentage of
                                                                                      Population.
mechanical damage; a full, balanced crown; and normal twig
condition and vigor for its species. Trees in this category are
80-90% healthy.
Fair – The tree may exhibit the following characteristics: minor structural problems and/or mechanical
damage; significant damage from non-fatal or disfiguring diseases; minor crown imbalance or thin
crown; minor structural imbalance; or stunted growth compared to adjacent trees of the same species.
Trees in this category are 60-80% healthy.
Poor – A tree can appear healthy but may have structural defects. This classification also includes
healthy trees that have unbalanced structures or have been topped. Trees in this category may also have
severe mechanical damage, decay, severe crown dieback or poor vigor/failure to thrive. Trees in this
category are 40-60% healthy.
Critical – The tree is in a physical state that requires immediate attention. Generally, these trees are
recommended for removal.
Dead – This category refers only to trees that are completely dead. Trees in advanced states of decline
that are still alive are generally recorded as poor or critical, not dead.
Stump – Stumps included interfere with pedestrian traffic or pose a tripping hazard. Stumps are not
included in dead tree count.

6
Tree Condition
6,000
62.10%
5,000
Number of Trees
4,000
3,000
24.37%
2,000
1,000 4.13% 5.77%
1.06% 0.06% 0.38% 2.14%
0
Very
Excellent Good Fair Poor Critical Dead Stump
Good
COUNT 86 336 5,058 1,985 470 5 31 174
Condition and Count
Figure 3: Tree condition by count and percentage.
Discussion
Most of the trees in Walla Walla (69%) were observed to be in Good or better condition at the time of
the inventory. This number excludes stumps and vacant sites and is used only to compare the condition
of trees recorded in the inventory. Therefore, the overall health and condition of the City’s trees would
be rated as Good. Additionally, approximately 6.1% of the City’s trees are in poor condition; and less
than another 1% are in critical or dead condition. Figure 4 shows the maintenance recommendations by
condition.
Maintenance by Condition
6,000
Number of Trees
5,000
4,000
3,000
2,000
1,000
0
Very
Excellent Good Fair Poor Critical Dead Stump
Good
Prune 86 336 5,042 1,950 336 0 0 0
Remove 0 0 16 35 134 5 31 174
Work Type and Count
Figure 4: Maintenance recommendations by condition.
7Species and Genus Distribution
Understanding species and genus distribution is important when determining which species should be
planted and which ones are currently over-represented in the urban forest. Biodiversity is extremely
important to the overall health and longevity of a tree population. The accepted guideline for urban
biodiversity is the 10-20-30 rule. This means that no species should represent more than 10%, no genus
should represent more than 20%, and no family should represent more than 30% of the total tree
population. Figure 5 shows the distribution of trees representing 2% or more of the total tree population.
1200
12.36%
1000
800 9.13%
Number of Trees
600 6.88%
5.47%
400 4.11% 4.03%
3.44%
3.01% 2.72% 2.62%
200
0
Cornus Pyrus Acer Malus Platanus x Acer x Prunus Acer Liquidambar
Acer rubrum
florida calleryana platanoides species acerifolia freemanii domestica saccharinum styraciflua
Count 984 727 548 436 327 321 274 240 217 209
Figure 5: Tree distribution by percentage over 2%.
Table 3 contains the top ten genera distribution of trees recorded in Walla Walla by count and
percentage of the total tree population. A full species frequency report can be found in Appendix A.
Rank Genus Percentage Count
1 Acer 21.90% 1,744
2 Cornus 13.70% 1,091
3 Pyrus 10.23% 815
4 Fraxinus 7.29% 581
5 Prunus 6.99% 557
6 Malus 5.52% 440
7 Platanus 4.13% 329
8 Liquidambar 2.62% 209
9 Cercis 2.57% 205
10 Amelanchier 2.35% 187
Table 3: Ten most common genera by percentage and count of total population.
8Li quidambar Top 10 Species
s tyra ci flua, 209
Acer rubrum, 217
Cornus florida,
Acer s a ccharinum, 984
240
Prunus domestica,
274
Acer x freemanii ,
321
Pyrus ca l leryana,
Pl a tanus x
727
a ceri folia, 327
Ma l us species,
Acer plantanoides,
436
548
Figure 6 Top Ten Species.
Discussion
The City of Walla Walla maintains 174 distinct species of street trees. The distribution of these trees
across species, genus, and family trends toward ideal and could be improved over time. ArborPro
recommends the City of Walla Walla reduce or discontinue the planting of dogwoods (Cornus) as they
exceed the recommended 10% threshold for a particular species. Approaching the 10% limit are
Ornamental pear (Pyrus) and these trees also should be of limited use. Additionally, the genus Acer
(maples) can be considered overrepresented throughout the City. Maples make up 22% of the total tree
population, exceeding the recommended limit of 20% for a particular genus. While it is common for
most cities to have an excess of certain species, it leaves Walla Walla susceptible to future outbreaks of
insects and diseases. This risk can be mitigated by analyzing the current list of species being planted by
the City and focusing on species that do well in the area while actively promoting biodiversity in the
landscape. A list of recommended tree species developed by the city for future plantings can be found in
Appendix B.
Clearance and Hardscape Analysis
Many of the street trees encroach on clearance envelopes and these were documented as part of the
inventory. A total of 1,597 trees were in violation of clearance criteria at the time of the inventory. Two
categories make up most clearance issues those being “Vehicle” and “Pedestrian and Vehicle” with a
total of 1,233 trees.
Hardscape damage is a common occurrence in urban tree populations. Walla Walla has its share of trees
that are adjacent to damaged hardscape. More than 16% of trees were identified as causing hardscape
damage.
9Below figure 7 and table 4 summarize clearance conflicts, while figure 8 and table 5 summarize
hardscape conflicts.
Clearance Conflicts
700 649
584
Number of Conflicts
600
500
400
300 236
200
100 42 31 18 17 19
1
0
Conflict Category
Figure 7: Count of Clearance by Category.
Clearance Count % of Pop
Building 42 0.53%
Light 31 0.39%
Line of Sight 1 0.01%
Multiple 18 0.23%
Pedestrian 236 2.96%
Pedestrian and Vehicle 584 7.33%
Sign 17 0.21%
Stop/Safety Sign/Signal 19 0.24%
Vehicle 649 8.15%
Totals 1,597 20.05%
Table 4: Clearance Count and Percentage.
10Hardscape Damage
10,000
8,634
9,000
8,000
Number of Locations
7,000
6,000
5,000
4,000
3,000
1,698
2,000
1,000
0
Yes No Damage
Damage Present
Figure 8: Hardscape Damage Count.
Hardscape Count % of Pop
Yes 1,698 16.43%
No Damage 8,634 83.57%
Totals 10,332 100.00%
Table 5: Hardscape Count and Percentage.
Observations
There are times when the typical data collected benefits from an additional observation. These are
situations that do not fit into the traditional data fields and additional information would be helpful to the
tree manager. A total of 2,845 trees warranted an observation during the inventory. Trees that have been
topped and trees needed deadwood removal are the most numerous observations with 308 topped trees
and 227 needing deadwood removed. Table 6 and Figure 9 below provide counts multiple categories.
Rank Observation Count
1 Previously Topped 308
2 Deadwood/Clean 227
3 Raise 169
4 Remove Stub(s) 147
5 Decay 138
6 Pruned for Utilities 100
7 Sheared/Shaped 98
8 Leaning 91
Table 6: Observations.
11Observations
350 308
300
250 227
Frequency
200 169
147 138
150 100 98 91
100
50
0
Observation
Figure 9: Observations.
12Section 2: Benefits of a Healthy Urban Forest Trees provide a host of environmental, social, and economic benefits in urban areas. When properly maintained, trees can reduce pollution, divert stormwater runoff, and lower energy costs. The benefits trees provide can offset the cost associated with tree maintenance. A properly implemented tree maintenance program will maximize tree benefits in the urban setting, allowing trees to provide benefits that meet or exceed the time and money invested in maintenance activities. The i-Tree Eco application was used to quantify the benefits provided by Walla Walla’s trees. This application uses growth and benefit models designed around predominant urban trees to calculate the specific benefits that trees provide in dollar amounts. The benefits calculated by i-Tree Eco include air quality improvements, carbon dioxide (CO2) sequestration, carbon dioxide (CO2) storage, stormwater control, and structural value. The i-Tree annual benefit reports demonstrate the value urban trees provide to the surrounding community. Air Quality Trees improve air quality by removing several pollutants from the atmosphere, including ozone, nitrogen dioxide, and particulate matter. The estimated value of pollutant removal by the inventoried tree population each year is $20,269. Carbon Dioxide Sequestration It is well known that trees absorb carbon dioxide and release oxygen into the atmosphere as a product of photosynthesis. Carbon absorbed during this process is ultimately stored in the wood of trees. The amount of carbon sequestered by the inventoried tree population is valued at $19,793 annually. Stormwater Control Trees reduce the costs associated with diverting stormwater by intercepting rainfall before it hits the ground and enters the storm runoff system. This greatly reduces the strain placed on public stormwater runoff systems. This can represent a significant monetary savings; the amount of infrastructure needed to divert stormwater throughout the City is reduced. The estimated savings for the City in the management of stormwater runoff is $13,812 annually. Total Replacement Value In addition to environmental benefits, the City can consider the total replacement value for its urban forest. Total replacement value is the amount of money it would take to completely replace the existing urban forest with trees of the same size. While this is a scenario that will likely never happen, it gives the City the specific dollar value of its trees in their current state. Replacement value differs from environmental benefits in that it shows how much the trees are worth instead of the dollar values that they provide in benefits. For example, Platanus x acerifolia trees provide $6,950.00 in annual environmental benefits and store $336,177.00 of carbon and the total cost of replacing the Platanus x acerifolia trees would be $6,290,907. According to i-Tree Eco, the total replacement cost for Walla Walla’s trees is $40,800,000. Table 7 shows the breakdown of replacement value for the top ten valued species. 13
Species                    Count Structural Value
                                                      Acer plantanoides          1,039 6,440,807.41
                                                      Platanus x acerifolia        407 6,290,907.11
                                                      Robinia pseudoacacia         456 4,158,044.08
                                                      Acer saccharum               199 3,373,519.09
                                                      Acer saccharinum             352 2,315,113.90
                                                      Tilia cordata                377 1,061,950.61
                                                      Cornus florida             1,112 1,032,501.15
                                                      Liquidambar styraciflua      282     977,951.78
                                                      Pyrus calleryana             727     855,306.32
                                                      Malus species                551     854,816.87
                                                      Total                      5,502 27,360,918.32

                                                         Table 7: Top 10 Replacement values by species.

Community Survey
Community input and feedback is important to the city of Walla Walla. A 17-question online survey was
created to gather information from the residents. The survey ran for approximately 8 weeks in April and
May 2021. There were over 400 responses for many of the questions. Please note not all respondents
replied to all questions. The survey results are shown in the charts and tables below.
Question 1.
What do you think about the condition Walla Walla urban forest?

                                                   What do you think about the condition of
                                                       the Walla Walla urban forest?
                                             250
                                                                          48%
                     Number of Respondents

                                             200
                                                                                           36%

                                             150

                                             100
                                                         11%
                                              50                                                          5%

                                               0
                                                      Exceptional         Good              Fair          Poor
                                             Count        52              221               167           24

14
Question 2.
Should the city invest in more trees?
Should the city invest in more trees?
400 78%
350
Number of Respondents
300
250
200
150
19%
100
50 3%
0
Stop Spending on
Yes No
Trees
Count 362 87 15
Question 3.
Have you ever contacted the city arborist or other city department about trees?
Have you ever contacted the city arborist or
other city department about trees?
350 71.6%
300
Number of Respondents
250
200
150 28.4%
100
50
0
Yes No
Count 132 332
15Question 4.
How would you rate your experience with city employees when seeking information about trees?
How would you rate your experience with
city employees when seeking information
about trees?
180 36.9%
Number of Respondents
160 30.0%
140
120
100
80 15.1% 15.1%
60
40
3.0%
20
0
Excellent Good Fair Poor No Answer
Count 70 139 70 14 171
Question 5.
What type of care do you believe city trees receive?
What type of care do you believe city trees
receive?
250 51%
Number of Respondents
200
150 27%
100
14%
50
4% 4%
0
Excellent Good Fair Poor No Answer
Count 66 235 127 18 18
16Question 6.
Do you think Walla Walla spends the appropriate amount of money to care for the trees?
6) Do you think Walla Walla spends the
appropriate amount of money to care for
the trees?
200 41%
180
NUmber of Respondents
160
140 27%
120
100 19%
80 14%
60
40
20
0
Yes No I don't know No Answer
Count 189 124 88 63
Question 7.
Are you aware of the Parks, Recreation and Urban Forestry Board and their activities?
7) Are you aware of the Parks, Recreation
and Urban Forestry Board and their
activities?
250 50%
Number of Respondents
41%
200
150
100
50 7%
2% 0%
0
Follow Pretty
Somewhat Not at All No Answer
Closely Familiar
Count 11 231 31 189 2
17Question 8.
Have you read the city’s Urban Forestry Management Plan?
8) Have you read the city's Urban Forestry
Management Plan?
450 89%
400
NUmber of Respondents
350
300
250
200
150
100
10%
50 1%
0
Yes No No Answer
Count 47 412 5
Question 9.
Have you ever consulted the city's municipal code on trees?
Have you ever consulted the city's municipal
code on trees?
350 68%
300
Number of Respondents
250
200
31%
150
100
50
1%
0
Yes No No Answer
Count 144 317 3
18Question 10.
Do you think the Walla Walla Urban Forest is valuable to the city?
Do you think the Walla Walla Urban Forest is
valuable to the city?
450 91%
400
Number of Respondents
350
300
250
200
150
100
8%
50 1% 1%
0
Definitely Somewhat Not Really No Answer
Count 420 36 3 5
Question 11.
Do you think the city should have more tree related events?
Do you think the city should have more tree
related events?
350
67%
300
Number of Respondents
250
200
150 28%
100
50 5%
0
Yes No No Answer
Count 310 132 22
19Question 12.
Please select the most important benefits of trees to you (may select one or more).
Please select the most important benefits of
trees to you (may select one or more).
400 366 354 340
350 314
Number of Respondents
289 284
300 236
250 207
200
150
100
50
0
Benefit Category
Energy conservation (shade) 366
Wildlife habitat (nest sites,food, cover) 354
Air quality 340
Appearance /Community enhancements 314
Human health 289
Water quality improvement (rainfall interception, reduced erosion) 284
Carbon Sequestration and climate change benefits 236
Increased property value 207
Question 13.
Please tell us the most important threats to trees in Walla Walla (i.e., Lack of care, drought, pests,
disease, vandals, etc.)
As can be seen below, the residents who responded believe that “lack of care” is the most important
threat to the Urban Forest in Walla Walla. This is a good indication that residents realize trees require
regular attention and that investments made in tree care are worthwhile. This sentiment dovetails nicely
with the replies in questions Nos. 2, 5 and 10 all of which relate to the importance and value of the
Urban Forest to the people of the City of Walla Walla.
20Please tell us the most important threats to
trees in Walla Walla.
90 43.2%
80
Number of Respondents
70
60
50 22.2%
40 16.2%
30
10.3%
20 8.1%
10
0
Lack of
Disease Pests Drought Vandals
Care
Count 80 41 30 19 15
Question 14.
Would you be interested in taking part in either of the following in the future?
There was a total of 268 responses to question 14. Respondents could choose more than one answer.
As seen in the chart below many residents would like the opportunity to plant trees.
14) Would you be interested in taking part in
either of the following in the future?
Arbor Da y
Cel ebrations,
Tree Education 136
Cl a sses, 123
Community
Tree Pl anting,
180
21Question 15.
Do you live in Walla Walla?
Do you live in Walla Walla?
450
85%
400
Number of Respondents
350
300
250
200
150
100 14%
50
1%
0
Yes No No Answer
Count 396 65 3
Question 16.
If yes, what ward do you live in?
If yes, what ward do you live in?
140
26%
120
Number of Respondents
22%
100 20%
80
13% 13%
60
40 6%
20
0
No
East West South Central Unsure
Answer
Count 102 28 119 93 61 61
22Question 17. Is there anything else you would like to tell us? There were over 160 responses to question 17. Most responses were positive in nature with many people stating that they really enjoyed the trees in the community. It is quite clear that many of the residents in the city appreciate trees and all they add to the community. Below are a few quotes from some of the residents. “I lived in Walla Walla for many years and its trees were my favorite part of this beautiful city. Please keep up the good work. I especially love the Chestnut Street corridor of flowering almond in the spring, the grand sycamores in Pioneer Park, and the wonderfully pruned Tietan Park trees. I had a lovely large maple in my small bungalow home front yard. It kept my home cool and comfortable on hot summer days. I also had a lovely pink dogwood which I loved! The flowering dogwoods were delightful all over town. I came back this past weekend to see the flowering trees!” “Our trees set us apart from other communities. They give the neighborhoods charm and other benefits like beauty and environmental benefits. People from other areas say they love Walla Walla. “Many of Walla Walla’s streets are named after trees. Please allow and encourage them to flourish. Some are a century or more old. They speak at night in the wind, in the morning at dawn and provide a solid continual presence I think to all who open themselves to their amazing contributions.” “Do you accept squirrels for relocation?” “It's always better to have more trees!” The survey seems to have been well received and should be helpful in planning events and activities for the citizens of Walla Walla. Many communities have planting events where families create lifelong memories around trees. It is often said that when we plant trees, we are planting them for the benefit of our children’s children. 23
Section 3: Tree Management
The purpose of this Urban Forest Management Plan is to provide a framework for the short and long
term maintenance of Walla Walla’s urban trees. The City has implemented a 5–7-year pruning cycle for
its trees. This section of the Management Plan will detail the maintenance recommendations from the
inventory to prioritize the recommended work. The information contained within this section can be
used to justify funding requests, and to understand the current general maintenance requirements of
Walla Walla’s trees.
It is also important to recognize that the tree inventory data provides a snapshot of Walla Walla’s trees’
current condition and maintenance needs. Prioritized tree maintenance will help reduce the overall risk
of tree related incidents. However, because conditions can change drastically, routine maintenance
should be coupled with the identification and monitoring of trees that may become high risk in the
future. The focus of this report is to identify and mitigate the trees that were deemed maintenance
prioritizations at the time of the inventory while planning through proactive maintenance.

Recommended Maintenance and Tree Risk
A description and summary of the maintenance recommendations for the
entire inventory follows below. As the names imply, Priority 1 pruning,
and removals pose the highest risk and should be dealt with first. Priority 2
pruning and recommended removals should be considered after all Priority
1 pruning and removals have been completed. The remaining trees will be
assigned to either routine pruning or small tree training activities, i.e.,
proactively pruned on a five-year and three-year basis respectively. The
following more thoroughly describes each maintenance recommendation.

The workflow for the initial plan implementation is based on which trees
pose the greatest risk at the time of the inventory. Once these trees have been addressed, the workflow
process can be adjusted to reflect that the new high priority has become Training and Routine pruning
with perhaps stump removal being designated as a low priority activity. The workflow priority is a
dynamic process based on the needs of the community. For instance, storm damaged trees will be a
higher priority than routine or training pruning.
                                                                         Maintenance        Count Percentage
Priority 1 Prune – Trees that require Priority 1 pruning are
                                                                         Priority 1 Removal     69     0.67%
recommended for trimming to remove hazardous deadwood,
                                                                         Priority 1 Prune       44     0.43%
hangers, or broken branches. These trees have broken or hanging
                                                                         Priority 2 Removal    152     1.47%
limbs; hazardous deadwood; and dead, dying, or diseased limbs or
                                                                         Priority 2 Prune      334     3.23%
leaders greater than four inches in diameter.
                                                                         Routine Prune       4,623    44.74%
Priority 1 Removal – Trees designated for removal have defects,          Training Prune      2,749    26.61%
which cannot be cost-effectively or practically treated. Most trees      Stump Removal         174     1.68%
in this category have a large percentage of dead crown and pose an       Total               8,145   100.00%
elevated level of risk for failure. Any hazards that cannot be mitigated Table 8: Recommended Maintenance.
with pruning could be seen as potential dangers to persons or
property. Large dead and dying trees that are high liability risks are included in this category.

24
Priority 2 Prune – Trees that require Priority 2 pruning are recommended for trimming to remove
deadwood, correct structural problems, or resolve clearance issues. These trees do not pose as much risk
as “Priority 1” trees.
Priority 2 Removal – Trees that should be removed but do not pose a liability as great as the “Priority
1” trees will be identified here. This category would need attention as soon as “Priority 1” trees have
been addressed.
Routine Prune – These trees require routine horticultural pruning to correct structural problems or
growth patterns, which may eventually encroach on established clearance envelopes.
Training Prune – Small, up to 20 feet in height and typically a DBH of less than 8”, that will grow to
be large trees must be pruned to correct or eliminate weak, interfering, or objectionable branches to
minimize future maintenance requirements. A person standing on the ground can prune these trees with
a pole-pruner.
Stump Removal – Typically located in high use areas, stumps that interfere with pedestrian traffic and
pose a tripping hazard should be removed. This also includes “snags” which are tall stumps.
Plant Tree – The default recommendation for Vacant Planting sites is “Plant Tree.”
Recommended Maintenance
5,000 44.98%
4,500
4,000
Number of Trees
3,500
3,000 26.37%
2,500
2,000
1,500
1,000
1.47% 3.23% 1.68%
500 0.67% 0.43%
0
Priority 1 Priority 1 Priority 2 Priority 2 Routine Training Stump
Removal Prune Removal Prune Prune Prune Removal
Count 69 44 152 334 4,647 2,725 174
Category and Count
Figure 10: Recommended Maintenance.
25Priority and Proactive Maintenance The City of Walla Walla has recognized the value of its trees to the community. A proactive maintenance schedule has been instituted to maintain that value. The proactive program systematically reduces risk while improving the overall health of urban trees. A proactive program will also help stabilize maintenance budgets and improve long-term planning. In this plan, we chose to use a five-year cycle for routine tree trimming and a three-year cycle for small tree training. As previously explained, this involves pruning each tree assigned a routine prune recommendation every five years while conducting structural pruning on small trees every three years. These activities are considered proactive maintenance while trees in the Priority 1 and Priority 2 categories are priority maintenance. Priority Maintenance Prioritizing maintenance is one of the tree inventory’s main objectives. It allows tree work to be assigned based on observed risk at the time of the inventory and eventually over multiple years. Once prioritized, the work can be approached systematically to mitigate risk by addressing the highest priority trees first. In this plan, all trees designated as Priority 1 prunes and removals will be considered first. Priority 2 prunes and removals will be considered after all Priority 1 trees have been addressed. Trees in the Routine Prune and Small Tree/Training Prune category will be entered into the proactive maintenance schedule. Priority Removals While tree removal is often a last resort, in some situations it cannot be avoided. In parks and other high- use areas, creating a safe environment is more important than preserving hazardous trees that may have a social or cultural significance. Priority removals include Priority 1 and Priority 2 removals identified during the inventory. Figure 11 shows the trees and their respective diameter classes for these two categories. As there are only two removal categories smaller trees are assigned a priority removal if they are dead or have decay. It is a judgement call by the data collector at the time of collection as to whether assign a Priority 1 or Priority 2 removal. 26
Removals by DBH and Type
                                                          45
                                                          40
                                                          35
                 Number of Trees
                                                          30
                                                          25
                                                          20
                                                          15
                                                          10
                                                           5
                                                           0
                                                                 00-03 04-06           07-12     13-18 19-24      25-30     31-36 37-42   43+
                       Priority 2 Removal                           30        38        27        21        14      7        7      5      3
                       Priority 1 Removal                            0        4         4         4         8       15       11     6     17

                                                                         Priority 1 Removal            Priority 2 Removal

                                                                    Figure 11: Priority removals by diameter class.

Trees in the Priority 1 removal category pose a risk that cannot be mitigated through pruning. ArborPro
recommends removing these trees in the first year of the five-year maintenance plan. The inventory
found a total of 69 trees that were assessed to be Priority 1 Removals. Figure 12 shows a breakdown of
the number of Priority 1 removals by diameter class.

                                                                              Priority 1 Removals
                                                     18                                                                            17
                                                     16                                                      15
                                                     14
                                   Number of Trees

                                                     12                                                              11
                                                     10
                                                                                                       8
                                                      8
                                                                                                                              6
                                                      6
                                                                          4        4         4
                                                      4
                                                      2
                                                                0
                                                      0
                                                               00-03 04-06 07-12 13-18 19-24 25-30 31-36 37-42                     43+
                                                                                                   DBH

                                                                    Figure 12: Priority 1 removals by diameter class.

Priority 2 Removals do not pose significant risk to people or property and should not be addressed until
all Priority 1 Removals have been completed. ArborPro recommends removing these trees in the second
year of the five-year maintenance plan. The inventory found a total of 152 Priority 2 Removals. Figure
13 shows a breakdown of Recommended Removals by count and diameter class.

27
Priority 2 Removals
40 38
35
30
30 27
Number of Trees
25 21
20
14
15
10 7 7
5
5 3
0
00-03 04-06 07-12 13-18 19-24 25-30 31-36 37-42 43+
DBH
Figure 13: Priority 2 Removals by diameter class.
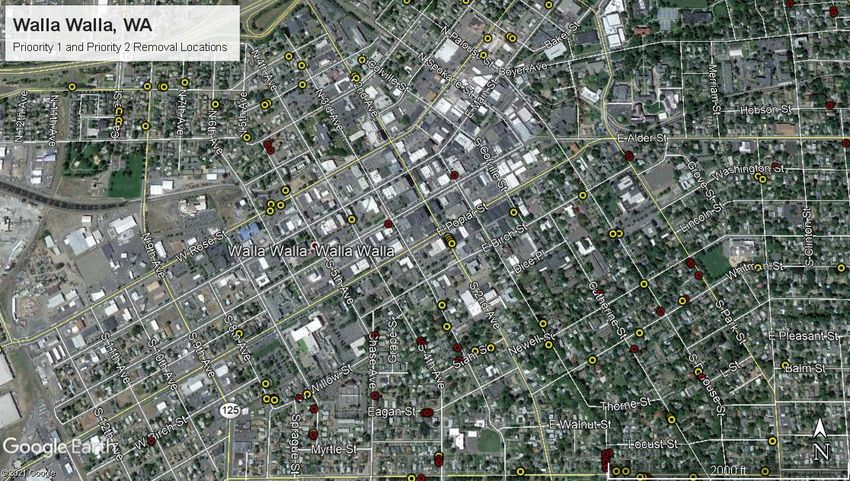
LEGEND
Priority 1 Removal •
Priority 2 Removal •
Figure 14: Location of priority removals.
28Priority Pruning
Priority pruning includes trees in the Priority 1 and Priority 2 category that need to be pruned to mitigate
risk and remove obstructions to sidewalks, roads, etc. Figure 15 shows all the trees and their respective
diameter classes for these two categories.
Priority Pruning by Type and Diameter
100
90
80
Number of Trees
70
60
50
40
30
20
10
0
07-12 13-18 19-24 25-30 31-36 37-42 43+
Priority 2 Prune 16 30 45 66 47 57 73
Priority 1 Prune 1 3 3 8 8 5 16
Figure 15: Priority pruning by diameter class.
Trees in the Priority 1 Prune category pose a risk to public safety that can be mitigated through pruning.
ArborPro recommends pruning these trees in the first year of the five-year maintenance plan. The
inventory found a total of 44 Priority 1 Prunes. Figure 16 shows a breakdown of Priority 1 Prunes by
diameter class and count.
Priority 1 Prune
18 16
16
14
Number of Trees
12
10 8 8
8
6 5
4 3 3
2 1
0
07-12 13-18 19-24 25-30 31-36 37-42 43+
DBH
Figure 16: Priority 1 Prunes by diameter class.
29Trees in the Priority 2 Prune category pose a limited risk to public safety that can be mitigated through
pruning. ArborPro recommends pruning these trees in the second and third year of the five-year
maintenance plan. The inventory found a total of 334 Priority 2 Prunes. Figure 17 shows a breakdown of
the number of Priority 2 Prunes by diameter class.
Priority 2 Prune
80 73
70 66
57
Number of Trees
60
45 47
50
40 30
30
20 16
10
0
07-12 13-18 19-24 25-30 31-36 37-42 43+
DBH
Figure 17: Priority 2 Prunes by diameter class.
Figure 18: Location of Priority 1 Prunes.
30Figure 19: Location of Priority 2 Prunes. 31
Proactive Maintenance
Proactive tree maintenance requires that trees be systematically managed over time. To accomplish this,
trees are placed in a pruning cycle that routinely addresses tree health and form. While it may be costly
to implement a routine pruning cycle, it will reduce both risk and maintenance costs over time.
Maintaining a routine pruning cycle will allow the City to address minor maintenance needs on a regular
basis. Over time, this will reduce the number of emergency situations and will allow the City to
regularly monitor potential problem trees.

                                                     Routine & Small Tree Prunes
                                          3,000

                                          2,500
                      Number of Trees

                                          2,000

                                          1,500

                                          1,000

                                            500

                                              0
                                                   00-03 04-06 07-12 13-18 19-24 25-30 31-36 37-42            43+
                                        Small Tree 1,231 1,090    404      0      0      0      0        0     0
                                        Routine      57    453    2,036 1,090    440    220    129      104   118

                                                  Figure 20: Proactive maintenance by diameter class.

Routine Pruning Cycle
The routine pruning cycle includes all trees entered as a Routine Prune during the inventory. These trees
pose little to no risk but could benefit from regular pruning to mitigate tree-related risk and promote the
form natural for the species. By removing hazardous limbs, the City can reduce future storm damage
clean-up; remove limb conflicts on sidewalks and roadways; improve the overall appearance of urban
trees; and promote proper growth patterns in young trees.
The length of a routine pruning cycle depends on the size of the tree population. ArborPro recommends
a five-year cycle for the trees included in this inventory, i.e., prune approximately one-fifth of the tree
population each year. This number will fluctuate as the City plants and removes trees and completes
priority maintenance, and as young trees grow into maturity. This report and five-year maintenance plan
will only consider trees in the Routine Prune category at the time of the inventory for the routine pruning
cycle.
The 2021 tree inventory found a total of 4,647 trees that would benefit from routine pruning. Therefore,
approximately 929 trees (one-fifth of the total population) will need to be pruned each year, starting in
year four of the five-year maintenance plan. Figure 21 shows a breakdown of Routine Prunes by
diameter class and count.

32
Routine Prunes by Diameter
2,500
2,000
Number of Trees 1,500
1,000
500
0
00-03 04-06 07-12 13-18 19-24 25-30 31-36 37-42 43+
Count 57 453 2,036 1,090 440 220 129 104 118
Figure 21: Routine Prunes by diameter class.
Small Tree Training Cycle
Although the City of Walla Walla has an adequate number of newly
planted trees, planting additional trees will help promote a healthy urban Planting trees is
necessary to increase
forest for years to come. It is also important to remember that older, more
canopy cover and to
mature trees provide the most benefits to the community. The City must
replace trees lost to
promote tree preservation and proactive tree care to ensure older trees
natural causes (expected
survive as long as possible. A typical Urban Forestry objective is to have
to be 1–3% per year).
an uneven-aged distribution of trees at the street, neighborhood, and
citywide levels. ArborPro recommends that Walla Walla support a strong
planting and maintenance program to ensure that young, healthy trees are in place to fill gaps in tree
canopy and provide for gradual succession of older trees. Tree planting and tree care will allow the
distribution to normalize over time.
Trees included in the Small Tree Training Cycle are typically less than 8 inches DBH (though
sometimes larger DBH trees are included) and will benefit from structural pruning and pruning to
promote form true to the species. Young trees tend to have higher growth rate and therefore require a
shorter pruning cycle than mature trees. For this reason, ArborPro recommends a three-year cycle for
young tree training.
Establishing a training cycle for young trees is equally important for Walla Walla’s parks. A significant
amount of money has been spent to plant new trees in many of the parks. Investing time and money to
properly prune these trees will greatly reduce future structural problems and maintenance issues. Figure
22 illustrates the number of trees that would benefit from young tree training.
33You can also read