Waterford Baseline 2015 - Waterford Local Economic & Community Plan 2015-2020 - Waterford Council
←
→
Page content transcription
If your browser does not render page correctly, please read the page content below
Waterford Baseline 2015
  Waterford Local Economic & Community Plan 2015-2020

Prepared by Economic Development Department, Waterford City & County Council, August 2015
While every effort has been taken to ensure the accuracy of this publication, no liability is accepted for any error or omissions.
This report has been compiled using 2011 Census data, which can be viewed online at www.cso.ie unless an alternative data source is referenced. Additional
data is available on StatBank
Waterford Baseline

Contents
Waterford Baseline 2015 .................................................................................................................................................................................................................................................... 1
Key Demographics of Waterford ..................................................................................................................................................................................................................................... 1
Introduction.......................................................................................................................................................................................................................................................................... 2
People & Places .................................................................................................................................................................................................................................................................. 2
People and Population Change ..................................................................................................................................................................................................................................... 3
    Population Projections .................................................................................................................................................................................................................................................. 3
    Dependency .................................................................................................................................................................................................................................................................. 3
Families.................................................................................................................................................................................................................................................................................. 8
Marital Status & Breakdown ............................................................................................................................................................................................................................................ 10
Housing Stock .................................................................................................................................................................................................................................................................... 11
PC Ownership & Internet Access ................................................................................................................................................................................................................................... 14
Sewerage, Heating & Water Supply.............................................................................................................................................................................................................................. 14
Nationality, Ethnicity, Language & Religion ................................................................................................................................................................................................................. 15
Languages ......................................................................................................................................................................................................................................................................... 17
Religion ............................................................................................................................................................................................................................................................................... 17
Education ........................................................................................................................................................................................................................................................................... 18
    Educational Attainment ............................................................................................................................................................................................................................................. 18
    Primary School .............................................................................................................................................................................................................................................................. 20
    Secondary School........................................................................................................................................................................................................................................................ 21
    School Drop Out Rates ............................................................................................................................................................................................................................................... 21
    Third Level Education .................................................................................................................................................................................................................................................. 22
    Waterford Institute of Technology ............................................................................................................................................................................................................................ 22
    WIT: Research & Development ................................................................................................................................................................................................................................. 23
Travel Patterns ................................................................................................................................................................................................................................................................... 23
Health & Well Being .......................................................................................................................................................................................................................................................... 24
    Kavanagh Foley Index of Well Being........................................................................................................................................................................................................................ 24
    Disability ......................................................................................................................................................................................................................................................................... 24
    Carers ............................................................................................................................................................................................................................................................................. 25
Affluence & Deprivation .................................................................................................................................................................................................................................................. 25
    Explanatory Note for Understanding Deprivation Indices .................................................................................................................................................................................... 25
Economic Activity ............................................................................................................................................................................................................................................................. 28
Introduction........................................................................................................................................................................................................................................................................ 29
Employment and Labour Force ..................................................................................................................................................................................................................................... 29
    Explanatory Note for Measuring Unemployment .................................................................................................................................................................................................. 29
    Quarterly National Household Survey ...................................................................................................................................................................................................................... 29
    Census............................................................................................................................................................................................................................................................................ 29
Waterford Baseline Live Register .................................................................................................................................................................................................................................................................. 29 Economic Status ............................................................................................................................................................................................................................................................... 30 PES Job Seekers & Vacancies ................................................................................................................................................................................................................................... 34 Live Register .................................................................................................................................................................................................................................................................. 34 Youth Unemployment ................................................................................................................................................................................................................................................. 35 Quarterly National Household Survey ...................................................................................................................................................................................................................... 35 Occupation & Industry..................................................................................................................................................................................................................................................... 36 Place of Work .................................................................................................................................................................................................................................................................... 37 Socio Economic Status .................................................................................................................................................................................................................................................... 37 Business Demography ...................................................................................................................................................................................................................................................... 38 Explanatory Note ......................................................................................................................................................................................................................................................... 38 Enterprises in the South East Region & Waterford .................................................................................................................................................................................................. 38 Enterprise by Size .......................................................................................................................................................................................................................................................... 39 Enterprises by Sector ................................................................................................................................................................................................................................................... 40 High Potential Start Ups .................................................................................................................................................................................................................................................... 41 Vacancy Rates .................................................................................................................................................................................................................................................................. 42 County Incomes and Regional GDP ............................................................................................................................................................................................................................. 42 Income from employment and disposable household income ......................................................................................................................................................................... 43 Index of Disposable Income per Person .................................................................................................................................................................................................................. 44 Gross Value Added ..................................................................................................................................................................................................................................................... 45 Source of GVA in each Region ................................................................................................................................................................................................................................. 46 Sectors................................................................................................................................................................................................................................................................................. 47 Retail............................................................................................................................................................................................................................................................................... 47 Tourism ........................................................................................................................................................................................................................................................................... 48 Agri Food ....................................................................................................................................................................................................................................................................... 54 Life Sciences ................................................................................................................................................................................................................................................................. 55 Transport Infrastructure .................................................................................................................................................................................................................................................... 56 Port of Waterford ......................................................................................................................................................................................................................................................... 56 Waterford Airport ......................................................................................................................................................................................................................................................... 57 Roads ............................................................................................................................................................................................................................................................................. 58
Waterford Baseline
Key Demographics of Waterford
People & Places
In April 2011, Waterford had a population of 113,795, consisting of Economy
56,464 males and 57,331 females. There was a labour force participation rate of 60%, with 53,514 in the
The population of the Waterford Metropolitan Area as of Census 2011 labour force.
was 65,928. 35,701 were not in the labour force.
There is a high young dependency ratio – 33% with 24,580 people The unemployment rate based on the Principal Economic Status (PES)
under the age of 14. basis was 21.6% compared to 19.0% for the State.
The old dependency ratio is 19.9%, with 14,779 persons aged 65 years The Metropolitan District has the highest unemployment rate at 23.5%.
or older. There are seven unemployment black spots in Waterford City.
The average age in Waterford was 36.9 years. Live register figures for July 2015 were 11,960 which are down 9.4% on
There were 8,644 pre-schoolers, 12,828 primary school children and the same month in 2014.
8,806 secondary school age living in Waterford. In Q2 2015 the unemployment rate for the South East was 12.8%
The number of persons aged 18 years or over was 84,887. compared to 9.9% for the State.
There are 29,924 families in Waterford with 40,397 children. The day time working population of Waterford (resident and non-
There were 5,807 lone parents – 5,026 lone mothers and 781 lone resident) was 36,178.
fathers. 41,942 workers were enumerated in Waterford and 12,196 of these
The average number of children per family was 1.3. worked outside of Waterford.
Marital breakdown was at 10.4% compared to 9.7% nationally. In 2012, there were 4,041 active enterprises in Waterford.
There are 42,335 private households in the area with high levels of In Waterford 90.1% of all enterprises were micro enterprises accounting
home ownership (69.8%). for 23% of employees. There were 15 companies with 150+ employees
Private rented accommodation accounts for 14.7% of households. which account for 32% (7,193) of all employees in Waterford.
11.1% of accommodation is rented from the local authority. The dominant sectors are Wholesale & Retail and Construction.
Non-Irish nationals made up 10.2% of Waterford’s population: UK In Q4 2014, Waterford had a commercial vacancy rate of 13.4%
(3.0%); Poland (2.0%); Other EU (2.2%); Rest of World (2.8%). compared to 12.8% for the State.
9,888 speak a foreign language. In 2012, disposable income for Waterford was €18,610 which is 93.5% of
Of those that speak foreign languages at home, the majority (78.3%) the State’s figure of €19,468.
speak English very well or well. GVA per person for the South East was €23,588 or 68.8% or the State
18.6% have a third level qualification or higher, compared to an figure of €34,308.
average of 24.6% for the State. 19.9% of the State’s GVA from agriculture is earned in the South East.
16.2% have no formal or only primary level education. 65% of GVA in the South East is earned from Market and Non Market
There are 9,873 individuals aged 15+ still at school. Services.
The school dropout rate was 11.3% compared to 9.4% nationally. In 2013, there were 225,000 overseas visitors to Waterford with a spend
The majority (60.1%) considered their health as very good. of €49m.
15,635 reported having a disability which represents 13.7% of In 2012, the estimated aggregate retail sales for Waterford were €393m
Waterford’s population. for comparison and €287m for comparison shopping.
There were a total of 4,823 carers in 2011. The average farm size is 44.7ha which is the largest in Ireland.
The Pobal HP Index classifies Waterford City and Waterford County as Agriculture employs 3,585 farmers and 667 workers.
‘Marginally below Average’ on the Relative Index Score. The Port of Waterford deals with almost 3% of national tonnage.
1Waterford Baseline
Introduction
This socio economic profile has been prepared as part of the process of preparing a Local Economic & Community Plan (LECP) for Waterford and to provide an
evidence base to underpin the objectives and actions outlined in the LECP. Where relevant and available, data will be provided at Municipal District level,
Waterford, the South East and for the State. For electoral purposes Waterford is divided into three Municipal Districts (MD) which are illustrated in the map on
below: Waterford Metropolitan Area, Comeragh and Dungarvan-Lismore.
2People & Places
Waterford Baseline

People and Population Change
Waterford covers a land area of 1,835.57km2. At 62 persons per km2, the population density in Waterford equated to 92.5% of the State average. The
population of Waterford in 2011 was 113,795. The population of Waterford increased 5.4% (5,834) on the previous census with the majority of the increase
happening in Waterford County (4,850). Dungarvan Town experienced a 2.3% increase and Tramore’s population increased by 5.8%.

1. Population of Waterford and Metropolitan Districts 2011
Waterford Metropolitan District              65,928
                                                                                                      Figure 1. Population of Waterford 1911-2011
Dungarvan Lismore                            28,490
Comeragh                                     19,377                      120000
                                                                         100000
Waterford City                                    46,732                  80000
Dungarvan                                          7,991
                                                                          60000
Tramore Town                                       9,722                          1911 1926 1936 1946 1951 1956 1961 1966 1971 1979 1981 1986 1991 1996 2002 2006 2011
Waterford                                        113,795
South East                                       497,578

Population Projections
Population targets have been set for the South East region by the Department of Environment, Heritage and Local Government. Within the region, population
targets are set for each local authority area and for the main urban centres to provide a guide for population growth in the region.

2. Population Targets for Waterford and South East 2016 & 2022
                                 Waterford City            Waterford City &                       Dungarvan                 Waterford County                   South East
                                                               Environs
2016                                 51,000                     56,500                               11,600                        73,223                        542,200
2022                                 55,000                     62,500                               13,400                        79,495                        580,500
Source: Regional Planning Guidelines for the South East 2010-2022

Dependency
Dependency1 ratios give a useful indication of the age structure of the population and are a valuable tool for identifying population change and age
dependency trends for the provision of future services and the planning of future economic and infrastructure needs. Dependency is also an important

1 Dependency is expressed as a percentage of the total population aged between 15 to 64 years. Dependency ratios give a crude indication of the population and are not

entirely precise as variations occur over time in the number of young persons staying on longer in full time education and in the number of persons over 65 continuing to work. The
relative proportions of persons aged 15-64 who are inside and outside of the labour force may also vary over time.

                                                                                                                                                                                 3
Waterford Baseline
determinant of sustainable economies is the ability to retain a healthy working age cohort and to attract inward migration of those of a working age therefore,
an increase in the core working age cohorts is a positive indicator of economic performance and cab be identified in relative age dependency rates.
Dependents are defined for statistical purposes as people outside the normal working age of 15-64. Overall, Waterford has a high young dependency ratio
(children under 14 years) of 33% with 24,580 people aged 14 years or younger. Comeragh Municipal District has the highest young dependency ratio at 36.3%.
In numeric terms, Waterford Metropolitan District has the highest number in this age cohort with 13,839 aged 14 years or younger. A relatively high young
dependency ratio indicates a naturally expanding population, which is generally positive for the long term economic potential of an area. A high young
dependency ratio also has implications in terms of demand for childcare, healthcare and educational services in particular.
The old dependency ratio for Waterford is 19.9% and there is a large cohort of older people living in Waterford (14,779 aged 65+) with varying old dependency
ratios across the Municipal Districts. Waterford Metropolitan District has the lowest old dependency ratio at 19.3% and Dungarvan has the highest at 21.2%.
High levels of old dependency signals areas with relatively greater demands for accessible health services and locally based home care provisions in particular.
3. Dependency Ratios for Municipal Districts, Waterford, South East and State 2011
Electoral Area Young Dependency Population aged 14 Old Dependency Ratio Population aged 65 Total Dependency Ratio
Ratio years or younger years or over
Metropolitan District 31.7% 13,839 19.3% 8,443 51.0%
Dungarvan Lismore 33.9% 6,230 21.2% 3,889 55.1%
Comeragh 36.3% 4,511 19.7% 2,447 56.0%
Waterford 33.0% 24,580 19.9% 14,779 52.9%
South East 33.8% 109,878 19.3% 62,821 53.1%
State 31.9% 17.4% 49.3%
4Waterford Baseline
5Waterford Baseline
6Waterford Baseline
The average age nationally in 2011 was 36.1 years and both Waterford City at 36.7 and Waterford County at 37.1 were just slightly above the national average.
In Waterford County there was a slight difference in the average area in towns (36.4) versus the rural areas (37.4). The average across Waterford was 36.9 years.
Life expectancy at birth was 78.3 for males and 82.7 for females (Source: Irish Life Tables 2010-2012).
Figure 2 shows that in 2011 there were 8,644 pre-school children aged 0-4. The primary school population (aged 5-12) stood at 12,828 in 2011. The secondary
school age group (13-18) had a total population of 8,806.
There was a small drop off in births from a high of 1,954 in 2008. In 2014, there were 1,635 births in Waterford, a decrease of 72 on the previous year (Figure 3).
2000
Figure 2. Persons Aged 18 and under (by single year of age) Waterford 2011
1500
Comeragh
1000
Dungarvan Lismore
500
Waterford Metropolitan Area
0
0 1 2 3 4 5 6 7 8 9 10 11 12 13 14 15 16 17 18
Figure 3. Births by Year - Waterford City and County 1985-2014
2000
1750 Waterford County Waterford City
1500
1250
1000
750
500
250
0
1985 1986 1987 1988 1989 1990 1991 1992 1993 1994 1995 1996 1997 1998 1999 2000 2001 2002 2003 2004 2005 2006 2007 2008 2009 2010 2011 2012 2013 2014
Source: Vital Statistics 2015
7Waterford Baseline
Families
Tables 4, 5, 6, 7 and 8 provide an insight into the composition of families for Waterford. There are 29,924 families2 within the area with a total of 40,397 children.
12,228 families were made up of 2 persons, representing 40.9% of all families in Waterford.
4. Families, family members and children in families by size of family 2011
2 Persons 3 Persons 4 Persons 5 Persons 6 or more Persons Total
No of Families 12,228 6,966 6,351 3,044 1,335 29,924
No of persons in families 24,456 20,898 25,404 15,220 8,460 94,438
No of children in families 3,362 8,568 13,288 9,311 5,868 40,397
Table 5 highlights that there are 8,866 families without children. Of the families with children, one child is the most common (8,726) representing 29.2% of all
families. Families with two children closely followed with 24.6%. The average number of children per family was 1.3 compared to 1.4 nationally.
5. Family Units with children by size and age of children 2011
All children under 15 All children 15 Children both under and Total
or over over 15
Families without children 0 0 0 8,866
Families with 1 child 3,997 4,729 0 8,726
Families with 2 children 3,912 2,258 1,197 7,367
Families with 3 children 1,686 596 1,169 3,451
Families with 4 children 444 132 559 1,135
Families with 5 or more children 85 40 254 379
6. Family units with children by type of family and age of children 2011
Couples with children Lone mothers with children Lone fathers with children
No of families
All children under 15 7,575 2,375 174
All children over 15 5,166 2,033 556
Children under and over 15 2,510 618 51
Total no of family units 15,251 5,026 781
No of children
All children under 15 15,129 3,693 274
All children over 15 8,221 2,797 750
Children under and over 15 7,594 1,789 150
2 A family is defined as a couple with one or more children, a couple without children or a lone parent with one or more children.
8Waterford Baseline
7. Families by Family Cycle 2011
No of families No of family members
Pre family 2,698 5,396
Empty Nest 3,466 6,932
Retired 2,702 5,404
Pre School 3,294 10,275
Early School 3,435 13,016
Pre-Adolescent 3,395 13,504
Adolescent 3,689 14,762
Adult 7,245 25,149
Waterford 29,924 94,438
The number of lone parent families stood at 5,807 of which 5,026 were lone mothers and 781 were lone fathers. According to the CSO Survey on Income &
Living Conditions (2013), those living in households with one adult and one or more children had the highest deprivation rate in 2013 at 63.2%.
The majority of families (24.2%) comprise of adults. Pre School and Early School children were present in a total of 6,729 of 29,924 families (22.5%) while Pre-
Adolescent and Adolescent children were present in 7,084 families (23.7%).
There were 42,335 private households in Waterford of which 10,604 were single person households. Of the 29,924 families in the area, 8,866 were couples with no
children.
9Waterford Baseline
8. Families by Household Type 2011
Households Persons
One Person 10,604 10,604
Husband and Wife 6,494 12,988
Cohabiting Couple 1,716 3,432
Husband, wife and children 12,904 52,533
Cohabiting couple and children 1,510 5,706
Father and Children 682 1,722
Mother and Children 4,303 11,541
Couple and others 469 1,524
Couple, children and others 642 3,280
Father, children and others 62 218
Mother, children and others 373 1,366
Two or more Family Units 381 2,010
Non-family households and relations 940 2,112
Two or more non related persons 1,255 3,225
Waterford 42,335 112,261
Marital Status & Breakdown
Nationally the level of marital breakdown is at 9.7%. Limerick City has the highest rate of
Figure 4. Population Aged 15 yers by Marital
marital breakdown in the country at 13.5%. Waterford has a rate of 10.4% which is slightly
Status Waterford 2011
higher than the national rate. Of the 89,215 persons aged 15 years and over, 35,925 were
Single single, 42,588 were married, 3,216 were separated, 2,323 were divorced and 5,163 were
2% widowed.
4%
6% Married
40%
Separated
(including
deserted)
Divorced
Widowed
48%
10Waterford Baseline
Housing Stock
Tables numbered 9, 10, 11 and 12 analyse housing stock on the basis of household size, type of accommodation, the year the house was built and the type of
occupancy. There were 42,335 private households in Waterford. A two person household3 is the most common in the area, accounting for 29.7% of all
households, followed by one person households with 25% (10,604). The average number of persons per household was 2.7 which is in line with the national figure
of 2.7. The city had a slightly lower occupancy at 2.5 compared to Waterford County at 2.8.
9. Private Household by Size 2011 92.0% of households lived in a
Households Persons House/Bungalow while a further 5.9% lived in
flats, apartments or bedsits.
1 person 10,604 10,604
2 person 12,587 25,174 Waterford has a relatively modern housing
3 person 7,397 22,191 stock with 16,932 households (40%) built in the
4 person 6,726 26,904 previous 20 years (1991 or later). Dungarvan
Lismore has the highest level of older housing
5 person 3,377 16,885
stock accounting for 31.1% of households built
6 person 1,211 7,266 before 1946.
7 person 305 2,135
8 or more persons 128 1,102
Waterford 42,335 112,261
10. Private Households by Type of Accommodation 2011
Households Persons
House/Bungalow 38,960 106,085
Flat/Apartment 2,513 4,108
Bed-Sit 65 145
Caravan/Mobile Home 96 227
Not Stated 701 1,696
Waterford 42,335 112,261
3 A private household is defined as either one person living alone or a group of people living at the same address with common housekeeping arrangements. A household can
contain one or more families.
11Waterford Baseline
11. Permanent Private Households by Year Built 2011
Households Persons
Pre 1919 4,697 10,289
1919 - 1945 2,700 5,957
1946 - 1960 2,795 6,355
1961 -1970 2,794 6,576
1971 - 1980 5,493 14,287
1981 - 1990 4,843 13,863
1991 - 2000 6,316 19,209
2001 - 2005 6,756 19,897
2006 or later 3,860 10,749
Not Stated 1,985 4,852
Figure 5 shows that house completions in Waterford peaked in 2007 at 3,633. 2014 saw a small increase of 21 on the previous year with a total of 232
completions (based on the number of new dwellings connected by ESB networks).
Figure 5. House Completions 1994-2014
Waterford County Waterford City
4000
3000
2000
1000
0
1994 1995 1996 1997 1998 1999 2000 2001 2002 2003 2004 2005 2006 2007 2008 2009 2010 2011 2012 2013 2014
Source: DECLG 2015
12Waterford Baseline
12. Permanent Private Households by Type of Occupancy and Municipal District 2011
Owner Owner Rented from Rented from Rented from Occupied Not Stated Total
occupied occupied no private local voluntary free of rent
with mortgage landlord authority body
mortgage
Waterford Metropolitan 8,245 7,822 4,464 3,368 527 250 396 25,072
Dungarvan Lismore 3,401 4,256 1,333 985 69 217 154 10,415
Comeragh 2,773 2,969 400 337 35 159 79 6,752
Waterford 14,419 15,047 6,197 4,690 631 626 629 42,239
Waterford % 34.1% 35.6% 14.7% 11.1% 1.5% 1.5% 1.5%
South East % 34.5% 38.0% 14.4% 8.9% 1.1% 1.7% 1.3%
State % 26.7% 27.5% 18.5% 7.8% 0.9% 1.5% 1.5%
There is a high level of home ownership in Waterford, with a total of 29,466 homes (69.8%) owner occupied. Figure 6 shows the average asking price for a house
in Waterford City compared to the other urban areas. In Q2 2015, the average asking price in Waterford City was €118,234 compared to €172,167 in Waterford
County. Average house prices in Waterford are lower than the other major urban areas.
Figure 6. Average House Asking Price Private rented accommodation accounted for 14.7% of households
Q1 2014-Q2 2015 while 11.1% of accommodation was rented from the Local Authority.
€300,000
Waterford City East had the highest level of private rented
accommodation (19.5%), while Comeragh had the lowest (5.9%).
€250,000 Waterford City South had high levels of Local Authority Rented
households at 21.2% with a further 4.0% rented from a voluntary body.
€200,000 Department of Environment, Community & Local Government figures
show that as of 31st December 2013 there were 4,096 local authority
€150,000 rented dwellings in Waterford City (2,974) and County (1,122).
The distribution of houses rented from local authorities and voluntary
€100,000 bodies as a percentage of all private households is an indicator of low
income families at risk of poverty and social exclusion.
€50,000 Waterford City Waterford County Figures from DAFT.ie for Q1 2015 show an average monthly rent in
Cork City Limerick City Waterford City of €634 and Waterford County of €584 which compares
Galway City Dublin to a national average of €960. Average rent in Waterford City is lower
€0
Q1 2014 Q2 2014 Q3 2014 Q4 2014 Q1 2015 Q2 2015 than the other major urban areas.
Source Daft.ie
13Waterford Baseline
PC Ownership & Internet Access
High speed broadband is a key enabler for a connected society. Broadband services are essential to our future competitiveness and will be a driving force in
job creation. Broadband usage in Waterford is now at 62.8% compared with 63.8% nationally. 66.4% of city households had broadband compared to 60.1% in
Waterford County. 27.3% of all respondents had no internet connection. Ownership of a computer is an important indicator as it demonstrates the potential
that households have to access and utilise the internet. In Census 2011, of those that replied 30,170 (71.4%) do own a PC which is lower than the national level
of ownership at 74.3%.
Sewerage, Heating & Water Supply
Figure 7. Permanent Private Households by Figure 8. Permanent Private Households by Figure 9. Permanent Private Households by
Central Heating, 2011 Sewerage Facility, 2011 Water Supply, 2011
0% 2%
15% 0%
3% 3% 2%
9%
7% 25% 6%
75%
68%
47%
30%
No central heating Oil Public scheme Public main
Natural gas Electricity Individual septic tank Group scheme with local authority
Coal Peat Other individual treatment Group scheme with private source
Liquid Petroleum Gas Wood Other Other private source
Other Not Stated No sewerage facility None
Not stated Not stated
74.6% of households got their water supply from public mains, with a further 14.8% coming from another private source. 68.6% of households disposed of their
waste using a public sewerage scheme. Of the remaining homes, 24.7% used an individual septic tank. A question on central heating was asked for the first
time in 2011 and almost half (47.3%) responded that they use oil. A further 30.1% used natural gas.
14Waterford Baseline
Nationality, Ethnicity, Language & Religion
13. Usually Resident Population by Place of Birth 2011
Location Ireland UK Poland Other EU 27 Rest of World Not Stated Total
Waterford Metropolitan 54,916 3,743 1,349 1,824 3,367 0 65,199
Dungarvan Lismore 24,189 2,140 688 585 579 0 28,181
Comeragh 17,528 1,259 69 161 267 0 19,284
Waterford 96,633 7,142 2,106 2,570 4,213 0 112,664
Waterford % 85.8% 6.3% 1.9% 2.3% 3.7%
South East % 86.4% 6.1% 2.5% 2.3% 2.6%
State % 83.0% 6.4% 2.5% 3.3% 4.7%
Place of birth provides a strong indicator of longer term migration. The number of Waterford residents who were born outside of Ireland stood at 6,031 or 14.2%
of the population. Of those born outside of Ireland 6.3% were from the UK, 1.9% from Poland, 2.3% from Other EU 27 and 3.7% Rest of World.
Non-Irish nationals living in the area accounted for 10.2% of the total population compared to the national average of 12.0%. 13.0% of Waterford City’s
population were non-nationals, compared to 8.3% in Waterford County. UK nationals (3,605 persons) were the largest group followed by Polish (2,251).
14. Usually Resident Population by Nationality 2011
Location Ireland UK Poland Other EU 27 Rest of World Not Stated Total
Waterford Metropolitan 56,685 1,449 1,816 2,714 881 1,654 65,199
Dungarvan Lismore 25,066 1,275 728 553 330 229 28,181
Comeragh 18,138 676 74 151 132 113 19,284
Waterford 99,889 3,605 2,251 2,520 3,176 1,223 112,664
15Waterford Baseline
Figure 10. Usually Resident Population by Ethnic or
Cultural Background 2011 Figure 11. Usually Resident Population aged 1+ by
Usual Residence One Year Before
2%
1%
8% 1%
1%1% 4% 1%
0%
87%
94%
White Irish White Irish Traveller Other White
Black or Black Irish Asian or Asian Irish Other
Same Address Elsewhere in County
Not Stated Elsewhere in Ireland Outside Ireland
The White Irish population accounted for 87.1% of the population in the Usual residence one year ago provides information on inward migration in
area. 1.4% did not state their ethnicity. The remaining 11.5% was made up the year leading up to the Census. 94% of the usually resident population
of Other White (7.9%), Black or Black Irish (1.3%), Asian or Asian Irish (1.2%), aged 1+ were still living at the same address as they were one year earlier.
Other (0.7%) and White Irish Traveller (0.4%). 3.8% had moved from elsewhere in Waterford in the last 12 months. 1.4%
moved from elsewhere in Ireland while a further 0.8% moved from outside
The Annual Count of Traveller Families produced by the DECLG in 2013 Ireland.
shows that there were 169 Traveller families living in Waterford. 72% of these
resided in accommodation provided by local authority or local authority
assistance.
16Waterford Baseline
Languages
Figure 12. Speakers of Foreign Languages by Language 46,746 persons could speak the Irish language and of these, 15,928 spoke the language daily.
Spoken, 2011 Within the Waterford Gaeltacht, there was a decline in the number of daily Irish speakers from
456 to 438.
A question on foreign languages was asked for the first time in Census 2011 and covered both
11%
foreign languages spoken at home and how well those who spoke other languages could speak
26% English. The results show that 9,888 residents spoke a foreign language and that Polish was the
most common language spoken with 2,182 speakers followed by French and Lithuanian.
Of those who spoke a foreign language at home, the majority (78.3%) indicated that they spoke
61% English very well or well. 1,772 could not speak English well or at all.
2%
Polish French Lithuanian Other
Religion
A question on religion shows that Ireland and Waterford remains predominantly Catholic with
Figure 13. Population by Religion, 2011
over 86% (98,777) declaring themselves as Roman Catholic. A further 7,759 were adherents of
other stated religions (e.g. Church of Ireland, Islam, Presbyterian, Orthodox) while 5,682 persons
indicated they had no religion.
0%
4% 4%
92%
Catholic Other Religion No Religion Not Stated
17Waterford Baseline
Education
The figures and tables on the following pages analyse the educational attainment of residents of Waterford and provide details of education provision in
Waterford. In general Waterford and the South East underperformed compared to the State in educational attainment with a higher proportion of early school
leavers and a lower proportion of the population with a third level degree or higher.
Educational Attainment
Figure 14. Persons aged 15+ by age Education Ceased - Waterford, South East & State 2011
Not stated
21 and over
20
19
Waterford
18
South-East
17
State
16
15
Under 15 years
0.0% 5.0% 10.0% 15.0% 20.0% 25.0% 30.0%
Of those aged 15 years or over whose full time education has ceased, 15.5% were educated to at most primary level; a further 54.6% attained second level
while 25.4% were educated to third level. 23.4% left school aged 16 or younger. 9,873 individuals aged 15+ were still at school in April 2011 with slightly more
females (5,073) compared to males (4,800) still at school.
Figure 15 on the following page compares the educational attainment of Waterford with the South East and the State. In Waterford, 20.9% had a third level
degree or higher compared to 24.6% for the State. Possession of a third level education is an indicator of labour force quality. A skilled and educated workforce
is an essential factor in attracting inward investment. Tertiary education is also a valuable indicator of a populations earning potential. Populations with higher
tertiary educational levels will have higher earning potential and, therefore, should support higher levels of economic activity. 15.5% of residents have no formal
education or only primary education, while a further 18.9% have only achieved a lower secondary level of education.
18Waterford Baseline
Figure 15. Persons aged 15+ by highest level of educational attainment: Waterford, South East &
State 2011
Not stated
Doctorate (Ph.D)
Postgraduate diploma or degree
Honours bachelor degree/professional …
Ordinary bachelor degree/professional… State
Higher certificate
South-East
Advanced certificate/completed apprenticeship
Technical/vocational
Waterford
Upper secondary
Lower secondary
Primary incl. no formal education
0.0% 5.0% 10.0% 15.0% 20.0% 25.0%
A new question on the main field of study of the highest qualification completed to date was asked for the first time in Census 2011. The most popular category
was social sciences, business and law with 6,131 people, representing 29.5% of all respondents, followed by health and welfare with 3,678 (17.7%). Females
dominated social sciences, business and law with 16.9% of all respondents and health and welfare with 14.2% of respondents.
Figure 16. Population Aged 15+ by Field of Study - Waterford, South East & State 2011
Social sciences, business and law
Health and welfare
Engineering, manufacturing and construction
Science, mathematics and computing
Waterford
Education and teacher training
South-East
Humanities and arts
State
Services
Agriculture and veterinary
Other subjects
0.0% 5.0% 10.0% 15.0% 20.0% 25.0% 30.0%
19Waterford Baseline
Primary School
15. Primary Schools and Enrolment Figures in Waterford for 2013-2014 Waterford is served by 77 primary schools comprising both
City County Total mainstream and special schools with a total of 14,214 pupils
Mainstream Schools enrolled in the 2013-2014 academic year. Figure 17 below
No. of mainstream schools 19 55 74 provides a breakdown by type of school and number of pupils.
No. of pupils in mainstream classes 6,102 7,837 13,939 Enrolments in national schools in Waterford have been gradually
increasing year on year since 2003.
No. of classes for pupils with special needs 3 3 6
No. of pupils with special needs 27 24 61
Table 15 shows the number of primary students registered in
mainstream and special needs schools in Waterford City and
Special Needs Schools County in 2014.
No. of Special Schools 2 1 3
No. of pupils in special schools 164 50 214
Source: Department of Education & Skills 2015
Figure 17. National School Pupils in Waterford City & County by School Programme 1995-2014
16000
14000
12000 Pupils in special national schools (County)
10000 Pupils in special national schools (City)
Pupils with special needs in NS (County)
8000
Pupils with special needs NS (City)
6000
Pupils in NS (County)
4000
Pupils in NS (City)
2000
0
Source: Department of Education & Skills 2015
20Waterford Baseline
Secondary School
In Waterford there are 19 secondary schools serving almost 10,000 students. Table 16 provides a breakdown by type of secondary school and the number of
students enrolled in the 2013-2014 academic year.
16. Number of Schools and Pupils Enrolled in Second Level Schools 2013-2014
Secondary VEC Community Total
Schools Pupils Schools Pupils Schools Pupils Schools Pupils
City 8 4,036 2 1,198 0 0 10 5,234
County 5 2,294 3 1,161 1 760 9 4,215
Total 13 6,330 5 2,359 1 760 19 9,449
Source: Department of Education & Skills 2015
School Drop Out Rates
In 2008 there were 1,447 first time enrolments to the first year of the junior cycle programme in second level schools in Waterford City and County. Of the 2008
entry cohort, in the city (95.53%) and county (97.67%) sat the Junior Certificate in 2011 or 2012. 88.68% in the city and 92.8% in the county sat their Leaving
Certificate exams in 2013/2014.
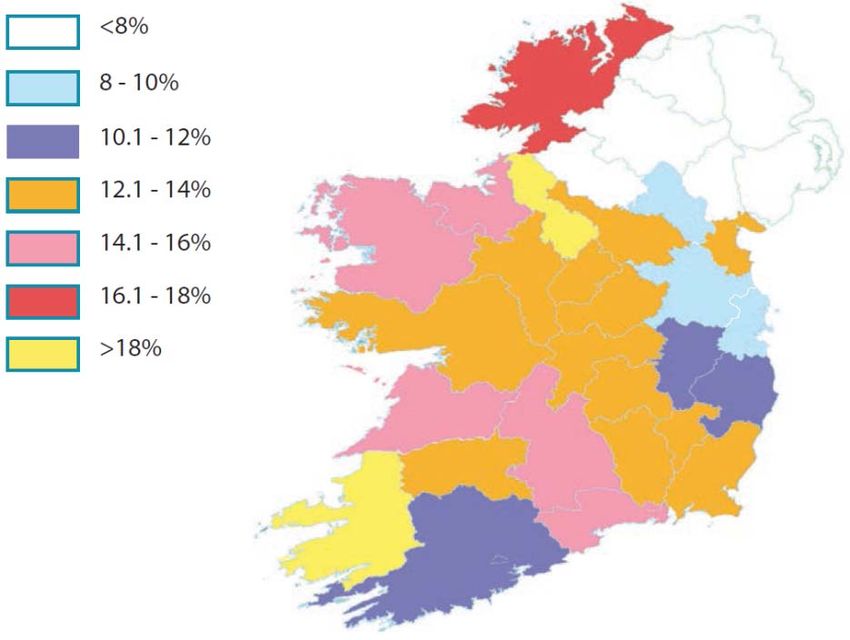
Nationally school dropout rates have reached their lowest levels at 9.4%. Cities generally have non-completion rates above the national average with
Waterford City (11.3%), Galway City (12.5%), Limerick City (13.0%), Dublin City (11.4%) and Cork City (9.8%) not doing the Leaving Certificate. Dropout rates in
DEIS schools, which get extra staff and other supports due to high number of students with social disadvantage, remain higher than the national average of
almost 18%, but the retention rate in DEIS schools is up on previous years.
17. School Drop Out Rates based on 2008 intake
1st years in 2008 Left before Junior Cert Left before Leaving Cert
Waterford City 760 4.5% 11.3%
Waterford County 687 2.3% 7.1%
State 56,075 3.1% 9.4%
Source: Department of Education & Skills (2015)
21Waterford Baseline
Third Level Education
Of the 4,415 students from Waterford attending a HEA institution the 2012-2013 academic year, the majority (60.4%) are attending an Institute of Technology and
a further 36% are attending a University. Table 18 shows the breakdown by institution and for the 2012-2013 academic year.
18. Full time students resident in Waterford by HEA Institution 2012-2013
Male Female Total
University 738 860 1,598
College 31 119 150
Institute of Technology 1,467 1,200 2,667
Total 2.236 2,179 4,415
Source: HEA 2015
Waterford Institute of Technology
In terms of third level education, Waterford is an important centre in the South East region. WIT has an excellent national and international reputation and is an
important contributor to Waterford and the Region through both direct and indirect employment. In 2015, WIT had 10,000 full time and part time students and
1,000 staff. Based on the 2012-2013 figures there were 6,541 Irish domiciled full time students attending Waterford Institute of Technology. Of these 2,256 (34.5%)
were from Waterford. Of the 2,045 new under graduates in WIT in 2013, 23% were studying ‘Social science, business and law’, and a further 22.7% were studying
‘Health & Welfare’. The next most popular field of study is ‘Science, Mathematics and Computing’ with 16.7% undertaking study in this area.
Figure 18. County of Permanent Residence of WIT Students Figure 19. Full Time Under Graduate New Entrants in WIT by Field
2012-2013 of Study 2013
500
Kerry 450
Galway 400
350 M F
Offaly 300
Limerick 250
Carlow 200
Dublin 150
Laois 100
Kildare 50
0
Wicklow
Cork
Tipperary
Kilkenny
Wexford
Waterford
0 500 1000 1500 2000 2500
Source: HEA 2015
22Waterford Baseline
WIT: Research & Development Figure 20. WIT Research Funding by Agency 2013-2014
In 2013-2014, WIT expended €20.5m in research. €113.1m was secured in
research funding awards (Figure 20) and 87 new research projects were Enterprise Ireland
funded. WIT works proactively with researchers and industry partners supporting
12%
the development of new technologies, products and processes resulting in:
Science Foundation
5 licences 5% Ireland
16 invention disclosures
6 patent filings 6% European Commission
59 innovation vouchers completed
9 innovation partnerships initiated 50% Irish Research Council
8 spin out companies between 2007 and 2013 18%
23 client companies in ArcLabs in Waterford and Kilkenny Industry
128 staff employed by ArcLabs client companies
9% Other
Source: WIT 2015
Travel Patterns
There were three questions relating to travel to work, school or college namely
means of travel, time of departure and journey time in minutes. The majority of Figure 21. Population aged 15+ and at Work by Means of
workers commute as either a car driver (66.2%) or a car passenger (5.2%). 693 of Travel to Work Waterford, South East & State 2011
workers commuted by bus, minibus or coach as their method of travel. 9.7%
(4,022) of workers walked to work. The average journey time was 21 minutes
with city residents having a shorter commuting time of 18 minutes compared to Not stated
Waterford
an average of 24 minutes in the county. 14.9% of workers faced a commuting Work from home
time in excess of 30 minutes. Other, incl. lorry South-East
Van State
Ownership of one car (41.8%) is most common, closely followed by having two Motor car: Passenger
cars (38.0%). 18.5% of all households do not own any car. Motor car: Driver
Motorcycle/scooter
Train, DART or LUAS
Bus, minibus or coach
Bicycle
On foot
0.0% 10.0% 20.0% 30.0% 40.0% 50.0% 60.0% 70.0%
23Waterford Baseline
Health & Well Being
Figure 22. Population by General Health and Sex A new question on general health was introduced for the first time in
Census 2011 and asked respondents to select one of five categories
ranging from very good to very bad. 100,532 persons stated they were
in Very Good or Good health, representing 88.3% of total persons and is
Not Stated line with the national figures. Only 1.5% perceived their health as bad or
Females
very bad which compares with 1.5% nationally.
Very Bad Males
There was a slight difference between the city and the county in terms
Bad of health. 86.6% in the city stated that they were in Very Good or Good
health compared to 89.6% in the county. 1.9% of city residents stated
Fair they were in Bad or Very Bad health compared to 1.2% in the county.
Good
Very Good
0 5000 10000 15000 20000 25000 30000 35000 40000
Kavanagh Foley Index of Well Being4
The Kavanagh Foley Index of Well Being (KFIW) is based on the general health questions asked in the Census. The national KFIW score mean is 149.92 with a
range nationally from 51.74 to 260.92. Areas with the poorest (i.e. highest) index scores are found in a heterogeneous set of locations which range from inner
city to remote rural areas. Waterford City has a score of 154.97 compared to a score of 147.51 for Waterford County.
Disability
19. Persons with a disability by Age Group 2011
No with a Disability Population % Waterford % South East % State
Age 0-14 1,256 24,580 5.1% 9.0% 8.9%
Age 15-24 1,091 13,946 7.8% 7.2% 7.5%
Age 25-44 2,961 33,520 8.8% 18.8% 20.2%
Age 45-64 4,695 26,970 17.4% 30.1% 29.1%
Age 65+ 5,632 14,779 38.1% 35.0% 34.3%
Waterford 15,635 113,795
4 The KFIW score is calculated by weighting the percentage answering each of the five categories in the health questions in the Census.
24Waterford Baseline
A total of 15,635 people reported having a disability in April 2011, accounting for 13.7% of the population in Waterford. The rates of disability increased with age,
with 5,632 or 36% aged 65 years or over of the total having a disability.
Carers
20. Carers by sex and number of unpaid hours per week 2011
Males Females Total
1-14 hours (up to 2 hours a day) 889 1,230 2,119
15-28 hours 285 508 793
29-42 hours 132 243 375
43+ hours 314 634 948
Not Stated 252 336 588
Waterford 1,872 2,951 4,823
Table 20 shows the number of men and women who were carers and the number of hours per week spent caring. 4,823 persons provided regular unpaid
personal help for a friend or family member with a long term illness, health problem or disability. 19.7% of these provided care for more than six hours per day.
Affluence & Deprivation
Explanatory Note for Understanding Deprivation Indices
The Pobal HP Index5 (HP Index) shows the level of overall affluence and deprivation at small areas, EDs, City/County, Regional and National level based on the
Census of Population 1991-2011. The measurement of affluence and deprivation is an effective method of assessing economic performance, with those areas
featuring high levels of affluence viewed as being successful in comparison with those which feature high levels of deprivation.
Comparing the relative changes in the HP Index Scores between 2006 and 2011 shows that Ireland as a whole has seen a decline in the Absolute HP Index
Score by 6.6 points. Overall the South East is the second most disadvantaged region of Ireland and Waterford City is the second most disadvantaged area
within the region.
The Absolute Index Scores measure the actual affluence/deprivation of each area on a single fixed scale. As the economy entered into a prolonged and
severe recession over the past five years, the Absolute Index Scores for most areas have increased significantly. Because affluence/deprivation is measured on
a fixed scale, it is possible to use the Absolute Index Scores to quantify these changes across the census periods. The Absolute Index Scores range between
roughly -40 (most disadvantaged) and +40 (most affluent).
The Relative Index Score is useful in helping target resources towards disadvantaged areas as it gives the relative position of each area at a specific point in
time. It is also useful if making a statement about a particular area at a particular time (e.g. 2011) where the appropriate score to use is the 2011 Relative Index
Score which can be described using the labels in Table 21 on the following page.
5 The new HP Index replaces all previously published data.
25You can also read