The COVID-19 Pandemic and the 2020 U.S. Presidential Election - IZA DP No. 13862 NOVEMBER 2020
←
→
Page content transcription
If your browser does not render page correctly, please read the page content below

DISCUSSION PAPER SERIES

IZA DP No. 13862

The COVID-19 Pandemic and the 2020
U.S. Presidential Election

Leonardo Baccini
Abel Brodeur
Stephen Weymouth

NOVEMBER 2020
DISCUSSION PAPER SERIES

IZA DP No. 13862

The COVID-19 Pandemic and the 2020
U.S. Presidential Election

Leonardo Baccini
McGill University
Abel Brodeur
University of Ottawa and IZA
Stephen Weymouth
Georgetown University

NOVEMBER 2020

Any opinions expressed in this paper are those of the author(s) and not those of IZA. Research published in this series may
include views on policy, but IZA takes no institutional policy positions. The IZA research network is committed to the IZA
Guiding Principles of Research Integrity.
The IZA Institute of Labor Economics is an independent economic research institute that conducts research in labor economics
and offers evidence-based policy advice on labor market issues. Supported by the Deutsche Post Foundation, IZA runs the
world’s largest network of economists, whose research aims to provide answers to the global labor market challenges of our
time. Our key objective is to build bridges between academic research, policymakers and society.
IZA Discussion Papers often represent preliminary work and are circulated to encourage discussion. Citation of such a paper
should account for its provisional character. A revised version may be available directly from the author.

                                                     ISSN: 2365-9793

                                           IZA – Institute of Labor Economics
Schaumburg-Lippe-Straße 5–9                      Phone: +49-228-3894-0
53113 Bonn, Germany                             Email: publications@iza.org                                    www.iza.org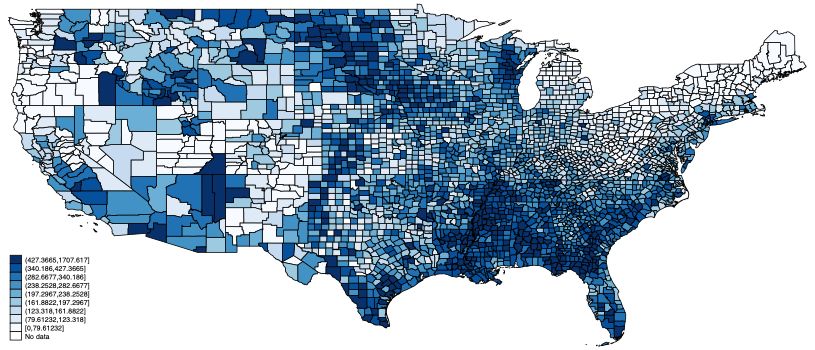
IZA DP No. 13862                                                                                                             NOVEMBER 2020

            ABSTRACT
            The COVID-19 Pandemic and the 2020
            U.S. Presidential Election*
            What is the effect of the COVID-19 pandemic on the 2020 U.S. presidential election?
            Guided by a pre-analysis plan, we estimate the effect of COVID-19 cases and deaths on the
            change in county-level voting for Donald Trump between 2016 and 2020. To account for
            potential confounders, we include a large number of COVID-19-related controls as well as
            demographic and socioeconomic variables. Moreover, we instrument the numbers of cases
            and deaths with the share of workers employed in meat-processing factories to sharpen our
            identification strategy. We find that COVID-19 cases negatively affected Trump’s vote share.
            The estimated effect appears strongest in urban counties, in swing states, and in states that
            Trump won in 2016. A simple counterfactual analysis suggests that Trump would likely have
            won re-election if COVID-19 cases had been 5 percent lower. Our paper contributes to the
            literature of retrospective voting and demonstrates that voters hold leaders accountable for
            their (mis-)handling of negative shocks.

            JEL Classification:               D72, I18
            Keywords:                         COVID-19, pandemic, elections, political behavior, pre-analysis
                                              plan

            Corresponding author:
            Leonardo Baccini
            McGill University
            845 Sherbrooke Street West
            Montréal
            Québec H3A 0G4
            Canada
            E-mail: leonardo.baccini@mcgill.ca

            * Funding for this research was provided by the Internal McGill COVID-19 Rapid Response for Social Sciences and
            Humanities Grant. We would like to thank Sean Nossek, Paul-Antoine Seitz, and Taylow Wright for excellent research
            assistance. Leo Baccini acknowledges the support of the Hoover Institution at Stanford University, where he is a
            national fellow for the 2020-21 academic year. This version relies on data of election results up to November 8, 2020,
            at 8pm (EST). We will update the paper using complete election results when they are available.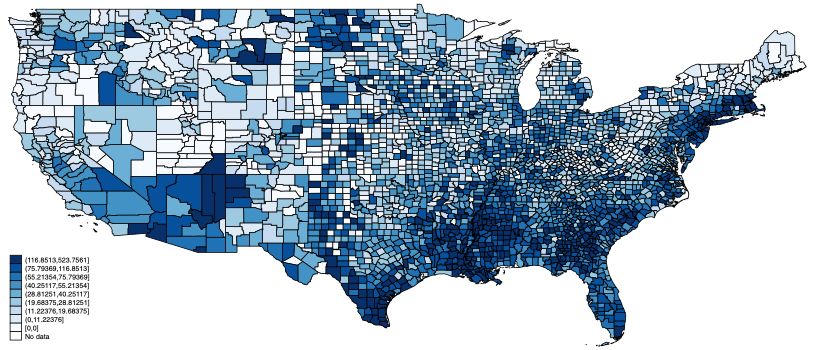
Introduction

The COVID-19 pandemic is among the most consequential global events since World
War II, affecting virtually every country in the world. By the end of October 2020,
more than 40 million people had contracted the virus and over one million had died.
In response to the pandemic, governments restricted citizens’ movement to varying
degrees through lockdown measures, with the objective of slowing the spread of
the disease. The pandemic contributed to severe economic contractions in most
countries, increasing unemployment and poverty around the world.
    In the U.S., the COVID-19 pandemic struck during a presidential election year,
shifting the political narrative and President Trump’s reelection prospects. Prior to
the pandemic, the U.S. economy was performing well, and Trump, while extremely
polarizing, enjoyed strong support among Republican voters. The virus changed the
narrative, and Trump’s response was widely criticized. He consistently downplayed
the risks of the disease, refused to embrace basic health precautions such as masks,
and repeatedly criticized epidemiologists and scientists, including those advising
him. Trump’s pandemic response, which contrasted with those of leaders in other
developed democracies, was unsuccessful. As of the end of October, the U.S. had
suffered the largest numbers of cases (over 8 million) and deaths (over 220,000) in
the world.
    In this paper, we explore the effect of the COVID-19 pandemic on the 2020
U.S. presidential election. We investigate whether Trump’s electoral support was
reduced in localities hit harder by the pandemic. Guided by a pre-analysis plan
(PAP), we constructed a data set at the county level, with the difference in vote
share for President Trump between the 2020 and 2016 presidential elections as
our dependent variable.1 Our main independent variable is COVID-19 cases and
deaths, which we gather from the data compiled by the Center for Systems Science
and Engineering at Johns Hopkins University, and statewide policies such as stay-
at-home orders and mandatory wearing of face masks. In our estimates, we control
for social distancing and four occupational measures: (1) exposure to disease or
infection, (2) physical proximity, (3) essential worker designation, and (4) remote
work. In addition, we account for demographic and socioeconomic variables and for
unemployment changes, August 2019–August 2020. In placebo tests, we show that
COVID-19 incidence is uncorrelated with changes in Republican candidates vote
share in previous elections, e.g., votes for Trump in 2016 compared with votes for
Romney in 2012.
    In an attempt to sharpen our identification strategy, we instrument COVID-19
   1
    The pre-analysis plan was posted and registered on October 30, 2020: https://osf.io/
xvuzp/. See Appendix for more details.

                                           1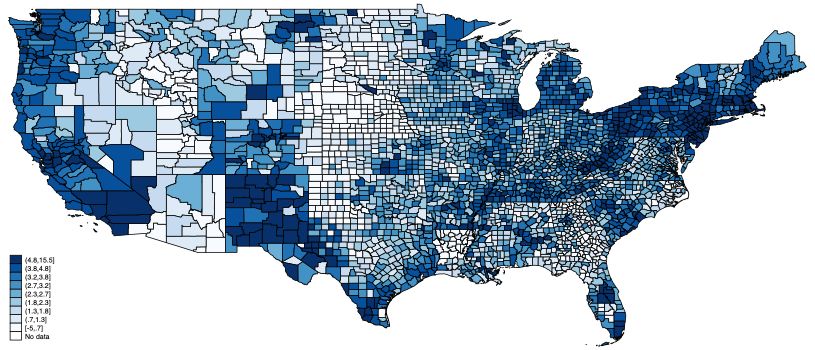
cases with the share of workers employed in meat-processing factories. We show
that counties with a larger share of workers employed in meat-processing factories
experienced a significantly larger number of cases than counties with a smaller
share of workers employed in meat-processing factories. Our two-stage least squares
estimates also control for the share of manufacturing in each county in an effort to
validate the exclusion restriction.
    Our results indicate that COVID-19 cases have had a significant negative effect
on the Trump vote share in the 2020 presidential election (in comparison to 2016).
This finding holds in both the reduced form analysis and the instrumental variable
analysis. We also find potentially important effect heterogeneity. In particular, the
negative impact of COVID-19 incidence on President Trump’s support is stronger
(1) in states that Trump won in the 2016 presidential election, (2) in swing states,
and (3) in urban counties. We find no evidence that worsening economic conditions
reduce electoral support for President Trump or that COVID-19 cases affect voters’
mobilization, measured as the number of votes cast in 2020 compared to 2016.
    These effects not only are significant and robust to a many robustness checks,
but they are also quite sizable. A simple counterfactual exercise shows that, ceteris
paribus, if the number of COVID-19 cases had been 5 percent lower, Trump would
have won the following states: Arizona, Georgia, Pennsylvania, and Wisconsin—
likely resulting in his reelection.
    Our paper is related to several streams of the literature on political behavior and
political economy.2 First, our paper speaks to the literature of retrospective voting,
which examines how citizens evaluate and vote based on their perceptions of the
incumbent’s performance (Fiorina 1981, Ferejohn 1986, Persson and Tabellini 1997,
Fearon 1999, Canes-Wrone and Shotts 2001, Ashworth 2012). Our findings indicate
that voters assess the competence of political leaders in the case of a pandemic and
hold them accountable for rising numbers of cases and deaths.
    Second, our paper is related a literature that links natural disasters to political
behavior (Abney and Hill 1966, Chen 2012, Malhotra and Kuo 2008, Abney and Hill
1966). The logic of this literature is similar to that of retrospective voting. Rational
voters reward incumbents not only for delivering a positive economic performance
in good times, but also for organizing prompt rescue and relief programs in bad
times, such as in the aftermath of extreme weather events. Our findings indicate
that incumbent governments are punished electorally for failing to provide effective
mitigation and relief, even if the primary shock (in this case, a virus) is not directly
attributable to them.
    Third, our paper speaks to the literature on the effect of personally experiencing
shocks (e.g. crises and wars) on political and social attitudes (Lau and Sears 1978,
   2
       For an excellent review of this literature, see Healy and Malhotra (2020).

                                                  2
Kinder and Kiewiet 1981, Erikson and Stoker 2001, Mo and Conn 2018). Our
findings are consistent with studies showing that negative economic shocks increase
support for government intervention in the economy and redistributive policies as
well as people’s beliefs about the relative importance of luck versus effort (Margalit
2013, Giuliano and Spilimbergo 2014). These changes in voters’ preferences and
beliefs are consistent with increasing support for a Democratic candidate over an
incumbent Republican president in the midst of a pandemic.
The COVID-19 Pandemic and the U.S. Presidential Election
News of a novel coronavirus made global headlines beginning in January 2020.
On January 9, 2020 the World Health Organization announced a coronavirus-type
pneumonia outbreak in Wuhan, China. The U.S. Centers for Disease Control and
Prevention began screening at three major U.S. airports on January 20, and the
first U.S. coronavirus case was confirmed the following day. On January 23, China
made the unprecedented move of quarantining Wuhan, a city of 11 million people.
The White House announced on January 31 a travel ban on foreign nationals who
had traveled to China within the past 14 days. The first U.S. death from the disease
occurred on February 29 in Washington State.3
The WHO declared a pandemic on March 11. That same day the U.S. National
Basketball Association suspended all games, and the actor Tom Hanks and his
wife Rita Wilson announced they had tested positive for the virus in Australia.
President Trump declared a national emergency on March 13, unlocking up to $50
billion dollars in federal funding to combat the spread of the disease, the same
day on which several states announced school closures. On March 19, California
became the first state to issue a “stay-at-home” order, with exceptions for work and
shopping for essential needs. On March 26, Trump signed into law the CARES Act,
which provided $2 trillion in aid to businesses, hospitals, and local governments.
While no country was unaffected, the COVID-19 pandemic hit the U.S. partic-
ularly hard. The U.S. COVID-19 death toll passed the grim mark of 100,000 on
May 28; by September 22, 200,000 American lives had been lost. Measured on a
per capita basis, only Brazil, Spain, and Mexico have recorded higher death rates
among large countries.4 Along with lost lives, the uncontrolled spread of COVID-
19 in the U.S. exerted a profound economic impact. Increasing numbers of cases
caused changes in consumer behavior, with large drops in consumption of services
(Baker et al. Forthcoming, Chetty et al. 2020) leading to an unprecedented increase
3
https://www.ajmc.com/view/a-timeline-of-covid19-developments-in-2020https://
www.nbcnews.com/health/health-news/coronavirus-timeline-tracking-critical-moments\
-covid-19-n1154341.
4
https://coronavirus.jhu.edu/data/mortality.
3in unemployment (Chetty et al. 2020, Coibion et al. 2020). The economic down-
turn coincided with changing political attitudes about the role of government, with
Rees-Jones et al. (2020a) finding deaths and infections associated with increased
support for expanding the U.S. safety net.
In sharp contrast to most world leaders and to his opponent Joe Biden, Trump
sought to downplay the threat of the virus, with limited political success. He be-
gan this tactic early in the crisis, and never veered from it. On February 10,
Trump claimed, “a lot of people think that [coronavirus] goes away in April with
the heat. . . ” On February 26, as U.S. cases began to appear, he said, “when you have
15 people, and the 15 within a couple of days is going to be down to close to zero,
that’s a pretty good job we’ve done.” Again, on April 3 he remarked, “It is going to
go away. It is going away.” He continued making similar comments throughout the
summer, and in his first remarks after contracting the virus himself in October, he
declared, “It’s going to disappear. It is disappearing.”5 The tactic did little to help
his standing with the electorate. According to Gallup, President Trump’s approval
rating fell from a 2020 high of 49% on March 22 to 38% on June 30.6 Polls showed
nearly 60% of Americans disapproved of Trump’s response to the pandemic, with
very little variation in the five months leading up to the election.7
There are several reasons to believe that the pandemic, and the Trump admin-
istration’s response, were detrimental to Trump’s reelection prospects. The strong
disapproval of the president’s handling of the virus suggests that a majority of the
public blamed the administration for its failure to curtail its spread. Most impor-
tantly, voters likely associate rising local cases and deaths with an increasing threat
to the health and safety of themselves and their loved ones. In this context, we
might expect that the greater the local exposure to risk, the more likely voters are
to punish the president by voting for the challenger. Another channel through which
COVID-19 may have lead to diminished Trump support is economic. Despite a big
rebound in economic growth in the third quarter of 2020, the unemployment rate
remains well above the historical average. Ominously, rising case numbers in the
lead-up to the election portended another wave of hospitalizations and deaths—and
the prospect of more localized lockdowns, business closures, and a double-dip reces-
sion. Both retrospective and prospective voting frameworks suggest that voters are
likely to hold the president accountable for the toll of the virus. For these reasons,
we examine whether more severe local outbreaks are associated with weaker support
for Trump in 2020, compared to the 2016 presidential election.
There is, however, a counter-argument to be made. A possible interpretation
5
https://www.cnn.com/interactive/2020/10/politics/covid-disappearing-trump-\
comment-tracker/.
6
https://news.gallup.com/poll/203207/trump-job-approval-weekly.aspx.
7
https://projects.fivethirtyeight.com/coronavirus-polls/
4of Trump’s strategy in responding to the pandemic is that it was in line with the
preferences of his core constituents. Survey data reveal a striking difference in
attitudes towards the pandemic between Democratic and Republican voters. Ac-
cording to Gallup, only 25% of Republican respondents are “worried about getting
the coronavirus,” whereas this percentage climbs to almost 80% among Democratic
respondents.8 Similarly, about 60% of Republican respondents are “ready to return
to normal activities right now,” whereas a mere 3% of Democratic respondents are
ready to resume a normal lifestyle. We see similar differences for questions related
to practicing social distancing, wearing masks, and avoiding large crowds. While
ideology influences attitudes toward the pandemic in other countries as well, the dif-
ferences between Democratic and Republican voters in the U.S. are uniquely large.
In short, given the polarization of U.S. politics, voters seem to be experiencing the
very same event in very different ways based on their partisan identities. If this is
the case, even a global pandemic responsible for hundreds of thousands of deaths
may not meaningfully reduce support for President Trump, especially among his
base.
The remainder of the paper empirically investigates the effect of COVID-19 on
county-level support for Trump in 2020 compared to 2016. The exercise is non-
trivial, since partisan identities can influence behavior in ways that may affect
COVID-19 cases as well as Trump support—as the partisan differences in attitudes
toward the virus reveal.9 We address this issue and other possible sources of endo-
geneity through numerous empirical strategies, which are detailed below.
Data and Empirical Strategy
We describe all the data that we use in our analysis below.
COVID-19 Data
Our analysis relies on known COVID-19 cases and deaths, recorded at the county
level. We use the COVID-19 incidence data compiled by the Center for Sys-
tems Science and Engineering at Johns Hopkins University. The data and data
sources at the state and county levels can be accessed here: https://github.com/
CSSEGISandData/COVID-19. The cumulative totals of COVID-19 cases and deaths
correspond to October 22, 2020. In our sample, the mean for the cumulative number
8
https://news.gallup.com/opinion/gallup/321698/covid-responses-men-women.aspx
[consulted on November 4, 2020].
9
Indeed, press analyses indicate a positive correlation between COVID-19 cases
and Trump’s support. See for instance, “Counties with worst virus surges over-
whelmingly voted Trump” by AP news, available at https://apnews.com/article/
counties-worst-virus-surges-voted-trump-d671a483534024b5486715da6edb6ebf.
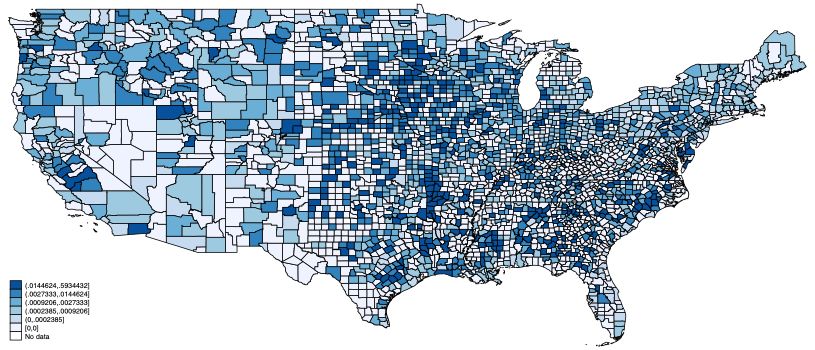
5Figure 1: Cumulative Number of COVID-19 Cases per 10,000
Notes: This figure illustrates the the cumulative number of COVID-19 cases per 10,000 as of
October 22, 2020.
of COVID-19 cases per 10,000 is 245 (std. dev. 162), while the cumulative number
of COVID-19 deaths per 100,000 is 52 (std. dev. 59). Figure 1 and Appendix Figure
A1 illustrate the distribution of cases and deaths in the U.S., respectively.
We also gather data on the following COVID-19 policies: stay-at-home orders,
mandatory face mask policies, day care closures, freezes on evictions, and mandated
quarantine for individuals arriving from another state. Data on policy duration are
drawn from Raifman et al. (2020). See the Appendix for more details.
We draw social distancing data from Google’s COVID-19 Community Mobility
Reports. This data set captures visits to a location relative to a baseline day using
data from users who have enabled “location history” in their Google account. The
baseline day is the median value for the 5-week period from January 3 to February
6, 2020. We rely on workplace as the location of interest as of April 1, 2020, i.e.,
the midpoint of the first COVID-19 wave. We also rely on mobility change as of
August 1st as a robustness check, i.e., the midpoint of the second wave.10
Election Data
We merge variables capturing COVID-19 incidence by county, with data on county-
level election results from Dave Leip’s Atlas of U.S. Presidential Elections.11 We
compute the difference of vote shares of President Trump between the 2020 and
2016 U.S. presidential elections. Specifically, we compute shares dividing the total
number of votes for Trump by the total number of votes in each county.
10
See Brodeur, Gray, Islam and Bhuiyan (2020) for a review of studies using cellphone data to
measure mobility during the pandemic.
11
Data can be purchased from https://uselectionatlas.org/BOTTOM/store_data.php.
6Table 1 provides summary statistics, whereas Figure 2 illustrates changes in
voting share from 2016 to 2020. The map shows that Trump’s support fell in parts
of the Rust Belt and the Sun Belt in 2020, when compared with the 2016 presidential
election.12
Table 1: Descriptive Statistics
Mean S. D. Max Min n
Election Outcomes
Trump Voting (2020) 63.9 15.4 92.4 8.89 2,586
Changes in Trump Voting (2020–2016) 1.87 2.72 28.11 -7.23 2,586
Changes in Total Votes (2020–2016) 4,740 23,136 477,918 -353,229 2,586
COVID-19 Incidence
Cum. COVID-19 Cases 3,050 10,891 290,486 0 2,586
Cum. COVID-19 Cases per 10,000 244 155 1,708 0.0 2,586
Cum. COVID-19 Deaths 80 338 7,374 0 2,586
Cum. COVID-19 Deaths per 100,000 51 53 524 0.0 2,586
Labor Outcomes
Share Emp. Meat Factories 0.014 0.053 0.585 0.0 2,586
Unemployment Rate Change 2.88 1.83 18.6 -5.0 2,586
Notes: Authors’ calculations. Election results from Dave Leip’s Atlas of U.S. Presidential Elec-
tions. Cumulative COVID-19 cases, cases per 10,000 people, deaths, and deaths per 100,000
people are the cumulative totals corresponding to October 22, 2020. Share of employment in
meat-processing factories is computed using data from the County Business Patterns. Monthly
unemployment data comes from the Bureau of Labor Statistics’ Local Area Unemployment Statis-
tics.
Economic Data
Employment Data We rely on the County Business Patterns (CBP) to compute
the share of employment in meat-processing factories.13 The CBP provides an-
nual data for establishments with paid employees within the U.S. This data set
provides annual employment data at the county level for the week of March 12
and annual payroll data. Note that the CBP does not include employment for
most establishments with government employees and the following NAICS indus-
tries: crop and animal production; rail transportation; Postal Service; pension,
health, welfare, and vacation funds; trusts, estates, and agency accounts; office of
notaries; private households; and public administration. See https://www.census.
gov/programs-surveys/cbp/about.html for more details.
12
Appendix Figures A2 and A3 illustrate the share of votes for the Trump in the 2020 and 2016
presidential elections.
13
Appendix Figure A5 illustrates the share of employment in meat-processing factories.
7Figure 2: Changes in Share of Votes for Donald Trump from 2016 to 2020
Notes: This figure illustrates the differential in vote shares for Trump in 2020 and 2016.
Last, we get monthly unemployment rates at the county level from the U.S.
Bureau of Labor Statistics’ Local Area Unemployment Statistics. In our sample,
the mean change in the unemployment rate from August 2019 to August 2020 was
an increase of 2.69.14 Appendix Figure A4 illustrates the geographical distribution
for this variable.
Occupational Measures
We rely on four occupational indexes as control variables: (1) exposure to disease
or infection, (2) physical proximity, (3) essential worker designation, and (4) remote
work. The first three indexes were built in Beland et al. (2020), while the remote
work index comes from Dingel and Neiman (2020). These indexes serve as covariates
in our analysis since they have been shown to be related to the severity of job losses
in the U.S. and could be related to voting behavior and COVID-19 incidence. See
the Appendix for more details on these four indexes.
Empirical Strategy
In this section, we describe the empirical strategy that was pre-specified in a PAP.
We first present our OLS model and provide evidence that our model is more ap-
propriate than a naı̈ve model relating COVID-19 incidence and Trump vote share.
We then describe the IV specification, in which we instrument COVID-19 incidence
with the share of employment in meat-processing plants.
14
The increase in the unemployment rate was much larger during the months of April and May
2020. Also note that the increase in unemployment does not include workers who are currently
employed but are not working due to lockdowns. See Beland et al. (2020) for a discussion.
8COVID-19 Incidence: OLS
As stated in our PAP, we first rely on the following model:
∆Yc = α + βCOV IDIncidencec + Xc0 γ + θs + εc , (1)
where Yc is the differential in Trump’s vote share in 2020 and 2016 for county i.
COV ID Incidencec is the cumulative number of confirmed COVID-19 cases per
10,000 inhabitants or COVID-19 deaths per 100,000 inhabitants as of October 22,
2020.15 We report standard errors clustered at the state level.
We include in the model Xc , which is a vector of county-level variables. We
include the following demographic and socioeconomic variables: population, share
of female population, share of foreign-born population, share of population with a
college degree, share of non-Hispanic Black population, share of non-Hispanic White
population, share of population by age group (9 dummies), social mobility index,
and four occupational indexes. Moreover, we compute employment changes due to
the pandemic at the county level by taking the unemployment rate as of September
2020 minus the unemployment rate as of September 2019.16 The inclusion of these
variables allows us to relax our identification assumption that no omitted variables
are related to COVID-19 incidence and the change in voting behavior from the 2016
to the 2020 presidential election. Finally, θs represents state fixed effects. This set
of fixed effects allows us to further control for county-level characteristics that are
common to counties within the same state.
Our estimation is thus at the county level and we effectively test whether counties
with relatively more COVID-19 cases or deaths differentially voted for the Trump
in 2020 compared with the previous presidential election. We use this model in-
stead of a model relating COVID-19 incidence to vote share in 2020 alone to better
capture trends in voting behavior. In other words, we compare how voting behav-
ior changed pre- and post-COVID-19 rather than simply analyzing voting behavior
post-COVID-19. We believe this is crucial in this context given the increasing po-
litical polarization in the U.S. Moreover, we think that the inclusion of state fixed
effects and controlling for social distancing and a large set of demographic variables
helps account for differential (changes in) behavior and preferences across counties.
This is also crucial because a growing literature has shown, for instance, that indi-
15
We follow our PAP in using October 22, 2020 for calculating the number of COVID-19 cases.
Nonetheless, we check the robustness of our results using other dates for calculating the number
of COVID-19 cases. See the Results section for more details.
16
Relying on different months for the before and during COVID-19 periods has no effect on our
conclusion that job losses are not related to differential voting behavior from the 2016 to the 2020
elections. On average, the unemployment rate from September 2019 to September 2020 increased
by 2.69 percentage points in our sample (std. dev. 1.86).
9viduals identifying as Republicans are less likely to comply with social distancing
orders than those identifying as Democrats (e.g., Allcott et al. (2020); Gollwitzer
et al. (2020)).
In Appendix Table A1, we provide empirical evidence that COVID-19 incidence
is significantly related to votes for Trump in 2016 and 2020. We then provide evi-
dence that COVID-19 incidence in our model is not successfully predicting changes
in voting behavior for previous presidential elections. The variables of interest are
the cumulative number of COVID-19 cases per 10,000 (columns 1–3) and COVID-
19 deaths per 100,000 (columns 4–6). In Panel A (B), the dependent variable is the
vote share for Trump in the 2020 (2016) presidential election, whereas the dependent
variable in Panel C is the change in votes for Trump from 2012 to 2016. Columns 1
and 4 include only state fixed effects and our demographic controls, while columns
2 and 3 sequentially add socioeconomic controls and our social distancing indicator.
The estimates in Panels A and B are positive and significant, suggesting that
counties with more Trump’s supporters had larger numbers of COVID-19 cases.
The fact that both estimates are positive and significant for both the 2016 and
the 2020 presidential elections suggest that this model is misspecified and that a
naı̈ve estimation would conclude that COVID-19 incidence helped Trump during
the 2020 presidential election. In contrast, the estimates are small and statistically
insignificant in all columns in Panel C. These results provide evidence that our
empirical model is properly specified.
COVID-19 Incidence: IV
We complement the reduced form analysis with an instrumental variable approach.
The concern we attempt to address is that COVID-19 cases and COVID-19 deaths
do not occur at random, but rather they correlate with individuals’ behavior, which
may be different between those who vote for the Democratic Party and those who
vote for the Republican Party. For instance, it may be that voters living in “red”
(i.e., Republican-leaning) counties are less likely to observe social distancing or to
wear masks. If this is the case, this type of behavior would be likely to increase the
number of COVID-19 cases (and in turn COVID-19 deaths) and we would observe
a larger share of votes for Trump than for Biden in the same counties. While we
control for social distancing in the previous analysis, we may have missed some
other confounders in our analysis.
To attempt to achieve exogenous variation of COVID-19 cases and deaths at
the county level, we instrument COVID-19 cases and deaths with the share of
employment in meat-processing factories in each county. More specifically, we use
the average number of workers in industry code 3116, “Animal Slaughtering and
10Processing,” in each county between 2012 and 2016, i.e., before Trump’s presidency.
We divide this number by the average number of total workers in each country
during the same time frame, i.e., 2012–2015. Data come from the CBP and measure
raw employment.
The rationale for the instrument is that there is evidence of meat-processing
plants becoming COVID-19 hotbeds due to their cold, humid environment and dif-
ficulties with workplace physical distancing.17 According to a CDC report on July
10, among 23 states reporting COVID-19 outbreaks in meat and poultry facili-
ties, 16,233 cases in 239 facilities occurred, including 86 (0.5%) COVID-19 related
deaths.18 Based on cases reported by Johns Hopkins University, as of May 6, coun-
ties containing or within 15 miles of one or more meatpacking plants reported 373
COVID-19 cases per 10,000 residents. That is roughly double the U.S. average of
199 cases per 100,000 in all counties with reported cases.19 The severity of the in-
cidence of COVID-19 cases in meat-processing facilities prompted research on how
to control the spread of the virus in these plants.20
Armed with this instrument, we estimate:
(
COV IDc = ρ + φ · M EATc + Xc0 ψ + θs + νc
(2)
ˆ IDc + Xc0 γ + θs + εc ,
∆Yc = α + δ COV
where M EATc is the share of workers in meat-processing plants. We run a first
stage in which we regress this variable on the cumulative number of COVID-19
cases per 10,000 inhabitants or deaths per 100,000 inhabitants at the county level,
including all controls and state fixed effects as in equation 1. Then we plug in the
predicted values of this first stage and estimate the second stage of the 2SLS.
The identifying variance is the industrial composition of each county, specifically
the presence of a meat-processing factories. In order for our instrument to allow a
causal interpretation, employment in meat-processing factories must only affect the
change in voting behavior from 2016 to 2020 through its effect on COVID-19 cases
and deaths. To relax this assumption, we control for the share of manufacturing
employment as well as share of employment in the specific 2-digit manufacturing
industry to which “Animal Slaughtering and Processing” belongs.
Appendix Figures A6 and A7 illustrate the relationship between the cumulative
number of COVID-19 cases and deaths and the share of employment in meat-
17
https://www.cnn.com/2020/06/27/health/meat-processing-plants-coronavirus-intl/
index.html [consulted on October 5, 2020].
18
https://www.cdc.gov/mmwr/volumes/69/wr/mm6927e2.htm [consulted on October 5 2020].
19
https://www.ewg.org/news-and-analysis/2020/05/ewg-map-counties-meatpacking-\
plants-report-twice-national-average-rate [consulted on October 5 2020].
20
https://www.thepigsite.com/news/2020/09/new-research-to-mitigate-covid-19-in\
-us-meat-and-poultry-processing-facilities [consulted on October 5, 2020].
11processing factories since the beginning of the pandemic for the (1) top 1% of coun-
ties with the highest share of employment in meat-processing factories, (2) top 5%
of counties with the highest share of employment in meat-processing factories, (3)
counties with at least one job in meat-processing factories, and (4) counties without
any jobs in meat-processing factories. These figures provide direct evidence that
counties with a higher share of employment in meat-processing factories had a higher
incidence of COVID-19 during the entire pandemic. COVID-19 case and death in-
cidences are much larger for counties with a relatively high share of employment
in meat-processing factories and much smaller for counties with no employment or
positive employment share. This result suggests our first stage is strong and that
the relationship between the share of employment in meat-processing factories and
COVID-19 incidence is non-linear.
Last, we note that the correlation between our instrument and the share of
manufacturing employment is 0.3, whereas the correlation between our instrument
and the other controls is never higher than 0.1. Moreover, the raw correlation
between COVID-19 cases and deaths and our instrument is 0.3 and 0.1, respectively.
The correlation between COVID-19 cases and deaths and our instrument conditional
on controls and state fixed effect is much higher, i.e., above 0.5 for cases and 0.3 for
deaths.
Results
OLS and 2SLS Estimates
In this section we estimate the effect of COVID-19 incidence on voting behavior
using OLS and 2SLS. We focus on COVID-19 cases in the main analysis. We note
again that our analysis and choice of control variables was fully detailed in our pre-
analysis plan. Table 2 contains OLS estimates of equation (1) (columns 1–3). The
sample size is 2,586 observations (i.e., counties).21 The dependent variable is the
differential in vote for Donald Trump in 2020 and 2016. A positive value indicates
that Trump received more votes in 2020 than in 2016. We report standard errors
clustered at the state level. The variables of interest are the cumulative numbers of
COVID-19 cases per 100,000 inhabitants. See Appendix Table A3 for COVID-19
deaths.
What clearly emerges is that COVID-19 cases are negatively related to votes
for Trump during the 2020 presidential election in comparison to the 2016 election.
In column 1, we include state fixed effects and our set of demographic and socioe-
21
We lose about 400 observations (i.e., counties) because of lack of data for our social distancing
indicator. Excluding this control variable and doing the analysis on the full set of counties has no
effect on our main conclusions.
12Table 2: The Impact of COVID-19 Cases: OLS and 2SLS Estimates
Panel A: First Stage
Cumulative COVID Cases
(4) (5) (6)
Share Workers 371.17*** 327.06*** 318.03***
Meat Plants (84.08) (84.82) (79.84)
Panel B: OLS and 2SLS
Change in Trump Vote
from 2016 to 2020
(1) (2) (3) (4) (5) (6)
Cumulative COVID -0.0013* -0.0013* -0.0012* -0.0108*** -0.0120*** -0.0123***
Cases per 10,000 (0.0007) (0.0007) (0.0007) (0.0038) (0.0043) (0.0041)
Unemp. Change 0.0078 -0.0397
(0.0845) (0.0586)
State FE Yes Yes Yes Yes Yes Yes
Share Manufacturing Yes Yes Yes
Demo. Controls Yes Yes Yes Yes Yes Yes
Socioecon. Controls Yes Yes Yes Yes Yes Yes
Social Distancing Yes Yes Yes Yes
Observations 2,586 2,586 2,586 2,586 2,586 2,586
F-Statistics 72.10 55.03 51.34
Notes: Election data from Dave Leip’s Atlas of US Presidential Elections. An observation is a
county. Robust standard errors are in parentheses, adjusted for clustering by state. We present
OLS estimates in columns 1–3 of specification 1. We present the first stage (Panel A) and the
2-stage estimates (Panel B) of specification (2) in columns 4–6 in which we instrument COVID-
19 incidence in a first stage by the share of employment in processing meat factories. In Panel
A, the dependent variable is the cumulative number of COVID-19 cases per 10,000 (columns 4–
6). In Panel B, the dependent variable is the differential in vote for Trump in 2020 and 2016.
Demographic controls include population, female population share, foreign-born population, non-
Hispanic Black population, non-Hispanic White population and the share of the population by
age group. Socioeconomic controls include: share of the population with a college degree and
four occupational indexes. The Unemployment change variable is the unemployment rate as of
September 2020 minus the unemployment rate as of September 2019. Standard errors clustered
by state in parentheses *** psmall and statistically insignificant.22 Our results thus provide suggestive evidence
that job losses during the pandemic did not have a large effect on voting behavior
and that increases in the unemployment rate does not seem to be a major factor
behind the negative effect of COVID-19 on the share of votes for Trump.
The coefficients for some of the other control variables are worth discussing
(not shown for space consideration). We find that the share of women is strongly
negatively correlated to the change in vote share for Trump. Similarly, Trump seems
to have lost vote share in counties with a high share of adults aged 25–54.
Our OLS results provide suggestive evidence that the pandemic affected the
2020 presidential election. The main concern with our OLS estimates is that omit-
ted variables could be related to both COVID-19 incidence and differential voting
behavior in the 2016 and 2020 presidential elections. We now turn to our instru-
mental variable strategy.
In Table 2 (columns 4–6), we present the first stage (Panel A) and the two-
stage estimates (Panel B) of specification (2) in which we instrument COVID-19
incidence in the first stage by the share of employment in meat-processing factories.
We control for our usual set of fixed effects and control variables. As shown in
Appendix Figures A6 and A7, we find that the share of employment in meat-
processing factories is strongly positively correlated with COVID-19 incidence. The
coefficient is always significant and the F-statistics indicate no concern of a weak
instrument.
Our second-stage estimates are presented in the bottom panel (columns 4–6).
We find that counties with more COVID-19 cases substantially decreased their vote
share for Trump in 2020. The 2SLS estimates are larger than the OLS estimates, and
suggest that a county with 100 more COVID cases per 10,000 people (as compared
to others in the same state) reduced its Trump vote share from 2016 to 2020 by an
additional 1.2 percentage point on average.23 The point estimates are statistically
significant at the 1% level and robust to the inclusion of our large set of controls
and the share of manufacturing employment as well as the share of employment
in the specific 2-digit manufacturing industry to which “Animal Slaughtering and
Processing” belongs.
22
Using the change in unemployment for different dates does not affect our conclusions. For
instance, measuring unemployment during the first wave of COVID-19 (i.e., April 2020) instead
of the month of August 2020 leads to similar estimates and has no effect on the magnitude or
significance of the COVID-19 cases variable.
23
There are many plausible explanations for why our 2SLS estimates are larger than our OLS
estimates. First, there is a great deal of measurement error in our estimation. Second, we are
estimating a local average treatment effect (LATE) with our IV estimation. Voting behavior in
counties with relatively more employment in meat-processing factories may be differently affected
by the pandemic than counties with no or a small share of employment in this industry. For
instance, counties with employment in meat-processing factories are significantly more populous
than counties without any jobs in this industry.
14So far, our analysis has underscored an important finding: the COVID-19 pan-
demic costs President Trump votes. But is this effect large enough to have changed
the outcome of the 2020 presidential election? To answer this question, we conduct
a simple counterfactual exercise to determine the magnitude of the effect by ex-
ploring how the composition of votes in a number of closely contested states would
have differed if there had been fewer COVID-19 cases. The computation of the
counterfactual is based on the coefficient estimate in column 6 of Table 2. For each
county, we compute the fraction of total votes that Trump would have received if
the number of COVID-19 cases had been X% smaller as -0.0012 ×COV IDc × X%
– i.e., the point estimate of the effect of COV IDc on Trump’s vote share from the
OLS estimates, the size of each county’s measured COVID-19 cases, and the scaling
factor X%. We next multiply this product by the number of total votes in a county
to calculate the number of additional votes that Trump would have received in
the counterfactual scenario. We then aggregate these county-level votes into state
totals.
Table 3 presents the results of this counterfactual analysis. Column 1 shows the
actual vote margin in favor of Biden in the 2020 election for a set of closely contested
states. The three subsequent columns show counterfactual outcomes had COVID-
19 cases been 5% or 10% or 15% fewer. Since we find that the COVID incidence
decreased Trump’s vote share, the counterfactual analyses for fewer COVID-19 cases
correspondingly increase Trump’s counterfactual vote totals. The results in Table
3 show that, ceteris paribus, Trump would have won Michigan in a counterfactual
scenario with 15% fewer cases. He would have won Arizona, Georgia, Pennsylvania,
and Wisconsin, with 5% fewer COVID-19 cases. Under this counterfactual, Trump
would have been reelected.
Table 3: Counterfactual Outcomes in Closely Contested States Won by Biden
COVID-19 Cases
State Trump's Gap 5% Smaller 10% Smaller 15% Smaller
Arizona -16,985 63,299
Georgia -10,353 18,116
Michigan -146,124 52,932 105,865 158,797
Pennsylvania -42,539 59,660
Wisconsin -20,510 61,325
Note: The computation of the counterfactual is based on the estimate from the OLS model. An
increase in per COVID-19 cases reduces Trump’s share of vote by 0.0015 percentage points (see
columns 1-3 in Table 2). The actual outcome in column 2 reports the margin in favor of Biden
in each state. Negative values indicate that Biden won the state in 2020. The reported values in
columns 3 and 4 are estimated margins in favor of Trump in the counterfactual scenario of fewer
COVID-19 cases. A positive value in columns 3 or 4 larger than the negative value in column 2
implies that Trump would have won the state.
15Effect Heterogeneity
We investigate heterogeneous effects of COVID-19 on voting in Table 4. Columns
1 and 2, we document the relationship between COVID-19 incidence and the dif-
ferential in vote for Trump in 2020 and 2016, for Trump’s and his opponent Hillary
Clinton’s states separately. We define states as Trump’s or Clinton’s using the elec-
toral votes for the 2016 U.S. presidential election.24 We find that the negative effect
of COVID-19 cases on Trump’s vote is driven by those states that he won in the
2016 presidential election (column 1). The magnitude of the coefficient is about
50% larger than the magnitude of the coefficient in the entire sample. In contrast,
the coefficient of COVID-19 cases is small, positive, and not significant in those
states that Clinton won in the 2016 presidential election (column 2).25
Columns 3 and 4 restrict the sample to swing and non-swing states.26 Our results
indicate that the negative effect of COVID-19 cases on Trump’s vote is almost twice
as large in swing states as it is in non-swing states.
Columns 5 and 6 restrict the sample to urban and rural counties, respectively.
We define a county as “urban” (“rural”) if over (below) 50% of its population was
living in an urban area in 2010 (U.S. Census). Our results show that urban counties
drive the negative effect of COVID-19 cases on Trump’s vote. Indeed, the effect is
negative and significant in the urban sample, whereas it is smaller and statistically
insignificant in rural counties.27
COVID-19 Deaths We now check whether our results are robust to the use of
COVID-19 deaths instead of cases. Appendix Table A3 shows our estimates. We
do not find any evidence that COVID-19 deaths are related to changes in voting
behavior from the 2016 to the 2020 presidential election with our OLS model. The
estimates are all statistically insignificant. For our 2SLS estimates, our first stage is
24
We classify Maine as a blue state. This has no effect on our conclusions.
25
Of note, the cumulative number of COVID-19 cases per 10,000 inhabitants varies across
Trump’s states (271) and Clinton’s states (166).
26
We classify states as swing or non-swing using the NYT classifica-
tion available at https://www.nytimes.com/interactive/2020/us/elections/
electoral-college-battleground-states.html, consulted on November 2, 2020. We
consider swing states as states categorized as tossup and leaning Democratic: Arizona, Florida,
Georgia, Iowa, Maine, Michigan, Minnesota, Nebraska, New Hampshire, Nevada, North Carolina,
Ohio, Pennsylvania, Texas, and Wisconsin.
27
In Appendix Table A2, we investigate heterogeneity by county demographic characteristics.
We find that negative effect of COVID-19 cases is stronger for countries below the median per-
centage of residents aged 65 than for counties above the median percentage of residents aged 65.
Our estimates also indicate that the negative effect of COVID-19 cases is stronger in more racially
diverse counties (i.e., those with white population shares below the median). Furthermore, our
findings show that the negative effect of COVID-19 cases on Trump’s vote is driven by less ed-
ucated counties (i.e., those with a below-median share of residents with college degrees), which
may help explain Biden’s victory in the Rust Belt.
16Table 4: The Impacts of COVID-19 Cases (2SLS): Heterogeneity Analyses by State
and County Characteristics
Panel A: First Stage
Cumulative COVID Cases
(1) (2) (3) (4) (5) (6)
Share Workers 292.00*** 544.60*** 426.39*** 249.07*** 825.29*** 167.37**
Meat Plants (93.30) (213.35) (139.42) (85.92) (113.19) (67.78)
Panel B: 2SLS
Change in Trump Vote
from 2016 to 2020
Trump Clinton Swing Not Swing Urban Rural
2016 2016 States States Counties Counties
States States
(1) (2) (3) (4) (5) (6)
Cumulative COVID -0.0179*** 0.0020 -0.0143*** -0.0087** -0.0127*** -0.0001
Cases per 10,000 (0.0049) (0.0022) (0.0042) (0.0044) (0.0039) (0.0037)
State FE Yes Yes Yes Yes Yes Yes
Share Manufacturing Yes Yes Yes Yes Yes Yes
Demo. Controls Yes Yes Yes Yes Yes Yes
Socioecon. Controls Yes Yes Yes Yes Yes Yes
Social Distancing Yes Yes Yes Yes Yes Yes
Observations 1,935 651 1,063 1,523 1,178 1,408
F-Statistics 32.65 35.19 40.06 18.16 81.32 10.57
Notes: Election data from Dave Leip’s Atlas of US Presidential Elections. An observation is a
county. Robust standard errors are in parentheses, adjusted for clustering by state. In Panel A,
the dependent variable is the cumulative number of COVID-19 cases per 10,000. In Panel B, the
dependent variable is the differential in vote for Trump in 2020 and 2016. We report the second
stage estimates of our 2SLS (equation 2). In columns 1 and 2 we document the relationship
between COVID-19 cases and the differential in vote for Trump in 2020 and 2016 for states that
Trump and Clinton won, respectively. Columns 3 and 4 restrict the sample to swing and non-
swing states. Columns 5 and 6 restrict the sample to urban and rural counties, respectively. The
variables of interest are the cumulative number of COVID-19 cases per 10,000 (Panel A) and
COVID-19 deaths per 100,000 (Panel B), respectively. Demographic controls include population,
female population share, foreign-born population, non-Hispanic Black population, non-Hispanic
White population and the share of the population by age groups. Socioeconomic controls include:
share of the population with a college degree and four occupational indexes. Standard errors
clustered by state in parentheses *** pCOVID-19 infection results in death rises dramatically with age, and we expect that
this and other factors such as healthcare coverage may contribute to the divergence
in estimated effects. Second, it is plausible that voters are less aware or less likely
to know someone who has died of COVID-19 than to know someone who has tested
positive for COVID-19.
Voters’ Mobilization One of the defining outcomes of the 2020 presidential elec-
tion was the record-high turnout. Both presidential candidates would had won any
previous elections, given their number of votes at the national level. We use dif-
ferences in total votes between the 2016 and 2020 presidential elections as a rough
proxy of turnout. We run the same model specification as in equations 1 and 2. We
show the results in Table A8. We find no evidence that COVID-19 cases affected
voters’ mobilization.
Robustness Checks Appendix Table A4 provides robustness checks for our 2SLS
results. In this table, we add to the models the well-known predictors of voting
behavior or COVID-19 incidence. Column 1 reports our estimates for our favorite
2SLS specification (i.e., Table 2, column 5) as a benchmark. In column 2, following
Autor et al. (2020), we add to the model the China shock variable, which contributes
to explain President Trump’s victory in 2016.28 Column 3 adds to the model precip-
itation and air pollution controls (i.e., PM2.5 and precipitation for the first months
of the pandemic).29 In column 4, we control for the share of employment in nursing
care facilities.30 In column 5, we control for the duration (in days) of the following
statewide non-pharmaceutical interventions: stay-at-home orders, mandatory face
mask policies, day care closures, freezes on evictions, and mandated quarantine for
out-of-state individuals. Last, we include all these additional controls in column
6.31 Overall, the inclusion of one or all of these control variables has no effect on
the magnitude and significance of our 2SLS estimates.
Appendix Tables A5 and A6 tackle another potential issue. We check whether
our OLS and 2SLS point estimates vary if we change the date for the moment in
28
The China shock variable is a Bartik measure capturing rising Chinese imports to the United
States in each industry i, weighted by baseline share of workers in the same industry i in each
county. This variable varies both across counties and over time. The over-time variation is given
by the difference in imports from China to the U.S. between 2000 (i.e., pre-accession to the WTO)
to the period 2016-2019 (i.e., average value over this four-year window).
29
A number of studies provide suggestive evidence that air pollution may be associated with
an increased risk of COVID-19 death (Wu et al. (2020)).
30
http://jedkolko.com/2020/10/18/the-geography-of-the-covid19-third-wave/ [con-
sulted on November 2, 2020].
31
Note that we only have data for statewide non-pharmaceutical interventions. One exception
is for stay-at-home orders, which have been implemented by some cities and counties prior to
statewide orders. Typically, the city or county order precedes the statewide order by few days.
18which we calculate the cumulative number of COVID-19 cases. As stated in our pre-
analysis plan, we rely on October 22nd for our main analysis. In these two appendix
tables, we instead rely on July 1st (column 1), August 1st (column 2), September
1st (column 3), and August 1st (column 4). The estimates for the OLS are all larger
and more significant than for our baseline, i.e., cases as of October 22nd, suggesting
that we are very conservative in estimating the relationship between COVID-19
cases and the differential in votes for Trump. For the 2SLS, the point estimates all
range from 0.0010 to 0.0012 and are statistically significant at the 5% level.
Conclusion
This paper explores the effect of the COVID-19 pandemic on the 2020 U.S. presi-
dential election using both a reduced form and IV approach. Our key finding is that
COVID-19 cases decreased electoral support for Trump. A simple counterfactual
exercise shows that, ceteris paribus, if COVID-19 cases had been 5 percent lower,
Trump would have retained the U.S. presidency for a second term. We find that the
negative impact of COVID-19 incidence on President Trump’s support is stronger
(1) in states that Trump won in the 2016 presidential elections, (2) in swing states,
and (3) in urban counties. We find no evidence that worsening economic condi-
tions reduce electoral support for President Trump and that COVID-19 cases affect
voters’ mobilization.
At least two explanations are consistent with these findings. First, voters may
have electorally sanctioned President Trump for how he handled the pandemic,
which has been largely at odds with the approach of every other leader in developed
countries, and is widely viewed to have contributed to the large numbers of infections
and deaths in the US. This explanation is consistent with a retrospective voting
approach (Fiorina 1981, Fearon 1999), in which voters sanction the incumbent for
his handling of negative shocks.
Second, some voters may have switched from Trump to Biden due to changes
in preferences triggered by the pandemic and the recession. In particular, a severe
public health threat and major economic losses may have shifted preferences in fa-
vor of an expansion of the social safety net, including healthcare and unemployment
insurance programs Rees-Jones et al. (2020b). Since the Democratic Party and its
presidential candidate is more likely to champion these policies, it has reaped the
electoral benefits of this switch in voters’ preferences. This explanation is in line
with studies claiming that political preferences are shaped by personal experience.
If it is true that these changes in preferences are long lasting (Giuliano and Spilim-
bergo 2014), the Democratic Party also should be able to capitalize electorally in
subsequent elections, especially in the areas hit the hardest by the pandemic.
19Our empirical analysis is unable to tease out which of these two channels is
operative. Future research should investigate these mechanisms using individual-
level data, when they become available. Similarly, future studies should explore how
turnout, which has been unprecedentedly high for the 2020 presidential election, has
affected the results reported in this paper.
20References
Abney, F. G. and Hill, L. B.: 1966, Natural Disasters as a Political Variable: The
Effect of a Hurricane on an Urban Election, American Political Science Review
60(4), 974–981.
Allcott, H., Boxell, L., Conway, J., Gentzkow, M., Thaler, M. and Yang, D. Y.:
2020, Polarization and Public Health: Partisan Differences in Social Distancing
During the Coronavirus Pandemic, Journal of Public Economics 191, 104254.
Ashworth, S.: 2012, Electoral Accountability: Recent Theoretical and Empirical
Work, Annual Review of Political Science 15(1), 183–201.
Autor, D., Dorn, D., Hanson, G. and Majlesi, K.: 2020, Importing Political Po-
larization? The Electoral Consequences of Rising Trade Exposure, American
Economic Review 110(10), 3139–3183.
Baker, S. R., Farrokhnia, R. A., Meyer, S., Pagel, M. and Yannelis, C.: Forthcoming,
How Does Household Spending Respond to an Epidemic? Consumption During
the 2020 COVID-19 Pandemic, Review of Asset Pricing Studies .
Beland, L.-P., Brodeur, A. and Wright, T.: 2020, The Short-Term Economic Con-
sequences of COVID-19: Exposure to Disease, Remote Work and Government
Response. IZA Discussion Paper 13159.
Brodeur, A., Cook, N. and Heyes, A.: 2020, Methods Matter: P-Hacking and
Publication Bias in Causal Analysis in Economics, American Economic Review
110(11).
Brodeur, A., Gray, D. M., Islam, A. and Bhuiyan, S.: 2020, A Literature Review of
the Economics of COVID-19. IZA Discussion Paper 13411.
Canes-Wrone, Brandice, M. C. H. and Shotts, K. W.: 2001, Leadership and Pander-
ing: A Theory of Executive Policymaking, American Journal of Political Science
45(3), 532–550.
Chen, J.: 2012, Distributive Spending, Voter Partisanship, and Political Participa-
tion: A Theory of Voter Turnout as Retrospective Evaluation, American Journal
of Political Science 60(4), 974–981.
Chetty, R., Friedman, J. N., Hendren, N., Stepner, M. et al.: 2020, How Did
COVID-19 and Stabilization Policies Affect Spending and Employment? A New
Real-Time Economic Tracker Based on Private Sector Data. NBER Working
Paper 27431.
Coibion, O., Gorodnichenko, Y. and Weber, M.: 2020, Labor Markets During the
COVID-19 Crisis: A Preliminary View. NBER Working Paper 27017.
Dingel, J. I. and Neiman, B.: 2020, How Many Jobs Can be Done at Home?, Journal
of Public Economics 189, 104235.
21You can also read