Genomic Evidence for Rare Hybridization and Large Demographic Changes in the Evolutionary Histories of Four North American Dove Species - MDPI
←
→
Page content transcription
If your browser does not render page correctly, please read the page content below
animals
Article
Genomic Evidence for Rare Hybridization and Large
Demographic Changes in the Evolutionary Histories
of Four North American Dove Species
Flor Hernández, Joshua I. Brown, Marissa Kaminski, Michael G. Harvey and Philip Lavretsky *

                                          Department of Biological Sciences, University of Texas at El Paso, El Paso, TX 79968, USA;
                                          fbhernandez2@miners.utep.edu (F.H.); jibrown@miners.utep.edu (J.I.B.); mkaminski@miners.utep.edu (M.K.);
                                          mgharvey@utep.edu (M.G.H.)
                                          * Correspondence: plavretsky@utep.edu

                                          Simple Summary: Range expansions of invasive species continue to increase due to the direct
                                          or indirect influences of humans on global habitats. Understanding how these introductions and
                                          invasions increase the potential for interaction and hybridization between colonists and closely
                                          related native species is therefore increasingly important. We examine the evolutionary histories and
                                          signatures of hybridization among introduced feral Rock Pigeon and Eurasian Collared-Dove and
                                          native White-winged and Mourning doves in southwestern North America. Analyzing thousands of
                                          genomic markers, we find little evidence that hybridization has been extensive in their evolutionary
                                histories or today. Despite this, evidence from multiple population genetics analyses supports

                                          the presence of six putative contemporary late-stage hybrids among the 182 sampled individuals.
Citation: Hernández, F.; Brown, J.I.;     These putative hybrids all involve the most populous species, the Mourning Dove. We discuss the
Kaminski, M.; Harvey, M.G.;               importance of using multiple marker types when attempting to infer complex evolutionary histories
Lavretsky, P. Genomic Evidence for        and propose important considerations when analyzing populations that were recently established or
Rare Hybridization and Large
                                          of domestic origins.
Demographic Changes in the
Evolutionary Histories of Four North
                                          Abstract: Introductions and invasions provide opportunities for interaction and hybridization be-
American Dove Species. Animals 2021,
                                          tween colonists and closely related native species. We investigate this phenomenon using the
11, 2677. https://doi.org/10.3390/
ani11092677
                                          mitochondrial DNA COI and 81,416 base-pairs of overlapping nuclear variation to examine the
                                          evolutionary histories and signatures of hybridization among introduced feral Rock Pigeon and
Academic Editors: Mario Barbato and       Eurasian Collared-Dove and native White-winged and Mourning doves in southwestern North
Laura Iacolina                            America. First, we report all four species to be highly divergent across loci (overall pair-wise species
                                          ΦST range = 0.17–0.70) and provide little evidence for gene flow at evolutionary timescales. Despite
Received: 6 August 2021                   this, evidence from multiple population genetics analyses supports the presence of six putative
Accepted: 8 September 2021                contemporary late-stage hybrids among the 182 sampled individuals. These putative hybrids contain
Published: 13 September 2021              various ancestry combinations, but all involve the most populous species, the Mourning Dove. Next,
                                          we use a novel method to reconstruct demographic changes through time using partial genome
Publisher’s Note: MDPI stays neutral
                                          sequence data. We identify recent, species-specific fluctuations in population size that are likely
with regard to jurisdictional claims in
                                          associated with changing environments since the Miocene and suggest that these fluctuations have
published maps and institutional affil-
                                          influenced the genetic diversity of each dove species in ways that may impact their future persistence.
iations.
                                          Finally, we discuss the importance of using multiple marker types when attempting to infer complex
                                          evolutionary histories and propose important considerations when analyzing populations that were
                                          recently established or of domestic origins.

Copyright: © 2021 by the authors.
                                          Keywords: secondary contact; Columbidae; demography; evolution; population genetics; speciation
Licensee MDPI, Basel, Switzerland.
This article is an open access article
distributed under the terms and
conditions of the Creative Commons
Attribution (CC BY) license (https://
                                          1. Introduction
creativecommons.org/licenses/by/               Range expansions due to anthropogenic changes to the environment (e.g., species
4.0/).                                    introductions or habitat destruction) have become a leading cause of secondary contact

Animals 2021, 11, 2677. https://doi.org/10.3390/ani11092677                                               https://www.mdpi.com/journal/animals
Animals 2021, 11, 2677 2 of 19
between many closely related native and non-native taxa [1–3]. Such contact events can
result in competition with or the exclusion of native taxa [4]. If hybridization occurs, it
may lead to adaptive introgression or increased diversity in the native species [5,6], but
it can also facilitate the introgression of maladaptive traits into locally adapted popula-
tions [7,8]. If non-native species establish stable breeding populations and introgression
into wild populations is pervasive, then local genetic variation can be swamped and even-
tually lost [7,9,10]. Therefore, it is important to understand the impacts of interaction and
hybridization between native and anthropogenically introduced non-native taxa.
Many species in the pigeon and dove family (Aves; Columbidae) have experienced
introductions or invasions. In North America, six of the ~54 occurring columbid (hereafter:
“dove”) species have been introduced by humans [11]. Eurasian Collared-Dove (Streptopelia
decaocto) and feral Rock Pigeon (Columba livia domesticus; a.k.a., “feral pigeon”), both native
to Eurasia and northern Africa, are the most widespread of these and overlap widely with
native populations of other doves such as Mourning (Zenaida macroura), and White-winged
(Zenaida asiatica). Rock Pigeon was originally brought to North America by European set-
tlers during the 1600’s [12], and has now established feral breeding populations throughout
all of North America (Figure 1) [11,13,14]. Eurasian Collared-Dove was introduced more
recently in the 1970’s [15,16], but has followed a similar trajectory and is now present across
much of southern and western North America [17]. Although they are native to North
America, White-winged Doves have also expanded through intentional releases by peo-
ple [18,19], and due to increased urban land cover that has spurred a significant northward
expansion out of Central Mexico over the last 60 years [13,20–22]. These range expansions
have created broad overlap in the breeding and year-round ranges of Eurasian Collared,
White-winged, and Mourning Doves and Rock Pigeons, most notably in the southwestern
United States where all four overlap extensively [11,13,14]. This overlap may bring the
four species into competition for resources that limits populations [23,24]. In addition,
the potential for interspecific matings in the areas of overlap provides an opportunity for
Animals 2021, 11, x 3 of 20
investigating the effects of contemporary gene flow from established non-native and feral
populations on the genomes of native species.
Figure 1. Geographic distribution of Rock Pigeon, Eurasian Collared-Dove, Mourning Dove and
White-winged Dove. Star denotes sampling sites (sample specifics can be found in Supporting
Information Table S1).
Figure 1. Geographic distribution of Rock Pigeon, Eurasian Collared-Dove, Mourning Dove and White-winged Dove. Star
denotes sampling sites (sample specifics can be found in Supporting Information Table S1).
Hybridization is frequent in many avian clades, with ~16% of species across all birds
known to hybridize [25]. These high rates are likely a result of their strong dispersal ability
[26], chromosomal stasis [27], and relatively slow development of reproductive isolation [28].
Although pre-zygotic barriers can be an early driver of avian reproductive isolation [29,30],Animals 2021, 11, 2677 3 of 19
Hybridization is frequent in many avian clades, with ~16% of species across all birds
known to hybridize [25]. These high rates are likely a result of their strong dispersal
ability [26], chromosomal stasis [27], and relatively slow development of reproductive
isolation [28]. Although pre-zygotic barriers can be an early driver of avian reproductive
isolation [29,30], post-zygotic barriers to reproduction (e.g., hybrid sterility) are extremely
slow to develop in avian lineages [31–33]. Even intergeneric hybrids have been recorded
in many avian families [34]. As a result, cases of allopatric speciation followed by sec-
ondary contact and hybridization are prevalent in birds [35–38]. Even though the large
southwestern doves are not each other’s closest relatives [39,40], their recent extensive
secondary contact following biogeographic histories of substantial allopatry may be pro-
ducing opportunities for hybridization and introgression. There are isolated records of
hybridization in Europe between Eurasian Collared-Dove and Rock Pigeon, in captivity
between Eurasian Collared- and Mourning doves, and in captivity between Mourning
Dove and Rock Pigeon [34]. There are also anecdotal records of putative Mourning and
Eurasian Collared-Dove hybrids in the United States [41]. However, there has been no
detailed investigation using genetic data into the presence or extent of hybridization in
these species.
Our primary objective was to use detailed sampling and genome-wide data to evaluate
the impact of population dynamics and gene flow on the evolutionary histories and current
genetic diversity of the four large dove species in southwest North America. First, we
estimated divergence across the genomes among all four species. Next, we tested for
evidence of recent hybridization using a suite of methods. We then used coalescent
analyses and model comparisons to evaluate the presence and rate of interspecific gene
flow over evolutionary timescales. Finally, in a novel use of site-frequency spectrum
based demographic analyses we reconstructed the effective population size of each species
through time. We use results from these tests to discuss the history of genetic diversity and
hybridization in these species and to project their future impacts on populations.
2. Materials and Methods
2.1. Sampling and DNA Extraction
From September–October of 2019, we opportunistically sampled 182 wing or breast
tissues from hunter-shot Eurasian Collared-Dove (n = 29), feral Rock Pigeon (n = 33),
Mourning Dove (n = 61), and White-winged Dove (n = 59) in southwestern New Mexico
(Figure 1; Supporting Information Table S1). All sampled Rock Pigeon were considered to
be feral as they displayed great variation in color and pattern, including brown and beige
phenotypic coloration [42]. DNA was extracted using Qiagen’s DNeasy Blood & Tissue kit
and following the manufacturer’s protocols (Qiagen, Valencia, CA, USA).
2.2. Mitochondrial DNA
A 500-base pair (bp) fragment of the mtDNA cytochrome oxidase subunit 1 (COI) gene was
amplified and sequenced in Eurasian Collared-Dove, White-winged Dove, and Mourning Dove
samples using newly designed primers DOVR (50 -GGTTKCGGTCYGTRAGTAG-30 ) and DOVF
(50 -RGGAGAYGACYMAATCTMYA-30 ). Additional primers were designed for Rock Pigeon
PigR (50 -AGGTTTCGGTCTGTGAGCAG-30 ) and PigF (50 -CCTCCTCATCCGAGCAGAAC-30 ).
Mitchondrial COI sequences available in Genbank for each of the four dove species were
aligned and locations of limited variability were targeted when designing primers. Frag-
ments were amplified using an optimized touchdown PCR protocol on a 15 µL PCR
solutions (see details in Supplementary Materials Document S1). Amplification was ver-
ified using gel electrophoresis with a 1% agarose gel, PCR products were cleaned using
ExoSAP-IT® (USB Corporation, Cleveland, OH, USA), and final products were sequenced
on a 3130XL Genetic Analyzer at the University of Texas El Paso, Border Biomedical Re-
search Center’s Genomic Analysis Core Facility. Raw Sanger sequences were aligned and
edited using SEQUENCHER v4.8 (Gene Codes, Inc., Ann Arbor, MI, USA). All sequencesAnimals 2021, 11, 2677 4 of 19
have been submitted to GenBank (Accession Numbers OK086092–OK086272; Supporting
Information Table S1).
2.3. ddRAD-Seq Library Preparation
ddRAD-seq libraries were created using Sbfl and EcoRI restriction enzymes, followed
by ligating adapters containing sequences compatible for Illumina TruSeq reagents and bar-
codes for de-multiplexing. In general, ddRAD-seq protocols followed [43]; also see [36,44],
but with size selection (mean size = 350 base-pairs; range 100–500 base-pairs) following
a double-sided magnetic bead-based protocol developed here, and outlined in detail in
Supporting Information Document S1. After ddRAD-seq library prep, all samples were
pooled in equimolar amounts, and the multiplexed library was sequenced on an Illumina
HiSeq X using single-end 150 bp chemistry at NovoGene (Novogene Co., Ltd., Sacramento,
CA, USA). All raw Illumina reads are deposited in NCBI’s Sequence Read Archive (SRA;
http://www.ncbi.nlm.nih.gov/sra accessed on 6 August 2021; BioPoject PRJNA761761;
Bio Sample Accession Numbers SAMN21362192–SAMN21362373; Supporting Information
Table S1).
2.4. Bioinformatics of ddRAD-Seq Data
Raw reads were de-multiplexed based on perfect barcode/index matches using the
script ddRADparser.py [43]. We then used trimmomatic [45] to trim or discard poor quality
sequences, with remaining quality reads then aligned to the Rock Pigeon reference genome
(NCBI’s Sequence Read Archive data BioProject PRJNA347893: BioSample Accession
Number SAMN02981415; [46]) ) using the Burrows Wheeler Aligner v. 07.15 (bwa, Auburn
Hills, MI, USA [47]). Next, samples were sorted and indexed in Samtools v. 1.6 [48] and
combined using the “mpileup” function with the following parameters “-c-A-Q 30-q 30”
which set a base pair and overall sequence PHRED score of ≥30 to ensure that only high
quality sequences are retained. All steps through “mpileup” were automated using a
custom in-house Python script (Python scripts available at https://github.com/jonmohl/
PopGen accessed on 6 August 2021; [44]). Next, VCF files for each marker, as well as
concatenated autosomal and Z-sex chromosome markers, were converted to FASTA file
formats using the program PGDspider v2.1.1.2 [49], with base-pair retention based on
a minimum allele depth of 5× (i.e., 10× per genotype) and quality per base PHRED
scores of ≥30. We then further filtered each FASTA file to remove base positions havingAnimals 2021, 11, 2677 5 of 19
MCMC generations with sampling every 5000 generations to ensure that effective sample
size (ESS) values across estimated parameters were >50 (see details in Supplementary
Materials Document S1). We note that multiple independent runs were done, with all of
them converging to similar estimates and phylogenetic relationships, as well sufficient
mixing among MCMC traces for each estimated perimeter. Consequently, the final species
tree was based on the *Beast longest run.
Next, a nuclear species tree was reconstructed in the program TreeMix version 1.12 [57],
and rooted with data from shared ddRAD-seq loci from a wild Mallard sequenced using the
same ddRAD-seq protocol. Note that any putative contemporary hybrids identified in the
structure analyses above were excluded from this and all subsequent tests of evolutionary
history using nuclear DNA in order to reduce the impacts of very recent events on inference.
TreeMix was also used to test for historical gene flow. Specifically, we simultaneously
estimated a maximum likelihood (ML) species tree and the direction and weight (w) of
gene flow among taxa based on allele frequencies. Analyses were run across each bi-
allelic SNP (-k 1), with global rearrangement occurring during tree building (-global),
and with nodal support based on 1000 bootstraps. The optimum number of migration
edges was determined by sequentially adding migration events up to ten (−m 0–10), and
then evaluating the proportion of the variance explained by each migration model. In
order to limit overconfidence in the tree model, migration edges were added until >98%
of the variance in the tree model was explained. Finally, likelihood ratios and standard
errors (-se) were calculated to assess significance between tree models and migration edges,
respectively (see details in Supplementary Materials Document S1).
2.6. Population Structure & Diversity Statistics
For mtDNA, we visualized population structure by creating a haplotype network in
the program NETWORK v10.1 [58].
For nuclear DNA, population structure was based on bi-allelic ddRAD-seq autosomal
SNPs. First, we performed Principle component analysis (PCA) as implemented in the
package adegenet in R (i.e., “dudi.pca” [59]; also see [60]. Next, we calculated maximum-
likelihood-based individual assignment probabilities using the program ADMIXTURE
v1.3.0 [61,62]. We evaluated K population values of one through ten, with 100 runs at
each K. The optimum K was based on the lowest average of CV-errors across 100 analyses
per evaluated K value. Results were combined across runs using CLUMPP V. 1.1 [63].
Finally, we evaluated relationships and admixture among samples based on co-ancestry
assignments in the program fineRADstructure [64]. All detailed population structure
methods can be found in Supplementary Materials Document S1.
Values of nucleotide diversity (π) and pair-wise species ΦST values were estimated
across ddRAD-seq autosomal and Z-chromosome linked loci as well as mtDNA in VCFtools
version 0.1.11 [50] and DnaSP 6 [65], respectively. Nuclear loci were plotted by genomic
location to look at patterns of genomic divergence.
2.7. Effective Population Size, Divergence Time, and Migration Rates
For mtDNA, Isolation-with-Migration models as implemented in IM [66,67] were used
to estimate effective population size, divergence time, and migration rates for pairwise
comparisons of all four species (see specifics in Supporting Information Document S1).
In short, IM simultaneously calculates posterior probability densities of population sizes,
divergence time, and migration rates from non-recombinant sequence fragments using
Bayesian MCMC algorithms [68].
For nuclear DNA, we used the program ∂a∂i [69,70], which implements a diffusion-
based approach to test empirical data against specified evolutionary models (e.g., Isolation-
with-Migration; also see detailed methods in Supporting Information Document S1). Briefly,
∂a∂i determines the best fit evolutionary model using a site-frequency spectrum derived
across all base-pair positions. We tested three evolutionary models including Isolation-with-
Migration, Split-Migration (i.e., recurring secondary contact), and Neutral-No-DivergenceAnimals 2021, 11, 2677 6 of 19
(all developed scripts can be found here: https://github.com/jibrown17/Dove_dadi.
pairwise.comparisons accessed on 6 August 2021). We used the best fit model as determined
by ∂a∂i to calculate the optimal parameter values as well as uncertainty metrics (i.e.,
standard deviation [69,71]).
Finally, to convert parameter estimates from IM and ∂a∂i into biologically informative
values, we estimated generation time (G) and mutation rates per locus (µ; also see detailed
methods in Supporting Information Document S1). We used an average mitochondrial
mutation rate for birds of 1.035 × 10⁻⁸ substitutions/site/year [72]. For nuclear DNA, the
mean avian nuclear mutation rate (1.2 × 10⁻⁹ substitutions/site/year [73]) is unlikely to
be representative of our four species (i.e., Columbiformes tend to show slower mutation
rates [74]) or the subset of the genome present in our ddRAD-seq markers. Instead,
we calibrated ∂a∂i parameters to the average time determined in our *BEAST analysis
of mtDNA for the split between the Eurasian (i.e., Eurasian Collard-Doves and Rock
Pigeons) and North American (White-winged and Mourning Doves) clades. This provided
a calibrated nuclear mutation rate that was then used to convert remaining ∂a∂i parameter
values [75] (see details in Supplementary Materials Document S1). Mutation rates were
then scaled to the generation time for each species and multiplied by the total number of
base pairs for mtDNA (419 bp) and nuclear DNA (79,862 bp) to obtain respective mutation
rates scaled to substitutions/site/generation (s/s/g).
2.8. Historical Population Demography through Time
Long-term demographic histories of each species were determined using a novel ∂a∂i
model that estimates effective population size through time using partial genome sequence
information (see details in Supplementary Materials Document S1). In short, using all
recovered ddRAD-seq autosomal loci, we created a one-dimensional (i.e., single species)
site-frequency spectrum (SFS) for each species where Nexus formatted SNP datasets are
transformed into species-specific SFS using custom python scripts (all developed scripts
can be found here: https://github.com/jibrown17/Dove_dadi.demographics accessed on
6 August 2021). The SFS was then folded and masked at sites with variants present in only
one or all samples, and each dataset run through our custom model (all developed scripts
can be found here: https://github.com/jibrown17/Dove_dadi.demographics accessed
on 6 August 2021) where effective population size is estimated through a series of time
intervals. Our stepwise time interval function uses 100 iterations of the single population
integration function (‘Integration.one_pop’ in ∂a∂i) to model a continuous transformation
of effective population size through time. The ancestral effective population size of vAnc ,
exists for some time-period, TAnc , before estimating the effective population size, vn , for
some time interval, Tn , at each subsequent integration step. Effective population size is
then estimated for time intervals in the past, starting with T0 , until the present day, T99 , and
the ancestral population will have occurred at time, T99 + T98 + T97 . . . + T1 + T0 + TAnc .
This stepwise function is then used to model an SFS that is subsequently fit to the empirical
data for each species through parameter optimization, which we then compare across
50 runs per species. Final optimal parameters are scaled to the empirical data using θ
(θ = 4NANC × µ; NANC = Ancestral effective population size), and based on the obtained
calibrated mutation rate (see above; see details in Supplementary Materials Document S1).
Goodness of fit for each species’ model SFS was based on the log-likelihood of the model
given the empirical data. Finally, we calculated the 95% confidence intervals (CI) using the
parameter uncertainty metrics included in ∂a∂i (see details in Supplementary Materials
Document S1). The effective population size and time parameters were converted into
biologically informative numbers as previously described, and based on generation time
(G), age of sexual maturity (α), survival, and the substitution rate calibrated with previously
determined divergence estimates (see details in Supplementary Materials Document S1).Animals 2021, 11, 2677 7 of 19
3. Results
A total of 419 base-pairs (bp) of overlapping mtDNA COI sequence was obtained
across samples, with the exception of one Mourning Dove (Supporting Information
Table S1). For ddRAD sequencing, a total of 377 million raw HiSeq Illumina reads were
recovered across all samples. After quality filtering, a total of 81,416 base-pairs (bp) of
overlapping sequence was recovered across 27 autosomal chromosomes (79,862 bp) and
the Z-sex chromosome (1554 bp; Supporting Information Figure S1). Across sites, we
recovered an average per sample median sequencing depth of 119 (per sample average
depth range = 58 –148). We identified 24 of 81,416 (~0.03%) base-pair positions across 8
of 28 chromosomes that deviated from Hardy-Weinberg Equilibrium. Given the small
number of SNPs involved, we conclude that our data filtering strategies were sufficient
to limit allele dropout and did not exclude these SNPs from our final dataset. Finally, we
were able to identify the sex of all individuals using the ratio of sequencing depth and
heterozygosity between autosomal and Z-sex chromosome linked markers (Supporting
Information Figure S2).
Nucleotide diversity differed among species and between marker types (Table 1).
Whereas Mourning Dove showed a two- and three-fold higher nucleotide diversity at
ddRAD-seq Z-sex and autosomal chromosomes, respectively, Eurasian Collared-Doves
had three to four-fold higher calculated nucleotide diversity at mtDNA as compared to the
remaining dove species.
Table 1. Nucleotide diversity and effective population size (NE ) estimates.
∂a∂i ddRAD-Seq ∂a∂i ddRAD-Seq
ddRAD-Seq ddRAD-Seq
mtDNA COI Autosomal Autosomal
Z-Sex Autosomal Census
Nucleotide Based NE Based NE
Nucleotide Nucleotide (Millions)
Diversity (π) (Millions) (Millions)
Diversity (π) Diversity (π)
Paired Species Single Species
Eurasian Collared-Dove 0.0024 0.0064 0.0088 0.60 2.95 85 1
Rock Pigeon 0.00084 0.0073 0.0081 0.95 9.03 140 1,2
Mourning Dove 0.00072 0.015 0.023 1.22 5.08 249 1,3
White-winged Dove 0.00057 0.0062 0.0089 1.04 5.58 14 1
1 : Partners in Flight. In Avian Conservation Assessment Database. 2017. Available online: http://pif.birdconservancy.org/acad/database.aspx
(accessed on 28 April 2020). 2 : Allison, A.B.; Mead, D.G.; Gibbs, S.E.; Hoffman, D.M.; Stallknecht, D.E. West Nile virus viremia in wild rock
Rock Pigeon. Emerg. Infect. Dis. 2004, 10, 2252–2255. 3 : Seamans, M.E. Mourning Dove Population Status; U.S. Department of the Interior,
Fish and Wildlife Service, Division of Migratory Bird Management: Laurel, Maryland, 2019.
3.1. Phylogenetics
For mtDNA, a Hasegawa-Kishino-Yano (HKY) substitution model with a relaxed
exponential clock (Bayes Factor = 3.30) was found to be the optimal model for the *BEAST
species tree. The nuclear TreeMix species tree was reconstructed from allele frequencies
calculated from 11,175 (of 11,856) independent bi-allelic ddRAD-seq autosomal SNPs that
met our filtering criteria. A TreeMix species tree without gene flow was the optimum model
and was found to explain >99% of the variance. Trees including migration edges (i.e., gene
flow) were not statistically better (X2 critical value < 1), nor were any of the identified mi-
gration edges supported (p-value > 0.1). As expected, both trees recovered well-supported
sister relationships between the two Eurasian (Rock Pigeon and Eurasian Collared-Dove)
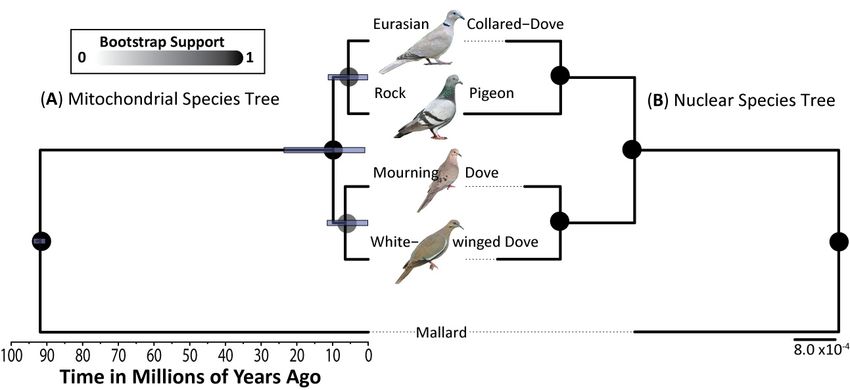
and two North American (Mourning and White-winged doves) species (Figure 2). Using
a known divergence time between Anseriformes and Columbiformes of 93 million years
before present [56], and an overall avian mtDNA mutation rate of 1.035 × 10⁻⁸ [76], we
estimated a divergence time between Eurasian and North American clades at 9.8 Mya (95%
Highest Posterior Density [HPD] = 0.95–23.59). Divergence time for species within the
North American and Eurasian clades was 6.4 Mya (95% HPD = 0.15–11.49) and 5.6 Mya
(95% HPD = 0.18–11.23), respectively (Figure 2A).a known divergence time between Anseriformes and Columbiformes of 93 million years
before present [56], and an overall avian mtDNA mutation rate of 1.035 × 10⁻⁸ [76], we
estimated a divergence time between Eurasian and North American clades at 9.8 Mya
(95% Highest Posterior Density [HPD] = 0.95–23.59). Divergence time for species within
Animals 2021, 11, 2677 the North American and Eurasian clades was 6.4 Mya (95% HPD = 0.15–11.49) 8 ofand
19 5.6
Mya (95% HPD = 0.18–11.23), respectively (Figure 2A).
Figure 2. Species
Figure treetree
2. Species reconstruction
reconstruction of ofsampled
sampled Rock
Rock Pigeon,
Pigeon, Eurasian
Eurasian Collared-Dove,
Collared-Dove, MourningMourning
Dove, and Dove, and White-
White-winged
winged Dove,
Dove, as well
as well as a mallard
as a mallard that served
that served as an outgroup
as an outgroup (Supporting
(Supporting Information
Information Table
Table S1), and S1),onand
based (A) based on (A) a
a *BEAST
*BEAST analysis
analysis of 419ofbase-pairs
419 base-pairs of the cytochrome
of the cytochrome oxidase
oxidase subunit subunit
1 (COI) gene1or(COI) gene or analysis
(B) a TreeMix (B) a TreeMix
of 11,053analysis of 11,053
independent
independent
ddRAD-seqddRAD-seq
autosomalautosomal bi-allelic
bi-allelic SNPs SNPsanand
and under undermodel
optimum an optimum model of no migration.
of no migration.
3.2. Population Structure & Recent Hybridization
The four dove species were highly divergent with elevated composite estimates of
relative differentiation (ΦST ) for ddRAD-seq (Avg. Autosomal ΦST = 0.68; Avg. ddRAD-
seq Z-Sex Chromosome ΦST = 0.56) and mtDNA (Avg. ΦST = 0.99) markers (Figure 3C).
Moreover, locus-by-locus estimates of ΦST for ddRAD-seq loci showed large portions of
the nuclear genome were fixed in pair-wise species comparisons (Figure 3A,B). To limit any
issues due to heterogamy of the distinct evolutionary history of the Z-sex chromosome, fur-
ther analyses of population structure and evolutionary history were based on either mtDNA
or autosomal ddRAD-seq markers only. As expected given the nearly fixed estimates of
ΦST for mtDNA markers (ΦST > 0.97; Figure 3C), we recovered reciprocal monophyly in
our haplotype analysis, where no haplotypes were shared among the four dove species
(Figure 4D). Among the four species, Mourning Dove (Nhaplotypes = 10) were most diverse
for mtDNA COI haplotypes, followed by White-winged Dove (Nhaplotypes = 8), Rock Pigeon
(Nhaplotypes = 5), and Eurasian Collared-Dove (Nhaplotypes = 4); all four species possessed
minor haplotypes largely distinguished by a single mutation from their respective major
haplotype (Figure 4D).
Further population genetic structure analyses included the same 11,175 independent
bi-allelic ddRAD-seq autosomal SNPs as used in species tree analysis (Figure 2B). AD-
MIXTURE (Figure 4A), PCA (Figure 4B), and fineRADstructure (Figure 4C) analyses all
identified four distinct clusters that correspond with species designations. Although AD-
MIXTURE analyses assigned all samples to their respective species with >95% assignment
probability (Figure 4A), some individuals had low levels of mixed assignment probabil-
ity. Further scrutiny of six of these individuals in fineRADstructure results revealed that
they had elevated co-ancestry assignments to more than one species across the genome,
which resulted in placement on isolated branches in the fineRADstructure dendrogram
(Figure 4C). The individuals with mixed ancestry involved the following ancestry combi-
nations: (1) Mourning Doves (n = 4) with some ancestry from White-winged Dove (n = 2),
Rock Pigeon (n = 1), or a mix of White-winged Dove and Eurasian Collared-Dove (n = 1);
(2) a single Eurasian Collared-Dove with some ancestry from Mourning Dove; and (3) one
White-winged Dove with some ancestry from Mourning Dove (also see inset in Figure 4).any issues due to heterogamy of the distinct evolutionary history of the Z-sex chromo-
some, further analyses of population structure and evolutionary history were based on
either mtDNA or autosomal ddRAD-seq markers only. As expected given the nearly fixed
estimates of ФST for mtDNA markers (ФST > 0.97; Figure 3C), we recovered reciprocal mon-
Animals 2021, 11, 2677
ophyly in our haplotype analysis, where no haplotypes were shared among the9four of 19
dove
species (Figure 4D). Among the four species, Mourning Dove (Nhaplotypes = 10) were most
diverse for mtDNA COI haplotypes, followed by White-winged Dove (Nhaplotypes = 8), Rock
Pigeon (Nhaplotypes
In addition, = 5),six
these and Eurasianclustered
individuals Collared-Dove (Nhaplotypes
away from = 4); all four
their respective species
primary possessed
species
in the PCA and closer to the cluster representing the putative “minor” source
minor haplotypes largely distinguished by a single mutation from their respective major of ancestry
(Figure 4B).
haplotype (Figure 4D).
Figure 3. The
Figure (A) site-frequency
3. The spectrum
(A) site-frequency spectrum(SFS)
(SFS)and
and (B) per chromosome
(B) per chromosomelocation
location pair-wise
pair-wise relative
relative differentiation
differentiation (ΦST ) (ΦST)
estimates between
estimates Rock
between Pigeon,
Rock Eurasian
Pigeon, EurasianCollared-Dove, MourningDove
Collared-Dove, Mourning Doveand
and White-winged
White-winged Dove Dove estimated
estimated acrossacross
the the
Z-sexZ-sex
and 27 autosomal chromosomes (also see Supporting Information Figure S1). We also provide (C)
and 27 autosomal chromosomes (also see Supporting Information Figure S1). We also provide (C) the composite the composite
pair-wise relative
pair-wise ΦSTΦestimates
relative between the four dove species and across the mitochondrial cytochrome oxidase subunit
ST estimates between the four dove species and across the mitochondrial cytochrome oxidase subunit 1
1 (COI)
(COI) gene, as well as concatenated datasets
gene, as well as concatenated ofeach
datasets of eachddRAD-seq
ddRAD-seq autosomal
autosomal and and
Z-sexZ-sex chromosome
chromosome linked linked
loci. loci.
3.3. Optimum Evolutionary Models and Estimated Parameters
Though ESS values were ≥50 across all comparisons in mtDNA IM analyses, likeli-
hood distributions for some parameters (ancestral effective population size and time since
divergence) did not converge in any pair-wise species comparisons (Supporting Information
Figures S3–S6). For nuDNA, ∂a∂i returned an optimum evolutionary model of Split-with-
Migration for all but two comparisons. A Split-without-Migration was favored in the Rock
Pigeon and Mourning Dove comparison, and an Isolation-with-Migration model in the
White-winged Dove and Mourning Dove comparison (Supporting Information Table S2).
Nuclear ∂a∂i parameters, when calibrated using divergence times estimated from the
*Beast mtDNA species tree, included an average autosomal mutation rate of 1.95 × 10⁻¹⁰
mutations/site/year. We recovered similar ancestral population sizes across pairwise
species analyses (Figure 5A) that were substantially lower than each species’ contempo-
rary effective population size (Figure 5B), supporting the idea that all four species have
undergone recent population expansion (also see Figure 6). All contemporary effective
population sizes estimated from mtDNA and nuDNA had broadly overlapping confidence
intervals, with Mourning Doves generally possessing the largest effective population sizes,
followed by White-winged Dove, and near equal estimates for Rock Pigeon and Eurasian
Collared-Dove (Figure 5B; Table 1). Consistent with reciprocal monophyly recovered in the
mtDNA haplotype network (Figure 4D), posterior distributions for all pair-wise species IM
analyses overlapped zero gene flow (Figure 5D). Conversely, nuclear-based ∂a∂i results
indicated that an evolutionary model that incorporates gene flow was the best fit for five ofAnimals 2021, 11, 2677 10 of 19
the six species comparisons (Supplementary Materials Table S2); although all estimates of
gene flow were < 1 migrant per generation (Migrants/generation = 0.00–0.22; Figure 5D).
Finally, based on the applied mutation rate, we recovered a stepwise pattern of divergence
Animals 2021, 11, x 10 of 20
times for nuclear DNA between the four dove species, with Mourning and White-winged
Dove diverging most recently (Figure 5C).
Figure
Figure4. 4.
Individual
Individual assignments
assignmentsandandclustering
clustering ofof sampled Rock Pigeon
sampled Rock Pigeon(RD),
(RD),Eurasian
EurasianCollared-Dove
Collared-Dove (EC),
(EC), Mourning
Mourning
Dove
Dove (MD), and White-winged Dove (WW) that were based on a 11,175 bi-allelic ddRAD-seq autosomal SNP dataset, andand
(MD), and White-winged Dove (WW) that were based on a 11,175 bi-allelic ddRAD-seq autosomal SNP dataset,
visualized
visualizedasas(A) ADMIXTURE
(A) ADMIXTURElikelihood
likelihoodassignment probabilitiesbased
assignment probabilities basedononKKmodels
modelsofof4–6,
4–6, (B)
(B) the
the first
first twotwo components
components
of the Principle component analysis (PCA), and (C) a matrix of individual (above the diagonal)
of the Principle component analysis (PCA), and (C) a matrix of individual (above the diagonal) and average (belowand average (below
thethe
diagonal) co-ancestry coefficients along with the resulting dendrogram from the fineRADstructure analysis. Note that
diagonal) co-ancestry coefficients along with the resulting dendrogram from the fineRADstructure analysis. Note that
coancestry ranges from low (yellow) to high (blue) as indicated by the color scale. Inset identifies the six samples found to
coancestry ranges from low (yellow) to high (blue) as indicated by the color scale. Inset identifies the six samples found
be admixed and provides their genetic constitutions as determined from ADMIXTURE analyses. The six hybrids are nu-
to be admixed and provides their genetic constitutions as determined from ADMIXTURE analyses. The six hybrids are
merically denoted and their positions identified across analyses. The numbers correspond to the sample locations across
numerically denoted and their positions identified across analyses. The numbers correspond to the sample locations across
nuclear based analyses (A–C). Finally, we visualize (D) mitochondrial DNA relationships through a median-joining net-
nuclear
work where based
sizeanalyses (A–C).
of circles Finally, wetovisualize
corresponds (D) mitochondrial
total number DNA
of individuals relationships
with throughand
that haplotype, a median-joining
branch lengths network
indicate
where size of circles corresponds to total number of individuals with that haplotype,
the number of mutations separating haplotypes; all branches with >1 mutation are noted. and branch lengths indicate the number
of mutations separating haplotypes; all branches with >1 mutation are noted.
Further population genetic structure analyses included the same 11,175 independent
bi-allelic ddRAD-seq autosomal SNPs as used in species tree analysis (Figure 2B). AD-
MIXTURE (Figure 4A), PCA (Figure 4B), and fineRADstructure (Figure 4C) analyses all
identified four distinct clusters that correspond with species designations. Although AD-
MIXTURE analyses assigned all samples to their respective species with >95% assignment
probability (Figure 4A), some individuals had low levels of mixed assignment probability.
Further scrutiny of six of these individuals in fineRADstructure results revealed that they had
elevated co-ancestry assignments to more than one species across the genome, which resultedAnimals 2021, 11, 2677 12 of 11
20of 19
Figure 5. Box5.plots
Figure Boxare of values
plots are ofacross pair-wise
values species
across IM and/or
pair-wise ∂a∂i analyses
species of the mitochondrial
IM and/or ∂a∂i analyses (mtDNA)
of the cytochrome
mitochon-
oxidase
drialsubunit
(mtDNA) 1 genecytochrome
or ddRAD-seqoxidase
autosomal loci, respectively,
subunit 1 gene orand estimates of autosomal
ddRAD-seq (A) ancestral loci,
effective population size,
respectively, and
(B) estimates
effective population sizes of contemporary Eurasian Collared-Dove (EC), Rock Pigeon (RP),
of (A) ancestral effective population size, (B) effective population sizes of contemporaryMourning Dove (MD), and
White-winged Dove (WW), (C) divergence time, and (D) migration rates (directionality is denoted as “from > to”). Note
Eurasian Collared-Dove (EC), Rock Pigeon (RP), Mourning Dove (MD), and White-winged Dove
that IM analyses of mtDNA did not converge for ancestral effective population size and divergence times (Supporting
(WW), (C) divergence time, and (D) migration rates (directionality is denoted as “from > to”). Note
Information Figures S3–S6); and thus, marker comparisons were only achieved for per-species effective population size and
that IM analyses of mtDNA did not converge for ancestral effective population size and divergence
migration rates. For comparison, diamonds within contemporary size estimates (top right) denote the most recent effective
times (Supporting
population size as obtainedInformation Figures
from the per species S3–S6); demographic
time-series and thus, markeranalysescomparisons
(i.e., Figure 6). were only achieved
for per-species effective population size and migration rates. For comparison, diamonds within con-
temporary size estimates (top right) denote the most recent effective population size as obtained
from the per species time-series demographic analyses (i.e., Figure 6).Animals
Animals 11,x2677
2021,11,
2021, 12 of 19 13 of 2
Figure6.6. Per
Figure speciestime-series
Per species time-seriesdemographic
demographic analyses
analyses andand associated
associated 95% 95% confidence
confidence intervals es
intervals
estimated using our developed single species ∂a∂i model, and based on bi-allelic ddRAD-seq autosomal autoso
timated using our developed single species ∂a∂i model, and based on bi-allelic ddRAD-seq
mal SNPs
SNPs for (A)for (A)Pigeon,
Rock Rock (B)
Pigeon, (B) Collared-Dove,
Eurasian Eurasian Collared-Dove,
(C) Mourning(C) Mourning
Dove, Dove, and (D) White
and (D) White-winged
Dove (E). We also provide overlapping optimum estimates across the four dove species forfour
winged Dove (E). We also provide overlapping optimum estimates across the dove species fo
comparison.
comparison.
3.4. Historical Population Sizes
3.4. Historical
Time-seriesPopulation Sizes
estimates of effective population size using the novel ∂a∂i demographic
models retained near identical estimates of effective population size (Ne = 1.37–2.65 million
Time-series estimates of effective population size using the novel ∂a∂i demographi
individuals) prior to ~10 Mya (Figure 6E). Rock Pigeon was the first species to deviate
models retained near identical estimates of effective population size (Ne = 1.37–2.65 million
individuals) prior to ~10 Mya (Figure 6E). Rock Pigeon was the first species to deviat
approximately 9 Mya and steadily increased in size for five million years before peaking
at 11.1 million individuals, it then declined until ~1.4 Mya before rapidly increasing toAnimals 2021, 11, 2677 13 of 19
approximately 9 Mya and steadily increased in size for five million years before peaking
at 11.1 million individuals, it then declined until ~1.4 Mya before rapidly increasing to
reach a contemporary effective population size of nine million (95% CI 6.71–11.35 million;
Figure 6A). Eurasian Collared-Dove showed a similar trend, rapidly increasing from the
ancestral state about four million years ago before showing declines over the last two
million years to a contemporary effective population size of three million individuals (95%
CI 2.77–3.12 million; Figure 6B). Finally, both Mourning and White-winged Dove deviated
from the ancestral state ~3.5 Mya and have continued increasing, with contemporary
effective population sizes of ~5 million (Mourning Dove 95% CI = 4.34–5.81 million; White-
winged Dove 95% CI = 4.84–6.33 million; Figure 6C,D).
4. Discussion
4.1. Largely Allopatric Evolutionary Histories Lead to Highly Divergent Genomes among Four
Dove Species
We identified population genetic structure and genome-wide divergence among
the study species, with haplotypes from the sequenced COI portion of the mitogenome
(Figure 4) and 10–60% (Figure 3) of the sampled nuclear genome fixed between species.
Moreover, migration estimates over evolutionary time indicate little genomic exchange.
All pair-wise species migration rates wereAnimals 2021, 11, 2677 14 of 19
ture co-ancestry matrices. fineRADstructure gives more weight to rare alleles and is more
sensitive to low levels of admixture that are expected in backcrosses [64]. Taken together,
these results support the identification of these individuals as putative late-stage back-
crossed hybrids. While intergeneric hybrids are thought to be rare, they are widespread in
many avian groups (e.g., [87–89]). Viable intergeneric hybrids involving Eurasian Collared-
Doves, Rock Pigeons, and Mourning Doves have been found previously [34], and there
are anecdotal records in public repositories of hybrids in North America, at least between
Eurasian Collared- and Mourning doves [41]. Therefore, our identification of putative
hybrids in population genomic data from these species is not entirely improbable.
We did not, however, recover any early generation hybrids (i.e.,Animals 2021, 11, 2677 15 of 19
the different geographic regions sampled across these studies. Similarly, we recovered an
increasing Ne over the last 1.1 million years for Rock Pigeons, while previous work using
full genomes finds a sharp decline to low or near-zero levels (~500,000 [96,100]). However,
these genome-based studies included just a few or only one individual, often obtained
directly from domestic settings [96,100]. The precipitous decline in effective population
size they identified in Rock Pigeon could be attributable to uncertainty resulting from
the small sample size coupled with the effects of inbreeding in captivity. We also caution,
however, against over-interpretation of our effective population size results for Rock
Pigeons and Eurasian Collared-Doves based on individuals sampled in North America.
These populations are not only introduced into North America, but from domesticated
stock [12,15]. Founder events and domestication likely have resulted in reduced genetic
diversity, which is known to bias demographic analyses, particularly at more recent time
estimates [96,101]. We suggest that the sampling of individuals be carefully considered in
studies of historical demography and also recommend approaches, like the novel step-wise
methods presented here, that integrate information across multiple individuals.
5. Conclusions
Overall, our results indicate that substantial genome-wide divergence is present in
the four large doves of southwestern North America, and that recent widespread sympatry
in the region has not led to rampant anthropogenic hybridization. Although the four
species exhibit distinct demographic trajectories in the past, further monitoring will clarify
whether current and future populations continue on these same trends. Future work will
also benefit from increasing geographic and genomic sampling of these doves to determine
if hybridization rates vary geographically or demographic inferences differ depending on
the geographic origins of sampled individuals.
Supplementary Materials: The following are available online at https://www.mdpi.com/article/10.3
390/ani11092677/s1, Table S1: Sample information, Table S2: ∂a∂i model likelihood comparisons
for pair-wise species comparisons, Supporting Information Document S1: Detailed ddRAD-Seq
library preparation methods and detailed ∂a∂i methods to estimate effective population size, diver-
gence time, and migration rates, Figure S1: Total number of base-pairs recovered across nuclear
chromosomes, Figure S2: Genetic based sex identification across samples, Figure S3: Posterior
distributions of pair-wise species migration rates as estimated in IM using the mtDNA COI gene,
Figure S4: Posterior distributions of pair-wise species ancestral and per species effective population
sizes as estimated in IM using the mtDNA COI gene, Figure S5: Posterior distributions from pair-wise
species ancestral and per species effective population sizes as estimated in IM using the mtDNA COI
gene, Figure S6: Optimum ∂a∂i models and their associated SFS and likelihoods across single species
demographic and pair-wise species analyses.
Author Contributions: P.L. conceptualized the project and supported data acquisition. F.H., J.I.B. &
M.K. collected and analyzed data. F.H., J.I.B., M.K., M.G.H. & P.L. equally contributed to the writing
of this manuscript. All authors have read and agreed to the published version of the manuscript.
Funding: The University of Texas at El Paso internal funding.
Institutional Review Board Statement: All specimens were salvaged under a United States Fish
and Wildlife Service Standard Conditions Migratory Bird Scientific Collecting Permit (MB11579C)
and New Mexico Scientific Collecting Permit (3647), and approved by the institutional animal care
and use committee at the University of Texas at El Paso (protocol ID A-201609-4, approval date 9
December 2019).
Informed Consent Statement: Not applicable.
Data Availability Statement: Mitochondrial DNA sequences: GenBank accession numbers OK086092–
OK086272. Illumina ddRAD-Seq Reads: NCBI’s Sequence Read Archive data BioProject PRJNA761761:
BioSample Accession Numbers SAMN21362192–SAMN21362373.Animals 2021, 11, 2677 16 of 19
Acknowledgments: We thank T. Parker for his contribution in sampling effort. We also thank the
staff of the UTEP’s Border Biomedical Research Center (BBRC) Genomic Analysis Core Facility that
is funded through NIH Grant #5G12RR007592 from the National Center for Research Resources
(NCRR)/NIH to the Border Biomedical Research Center at The University of Texas at El Paso for
services and facilities provided.
Conflicts of Interest: The authors declare no conflict of interest.
References
1. Buckley, Y.M.; Catford, J. Does the biogeographic origin of species matter? Ecological effects of native and non-native species and
the use of origin to guide management. J. Ecol. 2016, 104, 4–17. [CrossRef]
2. Hulme, P.E. Invasion pathways at a crossroad: Policy and research challenges for managing alien species introductions. J. Appl.
Ecol. 2015, 52, 1418–1424. [CrossRef]
3. Tabak, M.A.; Piaggio, A.J.; Miller, R.S.; Sweitzer, R.A.; Ernest, H.B. Anthropogenic factors predict movement of an invasive
species. Ecosphere 2017, 8, e01844. [CrossRef]
4. Vallin, N.; Rice, A.M.; Arntsen, H.; Kulma, K.; Qvarnström, A. Combined effects of interspecific competition and hybridization
impede local coexistence of Ficedula flycatchers. Evol. Ecol. 2012, 927–942. [CrossRef]
5. Hedrick, P.W. Adaptive introgression in animals: Examples and comparison to new mutation and standing variation as sources
of adaptive variation. Mol. Ecol. 2013, 22, 4606–4618. [CrossRef] [PubMed]
6. Valencia-Montoya, W.A.; Elfekih, S.; North, H.L.; Meier, J.I.; Warren, I.A.; Tay, W.T.; Gordon, K.H.J.; Specht, A.; Paula-Moraes, S.V.;
Rane, R.; et al. Adaptive introgression across semipermeable species boundaries between local helicoverpa zea and invasive
helicoverpa armigera moths. Mol. Biol. Evol. 2020, 37, 2568–2583. [CrossRef] [PubMed]
7. Rhymer, J.M.; Simberloff, D. Extinction by hybridization and intrgression. Annu. Rev. Ecol. Syst. 1996, 27, 83–109. [CrossRef]
8. Todesco, M.; Pascual, M.A.; Owens, G.L.; Ostevik, K.L.; Moyers, B.T.; Hübner, S.; Heredia, S.M.; Hahn, M.A.; Caseys, C.; Bock,
D.G.; et al. Hybridization and extinction. Evol. Appl. 2016, 9, 892–908. [CrossRef]
9. Huxel, G.R. Rapid displacement of native species by invasive species: Effects of hybridization. Biol. Conserv. 1999, 89, 143–152.
[CrossRef]
10. Kearns, A.M.; Restani, M.; Szabo, I.; Schrøder-nielsen, A.; Kim, J.A.; Richardson, H.M.; Marzluff, J.M.; Fleischer, R.C.; Johnsen, A.;
Omland, K.E. Genomic evidence of speciation reversal in ravens. Nat. Commun. 2018, 9, 906. [CrossRef]
11. Lepage, D. Avibase—The World Bird Database. Available online: https://avibase.bsc-eoc.org/avibase.jsp?lang=EN (accessed on
9 May 2020).
12. Schorger, A. Introduction of the domestic pigeon. Auk 1952, 69, 462–463. [CrossRef]
13. Small, M.; Baccus, J.; Schwertner, T. Historic and current distribution and abundance of White-winged Doves (Zenaida asiatica) in
the United States. Texas Ornitol. Soc. 2006, 6, 1–22.
14. Robbins, C.; Bruun, B.; Zim, H. Birds of North America: A Guide to Field Identification; Golden Guides from St. Martin’s Press: New
York, NY, USA, 2014.
15. Hengeveldeld, R. What to do about the North American invasion by the Collared Dove? J. Field Ornithol. 1993, 64, 477–489.
16. Smith, P.W. The Eurasian Collared-Dove arrives in the Americas. Am. Birds 1987, 41, 1371–1380.
17. Scheidt, S.N.; Hurlbert, A.H. Range expansion and population dynamics of an invasive species: The eurasian collared-dove
(Streptopelia decaocto). PLoS ONE 2014, 9, e111510. [CrossRef]
18. Saunders, G.B. The origin of White-winged Doves breeding in south Florida. Florida Field Nat. 1980, 8, 50–51.
19. Aldrich, J.W.; Aldrich, J.W. Geographic Variation in White-Winged Doves Zenaida asiatica with Reference to a Possible Source of a
New Florida USA Population. Proc. Biol. Soc. Wash. 1981, 94, 641–651.
20. Butcher, J.A.; Collier, B.A.; Silvy, N.J.; Roberson, J.A.; Mason, C.D.; Peterson, M.J. Spatial and temporal patterns of range expansion
of white-winged doves in the USA from 1979 to 2007. J. Biogeogr. 2014, 41, 1947–1956. [CrossRef]
21. Pruett, C.L.; Tanksley, S.M.; Small, M.F.; Taylor, J.F.; Forstner, M.R.J.; Taylor, J.F. The Effects of Range Expansion on the Population
Genetics of White-Winged Doves in Texas the Effects of Range Expansion on the Population Genetics of White-Winged Doves in
Texas. Am. Mimdl. Nat. 2011, 166, 415–425. [CrossRef]
22. Veech, J.A.; Small, M.F.; Baccus, J.T. The effect of habitat on the range expansion of a native and an introduced bird species. J.
Biogeogr. 2011, 38, 69–77. [CrossRef]
23. Poling, T.D.; Hayslette, S.E. Dietary Overlap and Foraging Competition between Mourning Doves and Eurasian Collared-Doves.
J. Wildl. Manag. 2004, 70, 998–1004. [CrossRef]
24. Hayslette, S.E. Seed-Size Selection in Mourning Doves and Eurasian Collared-Doves. Wilson Ornithol. Soc. 2006, 118, 64–69.
[CrossRef]
25. Ottenburghs, J.; Ydenberg, R.C.; Van Hooft, P.; Van Wieren, S.E.; Prins, H.H.T. The Avian Hybrids Project: Gathering the scientific
literature on avian hybridization. IBIS 2015, 157, 892–894. [CrossRef]
26. Greenwood, P.J. Mating systems, philopatry and dispersal in birds and mammals. Anim. Behav. 1980, 28, 1140–1162. [CrossRef]
27. Ellegren, H. Evolutionary stasis: The stable chromosomes of birds. Trends Ecol. Evol. 2010, 25, 283–291. [CrossRef]
28. Grant, P.R.; Grant, B.R. Hybridization of bird species. Science 1992, 256, 193–197. [CrossRef] [PubMed]Animals 2021, 11, 2677 17 of 19
29. Price, D.K.; Muir, C. Conservation implications of hybridization in Hawaiian picture-winged Drosophila. Mol. Phylogenet. Evol.
2008, 47, 1217–1226. [CrossRef]
30. Uy, J.A.C.; Irwin, D.E.; Webster, M.S. Behavioral Isolation and Incipient Speciation in Birds. Annu. Rev. Ecol. Evol. Syst. 2018, 49,
1–24. [CrossRef]
31. Fitzpatrick, B. Rates of Evolution of Hybrid invibility in birds and mammals. Evolution 2004, 58, 1865–1870. [CrossRef]
32. Lijtmaer, D.A.; Mahler, B.; Tubaro, P.L. Hybridization and postzygotic isolation patterns in pigeons and doves. Evolution 2003, 57,
1411–1418. [CrossRef]
33. Price, J.P.; Clague, D.A. How old is the Hawaiian biota? Geology and phylogeny suggest recent divergence. Proc. R. Soc. B Biol.
Sci. 2002, 269, 2429–2435. [CrossRef] [PubMed]
34. Mccarthy, E.M. Handbook of Avian Hybrids of the World; Oxford University Press: New York, NY, USA, 2006.
35. Hartman, P.J.; Wetzel, D.P.; Crowley, P.H.; Westneat, D.F. The impact of extra-pair mating behavior on hybridization and genetic
introgression. Theor. Ecol. 2012, 5, 219–229. [CrossRef]
36. Lavretsky, P.; Janzen, T.; McCracken, K.G. Identifying hybrids & the genomics of hybridization: Mallards & American black
ducks of Eastern North America. Ecol. Evol. 2019, 9, 3470–3490. [CrossRef] [PubMed]
37. Omland, K.E.; Kondo, B. S18-2 Phylogenetic studies of plumage evolution and speciation in New World orioles (Icterus). Acta
Zool. Sin. 2006, 52, 320–326.
38. Nadachowska-Brzyska, K.; Burri, R.; Olason, P.I.; Kawakami, T.; Smeds, L. Demographic Divergence History of Pied Flycatcher
and Collared Flycatcher Inferred from Whole-Genome Re-sequencing Data. PLoS Genet. 2013, 9, 1003942. [CrossRef]
39. Johnson, K.P.; Weckstein, J.D. The Central American land bridge as an engine of diversification in New World doves. J. Biogeogr.
2011, 38, 1069–1076. [CrossRef]
40. Johnson, K.P.; Kort, S.D.E.; Dinwoodey, K.; Mateman, A.C.; Cate, C.T.E.N.; Lessells, C.M.; Clayton, D.H. A molecular phylogeny
of the dove genera Streptopelia and Columba. Auk 2001, 118, 874–887. [CrossRef]
41. Discover a New World of Birding. Available online: Https://ebird.orgeBird (accessed on 3 March 2021).
42. Domyan, E.T.; Shapiro, M.D. Pigeonetics takes flight: Evolution, development, and genetics of intraspecific variation. Dev. Biol.
2017, 427, 241–250. [CrossRef]
43. Dacosta, J.M.; Sorenson, M.D. Amplification Biases and Consistent Recovery of Loci in a Double-Digest RAD-seq Protocol. PLoS
ONE 2014, 9, e106713. [CrossRef] [PubMed]
44. Lavretsky, P.; McInerney, N.R.; Mohl, J.E.; Brown, J.I.; James, H.F.; McCracken, K.G.; Fleischer, R.C. Assessing changes in genomic
divergence following a century of human-mediated secondary contact among wild and captive-bred ducks. Mol. Ecol. 2020, 29,
578–595. [CrossRef]
45. Bolger, A.M.; Lohse, M.; Usadel, B. Trimmomatic: A flexible trimmer for Illumina sequence data. Bioinformatics 2014, 30, 2114–2120.
[CrossRef] [PubMed]
46. Damas, J.; O’Connor, R.; Farré, M.; Panagiotis, V.; Lenis, E.; Martell, H.J.; Mandawala, A.; Fowler, K.; Joseph, S.; Swain, M.T.; et al.
Upgrading short-read animal genome assemblies to chromosome level using comparative genomics and a universal probe set.
Genome Res. 2017, 27, 875–884. [CrossRef] [PubMed]
47. Li, H.; Durbin, R. Inference of Human Population History from Whole Genome Sequence of a Single Individual. Nature 2011, 475,
493–496. [CrossRef]
48. Li, H.; Handsaker, B.; Wysoker, A.; Fennell, T.; Ruan, J.; Homer, N.; Marth, G.; Abecasis, G.; Durbin, R.; Data, G.P.; et al. The
Sequence Alignment/Map format and SAMtools. Bioinformatics 2009, 25, 2078–2079. [CrossRef]
49. Lischer, H.E.L.; Excoffier, L. PGDSpider: An automated data conversion tool for connecting population genetics and genomics
programs. Bioinformatics 2012, 28, 298–299. [CrossRef]
50. Marees, A.T.; de Kluiver, H.; Stringer, S.; Vorspan, F.; Curis, E.; Marie-Claire, C.; Derks, E.M. A tutorial on conducting genome-wide
association studies: Quality control and statistical analysis. Int. J. Methods Psychiatr. Res. 2018, 27. [CrossRef]
51. Danecek, P.; Auton, A.; Abecasis, G.; Albers, C.A.; Banks, E.; DePristo, M.A.; Handsaker, R.E.; Lunter, G.; Marth, G.T.; Sherry,
S.T.; et al. The variant call format and VCFtools. Bioinformatics 2011, 27, 2156–2158. [CrossRef] [PubMed]
52. Puritz, J.B.; Hollenbeck, C.M.; Gold, J.R. dDocent: A RADseq, variant-calling pipeline designed for population genomics of
non-model organisms. PeerJ 2014, 2014, e431. [CrossRef]
53. Drummond, A.J.; Suchard, M.A.; Xie, D.; Rambaut, A. Bayesian Phylogenetics with BEAUti and the BEAST 1.7. Mol. Biol. Evol.
2012, 29, 1969–1973. [CrossRef]
54. Tizard, J.; Patel, S.; Waugh, J.; Tavares, E.; Bergmann, T.; Gill, B.; Norman, J.; Christidis, L.; Scofield, P.; Haddrath, O.; et al.
DNA barcoding a unique avifauna: An important tool for evolution, systematics and conservation. BMC Evo. Biol. 2019, 19, 52.
[CrossRef] [PubMed]
55. Tamura, K.; Ursula, F.; Billing-Ross, P.; Murillo, O.; Filipski, A.; Kumar, S. Estimating divergence times in large molecular
phylogenies. Proc. Natl. Acad. Sci. USA 2012, 109, 19333–19338. [CrossRef]
56. Kumar, S.; Stecher, G.; Suleski, M.; Hedges, S.B. TimeTree: A Resource for Timelines, Timetrees, and Divergence Times. Mol. Biol.
Evol. 2017, 34, 1812–1819. [CrossRef] [PubMed]
57. Pickrell, J.K.; Pritchard, J.K. Inference of Population Splits and Mixtures from Genome-Wide Allele Frequency Data. PLoS Genet.
2012, 8, e1002967. [CrossRef] [PubMed]You can also read