Identification of Age-Specific and Common Key Regulatory Mechanisms Governing Eggshell Strength in Chicken Using Random Forests - MDPI
←
→
Page content transcription
If your browser does not render page correctly, please read the page content below
G C A T
T A C G
G C A T
           genes
Article
Identification of Age-Specific and Common Key
Regulatory Mechanisms Governing Eggshell Strength
in Chicken Using Random Forests
Faisal Ramzan 1,2,† , Selina Klees 1,† , Armin Otto Schmitt 1,3 , David Cavero          4

and Mehmet Gültas 1,3,∗
 1   Breeding Informatics Group, Department of Animal Sciences, Georg-August University,
     Margarethe von Wrangell-Weg 7, 37075 Göttingen, Germany; faisal.ramzan@stud.uni-goettingen.de (F.R.);
     selina.klees@uni-goettingen.de (S.K.); armin.schmitt@uni-goettingen.de (A.O.S.)
 2   Department of Animal Breeding and Genetics, University of Agriculture Faisalabad,
     38000 Faisalabad, Pakistan
 3   Center for Integrated Breeding Research (CiBreed), Albrecht-Thaer-Weg 3, Georg-August University,
     37075 Göttingen, Germany
 4   H&N International, 27472 Cuxhaven, Germany; cavero@ltz.de
 *   Correspondence: gueltas@informatik.uni-goettingen.de
 †   These authors contributed equally to this work.

 Received: 16 March 2020; Accepted: 21 April 2020; Published: 24 April 2020

 Abstract: In today’s chicken egg industry, maintaining the strength of eggshells in longer laying cycles
 is pivotal for improving the persistency of egg laying. Eggshell development and mineralization
 underlie a complex regulatory interplay of various proteins and signaling cascades involving multiple
 organ systems. Understanding the regulatory mechanisms influencing this dynamic trait over time is
 imperative, yet scarce. To investigate the temporal changes in the signaling cascades, we considered
 eggshell strength at two different time points during the egg production cycle and studied the
 genotype–phenotype associations by employing the Random Forests algorithm on chicken genotypic
 data. For the analysis of corresponding genes, we adopted a well established systems biology
 approach to delineate gene regulatory pathways and master regulators underlying this important
 trait. Our results indicate that, while some of the master regulators (Slc22a1 and Sox11) and pathways
 are common at different laying stages of chicken, others (e.g., Scn11a, St8sia2, or the TGF-β pathway)
 represent age-specific functions. Overall, our results provide: (i) significant insights into age-specific
 and common molecular mechanisms underlying the regulation of eggshell strength; and (ii) new
 breeding targets to improve the eggshell quality during the later stages of the chicken production cycle.

 Keywords: eggshell strength; chicken; Random Forests; feature selection; master regulators;
 over-represented pathways

1. Introduction
     Today’s poultry industry is highly invested in the development of chicken capable of producing
more eggs in longer laying cycles [1]. This production goal, however, must go hand in hand with
improvement in sustainability of egg quality, especially eggshell strength (ESS), during the whole
laying period [1,2]. The calcified eggshells not only provide protection against physical damage but
also play a crucial role for the development of the embryo by allowing gaseous exchange, abating
moisture loss, and supplying calcium for the embryo bone development [3]. Multiple molecular actors
involved in the homeostasis and transportation of minerals, especially calcium, the main constituent

Genes 2020, 11, 464; doi:10.3390/genes11040464                                 www.mdpi.com/journal/genes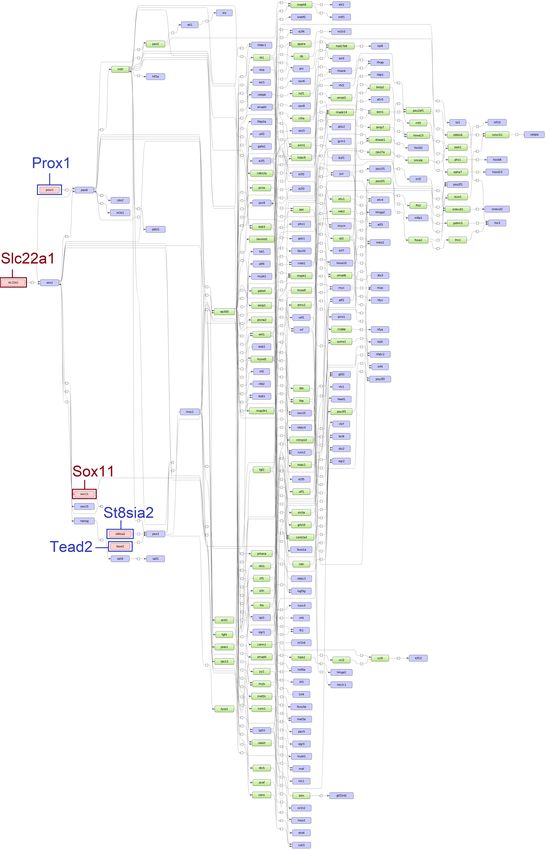
Genes 2020, 11, 464                                                                                    2 of 18

of the eggshell, have been identified [4,5]. More than 500 eggshell matrix proteins have also been
reported [6,7] implicating a plethora of genes that knit together the complex protein scaffold and
the mineral phase of the eggshell [5,8]. However, most of these discoveries provide only the genes
expressed in a certain segment of the chicken oviduct, the principal organ for egg development, and
consequently the overall mechanisms of eggshell development remain illusive. Moreover, similar
to other economically important traits, ESS remains relevant throughout the productive life and
commonly deteriorates with the age of the chicken [9]. This decline in the eggshell quality remains one
of the major reasons for replacing commercial flocks [1]. Hence, understanding the genetic basis of ESS
at different laying stages is very important for breeders if they are to extend the laying cycle of chicken.
Therefore, an analysis of this trait at different time points during the life of the bird can better delineate
its genetics and its molecular mechanisms involved in this dynamic behavior [10]. This knowledge can
then be utilized to design breeding strategies to improve the eggshell quality during the later stages of
the chicken production cycle.
      Until now, a variety of association studies have been conducted to decipher the genetic architecture
of quantitative traits such as ESS, which led to the identification of a valuable repertoire of genes
controlling a range of traits (see the reviews [11–13]). Finding loci associated with a trait through
genome wide association studies (GWAS) is commonly based on single-SNP based models that
test each SNP for its association with the phenotype, ignoring its dependency on the neighboring
SNPs. This statistical design of GWAS seems quite straightforward, yet entails several challenges
including those of population stratification, relationships among the samples, multiple hypothesis
testing, and overestimation of SNP effects, among others, as pointed out in previous studies [14–17].
Many approaches such as different multiple testing correction methods and linear mixed models have
been proposed to overcome these challenges [15,18,19]. However, the most devastating challenge
of GWAS still persisting is the lack of power to detect the loci having medium to small effect
sizes [20]. This inability of GWAS to explain a major proportion of the heritability has been under
intensive discussion.
      To overcome these limitations of GWAS, application of Bayesian frameworks as well as
machine learning algorithms have gained importance in the last decade [21–25]. Their comparative
performance has been evaluated for a variety of traits with different genetic architectures (see the
reviews [13,26,27]). Nevertheless, multiple studies have revealed that machine learning algorithms
surpass currently available well-known GWAS approaches in identifying genes having small effects
on the phenotype [28–30]. In particular, Brieuc et al. pointed out the efficiency of Random Forests (RF)
models for analyzing a large number of loci simultaneously and identifying promising associations [28].
Inspired by Brieuc et al.’s study, we applied the RF algorithm to assess the importance of SNPs that
could provide a clue of their essential roles for ESS and to characterize the differences observed in this
trait at different time points. For the analysis of the corresponding genes of these SNPs, we adopted a
well established systems biology approach and identified age-specific and common key regulatory
pathways and master regulators. These findings could: (i) enhance our understanding of the regulatory
mechanisms underlying eggshell strength; and (ii) provide novel targets and hypotheses for future
breeding strategies. To the best of our knowledge, it is the first study in this field which mainly focuses
on the importance of the age-specific and common key regulatory mechanisms in chicken to reveal the
genetic programs influencing the eggshell strength.

2. Materials and Methods
     In this section, we describe the chicken dataset analyzed and the methods applied. Our analysis
follows the structure of Figure 1.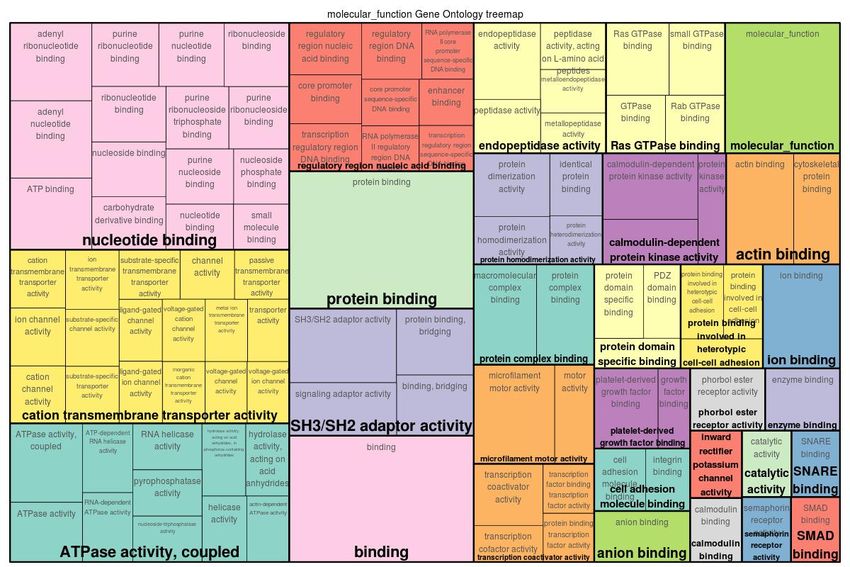
Genes 2020, 11, 464                                                                                    3 of 18

                 Figure 1. Flowchart of the analysis applied in this study (ESS, Eggshell strength).

2.1. Chicken Dataset
      To explore the genomic background of the changes that incur to the eggshell strength during
the life of laying birds, we analyzed a genotype dataset that has previously been used to investigate
the accuracy of imputation as well as the prediction of genomic breeding values in chicken [31–33].
The dataset consists of a purebred commercial brown layer line with 892 animals and 580,000 SNPs
generated using Affymetrix Axiom Chicken Genotyping Array. The genotypic data do not contain
mitochondrial SNPs. The corresponding phenotypic data consist of eggshell strength (ESS) measured
(as the force in Newton that was required to break the eggshell) for each bird at two distinct stages of its
production cycle. These two stages were then regarded as Time Point 1 and Time Point 2, respectively.
The first time point for ESS was recorded at the ages of 42, 45, and 48 weeks and the second time point
was recorded at the ages of 64 and 68 weeks. Averages of the recorded breaking strengths at Time Point
1 (ESS1) and Time Point 2 (ESS2) were used as phenotypes in the further analysis. Extensive pedigree
data, consisting of, in total, 40,545 individuals from six generations, were available on these birds
which were included in an animal model for breeding values estimation of the birds. These breeding
values were then de-regressed following Garrick et al. [34] to obtain the pseudo-phenotypes that were
used in the further analysis. To ensure genotype quality, we filtered the genotyped data and removed
the SNPs: (i) that were unassigned to any chromosome or present on the sex chromosomes; (ii) with a
minor allele frequency < 0.01; (iii) with a genotyping call rate ≤ 97%; (iv) significantly deviating from
Hardy–Weinberg equilibrium (p-value < 1 × 10⁻⁶ ); and (v) for animals having a SNP call rate smaller
than 95%. Finally, after filtering, we used 892 animals and 318,513 SNPs for our analyses.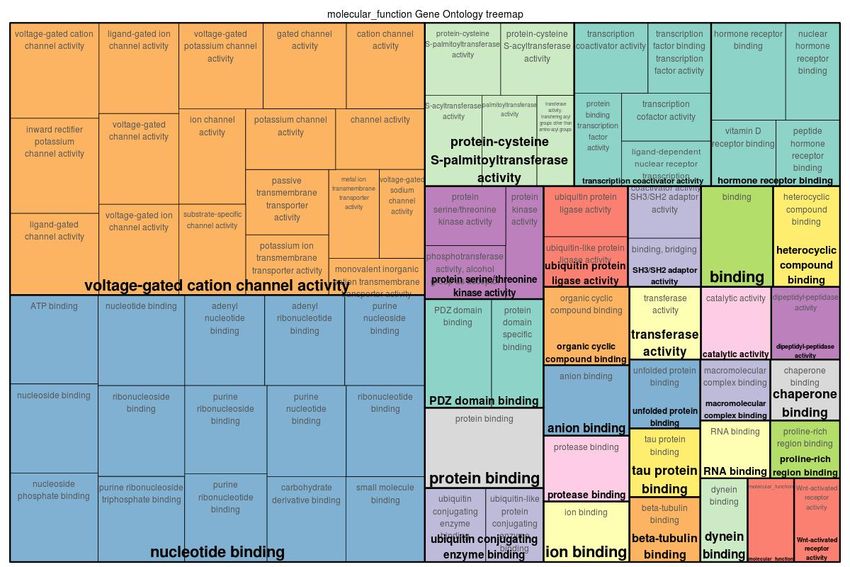
Genes 2020, 11, 464                                                                                  4 of 18

2.2. Association Analysis Using Random Forests
      To identify SNPs potentially associated with eggshell strength, we used the concept of the
Random Forests (RF) algorithm to estimate the relative importance of each SNP (attribute) regarding
its involvement in the prediction of response variables (de-regressed breeding values). For this purpose,
we employed the Boruta algorithm in our study [35], which is a specially developed powerful wrapper
for the RF based feature selection approach. The main principle of the Boruta algorithm is based on
the extension of the attributes by adding random attributes to the dataset which are called shadow
attributes and created by shuffling the original values of each attribute (in our case SNPs) in the dataset.
The enlargement of the attributes results in apposition of the randomness to the dataset, which leads
to the reduction of the bias of hidden (false) signals arising from random fluctuations or correlations
in the dataset [35–37]. To this end, a RF classifier is applied to the extended dataset, and SNPs are
systematically and iteratively removed whose importance are significantly smaller than those of the
shadow attributes. By repeating the process of shadow attributes generation and RF algorithm application,
importance is assigned to all SNPs. As a result, the Boruta algorithm provides a ranked list of SNPs
with a decision of whether the importance of a SNP is confirmed, rejected, or tentative. It is important
to note that a similar idea to the Boruta algorithm is manually implemented in [22] to assess the
importance of SNPs.

2.3. Gene Set Analysis
     We extracted the genes corresponding to the SNPs identified by the Boruta algorithm from
Ensembl using BioMart [38] (R-script given in File S1). Furthermore, we performed a gene set analysis
regarding their molecular functions to obtain functional annotations of these genes.

2.4. Identification of Master Regulators and Over-Represented Pathways
     Following our previous studies [39,40], we performed the "upstream analysis” and pathway
analysis using the geneXplain platform [41] to gain more insight into the functional relationships of
genes. The algorithm of “upstream analysis” workflow was introduced by Koschmann et al. [42]
and its main goal is to reveal the underlying key regulators that control the activity of target genes.
For this purpose, the underlying algorithm of “upstream analysis” firstly constructs molecular pathway
networks and then detects convergence points of these networks, which are called master regulators
and are likely to orchestrate the transcriptional regulation of several genes. In our analysis, we used
the GeneWays database [43] and ran the standard “upstream analysis” workflow with a maximum
radius of 10 steps upstream to identify the top five master regulators of each gene set resulted from the
previous step of the analysis.
     To discover novel biological functions and to reveal the properties of the genes under study, we
performed a pathway enrichment analysis as the second step of our analysis. To this end, we used the
TRANSPATH pathway database [44], which is a regularly updated signaling pathway database and
contains information about genes, molecules and reactions for the identification of age-specific and
common over-represented pathways.

3. Results
     In this study, we performed the RF approach using the Boruta algorithm to identify the informative
SNPs associated with eggshell strength at two time points during the laying cycle of commercial brown
layer chicken. For this purpose, the importance of each SNP was separately assessed for its association
with the phenotype of interest. To this end, we obtained a list of SNPs for each time point whose
importance was confirmed by the Boruta algorithm for the prediction of the phenotype. Analyzing
both time points, we identified 3726 SNPs associated with eggshell strength at Time Point 1 (ESS1)
and 1815 SNPs associated with eggshell strength at Time Point 2 (ESS2) (the lists of SNPs are given in
Table S2). These SNPs were then mapped to the genome and the genes harboring at least one of these
Genes 2020, 11, 464 5 of 18
SNPs were identified for both traits. In total, we identified 405 genes for ESS1 and 253 genes for ESS2
(the lists of genes and their Gene Ontology (GO) categories are given in Tables S2 and S3, respectively).
A closer look at these gene lists reveals that 22 % (118 genes) of them are overlapping (see Figure 2),
which depicts the conservation of some of the underlying mechanisms involved in the synthesis of
eggshell during different stages of the egg production cycle. Our results also show that a considerably
high number of genes that were distinct for the time points highlight the dynamic nature of this trait.
This section is comprised of three parts. First, to gain a deeper insight into these gene sets,
we performed a gene set analysis and clustered their functions based on the GO terms. Second,
we performed the “upstream analysis” introduced by Koschmann et al. [42] for the identification of
specific and common master regulators of both time points. Third, we present the over-represented
pathways to further elucidate the mechanisms that control the ESS at different production stages
of birds.
ESS1 ESS2
287 118 135
Figure 2. Venn diagram depicting the number of genes associated with eggshell strength at Time Point
1 (ESS1), at Time Point 2 (ESS2), and their overlap.
3.1. Gene Set Analysis
The functional classification of both gene sets indicates that there are several GO categories that
were common for both time points (see the treemaps depicted in Figures 3 and 4 and the top 15 GO
terms in Tables 1 and 2). In particular, the transportation of cations across membranes was the most
salient function for the underlying mechanism of ESS at both time points. In this regard, calcium
ions, being the main constituent of the eggshell, are supplied in large amount to the uterine fluid by
transepithelial transport. In addition, other cations such as sodium, magnesium, and potassium are
exchanged across the uterine endothelium to maintain the cell homeostasis [4,5]. This transmembrane
transport remains important during the production cycle to ensure the development of an eggshell.
The gene set analysis further reveals that the activities pertaining to ATPase, GTPase, calmodulin
binding, calmodulin-dependent protein kinase, and Smad binding were specific for ESS1. Meanwhile,
functions related to hormone/vitamin D receptor binding, chaperone binding, and Wnt-activated
receptors were more relevant for ESS2.
Among others, the function of ATPase in eggshell formation has been well investigated in previous
studies [5,45]. Along with maintaining a pH of the uterine fluid during the eggshell formation, the
ATPases also provide the required energy and function as transmembrane transportation channels
for ions [46]. The calmodulin binding and calmodulin-dependent protein kinase activity is known
to regulate the concentration of calcium in various cells [47] and so does the vitamin D receptor
binding [48]. The chaperone binding activity of the genes associated with ESS2 is another distinctive
finding of this study. Chaperone proteins have been reported in the uterine fluid where they perform
the folding of the eggshell matrix proteins into a rigid scaffold upon which mineralization takes place
to produce the fabric of eggshell [5]. These functional classes elucidate the molecular functions thatGenes 2020, 11, 464 6 of 18
gain more relevance depending on the age of the birds and demonstrate the key functions that remain
important throughout the laying cycle of the birds.
Figure 3. Gene Ontology (GO) treemap for genes associated with eggshell strength at Time Point 1
(ESS1). The boxes are grouped together based on the upper-hierarchy GO-term which is written in
bold letters.
Figure 4. Gene Ontology (GO) treemap for genes associated with eggshell strength at Time Point 2
(ESS2). The boxes are grouped together based on the upper-hierarchy GO-term which is written in
bold letters.Genes 2020, 11, 464 7 of 18
Table 1. Top 15 Gene Ontology (GO) molecular function terms based on the adjusted p-value for the
eggshell strength at Time Point 1 (ESS1).
Number Adjusted
GO Term GO Title
of Genes p-Value
GO:0005515 protein binding 281 5.11 × 10⁻⁸
GO:0005488 binding 331 1.97 × 10⁻⁷
GO:0043167 ion binding 155 4.93 × 10⁻³
GO:0000146 microfilament motor activity 5 4.93 × 10⁻³
GO:0003779 actin binding 20 6.9 × 10⁻³
GO:0032559 adenyl ribonucleotide binding 49 1.47 × 10⁻²
GO:0030554 adenyl nucleotide binding 49 1.51 × 10⁻²
GO:0044877 macromolecular complex binding 50 1.54 × 10⁻²
GO:0004683 calmodulin-dependent protein kinase activity 5 1.54 × 10⁻²
GO:0005524 ATP binding 47 2.05 × 10⁻²
GO:0042623 ATPase activity, coupled 16 2.24 × 10⁻²
GO:0008092 cytoskeletal protein binding 30 3.32 × 10⁻²
GO:0043168 anion binding 74 3.93 × 10⁻²
GO:0046983 protein dimerization activity 40 4.15 × 10⁻²
GO:0017016 Ras GTPase binding 12 4.86 × 10⁻²
Table 2. Top 15 Gene Ontology (GO) molecular function terms based on the adjusted p-value for the
eggshell strength at Time Point 2 (ESS2).
Number Adjusted
GO Term GO Title
of Genes p-Value
GO:0005515 protein binding 168 1.30 × 10⁻²
GO:0022843 voltage-gated cation channel activity 9 2.09 × 10⁻²
GO:0005242 inward rectifier potassium channel activity 4 2.10 × 10⁻²
GO:0032549 ribonucleoside binding 40 2.79 × 10⁻²
GO:0000166 nucleotide binding 48 2.79 × 10⁻²
GO:0005524 ATP binding 34 2.79 × 10⁻²
GO:0001883 purine nucleoside binding 39 3.66 × 10⁻²
GO:0032559 adenyl ribonucleotide binding 34 3.66 × 10⁻²
GO:0005488 binding 199 3.66 × 10⁻²
GO:0030554 adenyl nucleotide binding 34 3.66 × 10⁻²
GO:0051427 hormone receptor binding 9 3.66 × 10⁻²
GO:0015276 ligand-gated ion channel activity 8 3.66 × 10⁻²
GO:0017076 purine nucleotide binding 39 3.7 × 10⁻²
GO:0022836 gated channel activity 12 3.83 × 10⁻²
GO:0036094 small molecule binding 50 4.64 × 10⁻²
3.2. Identification of Master Regulators
Applying the “upstream analysis” integrated in the geneXplain platform [41], we identified the
top five age-specific and common master regulators. While the master regulators Arx, Sox1, and Scn11a
were specifically found for ESS1, the master regulators St8sia2, Tead2, and Prox1 were identified for
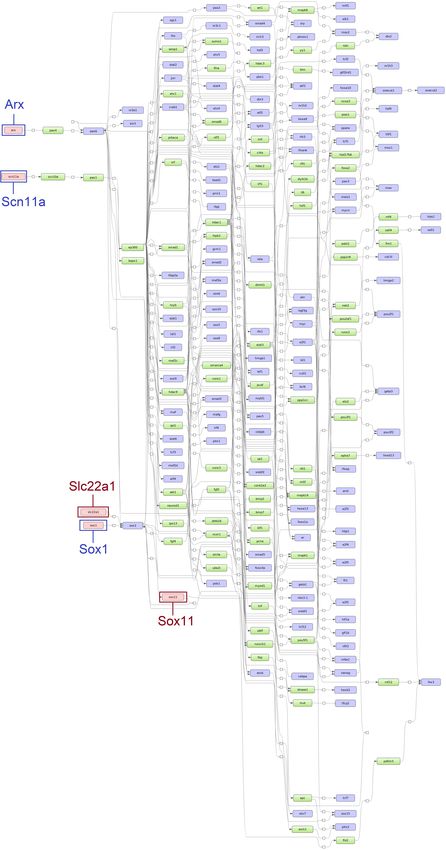
ESS2. Additionally, Slc22a1 and Sox11 were identified for both time points (see Figures 5 and 6).
The ESS1 specific master regulator Scn11a is a gene encoding transmembrane sodium channels
which control the voltage-gated sodium transport especially in the uterus [49,50], the site of eggshell
synthesis in birds. Moreover, the importance of sodium channels in the transportation of inorganic
minerals deposited in the eggshell is well established [51]. Interestingly, we found the master regulator
Slc22a1 at both time points. It codes for the protein OCT1, an organic cation transporter for substrates
such as putrescine [52], which plays an important role for eggshell thickness [53] and calcium transport
in the intestine [54]. Furthermore, many other members of the super-family of transport proteins,
Slc (solute carrier proteins), are well known to play an essential role in the homeostasis of calcium
ions in a variety of tissues [55]. The Slc proteins have also been reported to transport magnesium ions
during the egg calcification process [5].Genes 2020, 11, 464 8 of 18
Figure 5. Scheme of gene regulatory pathways revealing the top five master regulators (pink filled
boxes) for eggshell strength at Time Point 1 (ESS1) following the “upstream analysis” [42]. The master
regulators written in dark blue and surrounded by dark blue boxes (Arx, Scn11a and Sox1) were
identified specifically for ESS1 while master regulators written in dark red and surrounded by dark red
boxes (Slc22a1 and Sox11) were identified at both time points (corresponding networks for eggshell
strength at Time Point 2 (ESS2) in Figure 6).Genes 2020, 11, 464 9 of 18
Figure 6. Scheme of gene regulatory pathways revealing the top five master regulators (pink filled
boxes) for eggshell strength at Time Point 2 (ESS2) following the “upstream analysis” [42]. The master
regulators written in dark blue and surrounded by dark blue boxes (Prox1, St8sia2 and Tead2) were
identified specifically for ESS2 while master regulators written in dark red and surrounded by dark red
boxes (Slc22a1 and Sox11) were identified at both time points (corresponding networks for eggshell
strength at Time Point 1 (ESS1) in Figure 5).Genes 2020, 11, 464 10 of 18
Another interesting master regulator, Sox11, which encodes a member of the Sox (SRY-related
HMG-box) family of transcription factors, was found at both time points. Sox11 is known to positively
regulate the process of osteogenesis (the formation of bone) [56]. This regulator gains relevance given
the importance of bone as a labile reservoir of minerals, especially calcium [4]. In birds, the calcium
homeostasis is achieved by regulating the metabolism of bone minerals as well as by controlling the
absorption and excretion of calcium in the intestine and in kidneys, respectively [57]. Furthermore,
the master regulator Tead2 found for ESS2 is a regulator of osteogenesis [58] and it is also one of
the direct downstream target genes of Sox11. This might be an indication of different regulatory
mechanisms involved in the osteogenesis or bone remodeling during the later stages of the laying
cycle [56].
The St8sia2, identified as an ESS2 specific master regulator, encodes a membrane protein which
catalyzes the metabolism of sialic acid [59], a carbohydrate found in the eggshell membranes [60–62].
The eggshell membranes constitute the inner layer of the eggshell and contribute to its strength. They
further provide the nucleation sites for the initiation of the shell synthesis [63]. Sialic acid is also
part of podocalyxin and secreted phosphoprotein 1 (SPP1), both of which are glycoproteins found
in the uterus during eggshell calcification [5,64]. Because of its high negative charge, podocalyxin is
presumed to interact with calcium carbonate during the calcification of the eggshell [64]. The master
regulator Prox1 encodes the protein prospero homeobox 1 that has also been reported as part of eggshell
membranes [65,66]. However, the Prox1 gene is mostly implicated in the regulation of the development
of a variety of organs including liver, pancreas and kidney [67]. Although the vast majority of the
master regulators could be biologically characterized to be crucial for ESS, the importance and role of
the two master regulators Sox1 and Arx for this trait is currently biologically unconfirmed and could
hence provide novel targets for future studies.
3.3. Identification of Over-Represented Pathways
To further elucidate and investigate the mechanisms that control the ESS at different time points,
we were interested in identifying age-specific and common over-represented pathways. Applying the
pathway analysis, we identified eleven and nine significantly over-represented pathways for ESS1 and
ESS2, respectively, and seven of these pathways are overlapping for both time points (see Figure 7 and
Table 3).
Among the pathways shared by both time points, G1 phase (Cdk4), G1 phase (Cdk6), and
G2/M phase (cyclinA:Cdk1) involve different members of the cyclin-dependent kinase (CDK) family
which regulate transcription, mRNA processing, and, more importantly, cell cycle [68]. In the
context of ESS, these pathways may influence the differentiation efficiency of osteoblasts, osteoclasts,
chondrocytes [69], and uterine epithelium cells, all of which are crucial for the supply of calcium ions as
well as for bone and calcium homeostasis [70,71]. The p38 pathway is implicated in a variety of cellular
responses including those related to proliferation, differentiation and apoptosis [72]. Moreover, the role
of this pathway has also been reported in the egg development of Drosophila melanogaster [73]. The LXR
(liver X receptors) network plays a central role in the transcriptional control of lipid metabolism [74].
This pathway also mediates the concentrations of oxysterols and ApoE (Apolipoprotein E) if activated
in response to elevated intra-cellular cholesterol levels [75]. The oxysterols, oxygenated forms of
cholesterol, are intermediates in bile acid and steroid hormone biosynthetic pathways [76]. Among
other steroid hormones, estrogen is more intimately involved in calcium homeostasis and has also
been implicated in the development of osteoporosis [77]. Moreover, other forms of oxysterols are also
involved in calcium metabolisms [78] and mesenchymal stem cell differentiation [79]. In addition
to the CDKs, the Smad4 proteins, predominantly present in the nucleus of the cell, mediate the cell
cycle due to their association with the E2F family of transcription factors [80]. These pathways can be
upstream regulated by the transforming growth factor β (TGF-β) [81].Genes 2020, 11, 464 11 of 18
The transforming growth factor-β (TGF-β) signaling pathway can be regarded as the most
important pathway enriched for ESS1. This pathway, among its other functions, is well-known
for its role in bone homeostasis [82]. Furthermore, some components of this pathway also overlap
with other pathways delineated in our analysis. The Sox9 is a transcription factor that regulates the
expression of the COL2A1 (collagen type II, alpha 1) gene which contributes to collagen formation [83].
During this process, Smad3, a member of effector molecules in the signaling pathways of the TGF-β
ligand superfamily is activated [84]. Another pathway that is based on Smad7, SIK1 gene induction
also regulates TGF-β signaling [85]. Owing to this crosstalk with a variety of other pathways, the TGF-β
signaling pathway allows the bone to adapt to dynamic environments [82].
The Endothelin-1 gene (ET-1) regulation pathway includes the mechanisms regulating ET-1 gene
expression. Among other functions, ET-1 is involved in osteoblast proliferation and differentiation
in bone tissue as well as in the ovulation process in the uterus [86]. ET-1 gene regulation is
responsive to intracellular calcium and calmodulin [87]. The MIC2 signaling pathway, which was
specifically enriched for ESS2, has CD99 as the main cell surface protein and has been implicated in
apoptosis, adhesion, differentiation, and protein trafficking possibly by affecting actin cytoskeleton
reorganization [88,89]. Another ESS2 specific pathway involves the inactivation of the nuclear factor Y
(NF-Y) transcription factor by p73 proteins, a process that represses the promoter of the telomerase
catalytic subunit and induces replicative senescence [90,91]. The activity of NF-Y is further linked
to the parathyroid hormone, which is the main regulator of calcium and phosphorus homeostasis.
Taken together, the pathways show a diversity of complex functional features in chicken in response to
age-dependent changes in eggshell formation. Some pathways show a direct relevance for ESS while
others seem to be indirectly linked via interactions between pathways and regulators [92,93].
ESS1 ESS2
E2F ---/ Smad4
Endothelin-1 gene regulation G1 phase (Cdk4)
G1 phase (Cdk6)
SMAD7, SIK1 gene induction p73alpha ---/ NF-Y
G2/M phase (cyclinA:Cdk1)
Sox9 ---Smad3---> COL2A1 p38 pathway MIC2 signaling
oxysterol ---> apoE
TGFbeta pathway
LXR network
Figure 7. Venn diagram of over-represented pathways (p adjusted < 0.001) of eggshell strength at Time
Point 1 (ESS1), at Time Point 2 (ESS2), and their overlap. Pathways are based on the TRANSPATH
pathway database [44].Genes 2020, 11, 464 12 of 18
Table 3. Significantly over-represented pathways for both time points (p adjusted < 0.001) sorted
by adjusted p-values (based on the smaller one of either ESS1 or ESS2). Pathways are based on the
TRANSPATH pathway database [44]. (ESS1/ESS2, eggshell strength at Time Point 1/2).
Adjusted p-Value Over-Represented
Pathway Name
for ESS1 / ESS2 in
E2F —/ Smad4 5.05 × 10⁻⁵ /7.99 × 10−4 ESS1, ESS2
Endothelin-1 gene regulation 5.05 × 10⁻⁵ / - ESS1
G2/M phase (cyclin A:Cdk1) 1.61 × 10⁻⁴ /1.65 × 10−4 ESS1, ESS2
SMAD7, SIK1 gene induction 1.61 × 10⁻⁴ / - ESS1
oxysterol —>apoE 1.61 × 10⁻⁴ /1.85 × 10−4 ESS1, ESS2
LXR network 1.61 × 10⁻⁴ /1.65 × 10−4 ESS1, ESS2
p73alpha —/ NF-Y - /1.65 × 10−4 ESS2
Sox9 —Smad3—>COL2A1 5.43 × 10⁻⁴ / - ESS1
G1 phase (Cdk6) 7.60 × 10⁻⁴ /7.93 × 10−4 ESS1, ESS2
G1 phase (Cdk4) 9.77 × 10⁻⁴ /7.99 × 10−4 ESS1, ESS2
p38 pathway 9.77 × 10⁻⁴ /7.99 × 10−4 ESS1, ESS2
MIC2 signaling - /7.99 × 10−4 ESS2
TGFbeta pathway 9.53 × 10⁻⁴ / - ESS1
4. Discussion
To uncover the associations between genetic variants and phenotypes, genome wide association
studies (GWAS) have become the method of choice [12]. Despite their success in identifying a multitude
of genes, the prediction performance of single-SNP based GWAS strategies is limited [15,17,94].
Alternatively, multi-marker models including different Bayesian frameworks were introduced for
GWAS. In these models, all SNPs are fitted simultaneously as random effects assuming a certain
prior distribution of SNP effects [13]. In practice, these SNP effects are unknown and may not even
strictly follow a certain distribution [25]. Unlike these traditional statistical models, machine learning
methods do not require these prior assumptions about the genetic architecture of traits and have been
applied in GWAS in humans [30] as well as in livestock [27,95]. Especially, Romagnoni et al. [30] and
Huang et al. [24] showed that machine learning based algorithms provide promising prediction power
to assess genotype–phenotype associations. In particular, the Random Forests (RF) algorithm has been
successfully applied for this purpose. These articles encouraged us to utilize RF in our study since the
application of GWAS to identify genetic variants associated with ESS was futile.
Applying RF, we were able to identify a remarkably high number of genes related to ESS which
is in agreement with the findings of Maan et al. [6,7], Mikšík et al. [96,97], and Brionne et al. [5],
who pointed out a large number of genes/proteins involved in ESS due to the complexity of this trait.
The large difference in the number of genes identified for ESS1 and ESS2 reflects the change in the
genetic and environmental components of the phenotypic variance over age, as has been reported
before for complex traits [98,99]. The overlap between the genes for both time points (see Figure 2)
reflects that certain molecular functions remain relevant to eggshell development during the laying
cycle of chicken. Particularly, the similarity of genes responsible for the transportation of ions is in
line with the findings of Park et al. [100] and Fan et al. [51] who found that the concentration level
of different ions in blood does not change with the age of chicken. Interestingly, a closer look at
the biological processes of these traits reveals that, while highly significant GO terms are involved
in development for ESS1, the significant biological processes for ESS2 are rather related to different
metabolic processes (Table S3). The differences in biological processes at both time points could be
associated with the temporal changes in the signaling cascades influencing dynamic behavior of
eggshell strength over time.
In line with previous studies [39,42,101–103], we applied a systems biology approach and
identified master regulators to investigate and unravel the transcriptional regulatory machinery of ESS
associated genes. Interestingly, our results show that, similar to the genes, there are common masterGenes 2020, 11, 464 13 of 18
regulators (Sox11 and Slc22a1) for both time points, which are likely to govern various eggshell related
processes during the laying of the birds. In particular, being a member of the Slc superfamily which
is involved in the transmembrane transport, the Slc22a1 could be essential to eggshell development.
For ESS1, the most promising master regulator Scn11a controls sodium transport in the uterus [49,50]
to maintain a voltage difference as well as osmolarity across uterine cell membranes to help in the
calcium transportation [51]. In ESS2, the master regulator Tead2 together with the master regulator
Sox11 underline the importance of bone remodeling during the later stages of the production cycle of
the chicken.
Another fundamental step of our analysis was the identification of the over-represented pathways.
The results of this analysis also reinforce the findings of gene set analysis as well as the identified master
regulators. Some of the over-represented pathways were conserved at both time points while others
were age-specific. Here, we specifically highlight the well-characterized TGF-β pathway that interacts
with most of the identified pathways in our analysis to regulate bone homeostasis and thus might
play an important role in ESS [82]. The majority of the remaining pathways, especially those which
are common to both time points, were found to be related to the cell cycle. The uterine epithelium
and bone are the tissues that actively take part in the development of eggshell, hence the renewal
of the cells of both tissues is crucial for the synthesis of a strong eggshell [4]. Furthermore, multiple
studies suggest that a declining ability of uterine epithelium cells to transport calcium is the main
reason of the age-related deterioration of eggshells [51,100]. In particular, the ESS2 specific p73alpha
—/ NF-Y pathway that results in the inactivation of the NF-Y transcription factor by p73 proteins and
consequently causes replicative senescence of cells [90] may also point towards the underlying reason
for weaker eggshells during the later stages of the production cycle.
Recently, the use of systems biology based approaches to study the traits of economic importance
is gaining importance in the field of agriculture [39,102–104]. However, one of the major impediments
in the use of this knowledge in practical animal breeding is to integrate this large amount of information
into traditional genetic evaluation programs [105]. A small group of master regulators such as those
identified in our analysis integrated into prediction models can possibly be a remedy and might provide
novel breeding targets to improve the economically important trait of ESS. Additionally, the knowledge
about the specific pathways such as TGF-β could provide novel hypotheses for further studies.
5. Conclusions
In this study, we performed a systematic analysis to investigate the age-specific and common
regulatory mechanisms that underlie the dynamic trait eggshell strength in chicken. For this purpose,
we applied a RF feature selection algorithm to detect the age-dependent genotype–phenotype
associations and then used a well established systems biology approach to highlight the master
regulators and regulatory pathways that govern the underlying genetic mechanisms of eggshell
development. Our results show that most of the genes identified for the ESS at both time points are in
agreement with previous studies. Our findings further indicate that some biological processes related
to eggshell development remain conserved across production stages while others are age-specific
and thus changing over time. To the best of our knowledge, this is the first study revealing master
regulators and over-represented pathways in the context of ESS and our findings should be further
utilized to design novel hypothesis for future studies.
Supplementary Materials: The following are available online at http://www.mdpi.com/2073-4425/11/4/464/s1,
Script S1: R-script for analysis of SNPs and for the extraction of corresponding genes, Table S1: The list of important
SNPs, Table S2: The list of genes, Table S3: Gene Ontology categories
Author Contributions: M.G. designed and supervised the research. F.R. and S.K. participated in the design of the
study, and conducted computational and statistical analyses together with M.G. F.R. prepared and studied the
GWAS data. S.K. performed and adjusted the bioinformatics analysis. A.O.S. was involved in the interpretation of
the results together with F.R., S.K., D.C., and M.G. F.R., S.K., and M.G. wrote the final version of the manuscript.
M.G. conceived and managed the project. All authors have read and agreed to the published version of the
manuscript.Genes 2020, 11, 464 14 of 18
Acknowledgments: The chicken data used in this study were provided by the “Synbreed—Synergistic Plant
and Animal Breeding” project for which we are grateful to the project team. This work is part of FR’s doctoral
program, which is funded by the overseas scholarship program of the University of Agriculture Faisalabad,
Pakistan. We acknowledge support by the German Research Foundation and the Open Access Publication Funds
of the Göttingen University. We would like to thank Abirami Rajavel and Martin Wutke for proofreading the
manuscript and Malena Erbe for providing important insights into the chicken dataset.
Conflicts of Interest: The authors declare no conflict of interest.
References
1. Bain, M.; Nys, Y.; Dunn, I. Increasing persistency in lay and stabilising egg quality in longer laying cycles.
What are the challenges? Br. Poult. Sci. 2016, 57, 330–338. [CrossRef]
2. Pottgüter, R. Feeding laying hens to 100 weeks of age. Lohmann Inf. 2016, 50, 18–21.
3. Chien, Y.C.; Hincke, M.; McKee, M. Ultrastructure of avian eggshell during resorption following egg
fertilization. J. Struct. Biol. 2009, 168, 527–538. [CrossRef] [PubMed]
4. Nys, Y.; Bain, M.; Van Immerseel, F. Improving the Safety and Quality of Eggs and Egg Products: Volume 1: Egg
Chemistry, Production and Consumption; Elsevier: Cambridge, UK, 2011.
5. Brionne, A.; Nys, Y.; Hennequet-Antier, C.; Gautron, J. Hen uterine gene expression profiling during eggshell
formation reveals putative proteins involved in the supply of minerals or in the shell mineralization process.
BMC Genom. 2014, 15, 1–17. [CrossRef] [PubMed]
6. Mann, K.; Maček, B.; Olsen, J.V. Proteomic analysis of the acid-soluble organic matrix of the chicken calcified
eggshell layer. Proteomics 2006, 6, 3801–3810. [CrossRef]
7. Mann, K.; Olsen, J.V.; Maček, B.; Gnad, F.; Mann, M. Phosphoproteins of the chicken eggshell calcified layer.
Proteomics 2007, 7, 106–115. [CrossRef]
8. Yin, Z.; Lian, L.; Zhu, F.; Zhang, Z.H.; Hincke, M.; Yang, N.; Hou, Z.C. The transcriptome landscapes of
ovary and three oviduct segments during chicken (Gallus gallus) egg formation. Genomics 2020, 112, 243–251.
[CrossRef]
9. Crosara, F.S.G.; Pereira, V.J.; Lellis, C.G.; Barra, K.C.; Santos, S.K.A.D.; Souza, L.C.G.M.D.; Morais, T.A.D.;
Litz, F.; Limão, V.A.; Braga, P.F.S.; et al. Is the Eggshell Quality Influenced by the Egg Weight or the Breeder
Age? Braz. J. Poult. Sci. 2019, 21. [CrossRef]confirmed
10. Sun, L.; Wu, R. Mapping complex traits as a dynamic system. Phys. Life Rev. 2015, 13, 155–185. [CrossRef]
11. Zhang, H.; Wang, Z.; Wang, S.; Li, H. Progress of genome wide association study in domestic animals.
J. Anim. Sci. Biotechnol. 2012, 3, 26. [CrossRef]
12. Visscher, P.M.; Wray, N.R.; Zhang, Q.; Sklar, P.; McCarthy, M.I.; Brown, M.A.; Yang, J. 10 years of GWAS
discovery: Biology, function, and translation. Am. J. Hum. Genet. 2017, 101, 5–22. [CrossRef]
13. Schmid, M.; Bennewitz, J. Invited review: Genome-wide association analysis for quantitative traits in
livestock–a selective review of statistical models and experimental designs. Arch. Fuer Tierz. 2017, 60, 335.
[CrossRef]
14. Johnson, R.C.; Nelson, G.W.; Troyer, J.L.; Lautenberger, J.A.; Kessing, B.D.; Winkler, C.A.; O’Brien, S.J.
Accounting for multiple comparisons in a genome-wide association study (GWAS). BMC Genom. 2010,
11, 724. [CrossRef]
15. Bush, W.S.; Moore, J.H. Genome-wide association studies. PLoS Comput. Biol. 2012, 8, e1002822. [CrossRef]
[PubMed]Confirmed
16. Korte, A.; Farlow, A. The advantages and limitations of trait analysis with GWAS: A review. Plant Methods
2013, 9, 29. [CrossRef] [PubMed]
17. Holland, D.; Fan, C.C.; Frei, O.; Shadrin, A.A.; Smeland, O.B.; Sundar, V.; Andreassen, O.A.; Dale, A.M.
Estimating inflation in GWAS summary statistics due to variance distortion from cryptic relatedness. BioRxiv
2017, 164939, doi:10.1101/164939.
18. Kang, H.M.; Sul, J.H.; Service, S.K.; Zaitlen, N.A.; Kong, S.Y.; Freimer, N.B.; Sabatti, C.; Eskin, E.; et al.
Variance component model to account for sample structure in genome-wide association studies. Nat. Genet.
2010, 42, 348. [CrossRef] [PubMed]
19. Zhou, X.; Stephens, M. Genome-wide efficient mixed-model analysis for association studies. Nat. Genet.
2012, 44, 821–824. [CrossRef] [PubMed]
20. Young, A.I. Solving the missing heritability problem. PLoS Genet. 2019, 15, e1008222. [CrossRef]Genes 2020, 11, 464 15 of 18
21. Zhao, Y.; Chen, F.; Zhai, R.; Lin, X.; Wang, Z.; Su, L.; Christiani, D.C. Correction for population stratification
in random forest analysis. Int. J. Epidemiol. 2012, 41, 1798–1806. [CrossRef]
22. Nguyen, T.T.; Huang, J.Z.; Wu, Q.; Nguyen, T.T.; Li, M.J. Genome-wide association data classification and
SNPs selection using two-stage quality-based Random Forests. BMC Genom. 2015, 16, S5. [CrossRef]
23. Armero, C.; Cabras, S.; Castellanos, M.E.; Quirós, A. Two-Stage Bayesian Approach for GWAS With Known
Genealogy. J. Comput. Graph. Stat. 2019, 28, 197–204. [CrossRef]
24. Huang, X.; Zhou, W.; Bellis, E.S.; Stubblefield, J.; Causey, J.; Qualls, J.; Walker, K. Minor QTLs mining through
the combination of GWAS and machine learning feature selection. BioRxiv 2019, 712190, doi:10.1101/712190.
[CrossRef]
25. Liu, Y.; Wang, D.; He, F.; Wang, J.; Joshi, T.; Xu, D. Phenotype prediction and genome-wide association study
using deep convolutional neural network of soybean. Front. Genet. 2019, 10, 1091. [CrossRef] [PubMed]
26. Chen, C.C.; Schwender, H.; Keith, J.; Nunkesser, R.; Mengersen, K.; Macrossan, P. Methods for identifying
SNP interactions: A review on variations of Logic Regression, Random Forest and Bayesian logistic
regression. IEEE/ACM Trans. Comput. Biol. Bioinform. 2011, 8, 1580–1591. [CrossRef] [PubMed]
27. van der Heide, E.; Veerkamp, R.; van Pelt, M.; Kamphuis, C.; Athanasiadis, I.; Ducro, B. Comparing
regression, naive Bayes, and random forest methods in the prediction of individual survival to second
lactation in Holstein cattle. J. Dairy Sci. 2019, 102, 9409–9421. [CrossRef] [PubMed]
28. Brieuc, M.S.; Waters, C.D.; Drinan, D.P.; Naish, K.A. A practical introduction to Random Forest for genetic
association studies in ecology and evolution. Mol. Ecol. Resour. 2018, 18, 755–766. [CrossRef]
29. Nguyen, T.; Le, L. Detection of SNP-SNP Interactions in Genome-wide Association Data Using Random
Forests and Association Rules. In Proceedings of the 2018 12th International Conference on Software,
Knowledge, Information Management & Applications (SKIMA), Phnom Penh, Cambodia, 3–5 December
2018; IEEE: Piscataway, NJ, USA, 2018; pp. 1–7.Confirmed
30. Romagnoni, A.; Jégou, S.; Van Steen, K.; Wainrib, G.; Hugot, J.P. Comparative performances of machine
learning methods for classifying Crohn Disease patients using genome-wide genotyping data. Sci. Rep. 2019,
9, 1–18. [CrossRef]
31. Erbe, M.; Cavero, D.; Weigend, A.; Weigend, S.; Pausch, H.; Preisinger, R.; Simianer, H. Genomic prediction
in laying hens. In Proceedings of the 8th European Symposium on Poultry Genetics, Venice, Italy, 25–27
September 2013.
32. Ni, G.; Strom, T.M.; Pausch, H.; Reimer, C.; Preisinger, R.; Simianer, H.; Erbe, M. Comparison among three
variant callers and assessment of the accuracy of imputation from SNP array data to whole-genome sequence
level in chicken. BMC Genom. 2015, 16, 824. [CrossRef]
33. Ni, G.; Cavero, D.; Fangmann, A.; Erbe, M.; Simianer, H. Whole-genome sequence-based genomic
prediction in laying chickens with different genomic relationship matrices to account for genetic architecture.
Genet. Sel. Evol. 2017, 49, 8. [CrossRef]
34. Garrick, D.J.; Taylor, J.F.; Fernando, R.L. Deregressing estimated breeding values and weighting information
for genomic regression analyses. Genet. Sel. Evol. 2009, 41, 55. [CrossRef]
35. Kursa, M.B.; Rudnicki, W.R. Feature selection with the Boruta package. J. Stat. Softw. 2010, 36, 1–13.
[CrossRef]
36. Kursa, M.B.; Jankowski, A.; Rudnicki, W.R. Boruta–a system for feature selection. Fundam. Informaticae 2010,
101, 271–285. [CrossRef]
37. Kursa, M.B.; Rudnicki, W.R. The all relevant feature selection using random forest. arXiv 2011, arXiv:1106.5112.
38. Kinsella, R.J.; Kähäri, A.; Haider, S.; Zamora, J.; Proctor, G.; Spudich, G.; Almeida-King, J.; Staines, D.;
Derwent, P.; Kerhornou, A.; et al. Ensembl BioMarts: A hub for data retrieval across taxonomic space.
Database 2011, 2011, doi:10.1093/database/bar030. [CrossRef]
39. Ayalew, Y.; Gültas, M.; Effa, K.; Hanotte, O.H.; Schmitt, A. Identification of candidate signature genes and
key regulators associated with Trypanotolerance in the Sheko Breed. Front. Genet. 2019, 10, 1095.
40. Wlochowitz, D.; Haubrock, M.; Arackal, J.; Bleckmann, A.; Wolff, A.; Beißbarth, T.; Wingender, E.; Gültas, M.
Computational identification of key regulators in two different colorectal cancer cell lines. Front. Genet. 2016,
7, 42. [CrossRef]
41. Wingender, E.; Kel, A. geneXplain—eine integrierte Bioinformatik-Plattform. BIOspektrum 2012, 18, 554–556.
[CrossRef]Genes 2020, 11, 464 16 of 18
42. Koschmann, J.; Bhar, A.; Stegmaier, P.; Kel, A.; Wingender, E. “Upstream analysis”: An integrated
promoter-pathway analysis approach to causal interpretation of microarray data. Microarrays 2015, 4,
270–286. [CrossRef]
43. Rzhetsky, A.; Iossifov, I.; Koike, T.; Krauthammer, M.; Kra, P.; Morris, M.; Yu, H.; Duboué, P.A.; Weng, W.;
Wilbur, W.J.; et al. GeneWays: A system for extracting, analyzing, visualizing, and integrating molecular
pathway data. J. Biomed. Inform. 2004, 37, 43–53. [CrossRef]
44. Krull, M.; Pistor, S.; Voss, N.; Kel, A.; Reuter, I.; Kronenberg, D.; Michael, H.; Schwarzer, K.; Potapov, A.;
Choi, C.; et al. TRANSPATH R : An information resource for storing and visualizing signaling pathways and
their pathological aberrations. Nucleic Acids Res. 2006, 34, D546–D551. [CrossRef]
45. Jonchère, V.; Brionne, A.; Gautron, J.; Nys, Y. Identification of uterine ion transporters for mineralisation
precursors of the avian eggshell. BMC Physiol. 2012, 12, 10–51. [CrossRef]
46. Chakraborti, S.; Dhalla, N.S. Regulation of Membrane Na+-K+ ATPase; Springer: Heidelberg, Germany, 2016.
47. Colbran, R.J. Targeting of calcium/calmodulin-dependent protein kinase II. Biochem. J. 2004, 378, 1–16.
[CrossRef] [PubMed]
48. Meyer, M.B.; Watanuki, M.; Kim, S.; Shevde, N.K.; Pike, J.W. The human transient receptor potential
vanilloid type 6 distal promoter contains multiple vitamin D receptor binding sites that mediate activation
by 1, 25-dihydroxyvitamin D3 in intestinal cells. Mol. Endocrinol. 2006, 20, 1447–1461. [CrossRef] [PubMed]
49. Ogata, K.; Jeong, S.Y.; Murakami, H.; Hashida, H.; Suzuki, T.; Masuda, N.; Hirai, M.; Isahara, K.; Uchiyama, Y.;
Goto, J.; et al. Cloning and expression study of the mouse tetrodotoxin-resistant voltage-gated sodium
channel α subunit NaT/Scn11a. Biochem. Biophys. Res. Commun. 2000, 267, 271–277. [CrossRef] [PubMed]
50. Seda, M.; Pinto, F.M.; Wray, S.; Cintado, C.G.; Noheda, P.; Buschmann, H.; Candenas, L. Functional and
molecular characterization of voltage-gated sodium channels in uteri from nonpregnant rats. Biol. Reprod.
2007, 77, 855–863. [CrossRef] [PubMed]
51. Fan, Y.F.; Hou, Z.C.; Yi, G.Q.; Xu, G.Y.; Yang, N. The sodium channel gene family is specifically expressed in
hen uterus and associated with eggshell quality traits. BMC Genet. 2013, 14, 90. [CrossRef]
52. Koepsell, H. The SLC22 family with transporters of organic cations, anions and zwitterions. Mol. Asp. Med.
2013, 34, 413–435. [CrossRef]
53. Chowdhury, S.; Smith, T. Dietary interaction of 1, 4-diaminobutane (putrescine) and calcium on eggshell
quality and performance in laying hens. Poult. Sci. 2002, 81, 84–91. [CrossRef]
54. Shinki, T.; Tanaka, H.; Takito, J.; Yamaguchi, A.; Nakamura, Y.; Yoshiki, S.; Suda, T. Putrescine is involved in
the vitamin D action in chick intestine. Gastroenterology 1991, 100, 113–122. [CrossRef]
55. Altimimi, H.F.; Schnetkamp, P.P. Na+/Ca2+-K+ exchangers (NCKX): Functional properties and physiological
roles. Channels 2007, 1, 62–69. [CrossRef] [PubMed]
56. Gadi, J.; Jung, S.H.; Lee, M.J.; Jami, A.; Ruthala, K.; Kim, K.M.; Cho, N.H.; Jung, H.S.; Kim, C.H.; Lim, S.K. The
transcription factor protein Sox11 enhances early osteoblast differentiation by facilitating proliferation and
the survival of mesenchymal and osteoblast progenitors. J. Biol. Chem. 2013, 288, 25400–25413. [CrossRef]
[PubMed]
57. ELAROUSSI, M.A.; FORTE, L.R.; EBER, S.L.; BIELLIER, H.V. Calcium Homeostasis in the Laying Hen.: 1.
Age and Dietary Calcium Effects. Poult. Sci. 1994, 73, 1581–1589. [CrossRef] [PubMed]
58. Håkelien, A.M.; Bryne, J.C.; Harstad, K.G.; Lorenz, S.; Paulsen, J.; Sun, J.; Mikkelsen, T.S.; Myklebost, O.;
Meza-Zepeda, L.A. The regulatory landscape of osteogenic differentiation. Stem Cells 2014, 32, 2780–2793.
[CrossRef] [PubMed]
59. Scheidegger, E.P.; Sternberg, L.R.; Roth, J.; Lowe, J.B. A human STX cDNA confers polysialic acid expression
in mammalian cells. J. Biol. Chem. 1995, 270, 22685–22688. [CrossRef] [PubMed]
60. Itoh, T.; Munakata, K.; Adachi, S.; Hatta, H.; Nakamura, T.; Kato, T.; Kim, M. Chalaza and egg yolk
membrane as excellent sources of sialic acid (N-acetylneuraminic acid) for an industrial-scale preparation.
Jpn. J. Zootech. Sci. 1990, 61, 277–282.
61. Nakano, K.; Nakano, T.; Ahn, D.; Sim, J. Sialic acid contents in chicken eggs and tissues. Can. J. Anim. Sci.
1994, 74, 601–606. [CrossRef]
62. Nakano, T.; Ikawa, N.; Ozimek, L. Chemical composition of chicken eggshell and shell membranes. Poult. Sci.
2003, 82, 510–514. [CrossRef]Genes 2020, 11, 464 17 of 18
63. Du, J.; Hincke, M.T.; Rose-Martel, M.; Hennequet-Antier, C.; Brionne, A.; Cogburn, L.A.; Nys, Y.; Gautron, J.
Identifying specific proteins involved in eggshell membrane formation using gene expression analysis and
bioinformatics. BMC Genom. 2015, 16, 792. [CrossRef]
64. Jonchère, V.; Réhault-Godbert, S.; Hennequet-Antier, C.; Cabau, C.; Sibut, V.; Cogburn, L.A.; Nys, Y.;
Gautron, J. Gene expression profiling to identify eggshell proteins involved in physical defense of the
chicken egg. BMC Genom. 2010, 11, 57. [CrossRef]
65. Ahmed, T.A.; Suso, H.P.; Hincke, M.T. Experimental datasets on processed eggshell membrane powder for
wound healing. Data Brief 2019, 26, 104457. [CrossRef] [PubMed]
66. Ahmed, T.A.; Suso, H.P.; Hincke, M.T. In-depth comparative analysis of the chicken eggshell membrane
proteome. J. Proteom. 2017, 155, 49–62. [CrossRef] [PubMed]
67. Kim, Y.m.; Kim, W.Y.; Nam, S.A.; Choi, A.R.; Kim, H.; Kim, Y.K.; Kim, H.S.; Kim, J. Role of PROX1 in the
transforming ascending thin limb of Henle’s loop during mouse kidney development. PLoS ONE 2015, 10,
doi:10.1371/journal.pone.0127429.
68. Malumbres, M. Cyclin-dependent kinases. Genome Biol. 2014, 15, 122. [CrossRef] [PubMed]
69. Ogasawara, T.; Mori, Y.; Abe, M.; Suenaga, H.; Kawase-Koga, Y.; Saijo, H.; Takato, T. Role of cyclin-dependent
kinase (Cdk) 6 in osteoblast, osteoclast, and chondrocyte differentiation and its potential as a target of bone
regenerative medicine. Oral Sci. Int. 2011, 8, 2–6. [CrossRef]
70. Whitehead, C. Overview of bone biology in the egg-laying hen. Poult. Sci. 2004, 83, 193–199. [CrossRef]
71. Bar, A. Calcium transport in strongly calcifying laying birds: Mechanisms and regulation. Comp. Biochem.
Physiol. Part A Mol. Integr. Physiol. 2009, 152, 447–469. [CrossRef]
72. Ono, K.; Han, J. The p38 signal transduction pathway activation and function. Cell. Signal. 2000, 12, 1–13.
[CrossRef]
73. Suzanne, M.; Irie, K.; Glise, B.; Agnès, F.; Mori, E.; Matsumoto, K.; Noselli, S. The Drosophila p38 MAPK
pathway is required during oogenesis for egg asymmetric development. Genes Dev. 1999, 13, 1464–1474.
[CrossRef]
74. Zelcer, N.; Tontonoz, P. Liver X receptors as integrators of metabolic and inflammatory signaling.
J. Clin. Investig. 2006, 116, 607–614. [CrossRef]
75. Vaya, J.; Schipper, H.M. Oxysterols, cholesterol homeostasis, and Alzheimer disease. J. Neurochem. 2007, 102,
1727–1737. [CrossRef] [PubMed]
76. Griffiths, W.J.; Abdel-Khalik, J.; Crick, P.J.; Yutuc, E.; Wang, Y. New methods for analysis of oxysterols and
related compounds by LC–MS. J. Steroid Biochem. Mol. Biol. 2016, 162, 4–26. [CrossRef] [PubMed]
77. Beck, M.; Hansen, K. Role of estrogen in avian osteoporosis. Poult. Sci. 2004, 83, 200–206. [CrossRef]
78. Mackrill, J.J. Oxysterols and calcium signal transduction. Chem. Phys. Lipids 2011, 164, 488–495. [CrossRef]
[PubMed]
79. Kha, H.T.; Basseri, B.; Shouhed, D.; Richardson, J.; Tetradis, S.; Hahn, T.J.; Parhami, F. Oxysterols regulate
differentiation of mesenchymal stem cells: pro-bone and anti-fat. J. Bone Miner. Res. 2004, 19, 830–840.
[CrossRef]
80. Frederick, J.P.; Liberati, N.T.; Waddell, D.S.; Shi, Y.; Wang, X.F. Transforming growth factor β-mediated
transcriptional repression of c-myc is dependent on direct binding of Smad3 to a novel repressive Smad
binding element. Mol. Cell. Biol. 2004, 24, 2546–2559. [CrossRef]
81. Chen, C.R.; Kang, Y.; Siegel, P.M.; Massagué, J. E2F4/5 and p107 as Smad cofactors linking the TGFβ receptor
to c-myc repression. Cell 2002, 110, 19–32. [CrossRef]
82. Tang, S.Y.; Alliston, T. Regulation of postnatal bone homeostasis by TGFβ. BoneKEy Rep. 2013, 2,
doi:10.1038/bonekey.2012.255. [CrossRef]
83. Bell, D.M.; Leung, K.K.; Wheatley, S.C.; Ng, L.J.; Zhou, S.; Ling, K.W.; Sham, M.H.; Koopman, P.; Tam, P.P.;
Cheah, K.S. SOX9 directly regulates the type-ll collagen gene. Nat. Genet. 1997, 16, 174–178. [CrossRef]
84. Massagué, J.; Chen, Y.G. Controlling TGF-β signaling. Genes Dev. 2000, 14, 627–644.
85. Lönn, P.; Vanlandewijck, M.; Raja, E.; Kowanetz, M.; Watanabe, Y.; Kowanetz, K.; Vasilaki, E.; Heldin, C.H.;
Moustakas, A. Transcriptional induction of salt-inducible kinase 1 by transforming growth factor β leads to
negative regulation of type I receptor signaling in cooperation with the Smurf2 ubiquitin ligase. J. Biol. Chem.
2012, 287, 12867–12878. [CrossRef] [PubMed]
86. Stow, L.R.; Jacobs, M.E.; Wingo, C.S.; Cain, B.D. Endothelin-1 gene regulation. FASEB J. 2011, 25, 16–28.
[CrossRef] [PubMed]You can also read