Differential expression of breast cancer-associated genes between stage- and age-matched tumor specimens from African- and Caucasian-American ...
←
→
Page content transcription
If your browser does not render page correctly, please read the page content below
Grunda et al. BMC Research Notes 2012, 5:248
http://www.biomedcentral.com/1756-0500/5/248

 RESEARCH ARTICLE                                                                                                                               Open Access

Differential expression of breast cancer-associated
genes between stage- and age-matched tumor
specimens from African- and Caucasian-American
Women diagnosed with breast cancer
Jessica M Grunda1, Adam D Steg2, Qinghua He3, Mark R Steciuk4, Suzanne Byan-Parker4,
Martin R Johnson5 and William E Grizzle4*

  Abstract
  Background: Recent studies suggest that the poorer breast cancer outcome observed in African-American women
  (AAW) may, in part, result from underlying molecular factors. The purpose of this study was to investigate gene
  expression differences between Caucasian-American women (CAW) and AAW that may contribute to this poorer
  prognosis.
  Methods: The expression of 84 genes involved in breast carcinoma prognosis, response to therapy, estrogen
  signaling, and tumor aggressiveness was assessed in age- and stage-matched CAW and AAW paraffin-embedded
  breast cancer specimens. The Wilcoxon–Mann–Whitney Test was used to identify genes with a significant difference
  in expression between CAW and AAW. To determine if the differentially expressed genes could segregate between
  the CAW and AAW, we performed semi-supervised principal component analysis (SSPCA).
  Results: Twenty genes were differentially expressed between AAW and CAW. SSPCA incorporating these 20 genes
  segregated AAW and CAW into two distinct groups. AAW were significantly (p < 0.05) more likely to display
  aberrations in G1/S cell-cycle regulatory genes, decreased expression of cell-adhesion genes, and low to no
  expression of ESR1, PGR, ERBB2 and estrogen pathway targets.
  Conclusions: The gene expression differences identified between AAW and CAW may contribute to more
  aggressive disease, resistance to therapy, enhanced metastatic potential and poor clinical outcome. These findings
  support the hypothesis that breast cancer specimens collected from AAW display distinct gene expression
  differences compared to similar tissues obtained from CAW. Additional population-based studies are necessary to
  determine if these gene expression variations contribute to the highly aggressive and treatment-resistant breast
  cancer phenotype frequently observed in AAW.
  Keywords: Breast cancer, Gene expression, Race, Estrogen signaling, Cell cycle, Cell migration

* Correspondence: wgrizzle@uab.edu
4
 Department of Pathology, University of Alabama at Birmingham, Zeigler
Research Building, 703 South 19th Street, ZRB 408, Birmingham, AL 35294,
USA
Full list of author information is available at the end of the article

                                       © 2012 Grunda et al.; licensee BioMed Central Ltd. This is an Open Access article distributed under the terms of the Creative
                                       Commons Attribution License (http://creativecommons.org/licenses/by/2.0), which permits unrestricted use, distribution, and
                                       reproduction in any medium, provided the original work is properly cited.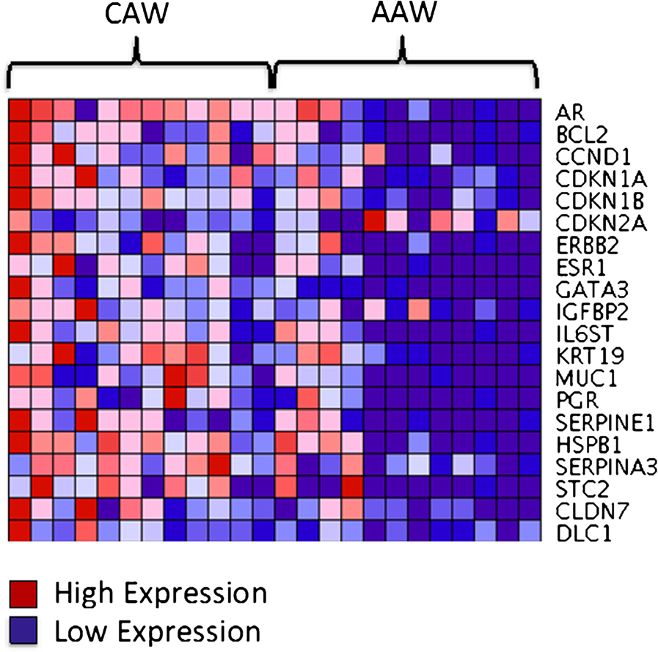
Grunda et al. BMC Research Notes 2012, 5:248                                                                   Page 2 of 13
http://www.biomedcentral.com/1756-0500/5/248

Background                                                    greater genetic predisposition for a more aggressive
Multiple studies have found distinct ethnic disparities in    breast cancer phenotype. Recent studies have demon-
breast cancer outcome between African-American                strated that young, premenopausal women of African
women (AAW) and Caucasian-American women                      American descent are more likely to display histological
(CAW) in incidence rate, age-of-onset, mortality and          characteristics depictive of the basal-like subtype of
survival. Although the overall incidence rate for breast      breast cancer, known for its aggressive behavior and
cancer is higher in CAW compared to AAW, the age-             poorer clinical outcome, compared to any other age
adjusted mortality rate for AAW (33/100,000) is signifi-      group of any other ethnic background examined [15,16].
cantly higher than any other ethnic group examined,           Histologically, breast carcinomas from AAW more often
including women of Caucasian descent [1]. In fact, AAW        display pushing, non-infiltrative tumor margins, nuclear
at all breast cancer stages assessed (localized, regional &   pleomorphism, lymphocytic infiltrate, large primary
distant) have a much lower 5-year survival rate (78%)         tumors, necrosis, lack of tubule formation, as well as
compared to CAW (90%) [2]. Although breast cancer             high mitotic indices and histological grade [15,17–21].
risk increases with age in all ethnicities, women of Afri-    In addition, AAW are more likely to lack expression of
can-American ancestry are more often diagnosed at a           both the estrogen and progesterone receptors, and often
much younger age, with 30–40% of AAW diagnosed with           display the triple negative phenotype (ER-, PR-, HER2-),
breast cancer prior to 50 years of age, compared to just      thus precluding treatment with such targeted therapies
20% for CAW [3]. This trend is even more striking con-        as tamoxifen, anastrozole, and Herceptin [17,20,22].
sidering AAW are diagnosed more frequently with               Women of African-American ethinicity are also more
higher-grade tumors that are resistant to traditional ther-   likely to exhibit specific alterations in the levels of genes
apies [4]. The mechanisms underlying poorer outcome in        involved in cell-cycle regulation and apoptosis, including
AAW diagnosed with breast cancer remains to be                higher quantities of p16, p53, and cyclin E, and lower
elucidated.                                                   levels of BCL-2, cyclin D1, and p27 [20,22]. In addition
   Early studies suggested that the poorer outcome            to these ‘basal-like’ features, other studies have found
observed for AAW diagnosed with breast cancer                 that AAW had a significantly higher prevalence of dele-
resulted from disparities in social economic status (SES),    terious mutations in BRCA1 and BRCA2 compared with
education level, access to health care, diet, religious       CAW [23].
beliefs, and geographical location [5-9]. However, recent        Many of these genetic differences may be associated
research suggests that differences in clinical outcomes       with differences in tumor grade and hormone receptor
likely arise from both societal and genetic factors. Sev-     status (ER and HER-2/neu), both of which have been
eral large population-based meta-analyses report that         found to independently influence gene expression pro-
AAW display a significantly higher mortality rate than        files. Although, a study recently published by Field et al.
when compared to any other ethnicity, even after              determined that even when patient tissues were matched
accounting for SES [10,11]. Additionally, even when Af-       on age, grade, and estrogen receptor status, significant
rican and Caucasian-American women had equal access           differences in gene expression profiles were still
to health care and/or underwent identical treatment           observed [24]. The genes identified spanned a diverse
regimens, the disparity in patient outcome persisted. For     array of cellular functions including the proteasome sys-
instance, two Department of Defense studies examining         tem, eye lens physiology, cell growth and differentiation,
treatment outcome in breast cancer patients found that        and cellular immunity and inflammation [24]. While
mortality rates were still significantly higher in AAW        these studies collectively provided insight into potential
versus CAW even though patients had equal access to           biological factors contributing to the poor clinical out-
health care and underwent identical treatment regimens        come of AAW, further studies are needed to clarify the
[12,13]. Another study by Albain et al. investigating sur-    role of genetics in AAW breast cancer epidemiology.
vival of breast cancer patients enrolled in randomized           The identification of potential gene expression differ-
clinical trials of the Southwest Oncology Group found         ences driving the disparities in health outcome between
that overall survival rates for African American patients     AAW and CAW is critical to improving the treatment
were significantly poorer, even though patients received      response and survival of these women as these molecu-
the same treatment regimens and were controlled for           lar differences may impact breast cancer prevention,
both prognostic factors and SES [14]. These studies col-      screening practices, diagnostic testing and treatment
lectively support the hypothesis that while there are         protocols. In this study we utilized a novel experimental
sociological factors contributing to the higher mortality     approach to investigate differences in gene expression
rates seen in AAW, other causative factors exist.             between AAW and CAW, independent from age or dis-
   A mounting body of evidence now suggests that              ease stage at diagnosis. Paraffin-embedded, age- and
women of African-American ancestry may harbor a               stage-matched breast carcinoma samples from AAW
Grunda et al. BMC Research Notes 2012, 5:248                                                                 Page 3 of 13
http://www.biomedcentral.com/1756-0500/5/248

and CAW patients were macrodissected to enrich the            staining or membrane staining in less than 10% of tumor
specimens in tumor cell content (>80%). Gene expres-          cells, 1+ was negative if weak membrane staining in
sion analysis of genes previously implicated in breast        greater that 10% of tumor cells, 2+ was positive if weak
cancer prognosis, treatment response, estrogen signaling,     to moderate complete membrane staining in greater
and tumor aggressiveness was performed using The              than 10% of tumor cells, and 3+ was positive if strong
Human Breast Cancer and Estrogen Receptor Signaling           complete membrane staining in greater than 10% of
RT2 Profiler PCR Array from SABiosciences. Using the          tumor cells [25,26].
Wilcoxon-Mann–Whitney Test we identified genes dis-             For the one case in which ER, PR, HER2/neu clinical
playing a significant difference in expression between        data was unavailable, immunostaining was performed in
tumors obtained from AAW and CAW breast cancer                Dr. William Grizzle’s research laboratory using ER alpha
patients. These analyses identified a distinct molecular      (clone SP1), PR alpha and beta (clone PgR 636), and
profile in women of African-American descent, often           HER2/neu (clone 3B5) and evaluated by a pathologist.
associated with the basal-like phenotype and previously
associated with resistance to therapy and poor clinical       Sample preparation
outcome, supporting the hypothesis that AAW may have          Macrodissection
a gene-expression based predisposition for a more ag-         An H + E section was matched and orientated to the par-
gressive disease phenotype.                                   affin block from which it was cut and areas of benign
                                                              tissue and non-invasive neoplasms were identified and
Methods                                                       removed so that after macrodissection, the ductal carcin-
Selection of cases                                            oma remaining in the block contained at least 80%
Consent was obtained for all patients prior to start of       ductal carcinoma. The tumor areas were re-embedded
study. The use of human tissues was approved by and           and new H + E sections were cut to confirm that the
conducted in accordance with the policies of the Institu-     ductal carcinoma was successfully enriched by the
tional Review Board at the University of Alabama at Bir-      macrodissection. Ten 10-μm sections were then cut for
mingham. The records of archival cases of breast cancer       RNA extraction.
from UAB Surgical Pathology were searched to identify
age (± 5 years) and stage (assessed by a pathologist)         RNA extraction
matched cases of ductal carcinoma. The quality of the         Paraffin tissue curls were deparaffinized as previously
available archival blocks from the matched cases was          described [27]. Total RNA isolation was then performed
then assessed through hematoxylin and eosin (H + E)           using the Roche High Pure RNA Paraffin Kit (Roche
staining of newly cut sections from the original diagnos-     Diagnostics, Manheim, Germany) as per manufacturer’s
tic blocks. Sections were examined and selected for areas     instructions. Total RNA was eluted in 30 μl of RNase-
of tumor that could be macrodissected into greater than       free water and stored at −80°C until further analysis.
80% invasive cancer.                                          The concentration of all RNA samples was quantitated
                                                              through linear regression analysis of a standard curve
Analysis of receptor status                                   derived from known concentrations of normal breast
ER, PR and HER2 status were determined in the CAP/            RNA. Ribosomal protein, large, P0 (RPLP0), which has
CLIA accredited laboratory of University of Alabama at        been previously validated by our laboratory [28], was
Birmingham Hospital with the exception of one case.           used as the housekeeping gene.
Immunostaining of ER (Clone SP1) and PR (1 E2) was
performed using a semi-automated immunostainer                Reverse transcription
(Ventana, Model XT) and an Ultraview HPR Multitimer           Complementary DNA was prepared using the RT2 First
approach. Tumors were considered positive if 1% or            Strand Kit (SABiosciences, Frederick, MD) as per manu-
greater of tumor cells stained. Percentage of staining as     facturer’s instructions. Approximately 0.5 μg of total
well as intensity 1+ (weak) to 3+ (strong) was also           RNA from each sample was used for cDNA synthesis.
reported. The HER2/neu status was determined by CISH
using the Spot-Light Kit (Invitrogen), which is specific      Analysis of samples by the RT2 profiler PCR array
for the HER2 gene locus on chromosome 17q11.2-21. A           The pre-designed Human Breast Cancer and Estrogen
minimum of 30 tumor cell nuclei were evaluated per pa-        Receptor Signaling RT2 Profiler PCR Array (SABios-
tient. Criteria are as follows: ≥ 6 dots in the majority of   ciences) was utilized to simultaneously analyze 84 genes
carcinoma cells is amplified, 4–6 is equivocal, and ≤ 4       related to breast cancer regulation and estrogen recep-
dots is non-amplified. All evaluations are done by stand-     tor-dependent signal transduction in cDNA samples.
ard microscopy. Cases prior to 2005 were evaluated by         The housekeeping genes B2M, HPRT1, RPL13A,
immunohistochemistry where 0 was negative if no               GAPDH and ACTB are included on each Array. Each
Grunda et al. BMC Research Notes 2012, 5:248 Page 4 of 13
http://www.biomedcentral.com/1756-0500/5/248
cDNA sample was added to 2X SuperArray RT2 qPCR Pearson correlation
Master Mix (SABiosciences) and 25 μl of the mixture To calculate the strength and direction of the linear as-
was added to each well of the PCR Array using an eight- sociation between the expression of gene pairs across all
channel pipettor. The plate was sealed and PCR amplifi- samples, and/or the AAW and CAW patient subpopula-
cation was performed using an Applied Biosystems tions individually, we used Pearson’s Correlation. Pear-
Prism 7900HT sequence detection system. Thermal son’s correlation assumes a Gaussian distribution of
cycler conditions were as follows: 2 minutes at 50°C, 10 gene expression values within sample sets (i.e. AAW
minutes at 94.5°C, then 40 cycles of 30 seconds at 97°C patients).
and 1 minute at 59.7°C. Delta cycle threshold (Delta CT)
and expression values were calculated using the com- Hotelling’s T2 test
parative cycle threshold (CT) method as previously Hotelling’s T2 test is used in multivariate hypothesis
described by our laboratory [27,29]. testing, which is a generalization of Student’s t test in
univariate hypothesis testing [35]. Given the case of p-
Statistical analysis variate observations from two multivariate normally-
Fisher’s exact test distributed populations with common covariance matrix,
Fisher’s exact test is a statistical significance test used in Hotelling’s T2 statistic can be used to test the equality of
the analysis of contingency tables to calculate whether the vector of means associated with the two samples [35].
there is a significant association between categorical In this work, we apply Hotelling’s T2 test to examine the
variables. It is employed when sample sizes are small so multivariate gene differences between AAW and CAW
the normal approximation and chi-square calculations patients.
are not accurate [30].
Results
Wilcoxon–Mann–Whitney test Patient characteristics
In order to determine what genes were differentially Both age and disease stage at diagnosis are potential
expressed between the CAW and AAW, we utilized the factors influencing the poorer outcome observed in
Wilcoxon–Mann–Whitney test [31] using gene ΔCT women of African-American descent. To ensure that
values. The Wilcoxon–Mann–Whitney test examines any gene expression differences identified in this study
the null hypothesis that gene expression levels in the were not due to age or disease stage, we selected
two groups (CAW and AAW) are independent samples age- and stage-matched paraffin-embedded samples of
from identical continuous distributions with equal med- ductal breast carcinoma samples from African- and
ians, compared against the alternative that they do not Caucasian-American women using archival records
have equal medians. Each gene is evaluated independ- stored at the University of Alabama at Birmingham.
ently to determine the statistical significance of the dif- From 80 matched archival specimens surveyed, 12
ference between the two-group medians. A p-value pairs were deemed of high enough quality for macro-
of < 0.05 was considered statistically significance in this dissection and future study. All samples examined in
study. this study were collected through biopsy or tumor
Semi-Supervised Principal Component Analysis (SSPCA) Table 1 Unmatched characteristics in the study
population
To determine if the genes identified through the Wil-
Characteristic AAW (n = 11) CAW (n = 11)
coxon–Mann–Whitney test could visually segregate the
AAW and CAW into two distinct groups we performed Receptor Status
SSPCA [32,33]. In traditional PCA, all gene expression ER 6 55% 10 91%
values are used to identify combinations of genes that PR 5 45% 7 64%
separate samples into distinct groups. SSPCA has the HER2 5 45% 7 64%
advantage of using only those genes previously asso- Tumor grade
ciated with clinical and/or demographic factors, and, in
Well 0 0% 2 18%
this case, patient ethnicity, to segregate samples into
subgroups, thus allowing clear visualization of how gene Moderate 2 18% 7 64%
expression patterns segregate groups without interfering Poor 9 82% 2 18%
background noise from genes that are not differentially Bloom and Richardson Score
expressed. The Komogorov-Smirnov normality test was I 0 0% 2 18%
applied to the identified principle components (PCs) to II 2 18% 7 64%
ensure the data was approximately normally distributed
III 9 82% 2 18%
[34].Grunda et al. BMC Research Notes 2012, 5:248 Page 5 of 13
http://www.biomedcentral.com/1756-0500/5/248
Table 2 Human breast cancer and extrogen recptor RT2 Table 2 Human breast cancer and extrogen recptor RT2
profiler PCR array profiler PCR array (Continued)
Description Accession #: V-erb-b2 erythroblastic leukemia viral NM_004448
Genes Associated with Breast Cancer Prognosis oncogene homolog 2 (ERBB2)
Androgen receptor (AR) NM_000044 Genes Associated with Estrogen Receptor Signaling
Antigen identified by monoclonal antibody NM_002417 Non-metastatic cells 1 (NME1) NM_000269
Ki-67 (MKI67) Phosphatase and tensin homolog (PTEN) NM_000314
B-cell CLL/lymphoma 2 (BCL2) NM_000633 Plasminogen activator, urokinase (PLAU) NM_002658
BCL2-associated agonist of cell death (BAD) NM_004322 Progesterone receptor (PGR) NM_000926
BCL2-associated athanogene (BAG1) NM_004323 Serpin peptidase inhibitor, clade B, member 5 NM_002639
Cadherin 1, type 1, E-cadherin (CDH1) NM_004360 (SERPINB5)
Catenin (cadherin-associated protein), beta 1, (CTNNB1) NM_001904 Serpin peptidase inhibitor, clade E, member 1 NM_000602
(SERPINE1)
Cathepsin B (CTSB) NM_001908
Thrombospondin 1 (THBS1) NM_003246
Clusterin (CLU) NM_001831
Topoisomerase (DNA) II alpha (TOP2A) NM_001067
Collagen, type VI, alpha 1 (COL6A1) NM_001848
Transforming growth factor, alpha (TGFA) NM_003236
Cyclin A1 (CCNA1) NM_003914
Tumor protein p53 (TP53) NM_000546
Cyclin A2 (CCNA2) NM_001237
Tyrosine kinase with immunoglobulin-like and NM_005424
Cyclin D1 (CCND1) NM_053056 EGF-like domains 1 (TIE1)
Cyclin E1 (CCNE1) NM_001238 Vascular endothelial growth factor A (VEGFA) NM_003376
Cyclin-dependent kinase inhibitor 1A (CDKN1A) NM_000389 Genes Associated with Response to Chemotherapy
Cyclin-dependent kinase inhibitor 1B (CDKN1B) NM_004064 Cathepsin D (CTSD) NM_001909
Cyclin-dependent kinase inhibitor 2A (CDKN2A) NM_000077 Complement component 3 (C3) NM_000064
Epidermal growth factor receptor (EGFR) NM_005228 Heat shock 27 kDa protein 1 (HSPB1) NM_001540
Estrogen receptor 1 (ESR1) NM_000125 Keratin 18 (KRT18) NM_000224
Estrogen receptor 2 (ESR2) NM_001437 Serpin peptidase inhibitor, member 3 (SERPINA3) NM_001085
Fas ligand (TNF superfamily, member 6) (FASLG) NM_000639 Solute carrier family 7, member 5 (SLC7A5) NM_003486
FOS-like antigen 1 (FOSL1) NM_005438 Stanniocalcin 2 (STC2) NM_003714
GATA binding protein 3 (GATA3) NM_002051 Trefoil factor 1 (TFF1) NM_003225
Gelsolin (GSN) NM_000177 Genes Associated with Breast Cancer
Inhibitor of DNA binding 2 (ID2) NM_002166 Diagnosis and Progression
Insulin-like growth factor binding protein 2 (IGFBP2) NM_000597 BCL2-like 2 (BCL2L2) NM_004050
Integrin, alpha 6 (ITGA6) NM_000210 CD44 molecule (CD44) NM_000610
Integrin, beta 4 (ITGB4) NM_000213 Claudin 7 (CLDN7) NM_001307
Interleukin 2 receptor, alpha (IL2RA) NM_000417 Cytochrome P450, family 19, subfamily A, NM_000103
polypeptide (CYP19A1)
Interleukin 6 (IL6) NM_000600
Deleted in liver cancer 1 (DLC1) NM_006094
Interleukin 6 receptor (IL6R) NM_000565
Fibroblast growth factor 1 (FGF1) NM_000800
Interleukin 6 signal transducer (IL6ST) NM_002184
Fibronectin leucine rich transmembrane NM_013280
Jun oncogene (JUN) NM_002228 protein 1 (FLRT1)
Kallikrein-related peptidase 5 (KLK5) NM_012427 Gamma-aminobutyric acid (GABA) A receptor, NM_014211
Keratin 19 (KRT19) NM_002276 pi (GABRP)
Kruppel-like factor 5 (KLF5) NM_001730 GNAS complex locus (GNAS) NM_080425
Mitogen-activated protein kinase kinase 7 (MAP2K7) NM_145185 High-mobility group box 1 (HMGB1) NM_002128
Mucin 1, cell surface associated (MUC1) NM_001018016 Metallothionein 3 (MT3) NM_005954
Nerve growth factor (NGF) NM_002506 Nuclear transcription factor Y, beta (NFYB) NM_006166
Nerve growth factor receptor (NGFR) NM_002507 Pregnancy-associated plasma protein A, NM_002581
pappalysin 1 (PAPPA)
Prostaglandin-endoperoxide synthase 2 (PTGS2) NM_000963
Ras-related C3 botulinum toxin substrate 2 (RAC2) NM_002872
TNF receptor superfamily, member 6 (FAS) NM_000043Grunda et al. BMC Research Notes 2012, 5:248 Page 6 of 13
http://www.biomedcentral.com/1756-0500/5/248
Table 2 Human breast cancer and extrogen recptor RT2 CDKN2A displayed increased expression in women of
profiler PCR array (Continued) African-American descent.
Ribosomal protein L27 (RPL27) NM_000988 We then visualized the ability of the 20 differentially
Secretoglobin, family 1D, member 2 (SCGB1D2) NM_006551
expressed genes to segregate the AAW and CAW
patients into distinct molecular subgroups. SSPCA was
Secretoglobin, family 2A, member 1 (SCGB2A1) NM_002407
performed by applying only the 20 genes identified by
Small proline-rich protein 1B (SPRR1B) NM_003125 the Wilcoxon-Mann–Whitney test in principal compo-
Thrombospondin 2 (THBS2) NM_003247 nent analysis. Application of the Kolmogorov-Smirnov
Tumor necrosis factor, alpha-induced protein 2 NM_006291 normality test to the first three identified PCs deter-
(TNFAIP2) mined that all three principle components (PCs) had an
V-kit Hardy-Zuckerman 4 feline sarcoma viral NM_000222 approximate normal distribution (p < 0.05) across both
oncogene homolog (KIT) patient ethnicities. Based on the multivariate Hotelling
Housekeeping Genes T-Squared test, as would be expected the 20-gene com-
Actin, beta (ACTB) NM_001101 bination significantly separated the breast cancer
Beta-2-microglobulin (B2M) NM_004048 patients into two distinct subgroups (Figure 2) using
Glyceraldehyde-3-phosphate dehydrogenase (GAPDH) NM_002046
PC1 (p < 0.001), PC1 and PC2 (p < 0.001), or the first
three PCs (p < 0.001).
Hypoxanthine phosphoribosyltransferase 1 (HPRT1) NM_000194
A comprehensive review of the literature determined
Ribosomal protein L13a (RPL13A) NM_012423 that of the 20 differentially expressed genes, 70% (AR,
BCL2, CCND1, ESR1, GATA3, IGFBP2, IL6ST, KRT19,
resection prior to start of radiation, chemotherapy, or MUC1, PGR, SERPINE1, HSPB1, SERPINA3, and STC2)
other therapies. Patient treatment was not significantly have been previously associated with estrogen signaling
different between AAW and CAW for the 24 and/or estrogen receptor 1 expression. To determine if
patients, and consisted mainly of lumpectomy, total similar associations with estrogen signaling could be
mastectomy, radiotherapy, tamoxifen, and arimidex. detected in this study, Pearson’s correlation was used to
Due to the short amount of elapsed time between ini- determine the strength and direction of any underlying
tial patient diagnosis and study analysis, associations relationships with ESR1 expression. Of the above listed
between clinical parameters (race, age, disease stage, genes, ESR1 was positively associated with the expres-
and treatment) and patient survival could not be sion of BCL2, GATA3, IL6ST, MUC1, SERPINE1, AR,
determined. and HSPB1 expressions in women of African-American
As illustrated in Table 1, AAW were more likely to be descent, with BCL2 displaying the strongest association
negative for ER, PR, and HER2, however this observa- (Table 3). In contrast, only the expression of KRT19 and
tion was not significant, perhaps owing to small number CCND1 were correlated with ESR1 expression in the
of samples examined in this study. In contrast, patient Caucasian population (Table 4).
ethnicity was significantly associated with tumor grade In addition to estrogen signaling genes, 4 of the 20
(p = 0.0131) with AAW patients more often displaying a identified genes have been implicated in resistance to
higher tumor Grade (Table 1). targeted therapies (ERBB2, ESR1, PGR, and AR). Previ-
ous studies have reported that tumor specimens from
Gene expression differences between AAW and CAW women of African-American heritage are significantly
Previous studies suggested that AAW women might more likely to lack expression of the hormone receptors
have a genetic predisposition for a more aggressive ESR1, PGR, and AR, compared to other ethnicities. In
breast cancer phenotype. To investigate this possibility the current study we found significantly lower expres-
further, we examined differences between AAW and sion of these receptors (6.7-fold) in the AAW compared
CAW patient samples in the expression of 84 genes pre- to CAW patients (Table 3) for PGR (58%; 17%), and
viously implicated in breast cancer aggressiveness, estro- ESR1 (58%; 17%) respectively. In addition, a larger per-
gen receptor signaling, resistance to chemotherapy, and centage of AAW than CAW patients had no measurable
patient prognosis using the Human Breast Cancer and expression of the PGR (33%; 8%) and ESR1 (50%; 8%)
Estrogen Receptor Signaling RT2 Profiler PCR Array genes respectively. AAW patients were also less likely to
from SABiosciences (Table 2). Based on gene Delta CT express ERBB2 (42%; 8%).
values, the Wilcoxon–Mann–Whitney test determined In addition to estrogen signaling and resistance to
that 20 of the 84 genes examined were significantly dif- therapy, 7 of the identified genes have been previously
ferentially expressed (p ≤ 0.05) between the AAW and associated with cell cycle regulation (CCND1, CDKN1A,
CAW patients, with a greater than 2-fold change in ex- CDKN1B, and CDKN2A) and breast cancer aggressive-
pression (Table 3; Figure 1). Of these 20 genes, only ness (CLDN7 and DLC1) (Table 3).Grunda et al. BMC Research Notes 2012, 5:248 Page 7 of 13 http://www.biomedcentral.com/1756-0500/5/248 Table 3 Breast cancer genes differentially expressed between CAW and AAW patient populations Gene Description CAWa AAWb CAW/AAWc P-valued Genes Associated with Breast Cancer Prognosis AR Androgen receptor 0.99 0.38 2.60 0.002 BCL2 B-cell CLL/lymphoma 2 0.65 0.20 3.28 0.010 CCND1 Cyclin D1 0.78 0.28 2.75 0.030 CDKN1A Cyclin-dependent kinase inhibitor 1A 2.07 0.90 2.29 0.002 CDKN1B Cyclin-dependent kinase inhibitor 1B 1.68 0.74 2.26 0.001 CDKN2A Cyclin-dependent kinase inhibitor 2A 1.35 3.55 0.38 0.046 ERBB2 V-erb-b2 erythroblastic leukemia viral oncogene homolog 2 1.61 0.63 2.56 0.012 ESR1 Estrogen receptor 1 1.79 0.46 3.91 0.023 GATA3 GATA binding protein 3 1.57 0.17 9.33 0.001 IGFBP2 Insulin-like growth factor binding protein 2, 36 kDa 1.53 0.73 2.11 0.005 IL6ST Interleukin 6 signal transducer 1.15 0.44 2.64 0.005 KRT19 Keratin 19 1.44 0.71 2.03 0.012 MUC1 Mucin 1, cell surface associated 1.77 0.36 4.94 0.004 PGR Progesterone receptor 0.77 0.33 2.34 0.012 SERPINE1 Serpin peptidase inhibitor, clade E, member 1 7.59 3.18 2.38 0.014 Genes Associated with Response to Chemotherapy HSPB1 Heat shock 27 kDa protein 1 0.98 0.46 2.14 0.003 SERPINA3 Serpin peptidase inhibitor, clade A, member 3 0.43 0.20 2.16 0.017 STC2 Stanniocalcin 2 0.79 0.38 2.05 0.019 Genes Associated with Breast Cancer Progression CLDN7 Claudin 7 1.76 0.66 2.67 0.006 DLC1 Deleted in liver cancer 1 4.27 0.94 4.52 0.023 a Average Gene Expression of Caucasion-American Women (CAW, n = 12). b Average Gene Expression of African-Amercian Women (AAW, n = 12). c Gene Expression Fold Change Relative to the Average Gene Expression of AAW. d P-values calculated using the Wilcoxin Rank Sum Test. Discussion Interestingly, even though patients were matched on Women of African-American descent are diagnosed with both age and stage at diagnosis, tumor tissues from breast cancer at a younger age and clinical stage than women of African decent were significantly more likely their Caucasian counterparts. In addition, although to be of higher grade. Although AAW tumors were also CAW have a higher incidence of breast cancer, AAW more likely to display the triple negative (ER-, PR-, have poorer survival rates. While multiple studies have HER2-) phenotype, these observations did not reach shown that these disparities in health outcomes are, in statistical significance. Higher grade and a triple negative part, due to such societal factors as social economic sta- phenotype are known negative predictors of breast can- tus, access to appropriate health care, diet and religious cer prognosis. Thus, these findings are in agreement beliefs, population-based studies showed that differences with past studies and support that AAW have a molecu- in patient diagnosis and survival remained even after lar predisposition for a more aggressive breast cancer taking such factors into account, suggesting biological phenotype. underpinnings in race may be responsible. Identification In the current study the expression of 84 genes of genetic contributors that may be driving the racial dif- (Table 2) previously implicated in breast cancer aggres- ferences in clinical outcome is critical as such factors siveness, estrogen receptor signaling, resistance to may alter preventative medicine, cancer screening prac- chemotherapy, and patient prognosis were examined in tices, and therapeutic guidelines. The aim of the current formalin-fixed, paraffin-embedded (FFPE) tissues study was to gain a more in-depth understanding of obtained from age- and stage-matched AAW and CAW gene expression differences between AAW and CAW patients. Gene expression analysis of archival tissues has breast cancer patients that may contribute to the poorer traditionally been problematic due to nucleotide degrad- outcome of AAW patients. ation resulting from tissue processing. However,
Grunda et al. BMC Research Notes 2012, 5:248 Page 8 of 13
http://www.biomedcentral.com/1756-0500/5/248
aggressive and treatment resistant tumor phenotype than
CAW. The 20 differentially expressed genes identified
(Table 3) have been implicated in cell cycle regulation,
response to therapy, estrogen signaling and breast cancer
aggressiveness. Abnormalities in the levels of G1/S phase
cell-cycle regulatory proteins have been previously asso-
ciated with breast cancer prognosis and response to
therapy [39-44]. In our study the expression of CCND1,
CDKN1A and CDKN1B was significantly elevated, while
CDKN2A was significantly lower, in Caucasian-American
compared to African-American patients. CCND1 (Cyclin
D) drives the G1/S phase transition through binding with
cyclin dependent kinase 4 (CDK4) and cyclin dependent
kinase 6 (CDK6), which then phosphorylates retino-
blastoma (pRb), inducing downstream Cyclin E tran-
scription [45]. In contrast CDKN1A (p21), CDKN1B
(p27), and CDKN2A (p16) are cyclin dependent kinase
inhibitor proteins (CDK inhibitors) involved in cell cycle
arrest through inhibition of CDK4, CDK6, and cyclin
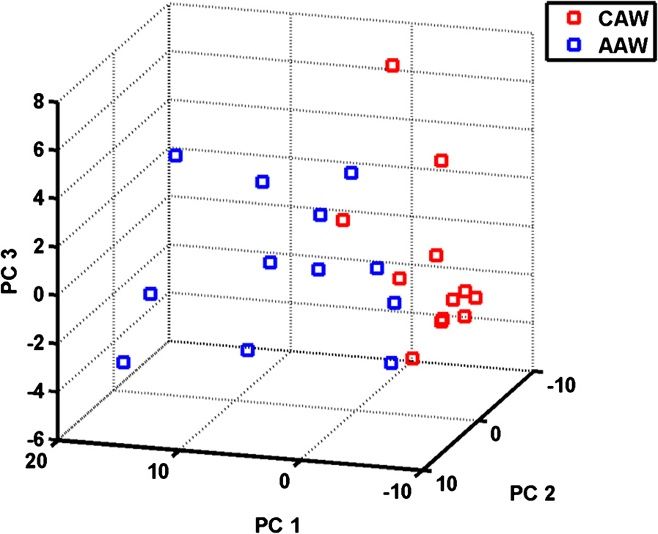
Figure 1 Heat map illustrating differences in the expression of dependent kinase 2 (CDK2) [45]. As a whole, the lower
20 breast cancer-associated genes between AAW and CAW
expression of CCND1, CDKN1A and CDKN1B, and
breast cancer patients.
higher expression of CDKN2A in AAW versus CAW
patients would hypothetically result in decreased cellu-
immense progress has been made in both the RNA iso- lar proliferation in AAW tumor specimens, yet AAW
lation from and expression analysis of FFPE tissues patient tissues had a statistically significant higher grade
[36,37]. In fact, several studies specifically comparing than CAW specimens in this study. Interestingly, other
gene expression profiles from matched snap-flash frozen studies have also observed this same contradiction [20],
and FFPE tissues demonstrated significant concordance and in fact, have noted a distinct inverse relationship
(r = 0.92, P < 0.0001) [29,38], opening the use of archival between cyclin D1 [20,46,47] and p16 [20,48,49] levels
tissues for gene expression analysis. with poorer clinical outcome, a more aggressive cancer
The current study identified 20 genes that had a sig- phenotype, and resistance to multiple chemotherapeutic
nificant and greater than 2-fold change in expression be- agents. The collective findings of our and these studies
tween AAW and CAW patients using the Wilcoxon- suggest that deregulation of cell-cycle G1 regulatory
Mann–Whitney test (Table 3). As illustrated in Figure 1,
virtually all of the genes identified displayed increased
expression in Caucasian compared to African-American
women. Only CDKN1A displayed a significantly higher
expression in AAW. To determine if the differential
expression of these genes could discriminate between
African-American and Caucasian patients, we performed
SSPCA. SSPCA is advantageous over general principal
component analysis in that, by only using those genes
associated with ethnic background, patient clustering can
be visualized without background noise resulting from
genes that are not differentially expressed. This analysis
determined that the AAW and CAW breast cancer
patients could be visually clustered based only on the ex-
pression of these 20 genes using combinations of principal
component PC1, PC2, and PC3 (Figure 2, p < 0.001 for all
PC combinations).
In support of previous studies examining molecular Figure 2 Semi-Supervised Principal Component Analysis
differences between African-American and Caucasian- significantly (p < 0.005) segregated the AAW and CAW breast
cancer patients into two distinct groups based on
American women, our study suggests that AAW have a
combinations of the first three principal components (PCs).
gene expression-based predisposition for a moreGrunda et al. BMC Research Notes 2012, 5:248 Page 9 of 13
http://www.biomedcentral.com/1756-0500/5/248
Table 4 Genes previously associated with estrogen elevated ERRB2 expression has been associated with
signalling increased disease recurrence, metastasis, and shorter sur-
CAW AAW vival, enhanced survival is also observed for these
Gene r P - Value r P - Value patients when treated with HER-2 targeted therapies
BCL2 NS NS 0.95Grunda et al. BMC Research Notes 2012, 5:248 Page 10 of 13
http://www.biomedcentral.com/1756-0500/5/248
structural and molecular components of tight junctions significantly more likely to display aberrations in G1/S
[93,94], necessary for cell-cell adhesion. Studies suggest cell-cycle regulatory genes, lack or exhibit low expres-
that loss of tight junctions from down-regulation of sion of ESR1, PGR, and ERBB2 with a decrease in estro-
claudins in various cancers, results in loss of cohesion, gen signaling pathway targets, and display a decrease in
increased invasiveness, and cell dedifferentiation [95]. In the expression of cell-adhesion genes. These factors have
support of these findings, loss or decreased expression been collectively linked with a more aggressive cancer
of CLDN7, which is expressed constitutively during phenotype, resistance to multiple chemotherapeutic
mammary epithelium development [96], has been sig- agents, enhanced metastatic potential, and poorer clin-
nificantly associated with higher histological grade, loss ical outcome, further supporting the hypothesis that
of cellular cohesion, and increased metastasis in breast women of African-American ancestry have ethnic differ-
carcinoma [97,98]. In light of this data, CLDN7 has been ences in gene expression patterns that predisposes them
proposed as a breast cancer tumor-suppressor gene. Like to a highly aggressive and treatment-resistant breast can-
CLDN7, DLC1 is has been considered a tumor suppres- cer phenotype.
sor gene involved in the regulation of the actin cytoskel-
Competing interests
eton, cell polarity, inter-cell focal adhesion, cell The authors declare that they have no competing interests.
migration, and apoptosis [99-101] through negative regu-
lation of Rho signaling pathways [99]. DLC1 is expressed Authors’ contributions
in multiple tissues including the brain, heart, kidney, JMG carried out the data interpretation, participated in the statistical analysis,
and drafted the manuscript. ADS processed the tissue samples, carried out
liver, lung, skin, spleen, and testis [102]. Studies have the gene expression analysis, and participated in drafting the manuscript. QH
found that the mRNA levels of DLC1 are diminished in carried out the statistical analysis and participated in drafting the manuscript.
various cancers [103], including breast, through loss of MRS participated in sample acquisition. SBP participated in the study design
and carried out the patient data acquisition. MRJ and WEG jointly conceived
heterozygosity or heterozygous gene deletions [104]. Fur- and coordinated the study. All authors reviewed and approved of the final
thermore, several studies investigating the role of DLC1 manuscript.
in breast cancer found that forced expression of DLC-1
Acknowledgements
in DLC-1 negative breast cancer cell lines resulted in This study was funded in part by a grant from the Susan G. Komen Breast
growth inhibition, reduction in colony formation, and Cancer Foundation (BCTR0600484), the Breast SPORE (CA089010-09) and the
abolishment of in vivo tumorigenicity [103,105], whereas U54 (CA118948).
downregulation of DLC1 expression enhanced cell motil- Author details
ity and chemotactic behavior [106]. These studies suggest 1
Department of Medicine, Division of Endocrinology, University of Alabama
that loss or reduced expression of CLDN7 and DLC1, as at Birmingham, Birmingham, AL 35294, USA. 2Department of Obstetrics and
Gynecology, University of Alabama at Birmingham, Birmingham, AL 35294,
was observed in tumor specimens from AAW, may lead USA. 3Department of Chemical Engineering, Tuskegee University, Tuskegee,
to increased cell motility, migration, metastasis and de- AL 36088, USA. 4Department of Pathology, University of Alabama at
differentiation, all of which may contribute to the worse Birmingham, Zeigler Research Building, 703 South 19th Street, ZRB 408,
Birmingham, AL 35294, USA. 5Department of Pharmacology and Toxicology,
clinical prognosis observed for AAW. University of Alabama at Birmingham, Birmingham, AL 35294, USA.
The large number of gene expression differences
observed in this study between AAW and CAW patients Received: 1 September 2011 Accepted: 25 April 2012
Published: 22 May 2012
supports that women of African-American decent may
harbor differences in gene expression profiles that pre- References
dispose them to increased tumor grade, a triple negative 1. Society AC: Breast cancer facts and figures: 2009–2010. Atlanta: American
(ER-, PR-, HER2-) phenotype, and worse clinical disease Cancer Society, Inc.; 2009.
2. Society AC: Cancer Fact and Figures for African Americans 2011–2012. Atlanta:
outcome. Future studies are needed to determine if these American Cancer Society; 2011.
gene expression profiles are grade and receptor status 3. Newman LA: Breast cancer in African-American women. Oncologist 2005,
specific or represent other attributing factors to AAW 10(1):1–14.
4. Chen VW, Correa P, Kurman RJ, Wu XC, Eley JW, Austin D, Muss H, Hunter CP,
poorer prognosis. Redmond C, Sobhan M, et al: Histological characteristics of breast carcinoma
in blacks and whites. Canc Epidemiol Biomarkers Prev 1994,
Conclusions 3(2):127–135.
5. Fedewa SA, Edge SB, Stewart AK, Halpern MT, Marlow NM, Ward EM:
The main objective of this study was to identify gene ex- Race and ethnicity are associated with delays in breast cancer
pression differences between AAW and CAW that may treatment (2003–2006). J Health Care Poor Underserved 2011,
contribute to the poor clinical outcome observed for 22(1):128–141.
6. Fedewa SA, Ward EM, Stewart AK, Edge SB: Delays in adjuvant
women of African-American descent. While the small chemotherapy treatment among patients with breast cancer are more
sample size examined in this study is a limiting factor, likely in African American and Hispanic populations: a national cohort
the use of only age- and stage-matched tumor specimens study 2004–2006. J Clin Oncol 2010, 28(27):4135–4141.
7. Freedman RA, Virgo KS, He Y, Pavluck AL, Winer EP, Ward EM, Keating NL:
strengthens findings from this study. This study demon- The association of race/ethnicity, insurance status, and socioeconomic
strated that tumor specimens from AAW were factors with breast cancer care. Cancer 2011, 117(1):180–189.Grunda et al. BMC Research Notes 2012, 5:248 Page 11 of 13
http://www.biomedcentral.com/1756-0500/5/248
8. Gullate M: The influence of spirituality and religiosity on breast cancer 27. Steg A, Vickers SM, Eloubeidi M, Wang W, Eltoum IA, Grizzle WE, Saif MW,
screening delay in African American women: application of the Theory Lobuglio AF, Frost AR, Johnson MR: Hedgehog pathway expression in
of Reasoned Action and Planned Behavior (TRA/TPB). ABNF J 2006, heterogeneous pancreatic adenocarcinoma: implications for the
17(2):89–94. molecular analysis of clinically available biopsies. Diagn Mol Pathol 2007,
9. Wang J, John EM, Horn-Ross PL, Ingles SA: Dietary fat, cooking fat, and 16(4):229–237.
breast cancer risk in a multiethnic population. Nutr Cancer 2008, 60 28. Blanquicett C, Johnson MR, Heslin M, Diasio RB: Housekeeping gene
(4):492–504. variability in normal and carcinomatous colorectal and liver tissues:
10. Newman LA, Griffith KA, Jatoi I, Simon MS, Crowe JP, Colditz GA: applications in pharmacogenomic gene expression studies. Anal Biochem
Meta-analysis of survival in African American and white American 2002, 303(2):209–214.
patients with breast cancer: ethnicity compared with socioeconomic 29. Steg A, Wang W, Blanquicett C, Grunda JM, Eltoum IA, Wang K, Buchsbaum DJ,
status. J Clin Oncol 2006, 24(9):1342–1349. Vickers SM, Russo S, Diasio RB, et al: Multiple gene expression analyses in
11. Newman LA, Mason J, Cote D, Vin Y, Carolin K, Bouwman D, Colditz GA: paraffin-embedded tissues by TaqMan low-density array: Application to
African-American ethnicity, socioeconomic status, and breast cancer hedgehog and Wnt pathway analysis in ovarian endometrioid
survival: a meta-analysis of 14 studies involving over 10,000 African- adenocarcinoma. J Mol Diagn 2006, 8(1):76–83.
American and 40,000 White American patients with carcinoma of the 30. Fisher RA: Statistical Methods for Research Workers.: Oliver and Boyd;
breast. Cancer 2002, 94(11):2844–2854. 1954.
12. Jatoi I, Becher H, Leake CR: Widening disparity in survival between 31. Hallander M, Wolfe D: Nonparametric Statistical Methods. 1999, (2nd).
white and African-American patients with breast carcinoma treated in 32. Bair E, Tibshirani R: Semi-supervised methods to predict patient survival
the U.S. Department of Defense Healthcare system. Cancer 2003, 98 from gene expression data. PLoS Biol 2004, 2(4):E108.
(5):894–899. 33. Mullighan CG, Su X, Zhang J, Radtke I, Phillips LA, Miller CB, Ma J, Liu W,
13. Wojcik BE, Spinks MK, Optenberg SA: Breast carcinoma survival analysis for Cheng C, Schulman BA, et al: Deletion of IKZF1 and prognosis in acute
African American and white women in an equal-access health care lymphoblastic leukemia. N Engl J Med 2009, 360(5):470–480.
system. Cancer 1998, 82(7):1310–1318. 34. Massey F: The Kolmogorov-Smirnov test for goodness of fit. J Am Stat
14. Albain KS, Unger JM, Crowley JJ, Coltman CA Jr, Hershman DL: Racial Assoc 1951, 46(253):68–78.
disparities in cancer survival among randomized clinical trials patients of 35. Johnson R, Wichern D: Applied Multivariate Statistical Analysis.: Prentice-Hall,
the Southwest Oncology Group. J Natl Cancer Inst 2009, 101(14):984–992. Inc; 1982.
15. Carey LA, Perou CM, Livasy CA, Dressler LG, Cowan D, Conway K, Karaca G, 36. Farragher SM, Tanney A, Kennedy RD, Paul Harkin D: RNA expression
Troester MA, Tse CK, Edmiston S, et al: Race, breast cancer subtypes, and analysis from formalin fixed paraffin embedded tissues. Histochem Cell
survival in the Carolina Breast Cancer Study. JAMA 2006, Biol 2008, 130(3):435–445.
295(21):2492–2502. 37. Klopfleisch R, Weiss AT, Gruber AD: Excavation of a buried treasure–DNA,
16. Nielsen TO, Hsu FD, Jensen K, Cheang M, Karaca G, Hu Z, Hernandez- mRNA, miRNA and protein analysis in formalin fixed, paraffin embedded
Boussard T, Livasy C, Cowan D, Dressler L, et al: Immunohistochemical and tissues. Histol Histopathol 2011, 26(6):797–810.
clinical characterization of the basal-like subtype of invasive breast 38. Grunda JM, Nabors LB, Palmer CA, Chhieng DC, Steg A, Mikkelsen T, Diasio RB,
carcinoma. Clin Cancer Res 2004, 10(16):5367–5374. Zhang K, Allison D, Grizzle WE, et al: Increased expression of thymidylate
17. Amend K, Hicks D, Ambrosone CB: Breast cancer in African-American synthetase (TS), ubiquitin specific protease 10 (USP10) and survivin is
women: differences in tumor biology from European-American women. associated with poor survival in glioblastoma multiforme (GBM).
Cancer Res 2006, 66(17):8327–8330. J Neurooncol 2006, 80(3):261–274.
18. Ihemelandu CU, Leffall LD Jr, Dewitty RL, Naab TJ, Mezghebe HM, Makambi KH, 39. Porter PL, Malone KE, Heagerty PJ, Alexander GM, Gatti LA, Firpo EJ, Daling JR,
Adams-Campbell L, Frederick WA: Molecular breast cancer subtypes in Roberts JM: Expression of cell-cycle regulators p27Kip1 and cyclin E, alone
premenopausal African-American women, tumor biologic factors and and in combination, correlate with survival in young breast cancer
clinical outcome. Ann Surg Oncol 2007, 14(10):2994–3003. patients. Nat Med 1997, 3(2):222–225.
19. Porter PL, Garcia R, Moe R, Corwin DJ, Gown AM: C-erbB-2 oncogene 40. Catzavelos C, Bhattacharya N, Ung YC, Wilson JA, Roncari L, Sandhu C, Shaw P,
protein in in situ and invasive lobular breast neoplasia. Cancer 1991, Yeger H, Morava-Protzner I, Kapusta L, et al: Decreased levels of the cell-cycle
68(2):331–334. inhibitor p27Kip1 protein: prognostic implications in primary breast cancer.
20. Porter PL, Lund MJ, Lin MG, Yuan X, Liff JM, Flagg EW, Coates RJ, Eley JW: Nat Med 1997, 3(2):227–230.
Racial differences in the expression of cell cycle-regulatory proteins in 41. Gorgoulis VG, Koutroumbi EN, Kotsinas A, Zacharatos P, Markopoulos C,
breast carcinoma. Cancer 2004, 100(12):2533–2542. Giannikos L, Kyriakou V, Voulgaris Z, Gogas I, Kittas C: Alterations of p16-
21. Rakha EA, Abd El Rehim D, Pinder SE, Lewis SA, Ellis IO: E-cadherin pRb pathway and chromosome locus 9p21-22 in sporadic invasive
expression in invasive non-lobular carcinoma of the breast breast carcinomas. Mol Med 1998, 4(12):807–822.
and its prognostic significance. Histopathology 2005, 46(6):685–693. 42. Han S, Ahn SH, Park K, Bae BN, Kim KH, Kim HJ, Kim YD, Kim HY: P16INK4a
22. Lund MJ, Trivers KF, Porter PL, Coates RJ, Leyland-Jones B, Brawley OW, protein expression is associated with poor survival of the breast cancer
Flagg EW, O’Regan RM, Gabram SG, Eley JW: Race and triple negative patients after CMF chemotherapy. Breast Cancer Res Treat 2001,
threats to breast cancer survival: a population-based study in Atlanta, 70(3):205–212.
GA. Breast Cancer Res Treat 2009, 113(2):357–370. 43. Milde-Langosch K, Bamberger AM, Rieck G, Kelp B, Loning T:
23. Hall MJ, Reid JE, Burbidge LA, Pruss D, Deffenbaugh AM, Frye C, Wenstrup Overexpression of the p16 cell cycle inhibitor in breast cancer is
RJ, Ward BE, Scholl TA, Noll WW: BRCA1 and BRCA2 mutations in women associated with a more malignant phenotype. Breast Cancer Res Treat
of different ethnicities undergoing testing for hereditary breast-ovarian 2001, 67(1):61–70.
cancer. Cancer 2009, 115(10):2222–2233. 44. Steeg PS, Zhou Q: Cyclins and breast cancer. Breast Cancer Res Treat 1998,
24. Field LA, Love B, Deyarmin B, Hooke JA: Shriver CD. Ellsworth RE: 52(1–3):17–28.
Identification of differentially expressed genes in breast tumors from African 45. Satyanarayana A, Kaldis P: Mammalian cell-cycle regulation: several Cdks,
American compared with Caucasian women. Cancer; 2011. numerous cyclins and diverse compensatory mechanisms. Oncogene
25. Hammond ME, Hayes DF, Dowsett M, Allred DC, Hagerty KL, Badve S, 2009, 28(33):2925–2939.
Fitzgibbons PL, Francis G, Goldstein NS, Hayes M, et al: American Society of 46. Michalides R, Hageman P, van Tinteren H, Houben L, Wientjens E,
Clinical Oncology/College of American Pathologists guideline Klompmaker R, Peterse J: A clinicopathological study on overexpression
recommendations for immunohistochemical testing of estrogen and of cyclin D1 and of p53 in a series of 248 patients with operable breast
progesterone receptors in breast cancer. Arch Pathol Lab Med 2010, cancer. Br J Cancer 1996, 73(6):728–734.
134(6):907–922. 47. Christov K, Ikui A, Shilkaitis A, Green A, Yao R, You M, Grubbs C, Steele V,
26. Vance GH, Barry TS, Bloom KJ, Fitzgibbons PL, Hicks DG, Jenkins RB, Persons DL, Lubet R, Weinstein IB: Cell proliferation, apoptosis, and
Tubbs RR, Hammond ME: Genetic heterogeneity in HER2 testing in breast expression of cyclin D1 and cyclin E as potential biomarkers in
cancer: panel summary and guidelines. Arch Pathol Lab Med 2009, tamoxifen-treated mammary tumors. Breast Cancer Res Treat 2003,
133(4):611–612. 77(3):253–264.Grunda et al. BMC Research Notes 2012, 5:248 Page 12 of 13
http://www.biomedcentral.com/1756-0500/5/248
48. Nielsen NH, Loden M, Cajander J, Emdin SO, Landberg G: G1-S transition associated with breast cancer progression by gene expression analysis
defects occur in most breast cancers and predict outcome. Breast Cancer of predefined sets of neoplastic tissues. Int J Canc J Int du cancer 2008,
Res Treat 1999, 56(2):105–112. 123(6):1327–1338.
49. Dublin EA, Patel NK, Gillett CE, Smith P, Peters G, Barnes DM: 69. Yamamura J, Miyoshi Y, Tamaki Y, Taguchi T, Iwao K, Monden M, Kato K,
Retinoblastoma and p16 proteins in mammary carcinoma: their Noguchi S: mRNA expression level of estrogen-inducible gene, alpha 1-
relationship to cyclin D1 and histopathological parameters. Int J Cancer antichymotrypsin, is a predictor of early tumor recurrence in patients
1998, 79(1):71–75. with invasive breast cancers. Cancer Sci 2004, 95(11):887–892.
50. Chlebowski RT, Chen Z, Anderson GL, Rohan T, Aragaki A, Lane D, Dolan NC, 70. Bouras T, Southey MC, Chang AC, Reddel RR, Willhite D, Glynne R,
Paskett ED, McTiernan A, Hubbell FA, et al: Ethnicity and breast cancer: Henderson MA, Armes JE, Venter DJ: Stanniocalcin 2 is an estrogen-
factors influencing differences in incidence and outcome. J Natl Cancer Inst responsive gene coexpressed with the estrogen receptor in human
2005, 97(6):439–448. breast cancer. Canc Res 2002, 62(5):1289–1295.
51. Joslyn SA: Hormone receptors in breast cancer: racial differences in 71. Michels KM, Lee WH, Seltzer A, Saavedra JM, Bondy CA: Up-regulation of
distribution and survival. Breast Cancer Res Treat 2002, 73(1):45–59. pituitary [125I]insulin-like growth factor-I (IGF-I) binding and IGF binding
52. Elledge RM, Clark GM, Chamness GC, Osborne CK: Tumor biologic factors protein-2 and IGF-I gene expression by estrogen. Endocrinology 1993,
and breast cancer prognosis among white, Hispanic, and black women 132(1):23–29.
in the United States. J Natl Cancer Inst 1994, 86(9):705–712. 72. Rooman RP, De Beeck LO, Martin M, Van Doorn J, Mohan S, Du Caju MV:
53. Chu KC, Anderson WF, Fritz A, Ries LA, Brawley OW: Frequency IGF-I, IGF-II, ‘free’ IGF-I and IGF-binding proteins-2 to −6 during high-
distributions of breast cancer characteristics classified by estrogen dose oestrogen treatment in constitutionally tall girls. Eur J Endocrinol
receptor and progesterone receptor status for eight racial/ethnic groups. 2002, 146(6):823–829.
Cancer 2001, 92(1):37–45. 73. Wilson CL, Sims AH, Howell A, Miller CJ, Clarke RB: Effects of oestrogen on
54. Callahan R, Hurvitz S: Human epidermal growth factor receptor-2-positive gene expression in epithelium and stroma of normal human breast
breast cancer: Current management of early, advanced, and recurrent tissue. Endocrine-related cancer 2006, 13(2):617–628.
disease. Curr Opin Obstet Gynecol 2011, 23(1):37–43.
74. Graham JD, Roman SD, McGowan E, Sutherland RL, Clarke CL: Preferential
55. Campiglio M, Bufalino R, Sandri M, Ferri E, Aiello RA, De Matteis A,
stimulation of human progesterone receptor B expression by estrogen in T-
Mottolese M, De Placido S, Querzoli P, Jirillo A, et al: Increased overall
47D human breast cancer cells. J Biol Chem 1995, 270(51):30693–30700.
survival independent of RECIST response in metastatic breast cancer
75. Kastner P, Krust A, Turcotte B, Stropp U, Tora L, Gronemeyer H, Chambon P:
patients continuing trastuzumab treatment: evidence from a
Two distinct estrogen-regulated promoters generate transcripts
retrospective study. Breast Cancer Res Treat 2011, 128(1):147–154.
encoding the two functionally different human progesterone receptor
56. Burris HA: Trastuzumab emtansine: a novel antibody-drug conjugate for
forms A and B. Embo J 1990, 9(5):1603–1614.
HER2-positive breast cancer. Expert Opin Biol Ther 2011, 11(6):807–819.
76. Saucedo R, Basurto L, Zarate A, Martinez C, Hernandez M, Galvan R: Effect
57. Tozlu S, Girault I, Vacher S, Vendrell J, Andrieu C, Spyratos F, Cohen P,
of estrogen therapy on insulin resistance and plasminogen activator
Lidereau R, Bieche I: Identification of novel genes that co-cluster with
inhibitor type 1 concentrations in postmenopausal women. Gynecol
estrogen receptor alpha in breast tumor biopsy specimens, using a
Obstet Invest 2007, 64(2):61–64.
large-scale real-time reverse transcription-PCR approach. Endocr Relat
77. Adams DJ, Hajj H, Edwards DP, Bjercke RJ, McGuire WL: Detection of a Mr
Cancer 2006, 13(4):1109–1120.
24,000 estrogen-regulated protein in human breast cancer by
58. Wilson BJ, Giguere V: Meta-analysis of human cancer microarrays reveals
monoclonal antibodies. Can Res 1983, 43(9):4297–4301.
GATA3 is integral to the estrogen receptor alpha pathway. Mol Cancer
78. Andersen J, Skovbon H, Poulsen HS: Immunocytochemical determination of
2008, 7:49.
the estrogen-regulated protein Mr 24,000 in primary breast cancer and
59. Kallel-Bayoudh I, Hassen HB, Khabir A, Boujelbene N, Daoud J, Frikha M,
response to endocrine therapy. Eur J Cancer Clin Oncol 1989, 25(4):641–643.
Sallemi-Boudawara T, Aifa S, Rebai A: Bcl-2 expression and triple negative
79. Ciocca DR, Adams DJ, Edwards DP, Bjercke RJ, McGuire WL: Estrogen-
profile in breast carcinoma. Med Oncol 2010, 28(Suppl 1):S55–S61.
induced 24 K protein in MCF-7 breast cancer cells is localized in
60. Spyratos F, Andrieu C, Vidaud D, Briffod M, Vidaud M, Lidereau R, Bieche I:
granules. Breast Canc Res Treat 1984, 4(4):261–268.
CCND1 mRNA overexpression is highly related to estrogen receptor
80. Kroll J, Briand P: Estrogen-dependent release of serum proteins from
positivity but not to proliferative markers in primary breast cancer. Int J
MCF-7 breast carcinoma cells in vitro. Anticancer Res 1988, 8(1):89–91.
Biol Markers 2000, 15(3):210–214.
81. Massot O, Baskevitch PP, Capony F, Garcia M, Rochefort H: Estradiol
61. Marconett CN, Sundar SN, Poindexter KM, Stueve TR, Bjeldanes LF, Firestone
increases the production of alpha 1-antichymotrypsin in MCF7 and T47D
GL: Indole-3-carbinol triggers aryl hydrocarbon receptor-dependent
human breast cancer cell lines. Mol Cell Endocrinol 1985, 42(3):207–214.
estrogen receptor (ER)alpha protein degradation in breast cancer cells
82. Dawson SJ, Makretsov N, Blows FM, Driver KE, Provenzano E, Le Quesne J,
disrupting an ERalpha-GATA3 transcriptional cross-regulatory loop. Mol
Baglietto L, Severi G, Giles GG, McLean CA, et al: BCL2 in breast cancer: a
Biol Cell 2010, 21(7):1166–1177.
favourable prognostic marker across molecular subtypes and independent of
62. Mehra R, Varambally S, Ding L, Shen R, Sabel MS, Ghosh D, Chinnaiyan AM,
adjuvant therapy received. Brit J Canc 2010, 103(5):668–675.
Kleer CG: Identification of GATA3 as a breast cancer prognostic marker by
83. Nadler Y, Camp RL, Giltnane JM, Moeder C, Rimm DL, Kluger HM, Kluger Y:
global gene expression meta-analysis. Canc Res 2005, 65(24):11259–11264.
Expression patterns and prognostic value of Bag-1 and Bcl-2 in breast
63. Rakha EA, Boyce RW, Abd El-Rehim D, Kurien T, Green AR, Paish EC,
cancer. Breast Canc Res 2008, 10(2):R35.
Robertson JF, Ellis IO: Expression of mucins (MUC1, MUC2, MUC3, MUC4,
84. Gillett C, Smith P, Gregory W, Richards M, Millis R, Peters G, Barnes D: Cyclin
MUC5AC and MUC6) and their prognostic significance in human breast
D1 and prognosis in human breast cancer. Int J Cancer 1996, 69(2):92–99.
cancer. Mod Pathol 2005, 18(10):1295–1304.
64. Wei X, Xu H, Kufe D: MUC1 oncoprotein stabilizes and activates estrogen 85. Oh DS, Troester MA, Usary J, Hu Z, He X, Fan C, Wu J, Carey LA, Perou CM:
receptor alpha. Mol Cell 2006, 21(2):295–305. Estrogen-regulated genes predict survival in hormone receptor-positive
65. Napieralski R, Brunner N, Mengele K, Schmitt M: Emerging biomarkers in breast cancers. J Clin Oncol: Official Journal of the American Society of
breast cancer care. Biomark Med 2010, 4(4):505–522. Clinical Oncology 2006, 24(11):1656–1664.
66. Minisini AM, Fabbro D, Di Loreto C, Pestrin M, Russo S, Cardellino GG, 86. Yoon NK, Maresh EL, Shen D, Elshimali Y, Apple S, Horvath S, Mah V, Bose S,
Andreetta C, Damante G, Puglisi F: Markers of the uPA system and Chia D, Chang HR, et al: Higher levels of GATA3 predict better survival in
common prognostic factors in breast cancer. Am J Clin Pathol 2007, women with breast cancer. Hum Pathol 2010, 41(12):1794–1801.
128(1):112–117. 87. Karczewska A, Nawrocki S, Breborowicz D, Filas V, Mackiewicz A: Expression
67. Smith LH, Coats SR, Qin H, Petrie MS, Covington JW, Su M, Eren M, Vaughan DE: of interleukin-6, interleukin-6 receptor, and glycoprotein 130 correlates
Differential and opposing regulation of PAI-1 promoter activity by estrogen with good prognoses for patients with breast carcinoma. Cancer 2000,
receptor alpha and estrogen receptor beta in endothelial cells. Circ Res 2004, 88(9):2061–2071.
95(3):269–275. 88. Tjensvoll K, Oltedal S, Farmen RK, Shammas FV, Heikkila R, Kvaloy JT, Gilje B,
68. Cimino D, Fuso L, Sfiligoi C, Biglia N, Ponzone R, Maggiorotto F, Russo G, Smaaland R, Nordgard O: Disseminated tumor cells in bone marrow
Cicatiello L, Weisz A, Taverna D, et al: Identification of new genes assessed by TWIST1, cytokeratin 19, and mammaglobin A mRNA predictYou can also read