Huntington's disease-specific mis-splicing unveils key effector genes and altered splicing factors
←
→
Page content transcription
If your browser does not render page correctly, please read the page content below
doi:10.1093/brain/awab087                                                                                   BRAIN 2021: 144; 2009–2023             | 2009

Huntington’s disease-specific mis-splicing
unveils key effector genes and altered
splicing factors

                                                                                                                                                               Downloaded from https://academic.oup.com/brain/article/144/7/2009/6174115 by guest on 29 November 2021
Ainara Elorza,1,2 Yamile Márquez,3 Jorge R. Cabrera,1,2
 José Luis Sánchez-Trincado,1,2 Marı́a Santos-Galindo,1,2 Ivó H. Hernández,1,2,4
Sara Picó,1,2 Juan I. Dı́az-Hernández,1,2 Ramón Garcı́a-Escudero,5,6,7
Manuel Irimia3,8,9 and José J. Lucas1,2

Correction of mis-splicing events is a growing therapeutic approach for neurological diseases such as spinal
muscular atrophy or neuronal ceroid lipofuscinosis 7, which are caused by splicing-affecting mutations. Mis-spliced
effector genes that do not harbour mutations are also good candidate therapeutic targets in diseases with more com-
plex aetiologies such as cancer, autism, muscular dystrophies or neurodegenerative diseases. Next-generation RNA
sequencing (RNA-seq) has boosted investigation of global mis-splicing in diseased tissue to identify such key patho-
genic mis-spliced genes. Nevertheless, while analysis of tumour or dystrophic muscle biopsies can be informative on
early stage pathogenic mis-splicing, for neurodegenerative diseases, these analyses are intrinsically hampered by
neuronal loss and neuroinflammation in post-mortem brains.
To infer splicing alterations relevant to Huntington’s disease pathogenesis, here we performed intersect-RNA-seq
analyses of human post-mortem striatal tissue and of an early symptomatic mouse model in which neuronal loss
and gliosis are not yet present.
Together with a human/mouse parallel motif scan analysis, this approach allowed us to identify the shared mis-
splicing signature triggered by the Huntington’s disease-causing mutation in both species and to infer upstream
deregulated splicing factors. Moreover, we identified a plethora of downstream neurodegeneration-linked mis-
spliced effector genes that—together with the deregulated splicing factors—become new possible therapeutic targets.
In summary, here we report pathogenic global mis-splicing in Huntington’s disease striatum captured by our new
intersect-RNA-seq approach that can be readily applied to other neurodegenerative diseases for which bona fide ani-
mal models are available.

1 Center for Molecular Biology ‘Severo Ochoa’ (CBMSO) CSIC/UAM, Madrid 28049, Spain
2 Networking Research Center on Neurodegenerative Diseases (CIBERNED), Instituto de Salud Carlos III, Madrid 28031,
  Spain
3 Centre for Genomic Regulation (CRG), Barcelona Institute for Science and Technology, 08003 Barcelona, Spain
4 Departamento de Biologı́a, Facultad de Ciencias, Universidad Autónoma de Madrid, Madrid 28049, Spain
5 Molecular Oncology Unit, CIEMAT, Madrid 28040, Spain
6 Biomedical Research Institute i + 12, Hospital 12 de Octubre, Madrid 28041, Spain
7 Centro de Investigación Biomédica en Red de Cáncer (CIBERONC), Instituto de Salud Carlos III, Madrid 28029, Spain
8 Universitat Pompeu Fabra, 08003, Barcelona, Spain
9 ICREA, Barcelona, Spain

Received June 22, 2020. Revised December 21, 2020. Accepted December 24, 2020. Advance access publication March 16, 2021
C The Author(s) (2021). Published by Oxford University Press on behalf of the Guarantors of Brain.
V
This is an Open Access article distributed under the terms of the Creative Commons Attribution Non-Commercial License (http://creativecommons.org/licenses/
by-nc/4.0/), which permits non-commercial re-use, distribution, and reproduction in any medium, provided the original work is properly cited. For commercial
re-use, please contact journals.permissions@oup.com
2010    | BRAIN 2021: 144; 2009–2023                                                                                           A. Elorza et al.

Correspondence to: José J. Lucas
Center for Molecular Biology ‘Severo Ochoa’ (CBMSO)
C/Nicolás Cabrera, 1. Campus UAM de Cantoblanco
28049 Madrid, Spain
E-mail: jjlucas@cbm.csic.es

Correspondence may also be addressed to: Manuel Irimia
Centre for Genomic Regulation (CRG)
C/Dr. Aiguader, 88, 08003 Barcelona, Spain
E-mail: manuel.irimia@crg.eu

Keywords: RNA-sequencing (RNA-seq); Huntington’s disease; splicing; RNA-binding proteins (RBP); splicing factors
Abbreviation: RBP = RNA binding protein

                                                                                                                                                    Downloaded from https://academic.oup.com/brain/article/144/7/2009/6174115 by guest on 29 November 2021
Introduction                                                                highly validated Huntington’s disease transgenic mouse model at
                                                                            an early disease stage, in which motor symptoms are due to circuit
Alternative splicing of pre-mRNA is the differential processing of          dysfunction prior to appearance of neuronal loss and gliosis.
introns and exons to generate multiple transcript isoforms from indi-       Intersection of both analyses yielded a shared mis-splicing signa-
vidual genes, thereby increasing molecular diversity. However, when         ture triggered by the Huntington’s disease-causing mutation in
it is not properly executed, alternative splicing leads to mis-splicing,    striatum of both species (Fig. 1). Characterization of this signature
which may result in proteins with altered function and stability.1 A        allowed us to infer a network of upstream splicing factors deregu-
number of splicing factors and other RNA-binding proteins (RBPs) are        lated in both species and to identify a plethora of downstream
responsible for proper regulation of alternative splicing,2 and growing     neurodegeneration-linked effector genes whose aberrant splicing
evidence has implicated mis-splicing in a range of pathologies such as      led us to corroborate their decreased protein levels in Huntington’s
cancer,3 muscular dystrophies,4 autism5,6 and neurodegenerative dis-        disease striatum.
eases7 such as Alzheimer’s disease,8,9 amyotrophic lateral sclerosis10,11
and Huntington’s disease.12–15 Next-generation RNA sequencing
(RNA-seq) has boosted investigation of global mis-splicing in diseased      Materials and methods
tissue. Nevertheless, while analysis of tumour or dystrophic muscle
                                                                            Human brain tissue samples
biopsies can be informative on early stage pathogenic mis-splicing,
RNA-seq studies of neurodegenerative diseases using post-mortem             Brain specimens used in this study from striatum of Huntington’s
brains are confounded by the dramatically altered cellular compos-          disease patients and controls were provided by Institute of
ition in end-state disease tissue due to neuronal loss and increased        Neuropathology Brain Bank (HUB-ICO-IDIBELL, Hospitalet de
gliosis, the latter besides leading to a chronic inflammatory status.       Llobregat, Spain), the Neurological Tissue Bank of the IDIBAPS
These caveats make it difficult to identify the causative molecular         Biobank (Barcelona, Spain), the Banco de Tejidos Fundación Cien
alterations that may serve as bases for therapeutic approaches.             (BT-CIEN, Madrid, Spain) and the Netherlands Brain Bank
     Huntington’s disease is a devastating neurological disorder            (Amsterdam, The Netherlands). Written informed consent for
characterized by prominent motor symptoms and marked atrophy                brain removal after death for diagnostic and research purposes
of the nucleus striatum.16 Huntington’s disease is caused by a              was obtained from brain donors and/or next of kin. Procedures, in-
polyglutamine (polyQ)-encoding CAG repeat expansion in the hun-             formation and consent forms have been approved by the Bioethics
tingtin (HTT) gene.17 Similar pathogenic CAG mutations in differ-           Subcommittee of Consejo Superior de Investigaciones Cientı́ficas
ent genes cause multiple dominant spinocerebellar ataxias (SCAs),           (CSIC, Madrid, Spain). The post-mortem interval in tissue process-
including SCA-1, -2, -3, -6, -7 and -1718 and there is evidence of tox-     ing was between 05:00 and 07:45 for RNA-seq analysis and be-
icity being mediated by both the expanded CAG-containing                    tween 05:00 and 23:30 for western blot analyses. Neuropathological
mRNAs and the polyQ-containing proteins.19,20 The proteins that             examination in the Huntington’s disease cases revealed a diagno-
interact with expanded CAG mRNA include splicing factors such               sis of Huntington’s disease grade 3–4 following Vonsattel’s crite-
as MBNL1,21 U2AF222 and SRSF6,15,23 the latter being also seques-           ria.24 The characteristics of the donors for the samples used in the
tered into the characteristic polyQ inclusion bodies found in               RNA-seq analysis are provided in Supplementary Table 1.
Huntington’s disease brains.12 All this has led to the proposal that
splicing alterations may, at least in part, underlie Huntington’s
                                                                            Mice
disease.12–15 In fact, hypothesis-driven studies have identified two
mis-splicing events in the aetiology of Huntington’s disease.               Different previously reported mouse models were used: R6/1 trans-
Namely, a retained intron in the HTT gene giving rise to a highly           genic mice for the human exon-1-Htt gene25 in B6CBAF1 back-
toxic exon 1-encoded N-terminal truncated form of mutant Htt,14             ground, and heterozygous knock-in of an expanded CAG repeat in
and elevated inclusion of tau (MAPT) exon 10, leading to a patho-           exon 1 of the huntingtin gene, zQ175 mice26 in C57BL/6J back-
genic increase in tau isoforms with four tubulin binding repeats            ground. All mice were bred and housed at the Centro de Biologı́a
(4R-tau).12 However, analysis of global mis-splicing in striatum of         Molecular Severo Ochoa animal facility. Mean CAG repeat length
patients with Huntington’s disease is missing due to the limita-            of R6/1 mice in our colony was determined as in Mangiarini et al.25
tions imposed by the altered cellular composition in post-mortem            and corresponds to 185 repeats. Mice were housed four per cage
samples discussed above.                                                    with food and water available ad libitum and maintained in a tem-
     To investigate mis-splicing patterns potentially relevant to the       perature-controlled environment on a 12/12-h light-dark cycle
onset of Huntington’s disease, here we performed at par RNA-seq             with light onset at 08:00. Animal housing and maintenance proto-
analyses of striatum of Huntington’s disease patients and of a              cols followed the guidelines of Council of Europe Convention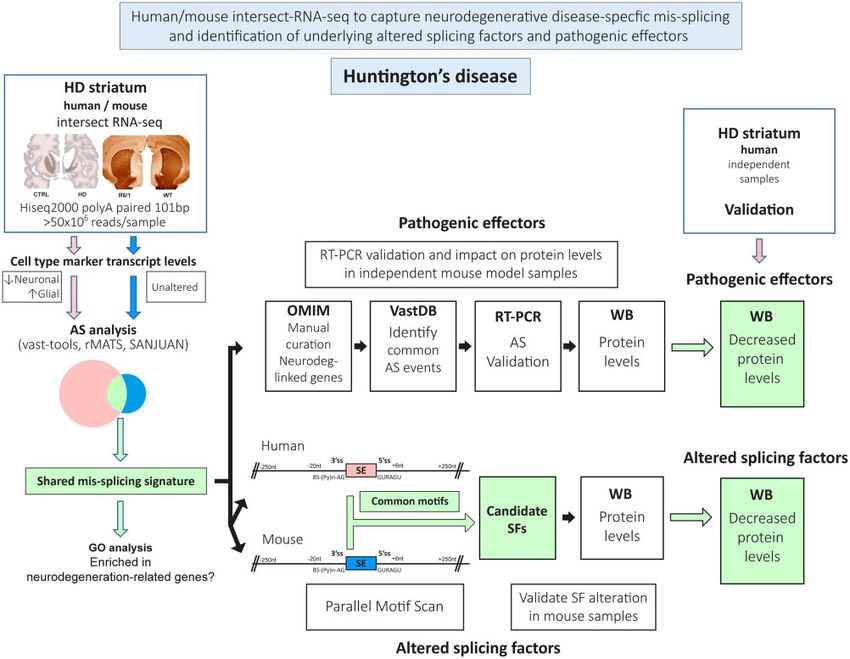
Huntington disease striatal mis-splicing                                                             BRAIN 2021: 144; 2009–2023           | 2011

                                                                                                                                                      Downloaded from https://academic.oup.com/brain/article/144/7/2009/6174115 by guest on 29 November 2021
Figure 1 Workflow of the technical approach. Steps for human/mouse intersect-RNA-seq analysis of neurodegenerative disease-specific mis-splicing
and identification of underlying altered splicing factors (SF) and pathogenic effectors. AS = alternative splicing; HD = Huntington’s disease; WB =
western blot.

ETS123. Animal experiments were performed under protocols                   stored at –80 C until use. Mouse sagittal and coronal sections (30-
(PROEX293/15) approved by the Centro de Biologı́a Molecular                 mm thick) were sequentially cut on a cryostat (Thermo Scientific),
Severo Ochoa Institutional Animal Care and Utilization Committee            collected and stored free floating in glycol-containing solution
(Comité de Ética de Experimentación Animal del CBM, CEEA-CBM),           (30% glycerol, 30% ethylene glycol in 0.02 M phosphate buffer) at
Madrid, Spain.                                                              –20 C.

Rotarod test                                                                Immunohistochemistry and immunofluorescence
Motor coordination was assessed with an accelerating rotarod ap-            Sections were first washed in PBS and then immersed in 0.3% H2O2
paratus (Ugo Basile). Mice were trained during two consecutive              in phosphate-buffered saline (PBS) for 45 min to quench endogen-
days, the first day: four trials at fixed 4 rpm for 1-min each, the se-     ous peroxidase activity. After PBS washes, sections were immersed
cond day: four trials for 2 min (the first minute at 4 rpm and the se-      for 1 h in blocking solution [PBS containing 0.5% foetal bovine
cond minute at 8 rpm). On the third day rotarod was set to
                                                                            serum (FBS), 0.3% TritonTM X-100 and 1% bovine serum albumin
accelerate from 4 to 40 rpm over 5 min and mice were tested in
                                                                            (BSA)] and incubated overnight at 4 C with anti-DARPP32 (1:5000,
four trials. The latency to fall from the rotarod was measured as a
                                                                            Chemicon, AB1656), anti-IBA1 (1:500, Wako, 019-19741), anti-
mean of the four accelerating trials.
                                                                            HNRNPC (1:1000, Abcam, ab10294) or anti-TIA1 (1:1000, Abcam,
                                                                            ab40693) diluted in blocking solution. After washing, brain sections
Tissue preparation for staining                                             were incubated first with biotinylated goat anti-rabbit or anti-
Wild-type and R6/1 mice euthanasia was performed using CO2.                 mouse secondary antibody and then with avidin-biotin complex
Brains were quickly extracted and the left hemisphere immersed              using the Elite Vectastain kit (Vector Laboratories, PK-6101 and
in 4% paraformaldehyde overnight. After profuse washing in PBS,             PK-6102). Chromogen reactions were performed with diaminoben-
hemispheres were immersed in sucrose 30% in PBS for at least 72 h           zidine (SIGMAFASTTM DAB, Sigma, D4293) for 10 min. Mouse sec-
                                                                                                                                                  R
and then included in OCT (Optimum Cutting Temperature com-                  tions were mounted on glass slides and coverslipped with MowiolV
pound, Tissue-Tek, Sakura Finetek Europe, ref. 4583), frozen and            (Calbiochem, Cat. 475904). Images were captured using an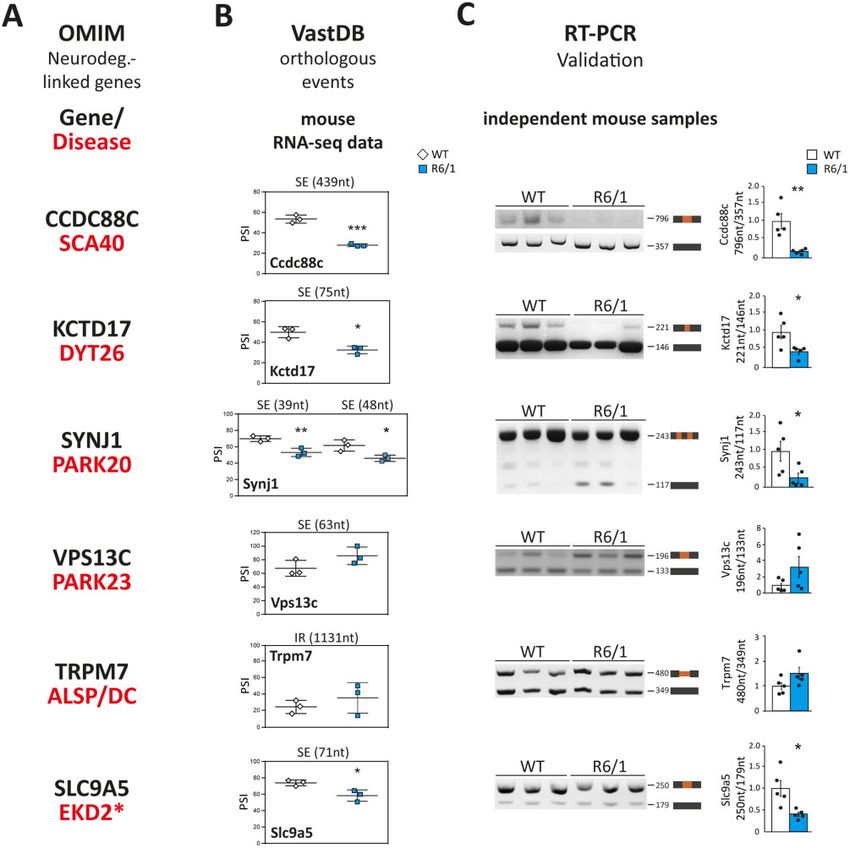
2012    | BRAIN 2021: 144; 2009–2023                                                                                               A. Elorza et al.

Olympus BX41 microscope with an Olympus camera DP-70                   analysis, base calling and quality scoring of the run were proc-
(Olympus Denmark A/S).                                                 essed using the manufacturer’s software Real Time Analysis (RTA
    For immunofluorescence, mouse sections were washed in PBS          2.7.7).
and pretreated with 0.1% TritonTM X-100 for 30 min, 1 M glycine for
15 min and blocking solution (1% BSA, 0.3% FBS and 0.1% TritonTM
                                                                       RNA-sequencing analysis
X-100) for 1 h. Sections were then incubated overnight at 4 C with
rabbit anti-TIA1 (1:300) and mouse anti-huntingtin (1:300, EM48        Differentially expressed genes between the biological groups were
Millipore, MAB5374) in blocking solution. After washing in PBS,        analysed using vast-tools v2.1.0 compare_expr with default
sections were incubated with anti-rabbit DyLightTM 488 (1:500,         parameters28 and Salmon software29 (version 1.2.1 and Ensembl
Vector Laboratories, DI-1088) and anti-mouse Alexa 555 (1:500,         versions GRCh38.100 and GRCm38.100 for the alignment of fastq
Thermo Fisher, A-31570) for 1 h. Nuclei were counterstained with       files with salmon command quant), followed by R packages txim-
DAPI (1:4000, Calbiochem). Finally, sections were mounted on glass     port30 and DESeq231 (Supplementary Tables 2 and 3). To verify cor-
                                  R
slides, coverslipped with MowiolV (Calbiochem, 475904) and main-       rect clustering according to genotype, hierarchical clustering of
tained at 4 C. Images were acquired with a laser confocal A1R sys-    corrected reads (per mappability) per kilobase million (cRPKM) ex-

                                                                                                                                                       Downloaded from https://academic.oup.com/brain/article/144/7/2009/6174115 by guest on 29 November 2021
tem coupled to the invert Eclipse Ti-E microscope (Nikon). Images      pression values obtained with vast-tools was performed using
were processed using ImageJ 1.47v.                                     ‘hclust’ and ‘heatmap.2’ R packages over significantly changed
                                                                       genes in Huntington’s disease versus control and R6/1 versus wild-
                                                                       type mice (Benjamini-Hochberg correction method). Cell-type
Striatal volumetry
                                                                       marker genes of neurons, astrocytes, oligodendrocytes and micro-
Coronal sections (30-mm thick) were cut on a cryostat and every        glia as described previously32,33 (Supplementary Table 4) and those
sixth section was counterstained with toluidine blue pH 4.0 (1 g/l     of specific striatal cell types: direct pathway spiny neurons
Toluidine Blue, Sigma, 198161 in 0.8 M glacial acetic acid). Digital   (dSPNs), indirect pathway spiny neurons (iSPNs), astrocytes and
images were captured at 2.5 magnification (Canon EOS 450 D            microglia described in Merienne et al.,34 were analysed by calculat-
digital camera) and striatal areas from 19–22 sections for each ani-   ing for each cell type the geometric mean of their cRPKM values
mal were calculated by using ImageJ software.27 Considering a sep-     (vast-tools analysis) or normalized counts (Salmon analysis), re-
aration of 180 lm between each section, total structure volume in      spectively, excluding those genes with null values in at least one
each mouse was calculated.
                                                                       sample. Data were plotted and analysed using GraphPad software
                                                                       (La Jolla, CA, USA).
Stereology                                                                 To identify differential alternative splicing events between the
Coronal sections (30-lm thick) counterstained with toluidine blue      two sample groups per species we used three complementary
pH 4.0 [1 g/l Toluidine Blue (Sigma, 198161), 0.8 M glacial acetic     software:
acid] from the volumetric analysis were used. Sections containing       (i) vast-tools v1.1.0, using human (hg19; vastdb.hsa.13.11.15) or mouse
striatum were selected and the 15 most central sections were ana-          (mm9; vastdb.mmu.13.11.15) junction libraries for the align and combine
lysed. One randomly selected 60 mm  60 mm optical dissector at            modules.28 Differential splicing analysis was done using the module
60 magnification with an Olympus BX41 microscope with an                  compare with default parameters (jDPSIj 5 15 and a minimum DPSI of 5
Olympus camera DP-70 (Olympus Denmark A/S) was analysed in                 in the same direction among all replicates; PSI, per cent spliced in).
each section. Total neuronal cell number per dissector was             (ii) rMATS, v3.0.8,35 utilizing TopHat228 to align fastq reads against the
assessed by a researcher blind to genotype. Striatal neuronal cell         GRCh38.p2 (dec. 2014) and GRCm38.p3 (jan. 2012) genomes together with
density was calculated and compared for wild-type (n = 3) and R6/1         a custom splice-junction library. For differential splicing analyses, de-
mice (n = 3).                                                              fault parameters were used (FDR 5 5%).
                                                                       (iii) SANJUAN v1.0-beta, which detects de novo splicing junctions and alter-
RNA sequencing                                                             native   splicing   events    (https://github.com/ppapasaikas/SANJUAN;
                                              R                            accessed November 2016). For differential splicing analyses, medium
Total RNA was isolated using the MaxwellV 16 LEV simplyRNA
                                                         R                 confidence level of constraints on differential splicing junctions was
Tissue Kit (Promega, AS1280) and quantified by QubitV RNA BR
                                                                           used. The combined result of all tools is shown in Supplementary Tables
Assay kit (Thermo Fisher Scientific) and the RNA integrity number
                                                                           5 and 6. The relative contribution of each tool to the detection of mis-
(RIN) was estimated by using RNA 6000 Nano Bioanalyzer 2100
                                                                           spliced genes is shown in Supplementary Fig. 4B and Supplementary
Assay (Agilent). The RNA-seq libraries were prepared with KAPA
                              R                                            Tables 7–12.
Stranded mRNA-Seq IlluminaV Platforms Kit (Roche) following the
manufacturer’s recommendations. Briefly, 500 ng of total RNA was          The entire RNA-seq dataset will be available at the European
used as the input material, the poly-A fraction was enriched with      Nucleotide Archive (ENA) database with accession number
oligo-dT magnetic beads and the mRNA was fragmented. The               PRJEB44140.
strand specificity was achieved during the second strand synthesis
performed in the presence of dUTP instead of dTTP. The blunt-
                                                                       Enrichment analysis of Gene Ontology terms
ended double stranded cDNA was 30 adenylated and Illumina plat-
form compatible adaptors with unique dual indexes and unique           Enrichment analysis of genes with differential upregulated expres-
molecular identifiers (Integrated DNA Technologies) were ligated.      sion only in Huntington’s disease samples was performed using
The ligation product was enriched with 15 PCR cycles and the final     DAVID Bioinformatics Resources 6.8, Biological Process annota-
library was validated on an Agilent 2100 Bioanalyzer with the DNA      tion36 corrected for multiple testing with Benjamini-Hochberg
7500 assay. The libraries were sequenced on HiSeq 2500 (Illumina,      false discovery rate (FDR) (adjusted P-value 5 0.05). Genes downre-
Inc) with a read length of 2  101 bp using HiSeq 4000 SBS kit in a    gulated both in human and mouse were analysed with Enrichr
fraction of a HiSeq 4000 PE Cluster kit sequencing flow cell lane      (http://amp.pharm.mssm.edu/Enrichr/; accessed October 2020)
generating 55–102 million paired-end reads per sample. Image           and significantly enriched biological processes and molecular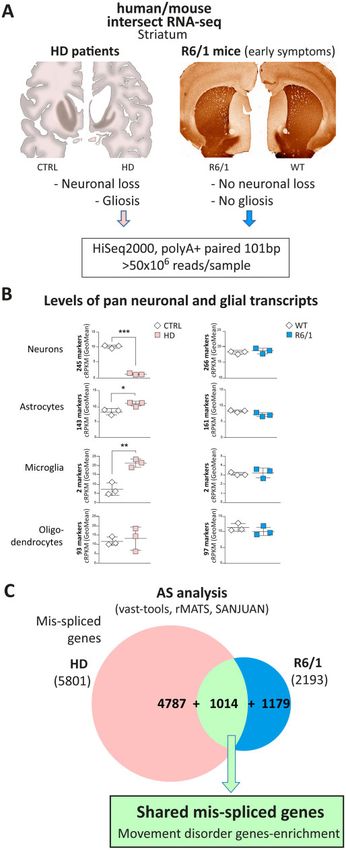
Huntington disease striatal mis-splicing                                                        BRAIN 2021: 144; 2009–2023            | 2013

functions were identified by Fisher’s exact test with adjusted P-      (1:500, Thermo Fisher, MA3-936), rabbit anti-TRPM7 (1:1000, Novus
value 5 0.05.                                                          Biologicals, NBP2-20739), rabbit anti-SLC9A5 (1:500, Abcam,
                                                                       ab191528), rabbit anti-TIA1 (1:1000, Abcam, ab40693), rabbit anti-
Ingenuity pathway analysis analysis                                    U2AF2 (1:500, Santa Cruz, sc-53942), mouse anti-RBFOX1 (1:2000,
                                                                       Merck Millipore, MABE985) for mouse samples, mouse anti-
Genes mis-spliced in both human and mouse were annotated to            RBFOX1 (1:1000, antibodies-online, ABIN1580418) for human sam-
diseases and functions using Ingenuity Pathway Analysis (IPA)          ples, mouse anti-RBFOX2 (1:500, Abcam, ab57154), rabbit anti-
software (http://www.ingenuity.com). The analysis was performed        RBFOX3 (1:1000, Merck Millipore, MAB377), rabbit anti-ELAVL4
in October 2019 and the results were filtered for neurological dis-
                                                                       (1:500, Abcam, ab96474), rabbit anti-ELAVL2 (1:500, Abcam,
eases related functions.
                                                                       ab96471), rabbit anti-ELAVL1 (1:500, Abcam, ab200342), rabbit anti-
                                                                       HNRNPC (1:500, Abcam, ab10294), rabbit anti-ELAVL3 (1:500,
Semiquantitative reverse transcription-PCR                             Abcam, ab129254), rabbit anti-PTBP1 (1:1000, Abcam, ab5642), rab-
validation                                                             bit anti-PTBP2 (1:2000, Merck Millipore, ABE431), rabbit anti-SMC1
                                                                       (1:1000, Bethyl, A300-055A), mouse anti-b-ACTIN (1:25000, Sigma,
Selected events were evaluated with semiquantitative reverse

                                                                                                                                                Downloaded from https://academic.oup.com/brain/article/144/7/2009/6174115 by guest on 29 November 2021
                                                                       A2228), rabbit anti-VINCULIN (1:20000, DAKO, P0448).
transcription (RT)-PCR. Total RNA (500 ng) was reverse-transcribed
                             R
using Invitrogen SuperScriptV IV reverse transcriptase and cDNA
(50 ng) was amplified with gene/exon-specific primers. PCR prod-       Motif enrichment analysis
ucts were resolved on 2% high-resolution MetaPhorTM agarose gels       Seventy-three orthologous exons with differential splicing in both
(Lonza).                                                               human and mouse were evaluated in parallel for RBP motif enrich-
                                                                       ment. As a control set, we selected 914 conserved alternative splic-
Primers                                                                ing exons with no detectable changes (jDPSIj 5 5) in the RNA-seq
                                                                       experiments of both species. RBP motifs deposited in the CIS-BP
Primers used in the study are as follows: Ccdc88c Forward 50 -GG
                                                                       database (http://cisbp-rna.ccbr.utoronto.ca/index.php; accessed
ATTGGAGCCAAAGCCCTAG-30 ,         Reverse     50 -CTGAGGTTGAAA
                                                                       July 2016) were scanned separately in exons, 250 intronic bases up-
AGGTCCGGG-30 ; Kctd17 Forward 50 -GGTGAACATCGGCTCCT
                                                                       stream the exon (30 splicing signal—3’ss, excluding 20 bp within
CCTA-30 , Reverse 50 -GGGTGCCTCTGGCTTGTAATAG-30 ; Synj1
                                                                       the 30 splice site) and 250 intronic bases downstream the exon (50
Forward 50 -GCTGAGGGTGAAGAGGAGTGA-30 , Reverse 50 -GCTG
ATGGCATCTCGGATGTT-30 ; Vps13c Forward 50 -CCCAGACTC                    splicing signal—5’ss, excluding 6 bp within the 50 splice site). Motif
TAGAGCCCAAGA-30 ,      Reverse     50 -GCTTGAGGGGAAGGCTGAT             occurrences (log-odd 56 for the respective RBP Position Weight
TAC-3 ; Trpm7 Forward 5 -TGCCGAATTGAAGAAGCCCTT-30 ,
       0                      0                                        Matrix) for each RBP were counted for regulated and control exons,
Reverse 50 -TGTGAATGTCTGTAATTTTCACTTGA-30 ; Slc9a5 Forward             respectively. A motif can be counted zero or once in a given se-
50 -TCCAGCTTCTGTGACGTATGC-30 ,           Reverse      50 -AGTAT        quence. Motif enrichment for each RBP in regulated alternative
TGCTTTTCTGGGAACACC-3 .    0                                            splicing exons compared to the control set was evaluated using
                                                                       Fisher’s exact test. To correct for multiple testing, Benjamini-
                                                                       Hochberg FDR was used for adjustment of P-values. Enrichment
Western blot                                                           was considered significant when the adjusted P 5 0.01.
Samples from human brain were stored at –80 C and ground with
a mortar in a frozen environment with liquid nitrogen to prevent       Data analysis
thawing of the samples, resulting in tissue powder. Mouse brains                                                                  R

were quickly dissected on an ice-cold plate and the different struc-   Statistical analysis was performed with SPSS 21.0 (SPSSV Statistic
                                                                           R

tures stored at –80 C. Human and mouse protein extracts were          IBMV). Data are represented as mean ± standard error of the mean
prepared by homogenizing brain structures in ice-cold extraction       (SEM). The normality of the data was analysed by Shapiro-Wilk.
buffer [20 mM HEPES pH 7.4, 100 mM NaCl, 20 mM NaF, 1% TritonTM        For two-group comparison, two-tailed Student’s t-test was per-
X-100, 1 mM sodium orthovanadate, 1 lM okadaic acid, 5 mM so-          formed (data with normal distribution) or Mann-Whitney U-test
dium pyrophosphate, 30 mM b-glycerophosphate, 5 mM EDTA, pro-          (data with non-normal distribution) was performed. A critical
tease inhibitors (Complete, Roche, Cat. No 11697498001)].              value for significance of P 5 0.05 was used throughout the study.
Homogenates were centrifuged at 15 000 rpm for 15 min at 4 C. The     Benjamini-Hochberg correction was applied for multiple testing in
resulting supernatant was collected, and protein content deter-        RNA-seq analysis and motif enrichment analysis, in the latter en-
mined by Quick StartTM Bradford Protein Assay (Bio-Rad, 500-0203).     richment was considered significant when the adjusted P 5 0.01.
Twenty micrograms of total protein were electrophoresed on a
10% SDS-polyacrylamide gel, transferred to a nitrocellulose blot-      Data availability
ting membrane (Amersham Protran 0.45 lm, GE Healthcare Life
                                                                       Data are available from the corresponding author upon reasonable
Sciences, 10600002) and blocked in TBS-T (150 mM NaCl, 20 mM
                                                                       request.
Tris-HCl, pH 7.5, 0.1% Tween 20) supplemented with 5% non-fat
dried milk. Membranes were incubated overnight at 4 C with the
primary antibody in TBS-T supplemented with 5% non-fat dried           Results
milk, washed with TBS-T and next incubated with HRP-conjugated
anti-mouse IgG (1:2000, DAKO, P0447) or anti-rabbit IgG (1:2000,       Human-mouse intersect-RNA-seq captures a mis-
DAKO, P0448) and developed using the ECL detection kit                 splicing signature affecting movement disorder
(PerkinElmer, NEL105001EA).                                            genes
                                                                       Given the fully penetrant and dominant nature of the Huntington’s
Antibodies                                                             disease-causing mutation, transgenic animal models that truly re-
Rabbit anti-CCDC88C (1:500, Sigma, HPA005832), rabbit anti-            capitulate symptoms and neuropathology have been generated. In
KCTD17 (1:500, Thermo Fisher, PA5-72101), mouse anti-SYNJ1             particular, mice of the R6/1 model express a transgene driven by the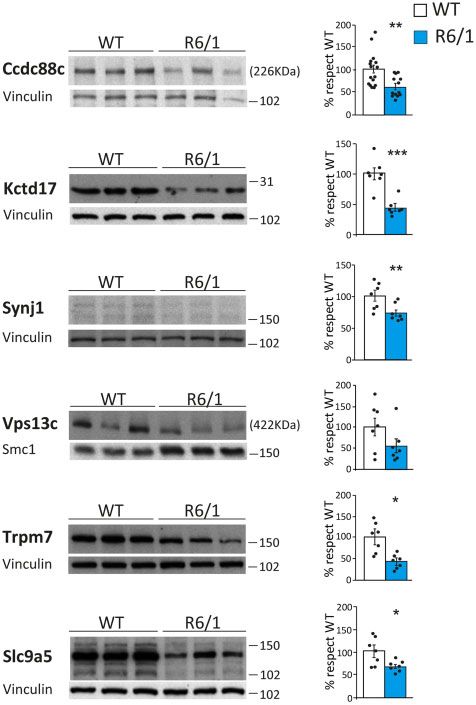
2014    | BRAIN 2021: 144; 2009–2023                                                                                                A. Elorza et al.

murine Htt promoter that encodes the highly toxic exon 1-encoded              disease patients respect to control subjects (Fig. 2C and
N-terminal form of Htt with a CAG expansion resulting in a robust,            Supplementary Table 5). Since isoform usage differs widely across
yet slowly-progressing, motor phenotype.25 At the age of 3.5 months,          cell types44,45 and is regulated upon inflammation,46 a substantial
R6/1 mice in our colony already showed a clear motor coordination             fraction of the observed alternative splicing changes are expected to
deficit (P = 5.0  10–3; Student’s t-test; Supplementary Fig. 1A), but no     be due to the altered neuronal/glia cellular composition and/or to
significant striatal atrophy or neuropathology, as evidenced by volu-         the pro-inflammatory signals in post-mortem Huntington’s disease
metric analysis of the striatum together with stereological neuronal          tissue. In line with this, the number of differentially spliced genes in
count and immunostaining with markers of gliosis (Supplementary               R6/1 mice respect to controls was much smaller (2193 genes; Fig. 2C
Fig. 1B and C). Given the lack of gliosis and neuronal loss at this           and Supplementary Table 6). Remarkably, a total of 1014 one-to-one
stage, we reasoned that a transcriptomic comparison of striatum               orthologues were differentially spliced in both human and mouse
from this mouse model and from human patients with                            (P = 3.22  10–139, two-sided Fisher’s exact test; Fig. 2C and
Huntington’s disease could reveal shared Huntington’s disease-spe-            Supplementary Tables 5, 6 and 13). This set of genes is expected to
cific pathogenic mis-splicing signatures triggered by the                     reflect alternative splicing alterations that are mainly due to the tox-
Huntington’s disease mutation in both species, devoid of secondary            icity of the Huntington’s disease mutation independently of altered

                                                                                                                                                         Downloaded from https://academic.oup.com/brain/article/144/7/2009/6174115 by guest on 29 November 2021
alteration-related artefacts. Therefore, we performed at par RNA-             cellular content-associated artefacts in the human samples.
seq analyses of post-mortem striatum of Huntington’s disease                  Accordingly, this shared mis-splicing signature represents an im-
patients (Vonsattel’s grade 3–4) and matching control subjects                portant fraction of all mis-spliced genes in the mouse model (46.2%)
(n = 3), and of striatum of 3.5-month-old R6/1 mice, together with            but only a minority of those observed in human tissue (17.5%).
matching controls (n = 3). Between 55 and 102 million reads (101-bp,          Interestingly, we could further corroborate that we eliminated in-
pair-ended) were generated per sample (Fig. 2A). Prior to the alterna-        flammation-related noise by intersecting with early symptomatic
tive splicing analysis, we performed an initial characterization of           R6/1 mice, as a recent study revealed the interleukin-6-dependent
differentially expressed genes (DEGs). As expected, analysis of the           gene expression of R6 mice47 and this is overrepresented among the
R6/1 RNA-seq samples revealed similarities with previous studies              genes whose mis-splicing develops in R6/1 mice after the age of
performed on striatum of R6/1 mice,37 particularly those performed            3.5 months (Supplementary Fig. 4A).
in young pre-symptomatic mice (Supplementary Fig. 2A and                          Remarkably, Gene Ontology analysis (Supplementary Table 15)
Supplementary Table 3). In agreement with the motor symptoms al-              revealed that the genes in the shared mis-splicing signature were
ready observed in the 3.5-month-old R6/1 mice, we found decreased             strongly enriched for terms related to basal ganglia and movement
levels of specific marker genes related to the function of medium             disorders (including Huntington’s disease), this being even more
sized spiny neurons such as Darpp32, Drd1 and Drd2 (Supplementary             pronounced in the restricted list of the 372 mis-spliced genes that
Fig. 2B), which are known to decrease early in the course of R6/1 and         are coincidentally detected with a given alternative splicing-analysis
R6/2 mouse phenotype.38–41 Accordingly, when we analysed bat-                 tool in both species (Supplementary Table 16 and Supplementary
teries of molecular marker genes of specific striatal cell types,34 we        Fig. 4B). This enrichment in basal ganglia- and movement disorder-
found a slight decrease in the global expression of markers of the            related genes suggests that these shared alternative splicing altera-
spiny projection neurons of the striatonigral direct pathway (dSPN)           tions in striatum are a plausible contributor to Huntington’s disease
and striatopallidal indirect pathway (iSPN) (Supplementary Fig. 2C).          pathogenesis. Finally, to test whether this shared mis-splicing sig-
However, in line with the lack of overt neuronal loss and gliosis in          nature was neuronal- or glial-specific, or even restricted to certain
3.5-month-old R6/1 mice (Supplementary Fig. 1B and C), we found               neuronal subtypes, we used available striatal cell-type-specific tran-
no significant alterations of a set of pan-neuronal and glial marker          scriptomic databases.34,41 However, we found no significantly biased
genes32,33 (Supplementary Table 4) that would be expected to be               distributions across cell types (Supplementary Fig. 4C and D).
altered in the event of generalized neuronal loss and gliosis (Fig. 2B).
In contrast, as expected from the marked neuronal loss and gliosis
                                                                              Mis-splicing of neurodegeneration-linked genes
of human Huntington’s disease post-mortem striatum,24 we
                                                                              correlates with reduced protein levels
observed a strong decrease in the relative expression of pan-neuron-
al marker genes (P = 8.0  10–5; Student’s t-test) and an increase in         To explore the pathogenic relevance of mis-spliced genes, we next
glial marker genes, particularly those of astrocytes (P = 0.018;              focused on a subset of manually curated genes with differential al-
Student’s t-test) and microglia (P = 4.2  10–3; Student’s t-test) (Fig. 2B   ternative splicing in both species and whose mutations cause
and Supplementary Fig. 2C). Comparison of the human and mouse                 monogenic forms of neurodegeneration in humans: CCDC88C
Huntington’s disease-associated DEG signatures revealed that the              (Coiled-coil domain containing 88 C, linked to SCA40, OMIM
number of up- or downregulated genes was much higher in human                 #616053), KCTD17 [potassium channel tetramerization domain
samples (Supplementary Fig. 3A, B and Supplementary Table 2),                 containing 17, linked to myoclonic dystonia 26 (DYT26) OMIM
most likely reflecting the altered cellular composition and chronic           #616398], SYNJ1 [synaptojanin 1, linked to early onset Parkinson
neuroinflammation. In fact, upregulated genes show enrichment for             disease 20 (PARK20), OMIM #615530], VPS13C [vacuolar protein
inflammation-related genes (Supplementary Fig. 3B). This may also             sorting 13 homolog C, linked to early onset Parkinson disease 23
explain why, in good agreement with earlier human/mouse compar-               (PARK23), OMIM #616840], TRPM7 [transient receptor potential cat-
isons based on gene chip analyses,42 the overlap was much stronger            ion channel subfamily M member 7, linked to amyotrophic lateral
for the downregulated genes (Supplementary Fig. 3A). Also in good             sclerosis-parkinsonism/dementia complex (ALSP/DC), OMIM
agreement with previous literature,42,43 shared downregulated                 #105500] and SLC9A5 [solute carrier family 9 member A5, also
genes show an enrichment in synaptic transmission-related gene                known as Na( + )/H( + ) exchanger 5, which has been suggested to
ontology categories (Supplementary Fig. 3C).                                  be linked to episodic kinesigenic dyskinesia 2 (EKD2), as it maps to
    Next, we compared alternative splicing between Huntington’s               the 16q13-q22.1 candidate region48] (Fig. 3A). Using VastDB,28 we
disease and control samples in both species using three comple-               identified the orthologous alternative splicing events that were
mentary software packages (vast-tools, rMATS and SANJUAN; see                 differentially spliced in both species, and which corresponded to
‘Materials and methods’ section for details). Combining the results           skipped exons in all cases except for TRPM7, which had a differen-
obtained from each tool produced a list of 5801 genes with at least           tially retained intron (Fig. 3B). All these mis-spliced events
one differentially spliced alternative splicing event in Huntington’s         detected by RNA-seq were validated by RT-PCR assays using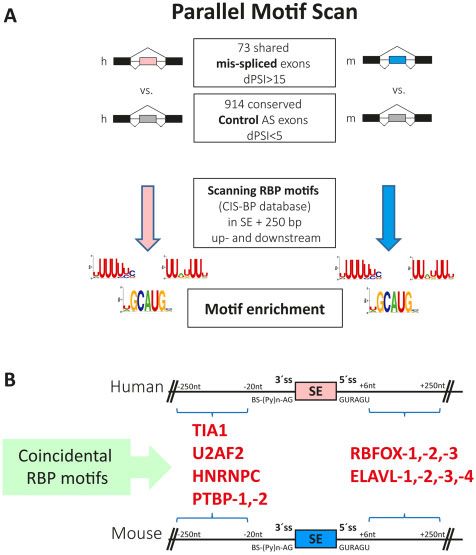
Huntington disease striatal mis-splicing                                                                       BRAIN 2021: 144; 2009–2023              | 2015

                                                                                                                                                                    Downloaded from https://academic.oup.com/brain/article/144/7/2009/6174115 by guest on 29 November 2021

Figure 2 Intersect-RNA-seq analysis of striatum of patients with Huntington’s disease and early symptomatic R6/1 mice. (A) For at par RNA-seq analysis,
polyA + RNA was prepared from post-mortem striatum of patients with Huntington’s disease (Vonsattel’s grade 3–4) and matching control subjects (n = 3),
and from striatum of 3.5-month-old R6/1 mice, together with matching controls (n = 3). The schematic drawings on the left depict coronal sections of human
control and Huntington’s disease patient brain showing striatal atrophy and micrographs on the right show representative images of DARPP32 immunos-
taining of non-atrophied striatum in coronal sections of 3.5-month-old R6/1 mice as compared to wild-type mice. (B) Analysis of levels of cell-type-specific
transcripts in human (left, n = 3) and mouse (right, n = 3) striatal RNA-seq samples using geometric mean of the cRPKM values of cell type marker genes of
neurons, astrocytes, microglia and oligodendrocytes (Student’s t-test; *P 5 0.05, **P 5 0.01, ***P 5 0.001). (C) Splicing was analysed with vast-tools, rMATs and
SANJUAN software and the Venn diagram shows the number of mis-spliced genes in Huntington’s disease patients (5801) and R6/1 mice (2193) with respect
to controls, as well as the intersect of 1,014 mis-spliced genes common to both species (P = 3.22  10–139, two-sided Fisher’s exact test using only one-to-one
orthologues with sufficient read coverage in both species as background; n = 12 882). AS = alternative splicing; WT = wild-type.
2016 | BRAIN 2021: 144; 2009–2023 A. Elorza et al.
Downloaded from https://academic.oup.com/brain/article/144/7/2009/6174115 by guest on 29 November 2021
Figure 3 Mis-splicing of neurodegeneration-causing genes. (A) The OMIM database was used to select, among the genes that are mis-spliced in both
human and mouse striatum, genes whose mutations in humans cause monogenic forms of neurodegeneration. (B) Using VastDB,28 the orthologous
alternative spliced events differentially processed in both species were identified and the PSI (per cent spliced in) values of the mis-spliced events in
each gene are shown in three wild-type versus three R6/1 samples (according to the RNA-seq vast-tools analysis). (C) RT-PCR assay and quantification
of mis-spliced events in striatal RNA from an independent set of wild-type and R6/1 mice (n = 5). (Student’s t-test; *P 5 0.05, **P 5 0.01). Data repre-
sent mean ± SEM.
striatal mRNA from an independent set of R6/1 and wild-type mice disease and mice may have a pathogenic effect by diminishing
(n = 5; Fig. 3C). protein levels of multiple neurodegeneration-linked genes.
Next, we tested whether the splicing alterations observed in
striatum of R6/1 mice in these neurodegeneration-associated Parallel RBP motif enrichment analysis reveals
genes correlated with changes in their protein levels. Western blot
splicing factors altered in Huntington’s disease
analyses revealed a significant decrease in protein levels for all of
them except for VPS13C, which also showed a trend of reduced
striatum
protein levels respect to the control samples (Fig. 4). Since both re- We next looked for potential RBPs that may be responsible for the
cessive mutations and decreased protein levels may result in shared mis-splicing Huntington’s disease signature. For this pur-
decreased protein function, these data suggest that the observed pose, we searched for known binding motifs for RBPs49 inside and
global mis-splicing in striatum of patients with Huntington’s around orthologous exons that were mis-regulated in both species.Huntington disease striatal mis-splicing BRAIN 2021: 144; 2009–2023 | 2017
Downloaded from https://academic.oup.com/brain/article/144/7/2009/6174115 by guest on 29 November 2021
Figure 5 Human-mouse parallel RBP motif scan analysis in mis-regu-
lated alternatively spliced events identifies enrichment of several
splicing factor binding motifs. (A) Schematic representation of scan RBP
motif analysis performed in the 73 differentially included alternative
exons detected with vast-tools and conserved in human (h) and mouse
(m). (B) Significantly enriched binding sites of splicing factors in 250
intronic base pairs adjacent to differentially skipped exons in
Huntington’s disease and R6/1 samples. SE = skipped exons; ss = splice
Figure 4 Decreased protein levels of neurodegeneration-causing genes site.
in striatum of R6/1 mice. Protein levels in striatum of wild-type (WT)
and R6/1 mice and quantifications normalized to vinculin (n = 7–16).
(Student’s t-test; *P 5 0.05, **P 5 0.01, ***P 5 0.001). Data represent paralogues of the PTBP family, which are preferentially expressed
mean ± SEM.
in astrocytes (https://www.proteinatlas.org/) (Supplementary Fig.
5). To gain mechanistic insight into why these splicing factors
We reasoned that motifs associated with relevant RBPs would be show decreased protein levels, we first checked in our R6/1 RNA-
seq data whether their transcript levels were also diminished.
similarly enriched in both exons sets. Since vast-tools directly pro-
However, we found unaltered levels for most of them, except for
vides exon-based homology information between the two species,
Rbfox1, which showed significantly decreased transcript levels,
we focused on 73 orthologous alternative exons detected by this
and Hnrnpc, which counterintuitively showed increased levels (Fig.
software as mis-spliced in both human and mouse (jDPSIj 5 15)
6B). We also checked whether any of the altered splicing factors
(Supplementary Table 17). As a control gene set, we used 914 alter-
was particularly expressed in neuronal and/or glial cell-types of
natively spliced exons whose usage was not altered in
the striatum based on available datasets.34,41 According to laser
Huntington’s disease and R6/1 samples respect to controls
capture followed by RNA-seq technology,34 Rbfox1 mRNA is signifi-
(jDPSIj 5 5) (Fig. 5A). Motifs associated with six RBP families
cantly enriched in spiny neurons, both globally (dSPN + iSPN) and
showed significant enrichments in the equivalent positions in
also particularly in iSPN cells (logFC = 0.57, FDR = 0.042), while
both species: binding motifs of TIA1, U2AF2, HNRNPC and PTBP
Elavl4 mRNA is enriched in microglial cells (logFC = 0.74,
were enriched in the upstream intronic sequences and of RBFOX FDR = 0.091). According to TRAP analysis,41 Rbfox3 mRNA is also
and ELAVL in downstream intronic sequences (Fig. 5B and Table 1). significantly enriched in spiny neurons. We then performed
Western blot analysis of these RBPs in striatum of R6/1 and immunostainings to test whether the splicing factors showing
control mice revealed a significant decrease in protein levels for altered protein levels in R6/1 mice are being sequestered into the
nine different members belonging to five of six identified RBP fam- characteristic polyQ-containing inclusion bodies of Huntington’s
ilies. Specifically, we found decreased levels for TIA1 (71%, disease, as it has been previously reported for SRSF6.12 Compared
P = 9.2 10–4; Student’s t-test), U2AF2 (26%, P = 2.2 10–3; Student’s to wild-type mice, only HNRNPC and TIA1 showed and altered
t-test), RBFOX1 (28% P = 0.016; Student’s t-test), RBFOX2 (46%, immunostaining pattern in striatum of R6/1 mice. This consisted
P = 8.5 10–3; Student’s t-test), RBFOX3 (60%, P = 1.3 10–5; of a more pronounced punctate pattern resembling that of RNA-
Student’s t-test), ELAVL4 (76%, P = 1.5 10–4; Student’s t-test), foci (Fig. 6C). Moreover, TIA1 and polyQ exhibited a modest co-lo-
ELAVL2 (55%, P = 2.3 10–5; Student’s t-test), ELAVL1 (30%, calization in inclusion-bearing neurons, which, in turn, seem to
P = 2.9 10–4; Student’s t-test) and HNRNPC (66%, P = 1.9 10–3; have diminished number of TIA1-positive RNA foci-like puncta
Student’s t-test) (Fig. 6A). In contrast, the protein levels of ELAVL3 (Fig. 6D). In summary, these results show that most splicing factors
did not show any change in R6/1 striatum, neither did the two predicted by the parallel scan motif analysis show decreased2018 | BRAIN 2021: 144; 2009–2023 A. Elorza et al.
Table 1 Significantly enriched binding sites of splicing factors in 250 intronic base pairs adjacent to differentially skipped exons in
Huntington’s disease and R6/1 samples
Splicing factor Binding motif Human Mice
P-value Adjusted P-value Adjusted
P-value P-value
30 splicing signal
TIA1 UUUUUBK 1.607 10–6 1.141 10–4 2.002 10–6 1.261 10–4
U2AF2 UUUUUYC 2.657 10–7 1.913 10–5 5.070 10–6 3.143 10–4
HNRNPC HUUUUUK 1.713 10–5 1.182 10–3 3.516 10–5 2.075 10–3
PTBP-1,-2,-3 HYUUUYU 1.139 10–8 8.427 10–7 2.009 10–12 1.306 10–10
50 splicing signal
RBFOX-1,-2,-3 WGCAUG 9.688 10–7 7.072 10–5 1.405 10–4 8.851 10–3
Downloaded from https://academic.oup.com/brain/article/144/7/2009/6174115 by guest on 29 November 2021
ELAVL-1,-2,-3,-4 UUDUUUU 8.126 10–8 6.094 10–6 1.698 10–6 1.087 10–4
protein levels in striatum of R6/1 mice but that, with the exception the candidate splicing factors identified by our intersect-RNA-seq
of RBFOX1, this cannot be attributed to decreased transcript levels and parallel motif scan analyses show high validation rates also at
or sequestration into inclusion bodies. the protein level in striatum of patients with Huntington’s disease.
Finally, to infer which of the decreased splicing factors are
more likely to play an early role in Huntington’s disease pathogen-
esis, we analysed their protein levels in the zQ175 mouse model of Discussion
prodromal Huntington’s disease. These mice are a heterozygous Here we report a novel approach to identify potentially pathologic-
knock-in Huntington’s disease model with the CAG expansion in al signatures of mis-splicing in Huntington’s disease patients over-
the endogenous Htt gene to resemble the human Huntington’s dis- coming the artefacts associated with altered cell type composition
ease mutation better, but it does not develop an overt motor and neuroinflammation in human post-mortem brain tissues.
phenotype within the maximal (2.5 years) lifespan of a mouse We performed at par RNA-seq analysis of striatal tissue from a
and it is thus considered a model of pre-manifest Huntington’s mouse model of Huntington’s disease at an early symptomatic
disease.26 We found that RBFOX1 protein levels are decreased in stage and from human post-mortem Huntington’s disease brain,
striatum of zQ175 mice at the early age of 6 months and decreased whose intersection revealed a shared Huntington’s disease-specif-
protein levels or a strong tendency is also observed for RBFOX2,
ic mis-splicing signature affecting 1014 one-to-one orthologous
RBFOX3 and TIA1 in 20-month-old zQ175 mice. These results sug-
genes. These included a subset of genes that had been previously
gest that these splicing factors might be among the earliest ones to
linked to neurodegenerative movement disorders and that we
decrease in the human condition (Fig. 6E).
showed to have reduced protein levels in the mouse model as well
as in Huntington’s disease patients. In addition, by human-mouse
Validation of altered splicing factors and pathogenic parallel complementary motif searches on common mis-spliced
downstream effectors in patient striatum events, we inferred a network of candidate upstream splicing fac-
tors with reduced protein levels in both species.
Finally, we assessed whether the protein-level alterations
Post-mortem Huntington’s disease cerebral cortex shows a less
observed in R6/1 striatum for both splicing factors and neurodege-
marked atrophy than striatum, which is the brain region primarily
nerative-associated genes reflected matching alterations in the
affected in the disease, and RNA-seq has been previously per-
striatum of Huntington’s disease patients, as expected from our
intersect-RNA-seq analysis. Regarding the splicing factors, we formed on post-mortem Huntington’s disease BA4 motor cortex to
found decreased protein levels for TIA1 (91%, P = 0.036; Student’s t- analyse splicing.13 Nevertheless, it is well documented that the
test), U2AF2 (65%, P = 0.045; Student’s t-test), RBFOX1 (76%, cortex also degenerates early in the course of disease,50 and there-
P = 5.3 10–4; Student’s t-test), RBFOX2 (46%, P = 4.6 10–3; fore is likely affected by the mentioned caveats associated to neu-
Student’s t-test), RBFOX3 (96%, P = 3.3 10–3; Student’s t-test) and rodegeneration and neuroinflammation. In fact, comparison with
ELAVL2 (62%, P = 1.8 10–4; Student’s t-test). A similar trend for our study revealed that 46% of the genes with alternative splicing
decreased protein levels (53%, P = 0.17; Student’s t-test) was also alterations detected by Lin and co-workers13 in Huntington’s dis-
observed for HNRNPC (Fig. 7A). For the subset of neurodegenera- ease cortex (222 of 478) are also detected as mis-spliced in our
tion-linked mis-spliced genes, we observed a sharp decrease in RNA-seq analysis of Huntington’s disease striatum. However, only
protein levels for almost all of them (Fig. 7B). More precisely, for 36 of these genes are also altered in striatum of early symptomatic
CCDC88C we found a 90% decrease in a low molecular weight form mice. Therefore, their alternative splicing analysis detected only
(P = 3.2 10–5; Student’s t-test) and a trend for decrease in the ca- 3.6% of the genes in the shared mis-splicing signature detected by
nonical 228 kDa form (60%, P = 0.081; Student’s our intersect RNA-seq analysis which, as we also demonstrate
t-test), for KCTD17 we observed a 58% decrease (P = 1.7 10–3; here, faithfully pinpointed upstream deregulated splicing factors
Student’s t-test) in the monomeric (36 kDa) form and a 59% de- and decreased protein levels of downstream mis-spliced patho-
crease (P = 0.048; Student’s t-test) in the pentameric form (data not genic effectors. Furthermore, in their set of differential alternative
shown), and we also observed decreased levels of SYNJ1 (56%, splicing events, they detected enrichment of motifs of 15 splicing
P = 0.021; Student’s t-test), TRPM7 (82%, P = 6.0 10–3; Student’s factors. However, only PTBP1—which is not expressed in neurons
t-test), VPS13C (69%, P = 0.012; Student’s t-test) and SLC9A5 (83%, (https://www.proteinatlas.org/; accessed June 2020)—matches
P = 1.0 10–3; Student’s t-test) (Fig. 7B). Altogether, these results in- those detected in our analysis. Besides, PTBP1 protein levels are
dicate that the mis-splicing Huntington’s disease signature and not altered neither in human nor mouse Huntington’s diseaseHuntington disease striatal mis-splicing BRAIN 2021: 144; 2009–2023 | 2019
Downloaded from https://academic.oup.com/brain/article/144/7/2009/6174115 by guest on 29 November 2021
Figure 6 Decreased protein levels of splicing factors in striatum of Huntington’s disease mouse model. (A) Protein levels in striatum of wild-type and
R6/1 mice and quantifications normalized with b-actin (n = 7-20) (Student’s t-test; *P 5 0.05, **P 5 0.01, ***P 5 0.001). Data represent mean ± SEM. (B)
Messenger RNA levels of Rbfox1 and Hnrnpc in three wild-type versus three R6/1 samples, according to the RNA-seq Salmon DEG-analysis. (C)
HNRNPC and TIA1 immunohistochemistry staining in striatum of R6/1 and wild-type mice. (D) Double immunofluorescence with TIA1 (green) and
HTT (EM48, red) antibodies in striatum of R6/1 mice. Empty arrows show TIA1 punctate pattern in the absence of mutant HTT (mHtt) inclusions.
Filled arrows show discrete co-localization of TIA1 and mHtt fluorescence in inclusion bodies. Nuclei were counterstained with DAPI (blue). (E)
Protein levels in striatum of wild-type and zQ175 mice and quantifications normalized with b-actin (n = 6). (Student’s t-test; *P 5 0.05). Data represent
mean ± SEM.2020 | BRAIN 2021: 144; 2009–2023 A. Elorza et al.
Downloaded from https://academic.oup.com/brain/article/144/7/2009/6174115 by guest on 29 November 2021
Figure 7 Alteration of splicing factors and neurodegeneration-causing genes protein levels in striatum of patients with Huntington’s disease. (A)
Representative western blots of protein levels of splicing factors in striatum of patients with Huntington’s disease and controls, and quantification
normalized with vinculin (n = 7–15). (Student’s t-test; *P 5 0.05, **P 5 0.01, ***P 5 0.001). Data represent mean ± SEM. (B) Localization of binding motifs
of splicing factors enriched in the proximity of the mis-spliced events in each pathogenic gene and their protein levels in control and Huntington’s
disease striatum. Histograms show quantification of protein levels normalized with vinculin (n = 7–17). (Student’s t-test; *P 5 0.05, **P 5 0.01, ***P 5
0.001). Data represent mean ± SEM. WT = wild-type.Huntington disease striatal mis-splicing BRAIN 2021: 144; 2009–2023 | 2021
striatum, unlike the other five families of splicing factors that we However, RBFOX splicing factors also act through a multiprotein
detected through our parallel motif scan. Moreover, of the nine complex called LASR (Large Assembly of Splicing Regulators) that
candidate splicing factors that show altered mRNA levels in the includes HNRNPC57 and it is conceivable that sequestration of
work of Lin et al.,13 the majority also change in human striatum HNRNPC by expanded CAG-HTT exon1 RNA15 might subsequently
according to our RNA-seq data, but only one is altered in striatum affect RBFOX binding and stability.
of early symptomatic mice. Overall, these observations point to Correction of mis-splicing events with antisense oligonucleo-
neurodegeneration-associated confounding factors and highlight tide drugs is a growing therapeutic approach for neurological dis-
that, by refining mis-splicing analysis by intersecting results from eases such as spinal muscular atrophy58 or neuronal ceroid
human patients and an early mouse model, neurodegeneration- lipofuscinosis 7,59 which are caused by splicing-affecting muta-
and neuroinflammation-associated artefacts are cleared out in our tions. Here we identify at least six mis-spliced key pathogenic
study. genes (CCDC88C, KCTD17, SYNJ1, VPS13C, TRPM7 and SLC9A5) that
Regarding specific genes whose mis-splicing detected through become good candidate therapeutic targets, as their alternative
RT-PCR had previously been related to Huntington’s disease splicing is susceptible to be modified with similar antisense
pathogenesis (e.g. MAPT,12 CREB1,15 TAF1,50 and HTT itself14), in our oligonucleotide drugs able to favour the normal ratio of alterna-
Downloaded from https://academic.oup.com/brain/article/144/7/2009/6174115 by guest on 29 November 2021
RNA-seq analysis we confirmed: the increased inclusion of MAPT tive splicing generated mRNA isoforms. However, additional pre-
exon 10, a CREB1 intron retention, and the altered usage of the al- clinical research needs to be conducted in order to explore if
ternative 30 splicing signal of TAF1 exon 5 that favours the long these mis-splicing events—and the concomitant decreased pro-
( + 63 nt) version of this exon. However, concerning HTT mis-splic- tein levels—significantly contribute to the Huntington’s disease
ing, there is a technical limitation to study 50 sequences in very mouse phenotype, either individually or in combination. This
long transcripts such as that of HTT. This is because of a bias in fa- could be performed through mouse genetics and/or in vivo deliv-
vour of 30 sequences in poly(A) + RNA-seq analyses like the one we ery of splicing-modifying oligonucleotides to identify the best
have performed here. Consequently, despite the considerable candidates for potential clinical developments. Apart from cor-
depth of our sequencing, we did not obtain reads with enough recting specific mis-splicing events, a more comprehensive but
mapping to the first exons and introns of HTT to perform a quanti- technically challenging therapeutic strategy would be the correc-
tative analysis concerning the previously reported increased reten- tion of the decreased protein levels of the splicing factors that may
tion of the first intron of HTT. be acting upstream of the mis-splicing signature. In this regard,
Eight additional neurological disorders including the spinal and Rbfox1 and Rbfox3 are neuronal genes early downregulated at the
bulbar muscular atrophy (SBMA) and several SCAs are caused by transcriptional level in the striatum of Huntington’s disease knock-
expanded CAG repeats in coding sequences of different genes that in mice.40,41 Since knock-in mice are models of prodromal
give rise to expanded polyQ containing proteins.18 Given the simi- Huntington’s disease, decreased expression of Rbfox splicing factors
larity in the causing mutations, the molecular mechanisms in might be one of the earliest alterations underlying the mis-splicing
Huntington’s disease pathogenesis—including splicing altera- signature that we report here. Accordingly, correcting the expres-
tions— are likely contributors to the other CAG repeat polygluta- sion of Rbfox genes might have a higher impact in normalizing alter-
minopathies. Most of these diseases show maximal affectation in native splicing than that of other splicing factors that probably get
cerebellum and the analysis of global mis-splicing in post-mortem deregulated later in the course of disease progression.
cerebellar patient tissue for these diseases poses the same chal- In summary, by intersect-RNA-seq analysis of at par-processed
lenges as those addressed here for Huntington’s disease striatum. early mouse model and human post-mortem brain tissue, we have
Since there are also good animal models for these triplet repeat identified a Huntington’s disease-specific mis-splicing signature
disorders,52 at par early mouse model RNA-seq to identify the that allowed us to infer altered upstream splicing factors and
intersecting mis-splicing signature and parallel motif scans to downstream pathogenic effectors that can become new therapeut-
infer associated splicing regulators will be useful to determine ic targets for Huntington’s disease. Moreover, this approach can be
whether similar alternative splicing-related pathogenic mecha- applied to investigate the potential relevance of altered alternative
nisms underlie the different CAG trinucleotide repeat disorders. splicing in other neurodegenerative diseases.
Similarly, the human-mouse intersect-RNA-seq approach might
be applied to any neurodegenerative disease for which animal
models with construct validity are available and for which altera-
Acknowledgements
tions in RNA processing are suspected as a pathogenic mechan- We acknowledge support of the publication fee by the CSIC Open
ism. These include the amyotrophic lateral sclerosis/ Access Publication Support Initiative through its Unit of
frontotemporal dementia disease continuum (ALS/FTD),53 particu- Information Resources for Research (URICI). Human tissue was
larly the forms associated to mutations in genes encoding RBPs obtained from Institute of Neuropathology (HUB-ICO-IDIBELL) Brain
(TDP43 and FUS) or affecting formation of RNA foci (C9orf72)54 for Bank, the Neurological Tissue Bank of the IDIBAPS Biobank, the
which bona fide animal models exist.1 Banco de Tejidos Fundación CIEN, and the Netherlands Brain Bank.
Pathological expanded CAG-containing mRNAs adopt a hairpin We thank Juan Valcárcel for scientific advice. This work was partial-
conformation55 and some of the splicing factors found decreased ly supported by the computing facilities of Extremadura Research
here are likely to be affected by direct and aberrant interaction Centre for Advanced Technologies (CETA-CIEMAT), funded by the
with expanded CAG mRNA. This is in fact the case of U2AF215,22 European Regional Development Fund (ERDF). CETA-CIEMAT
and HNRNPC.15 Both U2AF2 and HNRNPC bind to U-rich motifs, as belongs to CIEMAT and the Government of Spain. The data submis-
also do TIA1 and the ELAVL family, all identified here as mis-regu- sion to a public repository was performed by the Genomics and NGS
lated in human Huntington’s disease patients and the mouse Core Facility at the Centro de Biologı́a Molecular Severo Ochoa
model. Since they compete for similar target mRNAs and may be (CBMSO, CSIC-UAM) which is part of the CEI UAM + CSIC, Madrid,
regulated by common interactors, it is conceivable that deregula- Spain - http://www.cbm.uam.es/genomica. We also thank excellent
tion of TIA1 and ELAVL might be secondary to U2AF2 and HNRNPC technical assistance by Miriam Lucas and by the following core
alterations driven by their interaction with expanded CAG repeats. facilities: CBMSO-Genomics & Massive Sequencing, CBMSO-Animal
The RBFOX family is the only one altered in our study that does Facility and CBMSO-Optical & confocal microscopy. We also thank
not bind U-rich motifs, as it binds the GCAUG consensus.56 Álvaro Lucas for help with illustrations.You can also read