Genomics-Assisted Breeding for Quantitative Disease Resistances in Small-Grain Cereals and Maize - MDPI
←
→
Page content transcription
If your browser does not render page correctly, please read the page content below
International Journal of
            Molecular Sciences

Review
Genomics-Assisted Breeding for Quantitative Disease
Resistances in Small-Grain Cereals and Maize
Thomas Miedaner 1, * , Ana Luisa Galiano-Carneiro Boeven 1,2 , David Sewodor Gaikpa 1 ,
Maria Belén Kistner 1,3,4 and Cathérine Pauline Grote 1
 1    State Plant Breeding Institute, University of Hohenheim, Fruwirthstr. 21, 70599 Stuttgart, Germany;
      ana.galiano@kws.com (A.L.G.-C.B.); david.gaikpa@uni-hohenheim.de (D.S.G.);
      kistner@agro.uba.ar (M.B.K.); catherine.pauline.herter@gmail.com (C.P.G.)
 2    Kleinwanzlebener Saatzucht (KWS) SAAT SE & Co. KGaA, 37574 Einbeck, Germany
 3    Estación Experimental Pergamino, Instituto Nacional de Tecnología Agropecuaria (INTA),
      CC31, B2700WAA Pergamino, Argentina
 4    Consejo Nacional de Investigaciones Científicas y Técnicas (CONICET),
       Godoy Cruz 2290, C1425FQB Buenos Aires, Argentina
 *    Correspondence: miedaner@uni-hohenheim.de

 Received: 30 November 2020; Accepted: 17 December 2020; Published: 19 December 2020

 Abstract: Generating genomics-driven knowledge opens a way to accelerate the resistance breeding
 process by family or population mapping and genomic selection. Important prerequisites are large
 populations that are genomically analyzed by medium- to high-density marker arrays and extensive
 phenotyping across locations and years of the same populations. The latter is important to train a
 genomic model that is used to predict genomic estimated breeding values of phenotypically untested
 genotypes. After reviewing the specific features of quantitative resistances and the basic genomic
 techniques, the possibilities for genomics-assisted breeding are evaluated for six pathosystems with
 hemi-biotrophic fungi: Small-grain cereals/Fusarium head blight (FHB), wheat/Septoria tritici blotch
 (STB) and Septoria nodorum blotch (SNB), maize/Gibberella ear rot (GER) and Fusarium ear rot (FER),
 maize/Northern corn leaf blight (NCLB). Typically, all quantitative disease resistances are caused by
 hundreds of QTL scattered across the whole genome, but often available in hotspots as exemplified for
 NCLB resistance in maize. Because all crops are suffering from many diseases, multi-disease resistance
 (MDR) is an attractive aim that can be selected by specific MDR QTL. Finally, the integration of
 genomic data in the breeding process for introgression of genetic resources and for the improvement
 within elite materials is discussed.

 Keywords: resistance breeding; small-grain cereals/ Fusarium head blight; wheat/Septoria tritici blotch;
 wheat/Septoria nodorum blotch; maize/Gibberella and Fusarium ear rot; maize/Northern corn leaf blight;
 multi-disease resistance (MDR); genetic resources

1. Introduction
     Plant breeding aims to develop new cultivars with superior performance in terms of grain yield,
disease resistance and grain quality. Per crop, about 10 to 30 individual traits have to be considered
in a multi-step procedure where different traits are selected in different generations, starting with
one-row plots in early generations and ending with large-drilled plots (5–10 m2 ) in late generations.
Selection starts with a plethora of 100,000s of genotypes and should end with 1–5 successful candidates
per year. This procedure takes 6–12 years depending on the crop and is therefore tedious and
capital-intensive. Therefore, each possibility to speed up this process and to get a more targeted
outcome would be highly appreciated. Besides gene transfer and genome editing, genomics could

Int. J. Mol. Sci. 2020, 21, 9717; doi:10.3390/ijms21249717                            www.mdpi.com/journal/ijms
Int. J. Mol. Sci. 2020, 21, 9717 2 of 22
play a prominent role in future plant breeding processes. In contrast to genetics, genomics aims at the
collective characterization of all genes/genomic segments and their interaction that are responsible for
a quantitative disease resistance (QDR) phenotype. This became possible by developing high-density
marker chips based on full-genome sequencing that has made tremendous progress in the last decade
and is now available for most crops at reasonable cost.
Disease resistance has been dichotomically classified in qualitative and quantitative resistances.
Qualitative resistance is based on individual resistance (R) genes mainly encoding R proteins that interact
with pathogen-specific effectors triggering a complete defensive response called effector-triggered immunity
(ETI), while the molecular basis of QDR is poorly understood. Hypotheses include regulation of morphology
and developmental traits, basal defense, production of anti-fungal compounds, defense signal transduction,
weak ETI triggered by “defeated” R proteins, or unidentified mechanisms [1]. The evidence suggests
that probably all these mechanisms can lead to QDR, but also that the division between qualitative and
qualitative resistance seems to be not so contrasting as was proposed historically.
In this review, we will concentrate on QDR of the four small-grain winter crops rye (Secale cereale L.),
triticale (×Triticosecale Wittm.), durum wheat (Triticum turgidum ssp. durum), bread wheat (T. aestivum
ssp. aestivum), and of maize (Zea mays L.). These crops provide more than half of the global caloric
intake [2]. Caused by the world-wide growth of human population, the consumption of cereals
between 2019 and 2028 is expected to increase at 1.2% per year, with increasing demand in Asia and
Africa [3]. The production of cereals also provides employment for millions of people throughout the
world. The most important factors restricting further yield improvements are abiotic stress factors
and pests with the latter causing a yield loss of approximately 30–40% on a world-wide basis with
a large range from 5–90% depending on the disease and the region [4,5]. Without the application of
chemical plant protection, the worldwide loss could rise, on average, to 50–75% depending on the
crop [4]. From the side of diseases, we will concentrate on six hemi-biotrophic fungal diseases that
are the most pertinent threat in temperate regions, among them are some of the most important plant
pathogens worldwide: Small-grain cereals/Fusarium head blight (FHB), wheat/Septoria tritici blotch
(STB), and wheat/Septoria nodorum blotch (SNB), maize/Gibberella ear rot (GER) and Fusarium ear rot
(FER), maize/Northern corn leaf blight (NCLB). The papers reviewed here should provide a wider
view on QDR by analyzing large numbers of genotypes with a full-genome coverage concentrating on
the last five years where the most dramatic progress was made.
2. Genetics of Quantitative Disease Resistance (QDR)
Quantitative disease resistances (QDR) are called quantitative because they are distributed in
segregating generations in a quantitative manner [6,7]. They are typically caused by many genes with
moderate to small effects that are highly affected by environment, plant organ, and plant developmental
stage. Since the advent of genomics, we know that QDR to most pathogens is caused by hundreds
of quantitative trait loci (QTLs) that are distributed across the whole genome. QDR results from
a restriction in the growth or development of the pathogen imposed by the host, and theoretically
it should be measured by determining the amount of pathogen in the host tissues [8]. In practice,
this is not feasible for large populations and typically, QDR is determined in multi-environmental
field trials by visual symptom rating with the inclusion of standard varieties of known resistance
level. Each genotype that is performing significantly better than a susceptible standard is called
‘quantitatively resistant’. The degree of QDR can vary from very small to nearly full resistance.
Therefore, quantitative scales of disease assessment, which are good estimators of the pathogen
development, are inevitable. This could be a simple 1 to 9 scale as preferred by plant breeders
to a 0–100% scale that allows a finer resolution. Depending on the growth stage, the same plant
genotype can have different QDR to the same pathogen species. This is notorious for Fusarium diseases
that can affect practically all cereal stages and organs, but the correlations among the respective
QDR are always poor illustrating that different sets of genes are responsible where most (but not
all) are stage specific. Most important is the adult-plant resistance. Typically, QTLs are providingInt. J. Mol. Sci. 2020, 21, 9717 3 of 22
a non-race specific resistance that is effective against all genotypes of a pathogen or even against
different pathogens
Int. J. Mol. (multi-disease
Sci. 2020, 21, resistance, MDR). The molecular basis of QDR is poorly understood,
x FOR PEER REVIEW 3 of 22
mainly because it is a multi-facetted defense system that involves hundreds of (unspecific) cellular
becauselike
processes, it is acell-wall
multi-facetted defense(lignin,
thickening system that involves
callose, hundreds of (unspecific)
glycoproteins), phytoalexins,cellular processes,
reactive oxygen
like(ROS),
species cell-wall thickening (lignin, callose,
pathogenesis-related glycoproteins),
(PR) proteins phytoalexins,
(chitinases, reactive
glucanases), oxygen species
inhibitors (ROS),
of fungal enzymes,
pathogenesis-related
detoxification of mycotoxins, (PR) lackproteins (chitinases,
of/different toxin glucanases),
receptors [9].inhibitors
Althoughofsome fungal enzymes,
of these pathways
detoxification of mycotoxins, lack of/different toxin receptors [9]. Although some of these pathways
are also used by monogenic, qualitative resistance genes, QDR typically does not comply a complete
are also used by monogenic, qualitative resistance genes, QDR typically does not comply a complete
resistance and shows no symptoms of hypersensitivity. This led to the hypothesis that QDR genes are
resistance and shows no symptoms of hypersensitivity. This led to the hypothesis that QDR genes
defeated qualitative
are defeated qualitative genes that
geneshave
that retained somesome
have retained resistance activity
resistance [10].
activity Although
[10]. Althoughthisthismight
mightapply
for some
apply for some specific examples, it cannot explain the plethora of hundreds of QDR genes detected per
specific examples, it cannot explain the plethora of hundreds of QDR genes detected
pathosystem
per pathosystem[11]. Because of the complex
[11]. Because inheritance
of the complex and theirand
inheritance non-race specifity,specifity,
their non-race QDR is thought
QDR is to be
of higher
thought durability
to be of thanhigherqualitative
durabilitydisease resistances
than qualitative that are
disease notorious
resistances thatfor
arebeing overcome
notorious by single
for being
overcome
mutations in the by pathogen
single mutations in the Although
population. pathogen it population.
is impossibleAlthough
to proveit isdurability
impossibleexperimentally
to prove
durability
before the release experimentally
of cultivars, before
therethe
arerelease
examplesof cultivars,
where QDRthere holds
are examples
for many where QDR
years holds for
[12].
many years [12].
QDR must be strictly separated from a few so-called pleiotropic APR genes that provide in
QDR must be strictly separated from a few so-called pleiotropic APR genes that provide in
wheat a non-hypersensitive adult-plant resistance against all races of multiple pathogens, because they
wheat a non-hypersensitive adult-plant resistance against all races of multiple pathogens, because
are clearly monogenically inherited as shown by recent gene cloning, like Lr34/Yr18/Sr57/Pm38 [13] or
they are clearly monogenically inherited as shown by recent gene cloning, like Lr34/Yr18/Sr57/Pm38
Lr67/Yr46/Sr55/Pm39 [14]. Typically,
[13] or Lr67/Yr46/Sr55/Pm39 they are not
[14]. Typically, theyproviding a complete
are not providing resistance,
a complete but display
resistance, a partially
but display
resistant phenotype,
a partially thus
resistant resembling
phenotype, QDR.
thus resembling QDR.
3. Basic Techniques
3. Basic forfor
Techniques Genomics-Assisted
Genomics-Assisted Breeding
Breeding
Genomics
Genomicsinclude several
include techniques
several thatthat
techniques are all
arebased on marker
all based assays
on marker of varying
assays density
of varying or sequence
density or
sequence data but the methods are highly different from their genetic requirements
data but the methods are highly different from their genetic requirements and biometrical foundations and biometrical
foundations
(Figure (Figure in
1). It all started 1).the
It all started
1980s withinQTL
the 1980s
mappingwith by
QTLthemapping
analysisbyof the analysis populations
bi-parental of bi-parentalwith a
populations with a density of about 100 markers. Starting with a F 1 plant, either higher selfing
density of about 100 markers. Starting with a F1 plant, either higher selfing generations or double-haploid
generations or double-haploid (DH) libraries are produced without any selection to map segregating
(DH) libraries are produced without any selection to map segregating QTLs.
QTLs.
Figure
Figure 1. 1.Techniques
Techniques for
forgenomics-assisted breeding
genomics-assisted (based (based
breeding on an idea
onofan
Bohra
ideaet al.
of [15],
Bohraadapted).
et al. [15],
SSR = Single sequence repeat, DArT = Diversity Array technique, SNP = Single nucleotide
adapted). SSR = Single sequence repeat, DArT = Diversity Array technique, SNP = Single
polymorphism, NGS = Next-generation sequencing, QTL = quantitative trait locus, GWAS = genome-
nucleotide polymorphism, NGS = Next-generation sequencing, QTL = quantitative trait locus,
wide association studies, MAS = Marker-assisted selection, MABC = Marker-assisted backcrossing,
GWAS = genome-wide association studies, MAS = Marker-assisted selection, MABC = Marker-assisted
MARS = Marker-assisted recurrent selection, GS = Genomic selection.
backcrossing, MARS = Marker-assisted recurrent selection, GS = Genomic selection.Int. J. Mol. Sci. 2020, 21, 9717 4 of 22
The precision of QTL mapping is mainly governed by the heritability of the trait, the population
size, and the marker density. QTL mapping is stroke by a high bias that (1) regularly overestimates
the QTL effect by about 50% and (2) does not allow to pinpoint the locus to a small chromosomal
segment [16]. A more recent advantage is the use of multi-parental populations that overcome the
problem that only two parental alleles can be analyzed in a specific background. From the definition,
at least one parent should connect the crosses [17,18]. This is also more convenient for breeding
purposes where many crosses are made, but usually only with small population sizes.
Nowadays the problem of marker density is solved by low-cost medium- to high-density marker
assays for all cereals providing 5000 (rye) to 600,000 (maize, rye) markers in one run. This allowed in
2005 the first genome-wide association study (GWAS) for disease resistances in Arabidopsis [19] and
later in all important crops. GWAS is based on diversity panels and takes advantage from historic
recombination events. Thus, much more accessions are screened with the possibility to identify new
alleles not represented in parents of bi-parental mapping populations [20]. The outcome of a GWAS is
mainly dependent on population size, but also on the crop- and genome-specific linkage disequilibrium
(LD) between marker and phenotype. As a rule of thumb, the marker density must be higher the faster
the LD decays. Consequently, a fast decay of LD allows a much more precise localization of the QTLs
than QTL mapping when marker density is sufficiently high. QTLs with non-additive genetic effects
or QTLs with rare alleles could, however, not be detected by routine GWAS.
QTL mapping and GWAS result in the detection of QTLs that can be used either directly for
marker-assisted selection (MAS) or marker-assisted backcrossing (MABC), when the effects are high
enough and reproducible in unrelated populations or for marker-assisted recurrent selection (MARS)
when the effects are only small. The latter has been shown to be successful for resistance to Fusarium
crown rot caused by Fusarium pseudograminearum that has a quantitative, complex inheritance [21].
Due to the availability of large genomic resources for grass model plants, for example rice,
Brachypodium, candidate genes can be predicted from QTLs and further functionally analyzed.
Possible candidate genes can be deduced by searching sequence data bases when the confidence
intervals of the QTLs are small enough, i.e., the study should be done with large populations,
high marker density and a high precision of phenotyping. With cloned genes, allele mining in large
breeding populations or gene banks is possible to detect alternative alleles that might provide a lower
host specificity or higher expression level. Allele mining is also useful to enhance allele diversity and
to extend possibly the durability of these genes. For QDR, however, the postulation of candidate genes
is still highly speculative in most cases.
The landmark paper of Meuwissen et al. [22] opened the avenue for genomic selection (GS) in
animal breeding, that was later adjusted also for plant breeding purposes [23]. Based on high-density
marker assays, the whole genome is scanned for effects on the investigated traits and further used
to estimate the genomic breeding value of individuals to be selected. Once the marker effects are
estimated in a large training set that is used to train GS models (= training set), non-tested genotypes
(= validation set) can be predicted and selected based on of their genome composition. This strategy
reduces large-scale phenotyping and enhances selection gains [24,25] and is especially valuable when
the trait is mainly controlled by a multitude of additive alleles with small effects [26]. A major
requirement for GS is a high genetic relationship between training and validation population that
makes it necessary to repeat the model training after each introgression of non-related material.
In many scientific papers, no real selection occurs, but predictions of the potential outcome are made
(= genomic prediction, GP). Factors, limitations and prospects of GS for quantitative traits have
been extensively reviewed (Table 1) [24–27]. The main criterion for the quality of a prediction is
the prediction ability, i.e., the correlation between the genomically predicted and the phenotypically
estimated trait values. When the prediction ability is divided by the square root of the heritability,
this is called prediction accuracy.Int. J. Mol. Sci. 2020, 21, 9717 5 of 22
Table 1. Main advantages and pitfalls1 for GS in science and breeding.
Advantages Pitfalls 1
No special population structure or segregating Same environments for testing training and
generations necessary validation sets
Usage of the full genome for trait association Creating training and validation set from the same
including small QTLs that might not surpass the base population or having a high degree of
significance level in mapping relatedness between both sets
GS data can directly be used for selection without Inclusion of non-related populations can cause severe
phenotyping changes in allele frequencies
1 leading to an incorrect estimation of prediction accuracies (over-/underestimation).
All genomic methods require extensive phenotyping with high precision because this is the
basis for estimating exact marker effects. This affords the analysis of large populations over several
locations and years that should reflect the future target environments. This is also the only way for
identifying environmentally stable QTLs that are the core element in applied breeding programs [28].
Phenotypic evaluations for QDR are usually assessed in the field in adult-plant stage and should include
artificial inoculation to ensure high disease pressure and uniform disease distribution in the experiment.
Inoculation methods should be feasible for analyzing large populations and can only be dispensed when
the environments regularly allow a high disease severity. High-throughput phenotyping, for example
by image analysis, offers a future perspective to improve trait assessment in quantitative resistances
and could make it faster and more accurate [29].
A problem of most genomic studies is an overestimation of prediction accuracy due to various
reasons (Table 1). Often, the cross-validation of genotypes is evaluated within the same environments
(locations, years). Or the detected QTLs were not validated either in independent genetic materials or at
least in an independent fraction of the genetic materials where they have been detected, e.g., in backcross
generations or by independently resampling the original populations [16]. Overestimation is also given
when a high degree of relatedness between validation and training sets occurs. In many papers 80% of a
given data set is taken as training set and used to fit a GS model to predict the remaining 20% of the same
data set as validation set. This sort of cross-validation is repeated several hundred times with randomly
varying combinations of training and validation sets. However, this procedure does not reflect real
breeding programs where a lot of new crosses of mostly small size are handled every year [28,30].
Prediction accuracies for FHB resistance in wheat, for example, dropped from a range of 0.34 to 0.63
for predictions within small bi-parental families to values from −0.31 to 0.53 for predictions across
bi-parental families [31]. However, in practical breeding, individuals of the training and validation sets
are mostly evaluated in different trials or environments, and very often disease symptoms are scored
by different people. In this case, prediction accuracies may be lower than what has been reported
in literature. Efforts must be made to optimize GS in applied breeding by constantly updating the
training set when new phenotypes and marker data are available [32]. A comprehensive discussion
on the different factors affecting prediction accuracy is available [33]. Thus, verification of QTLs is
essential before integrating them into practical breeding programs. Techniques like Kompetitive Allele
Specific PCR (KASP) or Real-Time Quantitative Reverse Transcription PCR (qRT-PCR) are available to
validate the major effect SNPs before they are incorporated into breeding populations.
4. Advantages and Challenges in Genomics of Quantitative Pathosystems
4.1. Fusarium Head Blight in Small-Grain Cereals
Fusarium head blight (FHB) is caused by Fusarium graminearum as the most frequently occurring
fungus worldwide, but in Europe F. culmorum, F. avenaceum, F. poae and others can also cause similar
symptoms. The disease not only results in yield and quality reduction, but also in contamination of
the harvest with mycotoxins that are harmful to humans and livestock, especially swine. FHB affects
all small-grain cereals with the most susceptible being durum and bread wheat, followed by triticaleInt. J. Mol. Sci. 2020, 21, 9717 6 of 22
and rye [34]. Also, barley and oats can be infected, however, the symptoms are not so easy to follow
due to the different architecture of the head or panicle. Studies with artificial infection showed high
positive genotypic correlations between FHB severity and Fusarium mycotoxin contaminations in
maize [35], wheat and rye, but not in triticale [36]. The genetic architecture of FHB resistance is
complex, affected by multiple loci, the environment and strong genotype × environment interactions
(G × E) [36,37]. This limits the success from conventional breeding.
Wheat resistance to FHB is one of the most analyzed pathosystems worldwide. In bread and
durum wheat, >550 QTLs have been described in the literature [38] that could be attributed to 65
so-called meta-QTL, i.e., QTL that were detected in several studies at the same locus (so called
“hot spots”). Only one meta-QTL on chromosome 3B was so refined that it could be used for detecting
candidate genes. Ten candidate genes for FHB resistance were found that were differentially expressed
in a resistant cultivar [38]. Two genes were encoding proteins already known to be important for
resistance (glycosyltransferase, Cytochrome P450), three were newly detected without knowing their
role and the other five encoded uncharacterized proteins. This clearly illustrates the potential, but also
the challenges for gene identification by genomic means. In the meantime, seven prominent QTLs have
been fine mapped (Fhb1-Fhb7) and Fhb1 was the first gene of this complex to be cloned [39]. Most of
these QTLs/genes were derived from FHB resistant Chinese wheat, esp. Sumai-3 and Wangshuibai
and were used worldwide for MAS. One of these QTL, however, does not suffice for a high resistance
level [40]. Four QTLs (Fhb1, Fhb2, Fhb4, Fhb5) from Wangshuibai were introgressed by MAS in 40 elite
Chinese cultivars resulting in lines with a high resistance comparable to the donor [39]. In adapted
European wheat sources, many low- to medium-effect QTLs were detected [37,38] that can also provide
a high resistance level, when they are accumulated by recurrent selection procedures. They are,
however, not useful for MAS because they are often population-dependent, in their majority not
validated for their effects and the accumulation of several resistance FHB QTLs will lead to a fixation
of large portions of the genome, thus decreasing the chance for selecting other traits [41].
For the other small-grain cereals, much less work has been done. Some QTL studies and GWAS
were done in durum wheat due to its extreme susceptibility to FHB [42–45], but for triticale only a few
studies [46–48] and for rye only one study is available [49]. In this first paper on rye, a single-locus
GWAS method detected 15 QTLs among nearly 500 partially inbred lines distributed across all
chromosomes except chromosome 7. These QTLs collectively explained about 74% of the genotypic
variance [49]. Similar results have been found in the other small-grain cereals.
Caused by the quantitative nature of FHB resistance and the underlying small- to medium-effect
QTLs in adapted materials, genomic selection (GS)/genomic prediction (GP) should facilitate the
application of genomics in improvement. A larger proportion of genetic variation may be captured by
GS than by MAS. In several recent studies, GS was compared to the traditional MAS using only QTLs
with marker effects of > 5% of genotypic variation. The GP approach outperformed MAS in most cases
as shown by studies in triticale, rye, and bread wheat [47,49–51].
The high prediction accuracies achieved in many studies are again caused by a large
average kinship between training and validation population [52–55]. It must be admitted that
prediction accuracy dropped dramatically when extending the GS models to less or even unrelated
materials [31,55]. When analyzing genomic estimated breeding values (GEBVs) among families in wheat,
highest accuracies were achieved by predicting from one half-sib family to another, while accuracies
were lowest between unrelated families and even got negative in some cases [31].
In a durum wheat study, the difference between MAS and GP was much smaller, mainly because
the variation within the population was rather small and already exhausted by 7 QTLs [42].
The authors concluded that FHB resistance might be better improved by classical high- throughput
recurrent phenotypic selection in durum wheat. Similarly, a comparison between phenotypic and
genomic selection revealed a superior prediction ability of the phenotypic selection [43]. However,
higher selection responses were found in a simulation study by using GEBVs for early generation
selection, a stage where phenotypic selection is rather unreliable caused by low single-plant heritabilityInt. J. Mol. Sci. 2020, 21, 9717 7 of 22
in this pathosystem. This would also accelerate population improvement much more than it is possible
with classical breeding strategies [43].
Prediction accuracies can be enlarged when including the most prominent QTLs in the GS model
as fixed effects (weighted GS). Especially when only a few QTLs with small to moderate cumulative
effects have been detected, the weighted GP approach results in higher predictability [31,47,56–58].
This is also of advantage, when some high-effect QTLs/genes have a correlated effect on FHB resistance,
like the semi-dwarfing gene Rht-D1 in wheat [59]. Then it is advantageous to combine data from a
GWAS into the genomic selection model for increasing the prediction accuracy when major QTLs/genes
are present [58].
While most studies are doing GP, a recently published study was the first to report realized gains
from genomic selection for FHB and STB resistances [60]. A population of 1120 winter wheat lines was
used as training set to establish the genomic model for calculating GEBVs of 2500 lines that were only
genomically analyzed. As an outcome, a genomic selection advantage of 10.6 percentage points for
FHB resistance was achieved compared to the randomly chosen subpopulation.
When GS is used in practical breeding programs to select for grain yield in early generations,
the prediction of QDR, like FHB resistance, is of no further costs because the marker data are available
already and the phenotypic data must be collected anyway.
4.2. The Septorias in Wheat
Two Septoria diseases are prevailing in wheat: Septoria tritici blotch (STB), caused by Zymoseptoria
tritici (teleomorph Mycosphaerella graminicola) and restricted to leaf symptoms, and Septoria nodorum
blotch (SNB) caused by Parastagonospora nodorum (teleomorph Phaeosphaeria nodorum) and causing
leaf and glume symptoms. Both pathogens are hemi-biotrophic and show a quantitative inheritance
although several isolate-specific genes with gene-for-gene interaction are known for Zymoseptoria (Stb
1–18) and Parastagonospora (SnTox1–7). The latter are necrotrophic effector proteins that induce necrosis
in wheat when confronted with specific wheat sensitivity genes (Snn) [61].
A GWAS of 225 wheat cultivars revealed that 11 of the 21 wheat chromosomes were associated
with for STB resistance explaining, however, only 38% of phenotypic variation [62]. This implies a
similar quantitative inheritance like FHB resistance. Further, the genetic architecture of STB resistance
was analyzed by GWAS based on a mapping population of 1055 European wheat hybrids [63].
The cross-validation study confirmed that the genetic architecture underlying STB resistance in this
population was complex with an absence of large-effect QTLs. Also, individual isolate-specific
resistance genes have not been detected in this population, because the most common resistance genes
in European wheat (Stb6, Stb15) have already been overcome by the European Z. tritici populations
and are, thus, not effective anymore [57]. Stb genes from more exotic origin, like as Stb1 originating
from a Bulgarian landrace, or Stb18 have not yet been introgressed into European elite wheat lines.
The accuracy to predict STB resistance revealed only 0.3 when using a validation set mostly unrelated
to the training set [63]. These results are in accordance with a later study of 1604 European wheat hybrids
comparing GS for STB and FHB resistances [50]. The GWAS again revealed the absence of large-effect QTLs for
both resistances. Cross-validated prediction accuracies of disease severity among unrelated hybrids amounted
to 0.58 for FHB and for 0.23 for STB resistances. Among closely related hybrids, prediction accuracy increased
substantially, but was still lower for STB resistance. Obviously, the quantitative STB resistance is inherited
even more complex than FHB resistance [50]. Accordingly, prediction accuracies of 0.45 and 0.43, respectively,
were reported when analyzing about 300 lines from different winter wheat panels [64,65]. Prediction accuracy
for STB resistance in seedling stage could be improved from 0.47 to 0.62 when all non-redundant GWAS
markers were used as fixed effects [57].
This highly complex genetic architecture of the wheat host might counterbalance the huge
genetic variation of the pathogen. This and the absence of monogenic resistance governed by Stb
genes suggests that resistance in European material is durable, because of the inheritance by a high
number of genes thus reducing the risk of the resistance to be overcome by race-specific isolates [63].Int. J. Mol. Sci. 2020, 21, 9717 8 of 22
Given the low accuracies of GS from two studies with vast wheat populations (>1000 entries, [50,63]),
phenotypic selection of quantitative STB resistance might be more encouraging than GS approaches.
The genetic control of resistance to SNB is also very complex, consisting of many loci with
additively inherited minor effects and prone to high genotype × environment interactions resulting
in only low to moderate correlations among environments [20,66]. Therefore, only a few QTLs have
been detected across environments (locations, years). For flag leaf resistance, QTLs on chromosomes
1B, 2A, 2D, and 5B and for glume resistance on chromosomes 2D and 4B were detected in successive
years [67]. A newer study with 232 genotypes of global origin detected 20 QTLs on nine chromosomes
with most QTLs detected only in one environment [20]. Only four QTLs provided resistance to several
isolates in specific environments. Accordingly, in a panel of Nordic spring wheats most of the QTLs
were detected in only one field environment and only two QTL on chromosome 2A and 2D were
found in all environments [66,68]. A QTL on chromosome 2A additionally provided resistance to both
leaf and glume blotch [68]. In addition, eight QTLs were identified in seedling stage, but only two of
them on chromosomes 4B and 7A were also significant in adult-plant stage. Considering the different
developmental stages (seedling, adult plant), the different plant organs (flag leaf, glume), and the
high interactions with isolates and environments, wheat resistance to SNB is extremely variable and
seems to be even more complex than for STB resistance explaining also the slow genetic progress by
traditional breeding [20].
4.3. Gibberella and Fusarium Ear Rots in Maize
Ear rots are major diseases in all maize-growing areas worldwide. However, the fungal
species causing the diseases are quite different. In the temperate zone of the Northern hemisphere,
F. graminearum, F. verticillioides, and F. temperatum, a new species separated from F. subglutinans, are the
main species causing ear rots [69]. The composition of species in an actual year is mainly associated
with weather conditions during silking. F. graminearum (teleomorph Gibberella zeae) causing Gibberella
ear rot (GER) prevails with cooler temperatures, the other species causing Fusarium ear rot (FER)
(teleomorph G. fujikuroi) are more prone to higher temperatures. Unfortunately, all mentioned species
produce chemically different mycotoxins with deoxynivalenol (DON) and zearalenone (ZON) being
the most prominent for F. graminearum and fumonisins (FUM) the most prominent for F. verticillioides.
All Fusarium species can infect via the silk channel during silking period and via wounds in the cob
leading to kernel infection. With rising temperatures due to global climate change the proportions of
isolated pathogens might shift to FER-causing fungi also in northwestern Europe [69] and additionally
the damage by insects might increase in frequency and severity providing an entry portal for Fusarium
spp. For these reasons, the identification of QTLs that are common among different fungal pathogens
should be favored in future to establish a broader resistance. A review on genomic studies known to
date can be found for GER [35] and FER [70].
For GER and FER, uniquely QDR has been identified to date. Several studies based on adapted
germplasm identified many QTLs that explained together 21 to 59% of the total genotypic variance [35,55,70–73].
Overlapping QTLs between GER and DON concentration are expected as both traits were highly correlated
(r > 0.86) [74,75]. Similarly, GER and ZON concentrations were correlated (r = 0.91) [76]. Indeed, two QTLs
with large effects each explaining 29 to 35% of the total genotypic variance were found on bin 1.11 and
2.04, respectively, that provided resistance against GER and additionally a low contamination by DON and
ZON [77]. Similarly, between FER resistance and FUM concentrations high genotypic correlations were found
(r = 0.74–0.84) [78]. However, also specific genes might additionally play a role in GER resistance and reduced
mycotoxin accumulation [35]. Nevertheless, for the large populations handled by practical breeding in early
stages, a selection for low ear rot severity should suffice. The much lower number of experimental hybrids in
later stages could be analyzed also for mycotoxin contents, e.g., by NIRS or immunotests [75].
In a first validation study for QTLs on GER resistance, six QTLs identified in a previous mapping
study were introgressed into two different genetic backgrounds [79]. The validation rate was,
unfortunately, low which indicates that the QTLs identified were population specific. This is furtherInt. J. Mol. Sci. 2020, 21, 9717 9 of 22
substantiated by the fact that different QTLs were validated across several bi-parental mapping
populations. However, two meta-QTL analyses resulted in common QTLs localized in bins 2.08, 3.04,
and 4.08, some of them were valid even for GER, FER and Aspergillus ear rot resistance together [80,81].
Genomic analyses of exotic germplasm may introduce new sources of resistance alleles to adapted
European germplasm [35]. Tropical and subtropical maize as well as popcorn populations are possible
sources of resistance alleles for ear rot for temperate maize breeding pools [82] and should be explored
to achieve higher resistance levels. However, only a few studies exploiting genetic resources to
increase GER resistance have been reported previously (e.g., [80,82]). By conducting multi-parent
QTL mapping, one QTL on bin 1.02 was identified which was overlapping across several populations
and continents (Brazil/Europe) as well as across environments within continents and across line and
testcross performance with an explained genotypic variance of 10–22% depending on the situation [83].
In total, four QTLs have been found in this study within Brazilian or European environments. This low
number of QTL might be caused by the high diversity of European environments in Germany, Austria,
Northern France and Northern Italy or just illustrate the highly polygenic and complex genetic
architecture that even could hinder to find any QTL in a GWAS [78].
Another valuable genetic resource are European flint landraces. Higher phenotypic variation and
broad-sense heritabilities within landraces than among elite lines were reported for FER severity [84]
by evaluating 389 DH lines from six European flint landraces and 53 elite flint lines in a GWAS.
Also in a second study where a GWAS was undertaken with 500 DH lines from two flint landraces,
maximum phenotypic variation was found in the Austrian landrace “Kemater Landmais gelb” (KE)
and the German landrace “Petkuser Ferdinand rot” (PE) [85]. In the GWAS, however, PE showed
no significant QTL, while KE revealed eight QTLs explaining together 34% of genotypic variation.
Interestingly, a GP procedure revealed similar prediction accuracies for lines from both landraces
implying that many small effects failed to pass the significance threshold due to limited detection
power. The GP procedure weighted with the most significant QTLs was about 20% better than MAS
in KE [85]. GP was also recommended for improving FER resistance by claiming the shortening of
generation intervals and reducing laborious QDR evaluation in the field as main advantages [86].
Genetic relationship between training and validation populations plays a major role also in maize.
When analyzing European maize with 130 dent lines and 114 flint lines for GER resistance and DON
contents, prediction accuracies for DON content were 0.66 within the dent pool and 0.45 within the
flint pool [72]. They dropped for the prediction across pools to 0.1 for the dent lines and even got
negative for the flint lines. Accordingly, no common QTL was localized in the two European heterotic
groups, flint and dent. A combined-pool GP had no higher accuracy than within-pool GP, regardless of
the statistical model used. In accordance with this finding, using only DH lines from one landrace
to predict GER resistance in the other landrace was also not promising at all [85]. In another study
involving six European maize landraces, GP between pairs of DH libraries resulted in prediction
accuracies of approximately zero for all landraces and six agronomic traits analyzed [87]. However,
prediction accuracies improved when the TS and vs. contained lines from both landraces.
A possible solution to optimize results from genomic studies is to combine different analytical
methods to overcome the inherent weaknesses of each individual method [35,81]. For example,
candidate genes for GER resistance among recombinant inbred lines derived from bi-parental crosses
were identified by combining QTL mapping with transcriptomic (RNA-seq) approaches [88]. Also,
QTL results can be used to predict candidate genes by in silico-mapping. A major prerequisite, however,
is that the QTL region is small enough. Therefore, after a normal QTL study, a fine mapping should be
done to further restrict the QTL region. This is especially valid in cross-pollinated crops like maize
because the QTL interval can be narrowed down here rather effectively. Also, association mapping
provides a complementary tool for identifying candidate genes when a region was fine mapped.
By using diversity panels, significant SNPs within the fine-mapping interval can be found where
the underlying candidate genes might be detected [89]. The analyzed diversity panel was then usedInt. J. Mol. Sci. 2020, 21, 9717 10 of 22
as training population for GP. Candidate genes can be further investigated by expression analyses,
resequencing, and testing across different germplasm sets [90].
4.4. Northern Corn Leaf Blight (NCLB) in Maize
Northern corn leaf blight (NCLB) is caused by the hemi-biotrophic ascomycete Setosphaeria turcica
(syn. Helminthosporium turcicum, anamorph: Exserohilium turcicum). In Europe, NCLB was originally
restricted to the Mediterranean regions, but at the 1990s the disease crossed the Alps and appeared in
southern Germany in 1995 [91]. The disease rapidly expanded and became the most important leaf
disease of maize in Northwestern Europe. The fungus and the disease are also distributed in many
other maize-growing areas [91,92].
Resistance to NCLB can be both qualitatively and quantitatively inherited [92]. The employment
of qualitative resistance genes (mainly Ht1, Ht2, Ht3) already led to directional selection in the European
pathogen populations and resulted in regionally different virulence patterns [93] making some of the
main Ht genes and their combinations already ineffective. QDR, therefore, should provide a more
durable resistance. In all QTL studies reported so far, many small to medium-sized QTLs have been
reported distributed across all ten maize chromosomes with mainly additive gene action [92]. In several
mapping studies, four to 14 QTLs have been assigned to mean disease severity. Additionally, 12 and
19 QTLs were identified for the resistance traits area under disease progress curve (AUDPC) and final
disease rating, respectively, with some QTLs being assigned to two to three traits simultaneously [94].
This corresponds to high phenotypic correlations among the traits (r ≈ 0.8) [95].
High levels of quantitative NCLB resistance have been detected in non-adapted (sub)tropical
materials [96–98] that might be used for widening the resistance diversity in European maize. In a
multi-parental QTL mapping, 17 QTLs distributed along the ten chromosomes were identified, each QTL
explaining 3.6 to 32.0% of the genotypic variance [98]. Most of the resistance alleles originated from
Brazilian donors and reduced NCLB severity between 0.3 to 2.5 scores on the 1–9 severity scale.
None of the known Ht genes have been identified in this genetic material by associated markers or
known DNA sequences. Because always local pathogen populations have been used comprising a
wide range of virulences [98] the described resistances should be quantitatively inherited. This is
important, because otherwise the occurrence of effective monogenic resistances would mask small,
quantitative effects. Two QTLs on bins 7.03 and 9.04 were identified in Brazil and Europe as well
although ecosystems were highly distinct, illustrating another form of QTL stability. As in the other
crops, prediction accuracies for NCLB dropped, on average, from 0.55 for within-family prediction
to 0.20 when totally unrelated materials were predicted [98]. Because of the long-standing epidemic
infections of subtropical maize with NCLB there should be more resistance sources to detect after this
pivotal first study.
At least 197 QTLs were reported for NCLB resistance to date when combining 27 publications.
Only QTLs resulting from the analysis of at least two environments and a minimal population size
of 100 genotypes were considered (see Supplementary Materials). Basically, all chromosomes were
involved in resistance QTLs. Localizing these QTLs in the maize genome clearly shows that there are
hotspots for this resistance with up to 7 QTLs detected in the same bin (Figure 2).
In such studies, also agronomic traits should be considered that might interact with QDR,
especially plant height and genes for plant development. Several QTLs controlling maturity and
the gene vgt1 (flowering time) were also mapped on bin 8.05 [98–100]. The presence of QTLs for
resistance and maturity on the same bin could reflect resistance in late maturity genotypes because of
the preference of S. turcicum for senescent tissue.
These hotspots could correspond to a common gene or to multiple clustered genes [29,101]
and emerge as promising regions to explore the underlying resistance mechanisms with a higher
resolution [90,102]. For example, on bin 1.02, the gene ZmREM6.3 encodes a REM protein. These proteins
regulate the size exclusion limit of plasmodesmata and could restrict the movement of the pathogen in
the host [102]. Some of the hotspots might be caused by the independent detection of the same QTLcrops, prediction accuracies for NCLB dropped, on average, from 0.55 for within-family prediction
to 0.20 when totally unrelated materials were predicted [98]. Because of the long-standing epidemic
infections of subtropical maize with NCLB there should be more resistance sources to detect after this
pivotal first study.
At least 197 QTLs were reported for NCLB resistance to date when combining 27 publications.
Int. J. Mol. Sci. 2020, 21, 9717 11 of 22
Only QTLs resulting from the analysis of at least two environments and a minimal population size
of 100 genotypes were considered (see supplementary material). Basically, all chromosomes were
involved
in different in resistance
populations. QTLs. Localizing
This these QTLsasinathe
can be interpreted sortmaize genome clearly
of independent shows that
validation that could
there are
be
hotspots for introgression
valuable this resistancebreeding.
with up to 7 QTLs detected in the same bin (Figure 2).
Bin Chr. 1 Chr. 2 Chr. 3 Chr. 4 Chr. 5 Chr. 6 Chr. 7 Chr. 8 Chr. 9 Chr. 10
00 0 2 0 0 0 0 0 0 0 0
01 3 2 3 0 1 2 0 0 1 0
02 5 5 1 0 2 0 5 2 2 0
03 5 2 2 3 3 0 4 7 6 1
04 3 2 4 2 8 2 3 1 2 3
05 6 2 2 3 5 4 1 5 2 2
06 6 2 4 1 5 1 0 5 3 0
07 4 3 0 1 2 2 1 0 0
08 3 1 2 5 0 0 1 0
09 2 0 3 0 0 0
10 4 0 2 0
11 3 0
12 0
2. Number
Figure 2.
Figure NumberofofQTLs
QTLs forfor
resistance to NCLB
resistance according
to NCLB to the to
according literature; the intensity
the literature; of color represents
the intensity of color
the number of QTLs found in the same bin (for details please refer to Supplementary Materials).
represents the number of QTLs found in the same bin (for details please refer to supplementary
material).
5. Detection of Multi-Disease Resistance (MDR)
All crops are affected by more than one disease at the same time. Thus, loci conferring multi-disease
resistance (MDR) should be under a strong selection pressure and are a highly valuable goal for plant
breeding. MDR, also called broad-spectrum resistance, was defined as the resistance of a host either to
many races of one pathogen (= non-race specific resistance) or resistance to more than one pathogen
species [103]. In this review we will concentrate on the latter definition. MDR might be genetically
controlled by pleiotropy, pyramiding of several unlinked genes/QTLs conferring resistance to single
diseases, or the presence of clusters of resistance genes in the genome [103]. A fourth, special cause could
be the introgression of alien chromosomes that show a reduction or even absence of recombination,
like in wheat translocation lines with the rye chromosome 1RS segment, where several rust and mildew
resistances are located [104]. For the other mentioned cases, also practical examples are known from
wheat. Pleiotropic broad-spectrum resistance genes, like Lr34/Yr18/Sr57/Pm38, Lr46/Yr29/Sr58/Pm39,
Lr67/Yr46 and Sr2/Yr30, are widely exploited in international breeding [105]. They confer a moderate
level of MDR to leaf rust (Lr), yellow (stripe) rust (Yr), stem rust (Sr), powdery mildew (Pm) and even
some hemi-biotrophic fungi.
Besides these rare monogenic examples, also MDR for QDR have been detected. Two out of
110 CIMMYT lines were highly resistant to five wheat diseases, including FHB [106]. MDR loci for
resistance to tan spot (caused by Pyrenophora tritici-repentis) and SNB have been found in 88 out of a
panel of 825 wheat accessions from the USDA [107]. However, in both studies, no molecular analyses
of the genes/QTLs underlying MDR have been performed. In a GWAS, ten of the 35 detected QTLs
conferred resistance to each of two diseases (leaf rust, stem rust, and yellow rust, yellow leaf spot, STB,
crown rot) [108]. In an independent GWAS of 158 winter wheat accessions, about 10% of the cultivars
had superior resistance to yellow rust, stem rust, powdery mildew, and FHB simultaneously [109].
Nine QTLs explaining 62% of the total genotypic variation were detected for MDR. Only three of them
were also found as QTLs for a single disease resistance. This might be a hint on genomic regions
caused by “real” MDR and not only by pyramiding independent loci that are triggered by the strong
selection of the breeders for combined resistances. In another study, among 125 synthetic hexaploid
wheats a wide range of genetic variation was observed for two to five biotic stresses with 17 lines
being resistant to more than one disease [110]. The corresponding GWAS detected 124 significant
marker-trait associations for multiple biotic stresses and 33 of these were found within known genes.Int. J. Mol. Sci. 2020, 21, 9717 12 of 22
Several meta-analyses have suggested that MDR loci are relatively common in maize [111,112].
The latter study demonstrated that many QTLs are not randomly distributed over the maize genome,
but clustered in specific regions. More recently, this trend was confirmed by organizing the distribution
of 1080 QTLs for disease resistances mapped in 110 studies [113]. Chromosome 1 and 3 were revealed
carrying the highest proportion of QTLs for resistance. Currently, a multiple diseases approach instead
of analyzing single disease resistances is increasingly getting attention. Different authors combined the
localization of single-disease QTLs finding candidate regions for MDR on the following bins: 1.02,
1.05/1.06, 3.04, 4.06, 7.02, 8.03, 8.05 and 9.02 [29,90,100,113–117]. Some of these regions overlap with
hotspots for resistance to NCLB presented in Figure 2. Obviously, some mechanisms underlying QDR
are unspecific and common for several diseases. Some regions also presented contrasting effects for
resistances to bacterial and fungal diseases [115].
The maize chromosome bin 1.02 has been identified as a region that confers resistance to a number of
maize diseases such as GER [83], ear and stalk rot (caused by multiple pathogens), common smut (caused
by Ustilago maydis), gray leaf spot (GLS, caused by Cercospora zeae-maydis) [118,119], southern corn
leaf blight (SCLB, caused by Bipolaris maydis, syn. Helminthosporium maydis), NCLB, Stewart’s wilt
(caused by Pantoea stewartii) and common rust (caused by Puccinia sorghi) [102,112,120]. The latter
study investigated candidate genes at this region enhancing the accumulation of callose and phenolic
components around infection sites [120], an unspecific defense mechanism that might be helpful
against all of these pathogens. More recently, 37 QTLs were identified for NCLB, SCLB, and GLS
resistances in two maize populations, four QTLs overlapped for each of two diseases [121].
Another hotspot seems to be maize bins 1.05/1.06, where resistance to NCLB, Stewart’s wilt, SCLB,
common rust, GLS, and ear and stalk rot caused by multiple fungi have been detected [90,100,112,114,115,120].
The bin 1.06 was reported by several authors for NCLB resistance (rf. to Figure 2) and the dominant Stewart’s
wilt resistance gene Sw1 had been mapped in the same genomic region [90]. A subsequent fine mapping of
this chromosomal region resulted in overlapping regions for both diseases. The association study revealed
the candidate genes pan1 that might be a susceptibility gene for NCLB and Stewart’s wilt underlying this
QTL [90]. Additionally, copy number variation was found as a structural element of this genomic region.
Also, bin 8.05–8.06 harbors QTL and genes for resistance to many diseases, among them NCLB,
SCLB, GLS, common rust, common smut, maize streak virus, and aflatoxin accumulation [122].
Several resistance gene analogs and defense response gene homologs were identified in this region as
well as the Ht2 gene for NCLB resistance.
A few other MDR loci have been assigned to candidate genes, among them a glutathione
S-transferase (GST) gene for resistance to SCLB, NCLB, and GLS [116]. More recently, a QTL in bin
9.02 was associated by genomic techniques with a caffeoyl-CoA O-methyltransferase (ZmCCoAOMT2),
a gene conferring QDR to both SCLB and GLS being in connection with the phenylpropanoid pathway
and lignin production [117]. This is another example for a MDR gene that might encode an unspecific
disease resistance mechanism.
In conclusion, we are just at the starting point of understanding the mechanisms of MDR.
Some MDR QTLs split into many QTLs/genes when fine mapped, others are associated with genes
conferring unspecific resistance reactions and in some cases resistance genes are present in varying
copy numbers.
6. Integration of Genomic Data in the Ongoing Breeding Process
The art of breeding is to integrate new genomic-based methods into existing breeding schemes
to speed up the process and make it more efficient. Here, we will discuss two important aspects:
Genomics-based introgression of genetic resources and genetic improvement within elite populations.
6.1. Introgression of Genetic Resources
Genetic resources are a valuable tool to expand genetic variation in highly selected elite populations,
especially for resistance breeding. The occurrence of new diseases or new races of a well-knownInt. J. Mol. Sci. 2020, 21, 9717 13 of 22
pathogen often makes it necessary to find new resistance sources among non-adapted materials.
Possible sources are old landraces or foreign materials that are less or even not adapted to the target
region. In either case, adaptation breeding is essential with highly heritable traits, like flowering date,
plant height, lodging tolerance etc., selected first.
In hybrid breeding, it must be additionally admitted that DH lines derived from non-adapted,
non-inbred materials suffer from a remnant genetic load that leads to highly undesirable agronomic
phenotypes
Int. J. Mol. such as21,low
Sci. 2020, x FORemergence
PEER REVIEWrate, poor growth rate, lodging, poor seed set, and 13 low
of 22grain
yield [84,123]. Inbreeding depression among DH lines can also result in unwanted traits such as high
[84,123]. Inbreeding depression among DH lines can also result in unwanted traits such as high leaf
leaf chlorosis, tillering, extreme susceptibility to diseases such as ear rots, common smut (Ustilago maydis)
chlorosis, tillering, extreme susceptibility to diseases such as ear rots, common smut (Ustilago maydis)
and common rust (Puccinia sorghi) [123]. Using materials from foreign regions may additionally afford
and common rust (Puccinia sorghi) [123]. Using materials from foreign regions may additionally
adaptation to day length
afford adaptation and
to day agronomic
length practices.
and agronomic practices.
Therefore,
Therefore, introgression of resistancealleles
introgression of resistance alleles from geneticresources
from genetic resources intointo elite
elite materials
materials should
should
targettarget
resistant lines having better agronomic properties, to reduce the effect of
resistant lines having better agronomic properties, to reduce the effect of detrimental alleles. detrimental alleles.
UsingUsing
European
European flintflint
landraces
landraces asasa asource,
source,led
led to the exclusion
to the exclusionofofclose
closeto to
70% 70% of the
of the produced
produced DH DH
lines lines
becausebecause of their
of their highhigh inbreedingdepression
inbreeding depression [84].
[84].
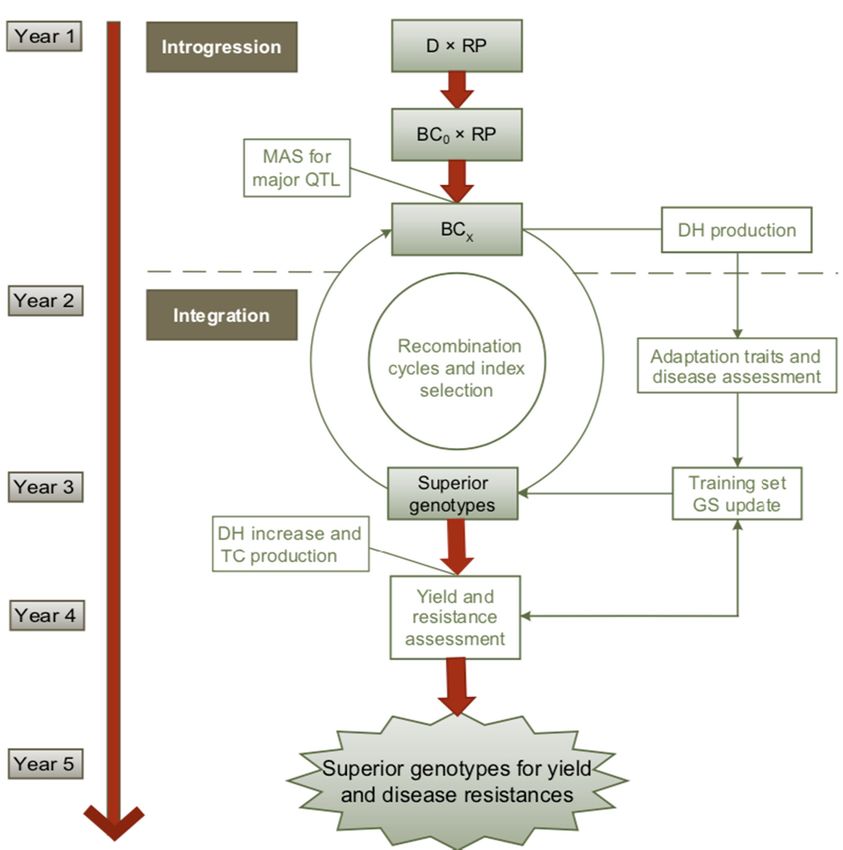
In anInintegrated
an integrated scheme
scheme withmaize
with maize as
as an
an example
example (Figure
(Figure3),3),
firstly, thethe
firstly, resistance donor
resistance is
donor is
introgressed by backcrossing to the recurrent parent (RP) and by selection of
introgressed by backcrossing to the recurrent parent (RP) and by selection of the major QTLs by MAS. the major QTLs by MAS.
When only small-effect QTLs are available the introgression part can be confined to backcrossing
When only small-effect QTLs are available the introgression part can be confined to backcrossing
without marker selection.
without marker selection.
Figure 3. Schematic
Figure 3. Schematicillustration
illustrationofofa arapid
rapid genomics-assisted breeding
genomics-assisted breeding approach
approach for for using
using genetic
genetic
resources in maize
resources in maize D = donor
[124].[124]. of resistance,
D = donor RP =RP
of resistance, recurrent parent,
= recurrent BC =,
parent, BCbackcross, MAS
=, backcross, = marker
MAS =
assisted selection,
marker assistedDH = doubled
selection, DH = haploid
doubled lines,
haploid = genomic
GSlines, selection,
GS = genomic TC =TC
selection, testcross.
= testcross.
In theIn integration
the integrationstep, GSGSisisperformed
step, performed in in a recurrent
recurrentselection
selection scheme
scheme to rapidly
to rapidly selectselect
for for
adaptation
adaptation traitstraits
and and disease
disease resistances.
resistances. TheThe training
training populationcan
population canbebedeveloped
developed in parallel
parallelto
toaa first
first phenotypic
phenotypic selectionselection
cycle or cycle or byhistorical
by using using historical datathe
data from from
samethe resistance
same resistance sources.
sources. To
To establish
establish
or update theor update set,
training the atraining set, a large-scaled
large-scaled DH production DH production
and intensiveand intensive phenotyping
phenotyping for
for adaptation
traitsadaptation traits and resistance to the targeted diseases are necessary. The outcome of the training
and resistance to the targeted diseases are necessary. The outcome of the training set is then
set is then the basis for genomic prediction of superior DH lines. They are multiplied and crossed to
testers to select superior hybrids for yield and other complex traits on testcross basis. The timeline
refers to the selection on BC1 and two generations per year. The cycle might be longer if more BC
generations are necessary when afforded by a low adaptation of the genetic resources to the target
environments.You can also read