Microbiomes attached to fresh perennial ryegrass are temporally resilient and adapt to changing ecological niches
←
→
Page content transcription
If your browser does not render page correctly, please read the page content below
Huws et al. Microbiome       (2021) 9:143
https://doi.org/10.1186/s40168-021-01087-w

 RESEARCH                                                                                                                                            Open Access

Microbiomes attached to fresh perennial
ryegrass are temporally resilient and adapt
to changing ecological niches
Sharon A. Huws1,2* , Joan E. Edwards2,3,4, Wanchang Lin2, Francesco Rubino1, Mark Alston5, David Swarbreck5,
Shabhonam Caim6, Pauline Rees Stevens2, Justin Pachebat2, Mi-Young Won1, Linda B. Oyama1,2,
Christopher J. Creevey1,2† and Alison H. Kingston-Smith2†

  Abstract
  Background: Gut microbiomes, such as the rumen, greatly influence host nutrition due to their feed energy-
  harvesting capacity. We investigated temporal ecological interactions facilitating energy harvesting at the fresh
  perennial ryegrass (PRG)-biofilm interface in the rumen using an in sacco approach and prokaryotic
  metatranscriptomic profiling.
  Results: Network analysis identified two distinct sub-microbiomes primarily representing primary (≤ 4 h) and
  secondary (≥ 4 h) colonisation phases and the most transcriptionally active bacterial families (i.e Fibrobacteriaceae,
  Selemondaceae and Methanobacteriaceae) did not interact with either sub-microbiome, indicating non-cooperative
  behaviour. Conversely, Prevotellaceae had most transcriptional activity within the primary sub-microbiome (focussed
  on protein metabolism) and Lachnospiraceae within the secondary sub-microbiome (focussed on carbohydrate
  degradation). Putative keystone taxa, with low transcriptional activity, were identified within both sub-microbiomes,
  highlighting the important synergistic role of minor bacterial families; however, we hypothesise that they may be
  ‘cheating’ in order to capitalise on the energy-harvesting capacity of other microbes. In terms of chemical cues
  underlying transition from primary to secondary colonisation phases, we suggest that AI-2-based quorum sensing
  plays a role, based on LuxS gene expression data, coupled with changes in PRG chemistry.
  Conclusions: In summary, we show that fresh PRG-attached prokaryotes are resilient and adapt quickly to changing
  niches. This study provides the first major insight into the complex temporal ecological interactions occurring at the
  plant-biofilm interface within the rumen. The study also provides valuable insights into potential plant breeding
  strategies for development of the utopian plant, allowing optimal sustainable production of ruminants.
  Keywords: Rumen, Bacteria, Archaea, Biofilm, Microbiome, Temporal, Colonisation, Metatranscriptome, Ecology, Niche

* Correspondence: S.huws@qub.ac.uk
†
 Christopher J. Creevey and Alison H. Kingston-Smith contributed equally to
this work.
1
 Institute of Global Food Security, School of Biological Sciences, Queen’s
University Belfast, 19 Chlorine Gardens, Belfast BT9 5DL, Northern Ireland, UK
2
 Institute of Biological, Environmental and Rural Sciences, Aberystwyth
University, Aberystwyth SY23 3FG, UK
Full list of author information is available at the end of the article

                                         © The Author(s). 2021 Open Access This article is licensed under a Creative Commons Attribution 4.0 International License,
                                         which permits use, sharing, adaptation, distribution and reproduction in any medium or format, as long as you give
                                         appropriate credit to the original author(s) and the source, provide a link to the Creative Commons licence, and indicate if
                                         changes were made. The images or other third party material in this article are included in the article's Creative Commons
                                         licence, unless indicated otherwise in a credit line to the material. If material is not included in the article's Creative Commons
                                         licence and your intended use is not permitted by statutory regulation or exceeds the permitted use, you will need to obtain
                                         permission directly from the copyright holder. To view a copy of this licence, visit http://creativecommons.org/licenses/by/4.0/.
                                         The Creative Commons Public Domain Dedication waiver (http://creativecommons.org/publicdomain/zero/1.0/) applies to the
                                         data made available in this article, unless otherwise stated in a credit line to the data.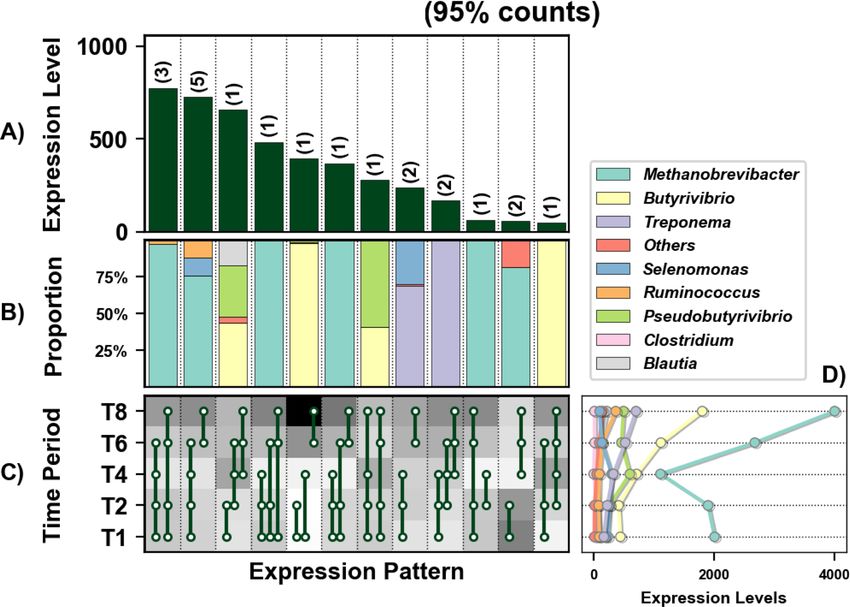
Huws et al. Microbiome   (2021) 9:143                                                                            Page 2 of 17

Introduction                                                    benefit from the mutualistic cooperation displayed by
Vertebrates play host to a complex gut microbiome, gen-         other microbes [23]. Interestingly, cheating behaviour
erally dominated by a few well-studied groups, but with         may not only benefit the cheater but also can help main-
a large ensemble of minor microbial species whose con-          tain biodiversity [24], therefore may play an important
tribution are only recently starting to be revealed [1–4].      role in the stability or resilience of complex ecosystems
Whilst it is generally accepted that distinct microbiomes       like the gut of vertebrates.
exist in distal locations in the gut, it is not clear whether      In order to understand these temporal ecological inter-
a single location could simultaneously play host to mul-        actions at the plant-microbiome interface in the rumen,
tiple sub-microbiomes with distinct temporal and/or             we used prokaryotic metatranscriptomics and gene net-
functional roles. Neither do we fully understand the im-        work analysis of the attached microbial community on
portance of ecological interactions in these environ-           fresh perennial ryegrass (PRG) incubated in sacco in the
ments. Elucidating these temporal niche-specialised             rumen over an 8-h period. For the first time, we provide
interactions could drive the generation of new strategies       in-depth, gene expression-based understanding of the
for targeted manipulation of vertebrate gut microbiomes         ecological interactions governing temporal niche special-
for therapeutic, productivity or environmental benefits.        isation, cooperation and competition within the PRG-
   The rumen is a case in point and is the largest com-         attached rumen microbiome. This knowledge is essential
partment of the ruminant forestomach, housing a com-            for understanding microbial drivers of energy-harvesting
plex microbiome that has a major impact on host                 capacity, which influence ruminant feed efficiency and
nutrition and health [5]. This anoxic microbial ecosys-         emissions, as well as facilitating breeding of improved
tem has evolved to harvest energy from largely recalci-         PRG cultivars for ruminant livestock.
trant, complex plant carbohydrates [5–9]. Rumen
microbes commonly exist as biofilms on feed particles           Methods
consumed by the host [10–13] and microbes within bio-           Growth and preparation of plant material for in sacco
films have been shown to interact intimately and influ-         incubations
ence each other’s evolutionary fitness in many ecological       PRG (Lolium perenne cv. AberDart) was grown from
niches [9, 14–16]. Indeed, whilst the rumen microbes            seed in plastic seed trays (length 38 cm × width 24 cm ×
generally function symbiotically, they also compete             depth 5 cm) filled with soil/compost (Levington’s Gen-
against each other for evolutionary advantage [9, 17].          eral Purpose). Plants were kept in a greenhouse under
   Using rrn operon-based approaches and microscopy,            natural light with additional illumination provided (mini-
we have previously demonstrated that rumen bacteria             mum 8-h photoperiod). Temperature was controlled (22/
and anaerobic fungi attach rapidly to PRG [6, 18, 19],          19 °C day/night) and plants were watered twice a week.
with biofilms being evident within 5 min [11]. Colonisa-        Plants were harvested after 6 weeks by cutting them
tion by bacteria thereafter is biphasic, with primary (≤ 4      (approx. 3 cm above soil level) directly before use, and
h) and secondary (≥ 4 h) colonisation phases previously         then further processing them into 1cm sections using scis-
described based on metataxonomy [10, 20]. We hy-                sors. Triplicate samples of harvested plant material were
pothesise that these distinct temporal bacterial colonisa-      also snap frozen in dry ice and stored at – 80 °C for profil-
tion phases represent the interaction of multiple,              ing of plant epiphytic prokaryotes (0-h samples).
coherent and yet temporally distinct sub-microbiomes.
Whilst these interactions are frequently categorised as         Ruminal in sacco incubations
positive (e.g. mutualism), neutral (i.e. resulting in no ef-    Three mature, rumen-cannulated, non-lactating Holstein
fect) or negative (e.g. competition) [21, 22], it is becom-     × Friesian cows were used for this experiment. The ex-
ing clear that ecological interactions in highly complex        periment was conducted with the authority of licences
environments can also result in combinations of positive,       under the United Kingdom Animal Scientific Procedures
neutral and negative outcomes, for example amensalism           Act, 1986, and managed according to the protocols ap-
in which the actor experiences no benefit or detriment          proved by the Aberystwyth University Animal Welfare
and the recipient experiences a negative outcome or             and Ethics Review. For 2 weeks prior to the experiment,
commensalism when the converse is true [21]. Added to           cows were fed a diet of straw and grass silage ad libitum
this, keystone taxa are likely to have an important role        (~ 6.5 kg dry matter day−1) and were permitted field
mediating mutually beneficial interactions which may be         grazing on a permanent ryegrass pasture for at least 4 h/
disproportionate to their population size and the loss of       day. For the duration of the experiment, animals were
these taxa would have a profound impact upon the eco-           fed silage daily in two equal meals at 07:00 and 16:00
system [1]. Finally, cheating behaviour is also likely to       and had constant access to straw when not field grazing.
exist in such complex microbiomes, in which little co-            The nylon bag technique was used as described previ-
operation is displayed by the ‘cheater’ but they gain           ously [25, 26]. Stitched nylon bags (10 cm × 20 cm) of
Huws et al. Microbiome   (2021) 9:143                                                                          Page 3 of 17

100-μm2 pore size were filled with 15 g (fresh weight) of     prokaryotic mRNA was prepared for sequencing using
the processed 1-cm length PRG and sealed at all perime-       the TruSeq stranded mRNA library prep kit (Illumina,
ters by heating (Impulse sealer, American Int, Nl Elec-       California, USA) following the manufacturer’s guidelines.
tric, USA). For each cow, 10 bags were then connected         Subsequently, library sequencing was completed using
to a 55-cm plastic-coated flexible cable with lacing cords    the Illumina HiSeq 2500 (Illumina, California, USA) and
and then placed in the rumen before being attached to         a 100-bp paired-end sequencing approach.
the cap of the fistula. Bags were placed simultaneously
in the rumen of each cow shortly after animals were of-       Metatranscriptome assembly
fered their first silage meal of the day, and two bags were   A flow diagram showing the steps taken to prepare and
removed after 1, 2, 4, 6 and 8 h of incubation then proc-     analyse the sequences obtained is shown in Supplemen-
essed by washing with distilled water (500 mL added to        tary Figure 1. Essentially, the assembly was performed
plant material within bags and bags gently squeezed           through a series of steps in order to reduce the complex-
thereafter) to remove loosely attached microbes followed      ity of the process. First, the quality of raw reads was
by immediate freezing in dry ice and storage at – 80 °C       evaluated with FastQC [28] version 0.10.1, and subse-
until RNA extraction.                                         quently trimmed using Trimmomatic [29] by 9 base
                                                              pairs at the 5′ end and 3 base pairs at the 3′ end, includ-
RNA extraction                                                ing remaining adapters. Following this step, the removal
Frozen samples were ground to a fine powder under li-         of any remaining rRNA contamination was performed
quid nitrogen and then RNA was extracted using a hot          using MGKit (script rRNA-protozoa.py [30];) and a cus-
phenol method [27]. Essentially, aquaphenol (10mL) was        tom database of rRNA sequences built by retrieving (i)
added to the ground sample and then the sample was in-        the RDP databases for archaea, bacteria and fungi [31],
cubated at 65 °C for 1 h. Tubes were inverted before          release 11_2 and (ii) rRNA genes from protozoan species
chloroform was added (5 mL). Tubes were centrifuged           from the EBI-ENA, This custom database was used with
(5,000×g for 30 min at 20 °C) and then the upper phase        bowtie2 (2.1.0) [32] using the ‘--no-mixed --local --sensi-
was removed, then the procedure was repeated by the           tive-local -N 1’ options, saving only the unaligned and
addition of more chloroform (5 mL) and centrifugation.        hence non-rRNA reads (using the ‘--un-conc-gz’ option)
Lithium chloride (2 M final concentration) was then           to files. The retained reads were then aligned to the draft
added, to remove any contaminating DNA, and samples           Lolium perenne genome [33] using bowtie2 and the
stored overnight at 4 °C. Samples were subsequently           same settings, retaining only those reads that did not
centrifuged (13,000×g for 30 min at 4 °C) and the super-      align to the genome. To utilise the availability of fully se-
natant discarded, then the procedure was repeated to          quenced prokaryotic genomes from cultured organisms,
ensure all DNA was removed. Once the supernatant was          all reads that aligned (using the aforementioned options)
discarded the pellet was resuspended in ice-cold 80%          to a collection of 246 publicly available genomes, in par-
ethanol and centrifuged (13,000×g for 15 min at 4 °C),        ticular from the Hungate1000 collection [34] (list of ge-
this was repeated twice before the pellet was air-dried       nomes available in Supplementary Excel 1), were not
and resuspended in molecular-grade water. The absence         included in for de novo assembly and instead were
of DNA in all samples was confirmed using 16S rDNA            retained for later inclusion in the expression quantifica-
PCR using non-barcoded primers and subsequent agar-           tion stage.
ose gel electrophoresis as described in Huws et al., [10].       The first step of the meta-transcriptome assembly of
The quality and quantity of retrieved RNA was assessed        non-aligned reads involved digital normalisation to re-
using the Experion automated electrophoresis system           duce the bias from more abundant transcripts in the
and a RNA StdSens Analysis kit (Bio-Rad Ltd., UK).            samples. The khmer package (version 2.1.2) [35] was
                                                              used in a two-step procedure. First, the reads were nor-
rRNA removal and metatranscriptome sequencing                 malised on a per-sample basis using the normalise-by-
Prokaryotic mRNA was enriched in all samples by firstly       median.py script (with the options -p, -k 20, -N 4, -x
removing the polyA fraction of the mRNA pool using a          16e9, -C 20). Afterwards, a collective normalisation was
MicroPoly(A)Purist kit (Ambion) according to the man-         carried out pooling all per-sample normalised reads. The
ufacturer’s protocol. Eukaryotic 18S rRNA was then            same parameters as the per-sample normalisation were
minimised using both the RiboMinus plant and                  used, except for -x (an option to define the hash table
eukaryote kits (Invitrogen, Carlsbad, USA) according to       size), which was set to 32e9 to account for the larger size
the manufacturer’s protocols. Finally, 16S rRNA was           of the input data. Following digital normalisation, an
minimised using the Ribo-Zero rRNA removal kit for            overall assembly was carried out using velvet version
bacteria (Epicentre, Madison, USA) according to the           1.2.10 [36] with a kmer size of 31 and automatic ex-
manufacturer’s protocol. The resulting enriched               pected coverage (-exp_cov auto). Finally, alignments of
Huws et al. Microbiome (2021) 9:143 Page 4 of 17
all the reads used in the assembly to the final resulting correspond at least to 20% of the smallest homologue,
assembly were created using bowtie2 (2.1.0) [32] using no best reciprocal condition and no hit coverage condi-
the ‘--no-mixed --local --sensitive-local -N 1’. The tion enforced [41]. Secondly, all the AA sequences were
resulting alignments of each sample to the assembly used as input to the EGGNOG mapper (v1) [42] to gen-
were combined with the alignments of each sample to erate (where possible) KEGG ortholog (KO) IDs for the
the cultured genomes (from the earlier step) for expres- sequences [43–46]. The KOs were then used to identify
sion quantification. where different EGN gene clusters were recognised as
having the same function, allowing them to be combined
CDS prediction and quantification into higher level functional clusters using igraph in R
Putative coding sequences (CDS) were predicted in the [47]. This was followed by further manual refinement of
de novo assembled transcriptome using the default op- the functional groups in MS Excel using the information
tions of the ‘TransDecoder.LongOrfs’ script from Trans- from the EGGNOG annotations of the AA sequences.
decoder: https://github.com/jls943/TransDecoder [37, Finally, the taxonomic assignment, functional cluster
38] which identifies ORFs that are at least 100 amino membership and expression (count) information across
acids long. These were combined with the predicted each of the samples for every predicted CDS was com-
CDS from the genomes that had aligned mRNA reads. bined into an overall table for subsequent analyses.
These annotations formed the set of CDS which were
used in the subsequent functional and taxonomic ana- Network analysis
lyses. Abundance (counts) of reads mapping to each To perform the co-expression network analysis at the
CDS annotation was calculated with htseq-count from family taxonomic level, the count data needed to be pre-
the HTSeq package [39] (options: -s no; -t CDS; -q). The processed. The taxonomic families with less than 10
predicted amino acid (AA) sequences of these CDS were genes expressed were removed from the dataset and the
used in the subsequent annotation steps. sum of the expression for all genes in the remaining
taxonomic families was calculated. Next, to account for
Taxonomic annotation differences in sequencing depths in each sample, the
The blastp command of the BLAST package (10.1186/ summed count data were scaled by dividing each value
1471-2105-10-421) was used with the -outfmt 6 option by the sum of the total counts from the sample it
against the NCBI nr database. The output was then belonged and then multiplying them by the median of
passed to the add-gff-info script of the MGKit package, all sample sums. Then, the scaled data were further fil-
which uses a last common ancestor algorithm in the tered using variable filtering based on inter-quartile
taxonomy command to resolve the taxon identifiers of range (IQR; [48, 49]), where taxonomic families with ex-
the annotations. The options used with add-gff-info tax- pression lower than the 1st quartile (25th percentile)
onomy were as follows: -s 40 in order to use only were removed. The final stage of data pre-processing
BLAST results that have a bit score of at least 40, -l to was data normalisation, which was completed using reg-
use the last common ancestor algorithm and -a 10 to ularised log transformation [50].
use only the results that are within 10 bits from the Co-occurrence networks were subsequently con-
maximum bit score for each annotation. For the CDS structed based on the results of correlation analysis. The
from the genomes, the resulting predicted taxonomic as- correlation analysis was conducted with Spearman’s rho
signments were cross-checked against the species the ge- rank correlation and the results were filtered based on
nomes represented in order to provide validity for the de both correlation coefficients and their corrected p-
novo predictions for the CDS from the assembly. values. Only the interactions with a correlation coeffi-
cient larger than 0.7 and (Benjamini-Hochberg) adjusted
Gene family identification p-values less than 0.1 were used for the network analysis.
A series of hierarchical clustering approaches were used The constructed network was then explored and visua-
to identify gene family clusters within and across species. lised using the open-source software Gephi [51]. Modu-
Firstly, an all-against-all search of all the AA sequences larity metrics were calculated in Gephi to detect the
was carried out using Diamond [40], where the max- clusters in the constructed network.
imum number of target sequences was set to 1,000,000 Putative keystone taxa identification was performed
with a minimum bit score of 60 and all other options set within each cluster of the network [52]. We hypothe-
to the default. Next, EGN was used to identify an initial sised that keystone taxa would have a large impact on
round of gene similarity clusters using the Diamond all- the community network, and any absences of them
against-all search results as input with the ‘gene net- should lead to major disruption to the network [53]. To
work’ option and the following settings: E-value thresh- describe the importance of keystone taxa, we used a set
old = 1e-05, hit identity threshold = 20%, identities must of network-level measures: transitivity, density,Huws et al. Microbiome (2021) 9:143 Page 5 of 17
modularity, average path length and centralisation of were retained for subsequent pairwise differential ex-
eigenvector. Transitivity measures the probability of the pression analysis. All 10 possible pairwise comparisons
adjacent vertices. The graph’s density calculates how between the 5 sampled timepoints (excluding timepoint
many edges are compared to the maximum possible zero) was carried out to identify the pattern of differen-
number of edges between vertices. Modularity is de- tial expression (DE) for those genes with a significant
signed to measure the strength of division of a network interaction with time using a Benjamini-Hochberg p-
into modules. The average path length is calculated as adjusted cut-off of 0.1 to identify significance.
the shortest paths between all pairs of vertices. Eigen- Finally, ‘significance groups’ across time (analogous to
vector centralisation measures from the centrality scores the output from Tukey’s HSD test) were identified for
according to the eigenvector centrality of vertices. In each gene in each taxonomic family to allow identifica-
order to determine the keystone taxa, we calculated tion of patterns of DE over time and to allow clustering
these measurements with the full network and then of genes by their shared DE pattern. This was carried
again after removing a node. This was calculated for out in R, using igraph, to identify for each gene in each
every node in the network. Thus, the differences in the taxonomic family the maximal cliques in the network of
measurements between each removal network and the timepoints that were not significantly different to each
complete network could be used to reveal those taxa other. These maximal cliques were then converted into
whose removal had the largest detrimental effect on the labels for identifying the significance groups in subse-
community network structure and, therefore, could be quent visualisations. The R script and data used to carry
identified as putative keystone taxa. Based on the mech- out the temporal gene expression as described above is
anism of these measures, if one node has a large impact available in the Open Science Framework at https://osf.
on the cluster, the differential values of transitivity and io/rx9h2/.
density should be reduced whilst modularity, average
path length and centralisation of eigenvector should be Detailed annotation and temporal abundance of glycosyl
increased. For each measure, we ranked each node based hydrolase, peptidase and quorum sensing genes
on the difference calculated for these values following The functional clustering described earlier grouped all
the node removal and further produced an overall rank- glycosyl hydrolases (GH) and peptidase genes into single
ing for each node using the Borda count method (sum clusters containing all variants of these enzymes. In
of ranks), which is widely used in the voting method for order to facilitate a further in-depth analysis of the
decision-making of multiple ranks. The overall top- expression of these important enzymes, a more detailed
ranked families from the Borda count were identified as functional analysis of these two enzyme groups was car-
putative keystone taxa. To fulfil this task, we used the R ried out. Separation of GH families was carried out in
package igraph [47]; the scripts and data used to carry reference to the annotations available in the CAZy data-
out the analyses described above are available on the base (http://www.cazy.org/; [55]) using DBCan (version
Open Science Framework at https://osf.io/rx9h2/. 2.0.0) [56], Separation of the peptidases families was car-
. ried out in reference to the MEROPS [57] database using
Clustal Omega (version 1.2.4) [58] to identify groups of
Temporal gene expression analysis peptidase families in the database which were then as-
In order to carry out the statistical analysis of gene ex- sembled into profiles using HMMER (version 3.3) [59].
pression, the expression information was summarised by These profiles were then used to assign peptidases to
taxonomic family and functional cluster (generated as families using HMMER. To facilitate the statistical
earlier described). This resulted in raw count data for analysis of this subset of the dataset, the sum of the ex-
each timepoint from each functional cluster expressed in pression of all genes assigned to each GH and peptidase
every taxonomic family [54]. This data was used as input family was calculated for each taxonomic family.
to the Bioconductor package DESEQ2 in R [50]. In this For the quorum-sensing (QS) genes, the functional
analysis, the design was ‘cows+time’. Initial testing of the clustering identified a cluster of S-ribosylhomocysteine
effect of cows and time was carried out using the likeli- lyase (LuxS) genes, involved in Auto-inducer-2 (AI-2)
hood ratio test ‘LRT’ in DESEQ2, where first the effect based QS, from 5 different taxonomic families. However,
of ‘cows+time’ was tested against a reduced model of no clusters of N-acyl homoserine lactone (AHL) were
‘time’, testing for any interactions with the cows the identified, so no analysis could be undertaken for this
samples were taken from. Secondly the model ‘cow+ gene. Next, the expression of each of the GH, peptidase
time’ was tested against a reduced model of ‘cows’ to test and QS families was normalised by calculating the tran-
the effect of time. Only those genes identified to have a scripts per million (TPM) for every gene in the entire
significant interaction with time from the LRT (and ex- transcriptome in MS Excel and then extracting the cal-
cluding the 2 genes that had an interaction with cows) culated values for the members of the GH, peptidaseHuws et al. Microbiome (2021) 9:143 Page 6 of 17
and QS families. This commonly used normalisation time. Information on the number of reads generated, pre
method for RNAseq data utilises the knowledge of the and post filtering, alignment to other datasets and the
length of each gene and the total sequencing effort and number of genes expressed, for each sample can be found
provides an estimate of the number of RNA molecules in Supplementary Table 1. Average read abundance/sam-
from this gene for every million RNA molecules in the ple was 14,825,273. However, 0-h sample reads were low
sample. The GH and peptidase families were then separ- at 2,060,217 and did not align to any of the Hungate ge-
ately analysed as follows. First, the TPM for all genes nomes due to the fact that bacteria colonising PRG pre-
identified as belonging to the same enzyme family were incubation were epiphytic in nature (Supplementary Excel
summed for statistical analysis. For the GH and peptid- 1). Taxonomic families associated with this timepoint fur-
ase families, any that fell outside the 95% most highly ther decreased post-rumen incubation; therefore, these
expressed across all timepoints for that type (i.e. GH or were not included in the subsequent metatranscriptome
peptidase) were excluded. , for each GH and peptidase analysis (Supplementary Excel 1).
family, an analysis of variance (ANOVA) was performed
on the summed TPM values in order to identify any sig- Network analysis
nificant interactions with time, including cow as a fixed Family-based gene network correlations, showing both
effect in the design (with the ‘aov’ command in R). For positive and negative gene correlations are shown in Fig. 1.
the QS genes, the TPM values from each taxonomic The layout of the network is ForceAtlas2 [63] where con-
family were summed and an ANOVA was performed to nections or edges are presented that have correlation coeffi-
identify any significant interactions of the expression of cients (Spearman’s rho) larger than 0.7 and adjusted p-
the QS genes in each taxonomic family with time. All values less than 0.1. The sizes of the nodes are proportional
the ANOVA p-values were then corrected for multiple to the expression of genes from the corresponding family
testing using the Benjamini-Hochberg method with a across all timepoints. The size of the nodes indicates that
value of < 0.1 used to determine enzyme families with a (in descending order) Lachnospiraceae, Prevotellaceae,
significant interaction with time. For each of these with Ruminococcaceae, Selemonadaceae, Spirochaetaceae,
a corrected p-value < 0.1, Tukey’s HSD test was per- Methanobacteriaceae, Fibrobacteraceae and Eubacteria-
formed (using the ‘TukeyHSD’ command in R) to iden- caeae dominate, irrespective of incubation time. The family
tify where the significant differences were occurring and Lachnospiraceae was dominated by two genera (Butyrivi-
to assign significance groupings across timepoints. The brio and Pseudobutyrivibrio), whilst the families Prevotella-
contribution of each taxonomic family to the expression ceae, Ruminococcaceae, Selemonadaceae, Spirochaetaceae,
of each GH and peptidase family at each timepoint was Methanobacteriaceae, Fibrobacteraceae and Eubacteria-
also determined. All data was visualised using “ggplot2” caeae were each comprised of a single genus only, namely:
in R. Detailed isoform expression analysis of GH families Prevotella, Ruminococcus, Selenomonas, Treponema,
3, 5, 9, 10 and 48 was carried out by extracting the AA Methanobrevibacter, Fibrobacter, and Eubacterium respect-
sequences for each separately and aligning with default ively (Supplementary Excel 1). In the interest of not repeat-
options in Muscle (v3.8.1551 [60];) followed by phylo- ing family and genera in every instance, we refer mainly to
genetic tree reconstruction using RAxM-ng (v1.1.0 [61];) families in the results presented below. Further information
using a JTT+G model. Finally, the expression profiles of for genera within these and other families can be found in
each isoform at each timepoint were mapped to the Supplementary File 1.
resulting phylogenetic tree using iTOL [62]. The R The network analysis also shows that there are two
scripts used to carry out this analysis are available in the large clusters in the network with strong positive corre-
Open Science Framework at https://osf.io/rx9h2/. lations, and these clusters are separated by red lines
which indicate negative gene expression-based correla-
Results tions between the two large clusters (Fig. 1). These two
Overview of sequencing data clusters predominantly represent primary (≤ 4 h post
We generated prokaryotic metatranscriptome data for rumen incubation) and secondary (≥ 4 h post rumen in-
PRG-attached prokaryotes incubated over time (1, 2, 4, 6 cubation) colonisation phases and can be considered two
and 8h) within the rumen of three cannulated Holstein sub-microbiomes (Fig. 1). The primary sub-microbiome
× Friesian cows (two replicates/animal/timepoint with is largely dominated by Prevotellaceae, whilst the sec-
replicates within animals being pooled pre-sequencing) ondary sub-microbiome is dominated by Lachnospira-
and the PRG attached bacteria at 0 h (three 0 h pre- ceae, and to a lesser extent Ruminococcaceae and
incubation PRG RNA extractions being pooled pre- Eubacteriaceae. A further group of bacterial families are
sequencing). Therefore, a total of 16 samples (i.e. 3 cows independent of the primary and secondary sub-
× 5 timepoints + 0-h sample) were sequenced to assess microbiomes, namely families Selemonadaceae, Spiro-
the gene expression of PRG attached prokaryotes over chaetaceae, Methanobacteriaceae, Bifidobacteriaceae,Huws et al. Microbiome (2021) 9:143 Page 7 of 17 Fig. 1 Co-occurrence gene network map showing positive (green lines) and negative gene correlations (red lines) for genes assigned to families. The size of the node denotes family relative abundance. Nodes in purple indicate putative keystone families and the gradient in colours relates the ranking of the families as ‘keystone’, where the darkest were the top ranked. The top cluster relates to primary colonisation (< 4 h) and the bottom secondary colonisation (> 4 h) events. Names of dominant and keystone familes are shown only due to the complexity of the network, for information on all interactions refer to Supplementary Tables 2 and 3 Fibrobacteraceae, Lactobacilliaceae, Enterococcaceae, modularity, average path length and centralisation of Pseudomonadaceae, Phyllobacteraceae, Streptomycaceae, eigenvector. For the primary sub-microbiome the Neisseriaceae, Nocardiodiaceae, Commomonadaceae, highest-ranking putative keystone families were Burkhol- Desulfovibrionaceae and Pasturellaceae (in descending deriaceae and Enterobacteriaceae, and for secondary order of relative abundance). Also, of particular note is sub-microbiome Cyclobacteriaeceae and Flammeoviriga- the finding that the dominant families had few or even ceae (Fig. 1; Supplementary Tables 2 & 3). This suggests no gene correlation, suggesting selfish non-cooperative these families have an important role in the cohesion of behaviour, although Prevotellaceae was an exception these submicrobiomes although they have a much lower (Fig. 1). activity than the dominant families and are within the To identify keystone taxa, a set of node measurements lower 10% of those reported in Supplementary Fig. 2A & were calculated. Amongst these measurements, five cen- B, and hence are not directly shown within the graph. trality metrics (transitivity, density, modularity, average path length and centralisation of eigenvector) were also Temporal niche specialisation used to identify putative keystone taxa as previously A total of 1513 genes were differentially expressed (DE) done by others [53, 64–66]. These measurements in- by the prokaryotes colonising PRG in the rumen over cluded five centrality metrics: transitivity, density, time (these values exclude genes lower than 10% of total
Huws et al. Microbiome      (2021) 9:143                                                                                              Page 8 of 17

expression levels) (Fig. 2A). These genes were represen-                   functional roles (Figs. 3, 4, 5, 6, 7 and 8; Supplementary
tative of all general functions, including cellular process-               Figs 3-32). As there are too many temporal functional
ing, information storage and processing, metabolism,                       changes evident within this complex microbiome to out-
and others which were poorly characterised or unknown                      line all in detail here, we have provided the raw data and
(Fig. 2B). Twenty-eight distinct DE patterns across all                    graphical representation of the taxonomy by temporal
five timepoints were observed in these genes, with as                      expression patterns for all Enzyme Commission (EC)
few as three genes and up to as many as 170 genes                          categories in the supplementary material (Supplementary
showing any particular DE pattern (Fig. 2). The DE pat-                    Figs 3-32) for those with an interest in specific microbial
tern with the highest total expression across all time-                    functions. In this study, we concentrated on genes in-
points consisted of 69 genes and was expressed in higher                   volved in methane metabolism, protein and carbohy-
abundance during secondary colonisation (≥ 4 h rumen                       drate breakdown and quorum sensing.
incubation) compared to primary colonisation (≤ 4 h                           Genes involved in methane metabolism were mainly
rumen incubation) (Fig. 2 C and D). These 69 genes                         expressed by Lachnospiraceae (interestingly mainly by
were mainly expressed by Lachnospiraceae, with lower                       genus Butyrivibrio and not Pseudobutyrivibrio) and
expression also evident within the Prevotellaceae (Fig.                    Methanobacteriaceae, with expression increasing dur-
2E). Interestingly, the DE pattern with the second-                        ing secondary colonisation (≥ 4 h rumen incubation;
highest expression (consisting of 96 genes) showed the                     Fig. 3; Supplementary Excel 1). Given that Butyrivi-
opposite pattern (i.e. higher abundance during primary                     brio dominated the expression profile (Supplementary
colonisation) and was dominated by Prevotellaceae, con-                    Excel 1) and they produce butyrate and hydrogen
sistent with the network analysis. The remaining DE pat-                   from fermentation of complex and simple carbohy-
terns identify further timepoint and taxa-specific                         drates [67], it is likely that the Methanobrevibacter,
expression profiles worthy of further in-depth analysis.                   which utilise hydrogen to produce methane, increase
Summarising these DE patterns by function identified                       in response to the higher hydrogen levels allowing
many bacterial families with time-point specific                           them to increase methane formation and release as

 Fig. 2 Temporal functional and taxonomic overview of the top 90% most highly expressed genes with a significant interaction with time
 expressed by prokaryotes attached to fresh perennial ryegrass incubated in situ within the rumen. Each column represents a set of genes that
 showed the same differential expression (DE) pattern (denoted as expression pattern on the x axis). A) Summed expression level of all the genes
 with the same DE pattern, and in brackets is the corresponding number of genes within the same DE pattern. B) Proportion of each major
 functional category (FC) represented in the set of genes with the same DE pattern. C) Visual representation of the DE patterns for each set of
 genes across the timepoints sampled (i.e. T1 is the 1h timepoint) where: (i) the background heatmap represents the level of expression for each
 timepoint (low = white, high = black) and (ii) the lines and dots represent the specific DE pattern shared by all genes in this set where the
 timepoint dots connected by a line and do not significantly different from each other. D) The proportion of the taxonomic families contributing
 to the expression level for each DE pattern. E) The level of expression of the major functional categories across each timepoint
Huws et al. Microbiome      (2021) 9:143                                                                                             Page 9 of 17

 Fig. 3 Temporal expression of the top 95% most highly expressed genes with a significant interaction with time involved in the KEGG methane
 metabolism pathway within the top 95% of expressed by prokaryotes attached to fresh perennial ryegrass incubated in situ within the rumen.
 Each column represents a set of genes that showed the same differential expression (DE) pattern (denoted as expression pattern on the x axis).
 A) Summed expression of all methane metabolism genes with the same DE pattern, in brackets the number of genes with the same DE pattern.
 B) The proportion of taxonomic genera contributing to the expression level for each DE pattern. C) Visual representation of the DE patterns for
 each set of genes across the timepoints sampled; The heatmap represents the level of expression for each timepoint (low = white, high = black);
 The lines and dots represent the specific DE pattern shared by all genes in this set where the timepoints connected by line and dots were not
 significantly different from each other. D) The level of expression of the genes from each taxonomic family across each timepoint

supported by KEGG information (Supplementary Fig-                          Excel 1; Supplementary Figure 34). In terms of temporal
ure 33).                                                                   changes in peptidase expression, significant changes over
  Peptidase genes are important to the host in terms of                    time were noted only for M24b and M15a (expressed
breaking down protein. In total 7 genes encoding pepti-                    mainly by the bacterial families Selemonadaceae and
dases (EC 3.4) were detected and these were generally                      Ruminococcaceae), with expression increasing during
more highly expressed during primary colonisation com-                     secondary colonisation (Supplementary Excel 1; Supple-
pared with secondary colonisation, in particular within                    mentary Figure 34). This is the converse to what was
the family Prevotellaceae, which specialise in this activity               seen with overall peptidase (EC 3.4) expression data and
(Fig. 4; Supplementary Excel 1). When MEROPS was                           a consequence of obtaining more granular data using
used for a more detailed analysis of peptidase family ex-                  MEROPS. Further elaboration of their precise role was
pression (Supplementary Excel 1; Fig. 4) this indicated                    not possible as the exact peptidase function for most of
that 38 peptidase families were within the top 95% of all                  the peptides could not be identified.
expression of this type of gene (Supplementary excel 1;                      Genes encoding glycosyl hydrolases (often also called
Supplementary Figure 34). These genes families were                        carbohydrate-active enzymes; CAZymes) (EC 3.2; 17 in
most predominantly expressed by: M50, Ruminococca-                         total) were mainly upregulated during secondary colon-
ceae; M24b, Lachnospiraceae; s01c, Prevotellaceae and                      isation (≥ 4 h rumen incubation), especially within the
Ruminococaceae; M16b, Prevotellaceae (Supplementary                        families Lachnospiraceae and Ruminococcaceae, which
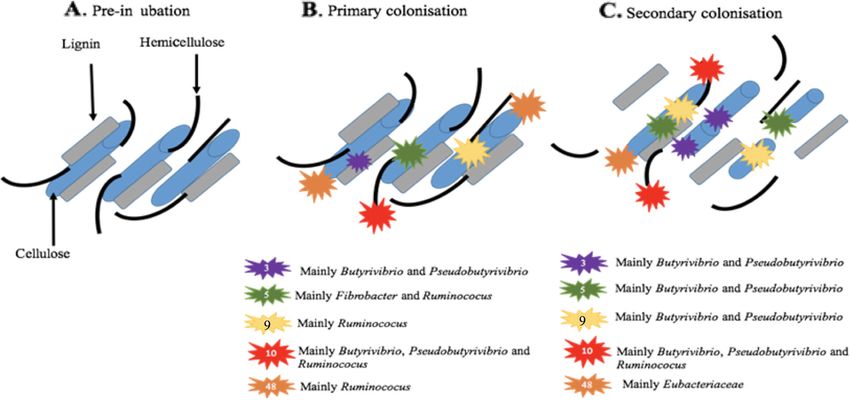
Huws et al. Microbiome       (2021) 9:143                                                                                             Page 10 of 17

 Fig. 4 Overview of the temporal expression of the top 95% most highly expressed peptidase genes (EC 3.4) with a significant interaction with
 time expressed by prokaryotes attached to fresh perennial ryegrass incubated in situ within the rumen. Each column represents a set of genes
 that showed the same differential expression (DE) pattern (denoted as expression pattern on the x axis). A) Summed expression of all genes with
 the same DE pattern, in brackets the number of genes with the same DE pattern. B) The proportion of taxonomic genera contributing to the
 expression level for each DE pattern. C) Visual representation of the DE patterns for each set of genes across the timepoints sampled; The
 heatmap represents the level of expression for each timepoint (low = white, high = black); The lines and dots represent the specific DE pattern
 shared by all genes in this set where the timepoints connected by line and dots were not significantly different from each other. D) The level of
 expression of genes across each timepoint

specialise in carbohydrate breakdown (Fig. 6; Supple-                       linkages; Spirochaetaceae and Selemonadaceae), 26 (endo-
mentary Excel 1). When DBcan was then used to analyse                       β-1,4-mannanases; Eubacteriaceae, Fibrobacteraceae,
the CAZymes, further resolution was obtained (Supple-                       Ruminococcaceae and Selemonadaceae) and 57 (includes
mentary Excel 1; Figure 35). DBcan showed that a total                      α-amylases, α-galactosidases, amylopullulanases and 4-
of 18 CAZymes represented 95% of all expression of this                     α-glucanotransferases; Fibrobacteraceae and Prevotel-
type of gene in the PRG-colonising prokaryotes (Supple-                     laceae). All of these apart from GH1 increased during
mentary Figure 35) with enzyme families GH3, 5, 10, 9                       secondary colonisation compared to primary colonisa-
and 48 dominating the expression profiles, in descending                    tion (Fig. 6; Supplementary Excel 1 and Figure 35). In
order (Supplementary Excel 1; Figure 35). Significant                       order to contextualise this temporal fresh PRG carbo-
changes over time were noted for GH1 (β-glucosidases                        hydrate degradation on a genus basis, a schematic fig-
and β-galactosidases; mainly expressed by Selemonada-                       ure was constructed which illustrates the changes in
ceae), 3 (endo-β-1,4-xylanases; mainly expressed by Lach-                   niche specialisation by the rumen bacteria, e.g. GH5
nospiraceae, 5 (endo-β-1,4-xylanases; mainly expressed by                   is mainly expressed by Fibrobacter and Ruminococcus
Fibrobacteraceae and Ruminococcaceae), 9 (endo-β-1,4-                       during primary colonisation and by Butyrivibrio and
xylanases; mainly expressed by Ruminococcaceae), 10                         Pseudobutyrivibrio during secondary colonisation (Fig.
(endo-endo-beta-1,4-xylanases; mainly expressed by                          7). Intriguingly, when these data are examined at an
Ruminococcaceae), 11 (endo-β-1,4-xylanases; Ruminococ-                      even more detailed level, it is apparent that different
caceae), 13 (act on substrates containing α-glucoside                       isoforms of each of the dominant GH families (GH3,
Huws et al. Microbiome      (2021) 9:143                                                                                             Page 11 of 17

 Fig. 5 Overview of the temporal expression of the top 95% most highly expressed glycosyl hydrolase genes (EC 3.2) with a significant interaction
 with time expressed by prokaryotes attached to fresh perennial ryegrass incubated in situ within the rumen. Each column represents a set of
 genes that showed the same differential expression (DE) pattern (denoted as expression pattern on the x axis). A) Summed expression of all
 genes with the same DE pattern, in brackets the number of genes with the same DE pattern. B) The proportion of taxonomic genera
 contributing to the expression level for each DE pattern. C) Visual representation of the DE patterns for each set of genes across the timepoints
 sampled; The heatmap represents the level of expression for each timepoint (low = white, high = black); The lines and dots represent the specific
 DE pattern shared by all genes in this set where the timepoints connected by line and dots were not significantly different from each other. D)
 The level of expression of genes across each timepoint

5, 9, 10 and 48) have time-point specific activity                         competition. Combinations of positive, neutral and nega-
(Supplementary Figures 36-40).                                             tive outcomes can also be found, for example under
  To further understand potential drivers of switches                      amensalism and commensalism [21]. This study investi-
from primary to secondary colonisation events, the tem-                    gated the breadth of temporal ecological interactions
poral expression of cell signalling molecules was also in-                 and niche specialisation of fresh PRG-attached rumen
vestigated. AI-2-based LuxS quorum sensing temporal                        prokaryotes. Using metatranscriptomics and network
expression data showed that these genes were mainly                        analysis, we show, on a gene expression network basis,
expressed by Prevotellacae. It was also evident that Pre-                  that temporal colonisation of fresh PRG involves an
votellaceae increased expression of LuxS genes during                      array of ecological interactions, with cooperation and
primary colonisation and thereafter declined, which may                    mutualism as well as competitive behaviours evident.
partially drive the transition to a secondary sub-                         Primary (≤ 4 h rumen incubation) and secondary (≥ 4 h
microbiome (Fig. 8).                                                       rumen incubation) PRG-attached sub-microbiomes were
                                                                           evident over time, as evidenced by antagonistic negative
Conclusion                                                                 interactions between the two large clusters. Network
Microbial interactions are complex and often explained                     analysis also enabled definition of interactions within
as being either positive, neutral or negative [21, 22], with               these sub-microbiomes, including identification of puta-
pairs of effects often found, such as in mutualism and                     tive keystone families. In terms of key functional
Huws et al. Microbiome (2021) 9:143 Page 12 of 17 Fig. 6 In-depth analysis of the temporal expression of differentially expressed carbohydrate-active enzyme (CAZymes, also known as glycosyl hydrolases (GH)) expressed genes by prokaryotes attached to fresh perennial ryegrass incubated within the rumen that differed significantly in their expression profile over rumen incubation time (line plots) and their respective taxonomic origins (bar chart below the corresponding line plot). Incubation time is indicated on the axis of the plots, i.e. T1 indicates an incubation time of 1 h. Brown bars: family Eubacteriaceae (genus Eubacterium); Pink bars: family Fibrobacteriaceae (genus Fibrobacter); Red bars: family Lachnospiraceae (genera Butyrivibrio and Pseudobutyrivibro); Blue bars: family Prevotellaceae (genus Prevotella); orange bars: Ruminococcaceae (genus Ruminococcus); Purple bars: Spirochaetaceae (genus Treponema). The significance of rumen incubation time on gene expression is indicated on each plot, with timepoint that significantly differ denoted by a different letter in the line plot processes for the host, whilst protein breakdown is a Ruminococcaceae showed reasonably equal activity continual process with limited differences seen over time across primary and secondary colonisation events. These and between sub-microbiomes, carbohydrate degrad- temporal shifts of families are in line with the 16S rRNA ation is higher for many CAZymes during secondary col- (based on cDNA) data already published for the same onisation which is mainly related to the breakdown of samples showing that RNA-based metataxonomy and complex carbohydrates. Dominant bacteria also com- metatranscriptome data findings were comparable [10]. monly change their function over incubation time, pre- Gene network analysis also showed that these dominant sumably because of the need to be ecologically plastic in bacterial families were largely non-cooperative, as on a a changing environment. gene expression basis, they did not interact substantially In terms of prokaryotic expression, the top 5 families with the two sub-microbiomes, with the exception being were Prevotellaceae, Lachnospiraceae, Selemondaceae, Prevotellaceae. This is perhaps a consequence of the fact Ruminococcaeae and Fibrobacteraceae. The family Pre- that their adaptation to this environment reduces the votellaceae showed the most transcriptional activity dur- need to behave cooperatively and, therefore, could be ing primary colonisation, whilst the families characterised as ‘selfish’ [9]. Conversely, the less abun- Lachnospiraceae and Ruminococcaceae tended to be dant bacterial families Burkholderiaceae, Enterobacteria- more transcriptionally active during secondary colonisa- ceae, Cyclobacteriaeceae and Flammeovirigaceae tion. The families Fibrobacteriaceae and displayed highly cooperative behaviour in either the
Huws et al. Microbiome     (2021) 9:143                                                                                         Page 13 of 17

 Fig. 7 Diagrammatic representation of fresh perennial ryegrass carbohydrate breakdown over incubation time within the rumen. The diagram
 illustrates only the dominant carbohydrate-active enzymes (CAZymes, also known as glycosyl hydrolases (GH)).GH family numbers are shown by
 the numbers in the symbol key. Taxonomic origins of the expressed CAZymes are also shown in the key next to the corresponding symbol. The
 number of GH symbols between primary (< 4 h) and secondary (> 4 h) colonisation sub-microbiomes are representative of whether expression
 has increased or remained constant

primary or secondary temporally distinct sub-                           in the presence of the dominant prokaryotic families
microbiomes. This suggests that they may have an im-                    Lachnospiraceae and Prevotellaceae alone and compara-
portant role as keystone families for effective attachment              tive to the situation when they are amongst a complex
and degradation of PRG.                                                 microbiome.
   Keystone bacteria are normally defined as species that                  The underlying mechanisms driving competitive an-
if removed would have a negative effect on the structure                tagonism between primary and secondary associated
and function of the community [53]. These four families                 sub-microbiomes likely include nutrient availability and
are not high in abundance in the rumen [68] and were                    production of chemicals by the microbes themselves
low in activity in this study. However, it seems they may               [71]. During early rumen incubation (< 6 h), fresh PRG
play an integral role in their respective sub-microbiomes               is known to undergo self-mediated proteolysis and lip-
and possibly aid connectivity within the biofilms. Key-                 olysis, which will alter the form of the nutrients available
stone taxa are often described as being cooperative and                 to the rumen microbiome [72–74]. In parallel, it is
mutualistic, but in the context of plant colonisation in                known that PRG will be changing in terms of chemical
the rumen, the low levels of activity of these organisms                content due to the rumen microbial breakdown of com-
suggest that they may be displaying commensalism by                     plex carbohydrates, lipids and proteins over time, thus
‘cheating’ [69], perhaps capitalising on the activity of                providing a continually evolving niche for the microbes
others in the sub-microbiomes. This strategy would en-                  to inhabit [6, 10, 75]. In terms of plant nutrient degrad-
sure the community stays together, rewarding synergistic                ation, we found that peptidase expression is high
behaviours in the sub-microbiome, allowing harvesting                   amongst the attached rumen prokaryotes, with limited
of energy from the activities of other groups with rela-                DE seen between primary and secondary colonisation
tively little input. These results also raise questions                 events. Most of the peptidase expression was by Prevo-
about the minimum rumen prokaryotic diversity re-                       tella, with species of this genera well known for their
quired for effective energy harvesting, the importance of               dominant proteolytic activity within the rumen micro-
minor keystone species to this activity and whether the                 biome [76, 77]. Carbohydrate breakdown was also a
presence of the dominant genera alone would be more                     dominant activity of the fresh PRG attached bacteria, as
energetically efficient. Recent data showed that rumi-                  denoted by the high expression of CAZymes/GHs. The
nants with less diverse rumen microbiomes, based on                     preponderance of CAZyme activity within the rumen
bacteria only, are more feed efficient [70], suggesting                 bacteria is well known and underpins their key function
that degradation of fresh PRG may be equally as efficient               of energy harvesting by breaking down and fermenting
Huws et al. Microbiome      (2021) 9:143                                                                                             Page 14 of 17

 Fig. 8 Number of expressed LuxS genes (transcripts per million,TPM) for each prokaryotic taxonomic family colonising fresh perennial ryegrass
 incubated in the rumen over time. Incubation time is indicated on the axis, i.e. T1 indicates an incubation time of 1 h. The significance of
 incubation time is indicated on each plot, and where significance occurs then differences between timepoints are denoted by a different letter

complex carbohydrates to volatile fatty acids [78, 79].                    breakdown by the two bacteria genera being utilised by
Nonetheless, the temporal expression and contribution                      Methanobrevibacter to produce methane.
of each CAZyme family to fresh PRG has, to our know-                         We also postulated that alongside known chemical
ledge, not been demonstrated before. We show that                          changes in the fresh PRG [20], bacterial cell signalling
GH3, 5, 9, 10 and 48 dominate in terms of expression by                    and chemical warfare may also drive temporal niche spe-
the PRG-attached rumen bacteria, all of which are in-                      cialisation. For example, in this study, we found that
volved in the degradation of recalcitrant plant cell wall                  family Prevotellaceae and genus Prevotella, in particular,
cellulose and hemicellulose, with all (all apart from                      expressed AI-2 LuxS increasingly during primary colon-
GH48, which remains constant) slightly increasing over                     isation and thereafter their expression during secondary
incubation time. Our data also highlight the niche spe-                    colonisation declines. These data support the previous
cialisation and plasticity amongst the attached rumen                      report that Prevotella were the most active in terms of
bacteria as GH5 and 9 are expressed predominantly by                       expressing AI-2 LuxS genes in the rumen [17]. We also
Fibrobacter and/or Ruminococcus during primary colon-                      hypothesised that bacterial cell signalling may influence
isation but during secondary colonisation GH5 and 9 are                    colonisation events and niche specialisation as it has pre-
predominantly expressed by Butyrivibrio and Pseudobu-                      viously been shown that furanosyl borate diester mole-
tyrivibrio. This clearly demonstrates the redundancy, re-                  cules encoded by the LuxS gene cause biofilm dispersal
silience and niche plasticity that occurs within the PRG-                  in many pure culture models [80]. Interestingly, no AHL
attached rumen microbiome. We also demonstrate that                        genes were detected, which is consistent with other data,
GH family gene isoforms exist as has been shown previ-                     which suggests that AHL-based quorum sensing is low
ously [9] and that these within-family isoforms are dif-                   in the rumen [17]. Genes encoding the antimicrobial
ferentially expressed over attachment time, further                        peptide (AMP) Lynronne 1 (likely produced by Prevo-
illustrating the redundancy that underpins the resilience                  tella ruminocola) were also upregulated during the pri-
of the rumen microbiome. Increases in methane metab-                       mary colonisation phase of PRG and decreases in
olism were also apparent during secondary colonisation                     expression during the secondary phase [81]. In contrast,
and this was linked to Butyrivibrio, Pseudobutyrivibrio                    we showed that expression of non-ribosomally synthe-
and Methanobrevibacter activity. This is proposed to be                    sised peptides and polyketide increased during secondary
due to increased hydrogen release from carbohydrate                        colonisation within fresh PRG attached bacteria [82].
You can also read