MMB-FOXM1-DRIVEN PREMATURE MITOSIS IS REQUIRED FOR CHK1 INHIBITOR SENSITIVITY - DECAPRIO LAB
←
→
Page content transcription
If your browser does not render page correctly, please read the page content below
Article

MMB-FOXM1-driven premature mitosis is required
for CHK1 inhibitor sensitivity
Graphical Abstract                                              Authors
                                                                Timothy B. Branigan, David Kozono,
                                                                Amy E. Schade, ..., Geoffrey I. Shapiro,
                                                                Alan D. D’Andrea, James A. DeCaprio

                                                                Correspondence
                                                                james_decaprio@dfci.harvard.edu

                                                                In brief
                                                                Branigan et al., by using genome-wide
                                                                CRISPR screens, identify the MMB-
                                                                FOXM1 complex as being required for
                                                                CHK1 inhibitor (CHK1i) sensitivity. Their
                                                                study shows that CHK1i-induced
                                                                premature activation of the G2/M
                                                                transcriptional program by this complex
                                                                triggers a breakdown in the separation of
                                                                DNA synthesis and mitosis, leading to
                                                                replication catastrophe.

Highlights
d   The MMB-FOXM1 complex components are required for
    CHK1i sensitivity

d   CHK1i prematurely activates the G2/M transcriptional
    program by MMB-FOXM1

d   Mitotic pH3 induced by CHK1i during S phase requires the
    MMB-FOXM1 complex

d   Premature mitosis is required for replication catastrophe
    after CHK1 inhibition

           Branigan et al., 2021, Cell Reports 34, 108808
           March 2, 2021 ª 2021 The Author(s).
           https://doi.org/10.1016/j.celrep.2021.108808                                         ll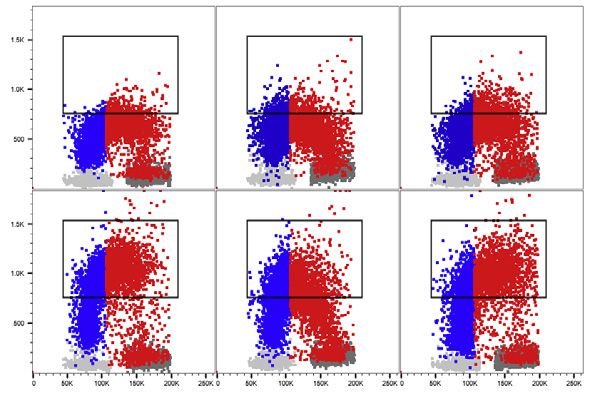
ll
                                                                                                                    OPEN ACCESS

Article
MMB-FOXM1-driven premature mitosis
is required for CHK1 inhibitor sensitivity
Timothy B. Branigan,1,2,6 David Kozono,3,4,6 Amy E. Schade,1,2 Peter Deraska,3,4 Hembly G. Rivas,1,2 Larissa Sambel,3,4
Hunter D. Reavis,3,4 Geoffrey I. Shapiro,4,5 Alan D. D’Andrea,3,4 and James A. DeCaprio1,2,5,7,*
1Department    of Medical Oncology, Dana-Farber Cancer Institute, Boston, MA 02215, USA
2Program   in Virology, Graduate School of Arts and Sciences, Harvard University, Cambridge, MA, USA
3Department of Radiation Oncology, Dana-Farber Cancer Institute, Boston, MA 02215, USA
4Center for DNA Damage and Repair, Dana-Farber Cancer Institute, Boston, MA 02215, USA
5Department of Medicine, Brigham and Women’s Hospital and Harvard Medical School, Boston, MA 02115, USA
6These authors contributed equally
7Lead contact

*Correspondence: james_decaprio@dfci.harvard.edu
 https://doi.org/10.1016/j.celrep.2021.108808

SUMMARY

To identify genes whose loss confers resistance to CHK1 inhibitors, we perform genome-wide CRISPR-Cas9
screens in non-small-cell lung cancer (NSCLC) cell lines treated with the CHK1 inhibitor prexasertib (CHK1i).
Five of the top six hits of the screens, MYBL2 (B-MYB), LIN54, FOXM1, cyclin A2 (CCNA2), and CDC25B, are
cell-cycle-regulated genes that contribute to entry into mitosis. Knockout of MMB-FOXM1 complex compo-
nents LIN54 and FOXM1 reduce CHK1i-induced DNA replication stress markers and premature mitosis dur-
ing Late S phase. Activation of a feedback loop between the MMB-FOXM1 complex and CDK1 is required for
CHK1i-induced premature mitosis in Late S phase and subsequent replication catastrophe, indicating that
dysregulation of the S to M transition is necessary for CHK1 inhibitor sensitivity. These findings provide
mechanistic insights into small molecule inhibitors currently studied in clinical trials and provide rationale
for combination therapies.

INTRODUCTION                                                        replication catastrophe is critical, as inhibitors of ATR or
                                                                    CHK1 are being considered for clinical use.
Duplication of the eukaryotic cellular genome occurs in an             The ATR-CHK1 pathway limits DNA replication stress during S
orderly process during the S phase of cell division. Replication    phase by coordinating origin firing with CDK activity. ATR-acti-
of the genome must be completed prior to mitosis to avoid           vated CHK1 antagonizes CDK1 activity by activating the
events that result in genomic instability. DNA replication stress   CDK1-inhibitory WEE1 kinase and suppressing the CDK1-acti-
can occur when oncogenes, genotoxic agents, or inhibitors of        vating CDC25 phosphatases (Furnari et al., 1997; O’Connell
DNA replication cause stalled replication forks, leading to acti-   et al., 1997). Suppression of CDK1 activity during S phase by
vation of DNA damage response (DDR) pathways. Checkpoint            ATR and CHK1 prevents premature activation of the transcrip-
Kinase 1 (CHK1) is activated by Ataxia Telangiectasia and           tion factor FOXM1 and expression of mitotic genes (Saldivar
Rad3-related protein (ATR) phosphorylation, at SQ sites S317        et al., 2018). Cyclin A (CCNA2)/CDK1 activity however is required
and S345 (Kim et al., 1999; Zhao and Piwnica-Worms, 2001),          for late origin firing (Katsuno et al., 2009). Therefore, complete
to resolve incomplete DNA replication structures consisting         suppression of CDK activity would decrease origin firing and
at least partly of single-stranded DNA (Lupardus et al., 2002;      subsequent activation of ATR. During S phase, the ATR-CHK1
Saldivar et al., 2017; Zou and Elledge, 2003). Replication stress   pathway maintains a careful balance of sufficient CDK1 activity
also leads to the phosphorylation of the replication fork           to complete DNA replication but not enough to trigger mitosis.
component RPA32 on S4, S8, and S33 and the regulator of                Transcriptional regulation also plays a key role in managing
heterochromatin KAP1 (also known as TRIM28 or TIF1B) on             cell cycle progression. During cell cycle entry, an E2F-depen-
S824 to remedy this altered DNA replication (Ashley et al.,         dent wave of gene expression during the G1/S transition facili-
2014; Liu et al., 2012; Olson et al., 2006; Yajima et al., 2009).   tates DNA replication, and the MYBL2/MuvB (MMB)-FOXM1
Unresolved replication stress can lead to cell death by replica-    complex drives a second wave of gene expression during G2/
tion catastrophe, in which exhaustion of replication factors,       M that promotes mitosis. During S phase, the MuvB complex,
such as RPA, triggers widespread DNA double-strand breaks           comprised of LIN54, LIN9, LIN37, LIN52, and RBBP4, together
(DSBs) marked by g-H2AX (Furuta et al., 2003; Toledo et al.,        with MYBL2 binds to cell cycle gene homology region (CHR)
2013). Understanding how the ATR-CHK1 pathway prevents              DNA motifs, which are LIN54 binding sites, at promoters of

                                                                     Cell Reports 34, 108808, March 2, 2021 ª 2021 The Author(s). 1
                    This is an open access article under the CC BY-NC-ND license (http://creativecommons.org/licenses/by-nc-nd/4.0/).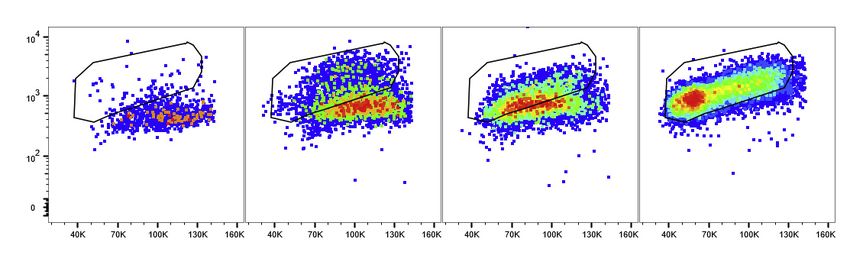
ll
       OPEN ACCESS                                       Article

   A                                           B

                                               C

   E

                                               D

   F

   G                                       H

                                                   (legend on next page)
2 Cell Reports 34, 108808, March 2, 2021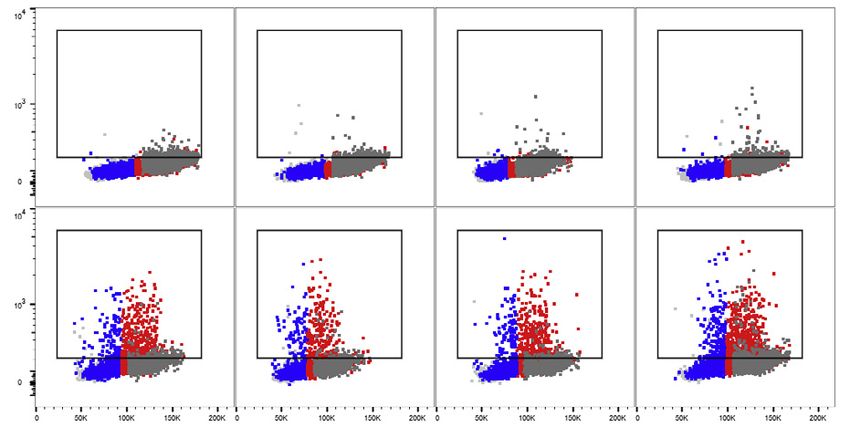
ll
Article                                                                                                                                  OPEN ACCESS

genes whose expression is required for mitosis (Knight et al.,                 markers of replication stress including phosphorylation of
2009; Litovchick et al., 2007; Mu  €ller et al., 2012; Pilkinton et al.,       RPA32 on S4/S8 and S33 and KAP1 on S824 (pKAP1) (Figure 1A).
2007; Schmit et al., 2009). FOXM1 is subsequently recruited to                 There was also a concomitant increase in the DNA DSB marker
these promoters in an MMB-dependent fashion. This recruit-                     g-H2AX. CHK1 phosphorylation reached maximum levels near
ment coincides with an increase in the levels of several hundred               the CHK1i IC50 dose, and the overall levels of CHK1 decreased
G2/M cell cycle genes, including CCNA2, CCNB1, PLK1, and                       at higher doses (Figure 1A). The decrease in total CHK1 is
CDC25B (Chen et al., 2013; Down et al., 2012; Fischer et al.,                  consistent with the induction of ubiquitin-proteasome-depen-
2016; Sadasivam et al., 2012).                                                 dent degradation in response to genotoxic stress (Zhang et al.,
   Due to oncogene-driven acceleration of cell division, cancer                2005). The decreased viability and induction of replication stress
cells may become hyper-dependent on the ATR-CHK1 pathway                       and g-H2AX indicate that CHK1 inhibition in NSCLC cells leads
to manage replication stress and maintain sufficient genomic                   to replication-stress-induced catastrophe.
integrity for continued survival. Inhibitors of ATR and CHK1                      Screens to identify genes required for CHK1i sensitivity were
have been developed as anti-cancer agents to exploit this                      performed in A549 and H460 cells using the Brunello human-
vulnerability. Monotherapy with the CHK1 inhibitor (CHK1i) pre-                genome-wide lentiviral guide RNA (gRNA) pooled library
xasertib has shown safety and tolerability (Hong et al., 2016,                 (Doench et al., 2016). CCNA2, CDC25B, FOXM1, LIN54, and
2018). Prexasertib and CHK1 depletion have little to no effect                 MYBL2 emerged as the top hits in both cell lines (Figures 1B
on non-transformed cells such as RPE-1, whereas CHK1i mono-                    and S1B; Tables S1 and S2). All four of the individual sgRNAs tar-
therapy exhibits activity in multiple cancer cell lines (Blosser               geting each of these genes showed substantial enrichment in
et al., 2020; Cole et al., 2011; King et al., 2015; Koppenhafer                both cell lines (Figures 1C and 1D). The presence of a CDC25
et al., 2018). However, intrinsic or acquired resistance to                    family member and CCNA2 is consistent with previous studies
CHK1i may limit clinical efficacy. Given the myriad roles of                   (King et al., 2015; Ruiz et al., 2016; Wang et al., 2019), but having
CHK1, such resistance could potentially emerge by a wide range                 multiple MMB-FOXM1 complex components as hits, including
of possible mechanisms. CRISPR-Cas9 pooled whole-genome                        LIN52 in A549 cells (Figure S1B), stood out, as this finding impli-
single guide RNA (sgRNA) knockout (KO) screens have emerged                    cated mitotic gene expression in CHK1i sensitivity.
as particularly useful tools for unbiased discovery of gene losses                To validate these hits, KO lines targeting each gene were
that confer a phenotype of interest (Hanna and Doench, 2020).                  generated using sgRNAs as well as an empty vector (EV) control.
Prior CRISPR screens with ATR inhibitors (ATRis) have impli-                   The KO lines were highly resistant to CHK1i compared to the EV
cated both the cell cycle and DDR regulatory roles of the ATR-                 cells (Figures 1E and S1C). To determine how the loss of mitosis-
CHK1 pathway in modulating inhibitor sensitivity. Loss of                      promoting genes would confer CHK1i resistance, clonal A549
CDC25 family members conferred resistance to ATR inhibition,                   cell lines with two independent sgRNAs targeting FOXM1 and
and the loss of RNaseH2 increased sensitivity (Ruiz et al.,                    LIN54 were generated (Figure 1F). There were no apparent differ-
2016; Wang et al., 2019). Mechanistic efforts to understand                    ences in the growth rate of the LIN54 and FOXM1 KO versus EV
how different roles of the ATR-CHK1 pathway mediate drug                       cells over 10 days (Figure 1G). LIN54 and FOXM1 KO cells
sensitivity can increase understanding of the underlying biology               showed increased viability in the presence of CHK1i and two
of these inhibitors, identify potential markers, and improve stra-             different ATRi (Figures 1H, S1D, and S1E).
tegies to overcome drug resistance.
                                                                               Perturbation of LIN54 and FOXM1 reduces replication
RESULTS                                                                        stress markers during Late S phase
                                                                               To determine if LIN54 and FOXM1 were required for replication
MMB-FOXM1 complex components are required for                                  stress induced by CHK1i, LIN54 and FOXM1 KO cells were
CHK1i sensitivity in NSCLC cells                                               treated with CHK1i for up to 24 h (Figure 2A). Phosphorylated
To identify genes whose monogenic loss confers resistance to                   CHK1 (pS317 and pS345) appeared within 2 h of treatment in
the CHK1i prexasertib, genome-wide CRISPR-Cas9 KO screens                      EV as well as in LIN54 and FOXM1 KO cells. In EV cells, phos-
were performed in two non-small-cell lung cancer (NSCLC) cell                  phorylated RPA (pS4/S8) appeared within 2 h of treatment
lines, namely, A549 and NCI-H460. Both lines showed compara-                   (Figure 2A, lanes 2 and 17), followed by pKAP1 at 4 and 8 h
ble CHK1i sensitivity, with half maximal inhibitory concentration              (Figure 2A, lanes 3, 4, 18, and 19). Eventually, g-H2AX accumu-
(IC50) values in the 50- to 100-nM range (Figure S1A). When                    lated after 8 and 24 h of treatment (Figure 2A, lanes 4, 5, 19, and
treated at these concentrations, cells showed increases in                     20). In contrast, LIN54 and FOXM1 KO cells showed greatly

Figure 1. MMB-FOXM1 complex components are required for CHK1i sensitivity in NSCLC cells
(A) Immunoblot of replication stress markers in A549 and NCI-H460 cells after treatment with increasing CHK1i concentrations for 24 h.
(B) Table of genes identified by the STARS algorithm as having multiple sgRNAs significantly enriched after CHK1i treatment.
(C and D) Volcano plots of sgRNA enrichment in CHK1i-positive selection screen in A549 (C) and NCI-H460 (D) cells.
(E) Viability curves of A549 cells expressing sgRNAs in the presence of increasing CHK1i concentrations for 72 h. n = 3.
(F) Immunoblot of MMB-FOXM1 components in A549 LIN54 KO and FOXM1 KO cells lines.
(G) A 10-day growth curve and doubling time of A549 EV, LIN54 KO, and FOXM1 KO cells. n = 3.
(H) Viability curves of A549 EV, LIN54 KO, and FOXM1 KO cells in the presence of increasing CHK1i concentrations for 72 h. n = 3.
Mean ± SD.

                                                                                                           Cell Reports 34, 108808, March 2, 2021 3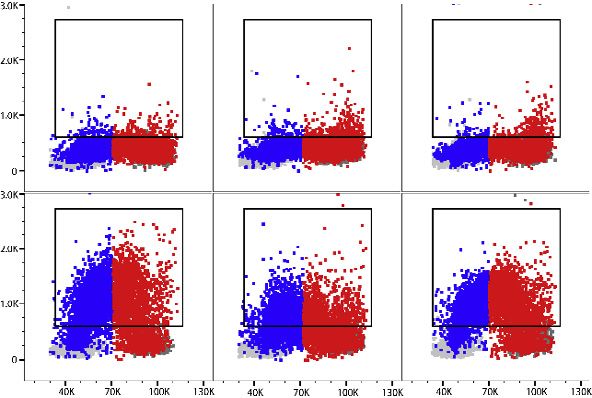
ll
     OPEN ACCESS                                     Article

    A

    B

    C                                      D

                                               (legend on next page)

4 Cell Reports 34, 108808, March 2, 2021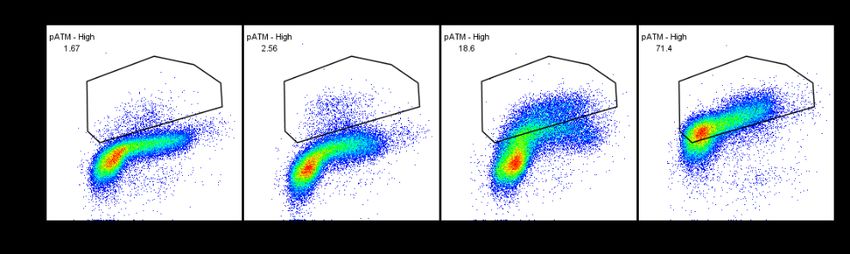
ll
Article                                                                                                                          OPEN ACCESS

reduced levels and delayed appearance of the replication stress            levels that were insensitive to CHK1i (Figure S2F). In contrast,
markers in response to CHK1i. Detectable levels of pS4/S8-RPA              pKAP1 was significantly induced by CHK1i in siMYBL2 sam-
were delayed until 8 and 24 h after CHK1i and were diminished in           ples in both Early and Late S phase. These results suggest
both LIN54 and FOXM1 KO cells compared to EV (Figure 2A,                   that induction of replication stress may not be sufficient for
lanes 9, 10, 14, 15, 24, 25, 29, and 30). Levels of pKAP1 and              CHK1i sensitivity.
g-H2AX were also decreased in LIN54 and FOXM1 KO cells (Fig-
ure 2A, lanes 10, 15, 25, and 30). These results indicate that,            Induction of pKAP1 by CHK1i during Late S phase is ATR
although the LIN54 and FOXM1 KO cells respond in a similar                 dependent
manner as EV cells to CHK1i as indicated by phosphorylation                To understand the role of replication stress in CHK1i sensitivity,
of CHK1 at ATR target sites, they showed greatly reduced                   the requirements for pKAP1 induction were assessed. Ataxia Tel-
DNA replication stress and DNA damage responses.                           angiectasia Mutated (ATM), ATR, and DNA-dependent Protein
   To determine if CHK1i-induced replication stress was a cell-            Kinase (DNA-PK) activities have been linked to KAP1 phosphor-
cycle-dependent event, pKAP1 levels were assessed in four                  ylation at S824 (White et al., 2006). Subsequent studies predom-
NSCLC cell lines by flow cytometry. Of note, both A549 and                 inantly focused on ATM-dependent KAP1 phosphorylation in
NCI-H460 harbor KRAS mutations and are p53 wild-type,                      response to DNA DSBs (White et al., 2012; Ziv et al., 2006) or
whereas NCI-H23 contains both KRAS and p53 mutations,                      more recently DNA-PK-dependent KAP1 phosphorylation in
and NCI-H1299 has wild-type KRAS and is p53 null. CHK1i                    response to ATR inhibition (Buisson et al., 2015; Dunlop et al.,
treatment of the NSCLC cell lines did not lead to substantial              2020). To assess the contribution of ATM and DNA-PK activity
changes in cell cycle distribution regardless of KRAS or p53               to KAP1 phosphorylation after treatment with CHK1i or agents
status except for a slight but significant decrease in the G2/M            that induce DNA damage, i.e., hydroxyurea (HU) or doxorubicin
phase of H460 cells (Figures S2A and S2B). pKAP1 was                       (DOXO), ATM and DNA-PK autophosphorylation was assessed
induced by CHK1i during Late S phase and, to a lesser extent,              in relation to pKAP1 levels by immunoblot and by flow cytometry
Early S phase, but not during G1 or G2/M in NSCLC cells                    in the case of ATM. pDNA-PK was induced to a similar extent by
regardless of their KRAS or p53 status (Figures 2B and 2C),                all three treatments, whereas pATM was preferentially induced
indicating that CHK1i-induced replication stress peaks during              by DOXO (Figures 3A and S3C). HU led to reduced DNA synthe-
late DNA synthesis.                                                        sis, whereas CHK1i or DOXO did not alter DNA synthesis appre-
   Next, pKAP1 levels and cell cycle distribution were assessed            ciably (Figure S3A). pKAP1-positive cells were induced modestly
in LIN54 and FOXM1 KO cells or cells depleted for CCNA2,                   after CHK1i or HU and to a greater extent after DOXO treatment
MYBL2, or LIN54 to determine if perturbation of these genes pre-           (Figures 3A and S3B). Similarly, pATM levels in pKAP1-positive
vented the induction of pKAP1 in Late S phase. MYBL2                       cells were elevated to a lesser extent in CHK1i- or HU-treated
and cyclin A have been previously implicated in DNA synthesis              cells than DOXO-treated cells (Figures 3B and 3C), raising the
(Garcı́a and Frampton, 2006; Katsuno et al., 2009), raising the            possibility that another kinase led to CHK1i-induced activation
possibility that altered S phase progression could explain why             of pKAP1 during Late S phase.
perturbation of these loci conferred CHK1i resistance. CHK1 in-               Given that increased pCHK1 after CHK1i treatment is a marker
hibition did not consistently alter the cell cycle distribution of the     of ATR activity, it was possible that ATR could be phosphory-
LIN54 or FOXM1 KO cells except for increased G2/M popula-                  lating KAP1 instead of ATM. To determine the relative contribu-
tions (Figure S2C). Similarly, depletion of LIN54, CCNA2, or               tion of ATM, ATR, and DNA-PK to KAP1 phosphorylation, cells
MYBL2 led to diverging changes in S phase populations but                  were treated with an ATR, ATM, or DNA-PK inhibitor alone or
increased G2/M populations, consistent with impaired G2/M                  in combination with CHK1i. Similar to CHK1i, ATRi treatment
progression (Figures S2D and S2E).                                         led to a modest decrease in the G2/M population, whereas
   Loss of either LIN54 or FOXM1 significantly reduced the                 ATMi or DNA-PKi treatment did not significantly perturb cell cy-
induction of pKAP1 in Late S phase as well as small but signif-            cle distribution (Figure S3D). However, ATRi did not increase
icant populations of pKAP1-positive cells in Early S phase                 levels of pKAP1 during S phase, indicating that this increase
(Figure 2D). pKAP1 levels in G2/M were similar in CHK1i                    was specific to CHK1i (Figures 3D and 3E). ATRi but not ATMi
compared to vehicle-treated cells, but the overall levels of               or DNA-PKi, when combined with CHK1i, led to a significant
pKAP1 in G2/M were lower in the LIN54 and FOXM1 KO cells                   reduction in pKAP1-positive cells during Late S phase. The
than those in EV cells. Depletion of LIN54 reduced the appear-             requirement of ATR activity for CHK1i-induced KAP1 phosphor-
ance of pKAP1 in Late S phase similar to the LIN54 KO cells,               ylation during Late S phase suggests that DNA replication was
whereas perturbation of CCNA2 resulted in increased pKAP1                  deregulated.

Figure 2. Loss of MMB-FOXM1 complex components reduces replication stress markers during Late S phase
(A) Immunoblot of replication stress markers in EV, LIN54 KO, and FOXM1 KO A549 cells treated with 100 nM CHK1i over a 24-h time course.
(B–D) Flow cytometry to assess pKAP1 levels in different cell cycle phases.
(B) NSCLC cells were treated with DMSO or 100 nM CHK1i for 2 h and pulsed with 10 mM EdU for the last hour. pKAP1 versus DNA content with cell cycle
populations denoted by the colors in the legend. Box denotes the gate for pKAP1-positive cells.
(C) Quantification of (B), with replicates. n = 3.
(D) EV, LIN54 KO, and FOXM1 KO cells were treated and labeled as in (B). pKAP1-positive cells in each cell cycle phase. n = 3.
Mean ± SEM; ANOVA with Tukey correction; *p < 0.05; **p < 0.01; ***p < 0.001.

                                                                                                     Cell Reports 34, 108808, March 2, 2021 5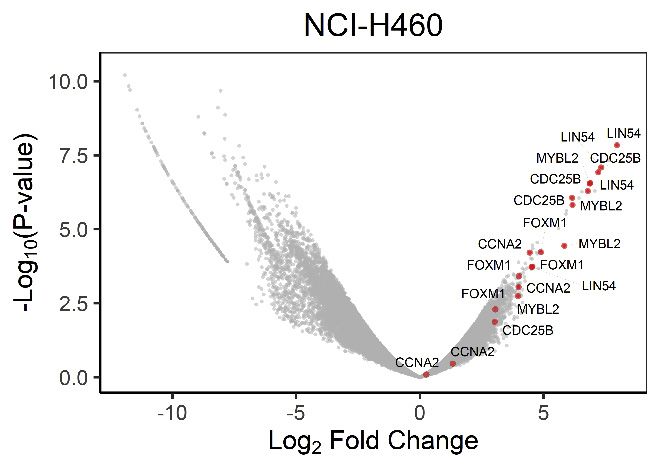
ll
OPEN ACCESS Article
A B
C
D E
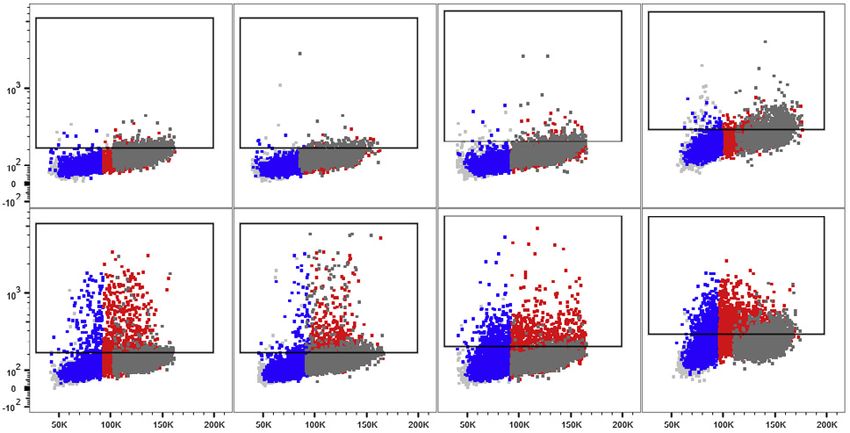
Figure 3. Induction of pKAP1 by CHK1i during Late S phase is ATR dependent
(A) Immunoblot of replication stress markers in A549 cells treated with 100 nM CHK1i, 2 mM HU, or 500 nM DOXO for 2 h.
(B and C) Flow cytometry to assess ATM activity and pKAP1 levels in cells treated as in (A) and pulsed with 10 mM EdU for the last hour.
(B) Density dot plot of pS1981 ATM levels versus DAPI stain of pKAP1-positive cells. Box denotes pS1981 ATM high based on the DOXO-treated sample.
(C) pS1981 ATM mean fluorescence intensity (MFI) in pKAP1-positive cells identified in Figure S3B. n = 4.
(D and E) Flow cytometry of pKAP1 levels after treatment as in Figure 2B ± ATRi, ATMi, or DNA-PKi. (D) pKAP1 versus DAPI levels with cell cycle phases overlaid
in the colors denoted in the legend. Box denotes the pKAP1-positive population.
(E) Quantification of (D), with replicates. n = 5. ANOVA-mixed effects analysis with Tukey correction.
Mean ± SEM; ANOVA with Tukey correction; *p < 0.05; **p < 0.01; ***p < 0.001.
CHK1i increases DNA replication regardless of loss of KO cells during Early S phase, DNA synthesis during Late S phase
LIN54 or FOXM1 was significantly reduced in the CHK1i-treated LIN54 KO and
CHK1 inhibition can lead to increased origin firing in a CDK- FOXM1 KO cells compared to those in EV cells.
dependent manner (Petermann et al., 2010). To assess the levels To understand the impact of CHK1 inhibition on DNA replication,
of DNA synthesis after CHK1 inhibition, 5-ethynyl-2-deoxyuridine levels of chromatin-bound CDC45 and Proliferating Cell Nuclear
(EdU) incorporation was quantified in EV, LIN54 KO, and FOXM1 Antigen (PCNA) were assessed by chromatin flow cytometry.
KO cells (Figure 4A). The levels of DNA synthesis in both Early and CDC45 loading on DNA can provide a measure of origin firing (Köh-
Late S phase increased significantly in response to CHK1i ler et al., 2016), and PCNA bound to chromatin can be used to
compared to those in response to DMSO in EV, LIN54 KO, and assess active DNA replication (Janke et al., 2018; Sirbu et al.,
FOXM1 KO cells. Although the increased levels of DNA synthesis 2013). Chromatin-bound CDC45 and PCNA increased signifi-
after CHK1i treatment were similar in EV, LIN54 KO, and FOXM1 cantly in response to CHK1i in EV cells as well as LIN54 and
6 Cell Reports 34, 108808, March 2, 2021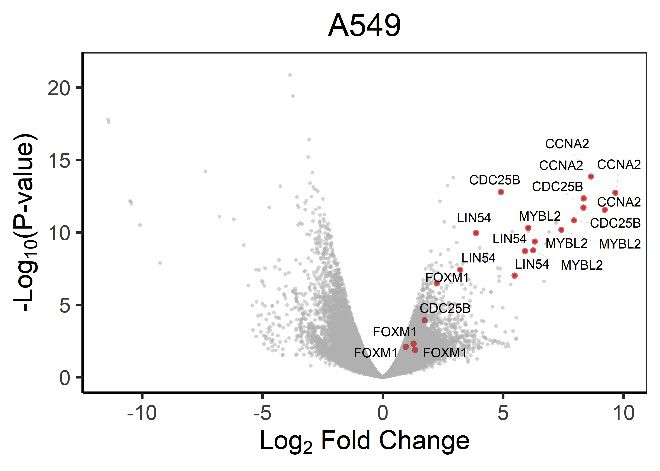
ll
Article                                                                                                                     OPEN ACCESS

A                                           B                                                Figure 4. CHK1i increases DNA replication
                                                                                             regardless of the loss of LIN54 or FOXM1
                                                                                             (A) Relative EdU incorporation in Early S and Late
                                                                                             S phase in LIN54 or FOXM1 KO cells after CHK1
                                                                                             inhibition. MFI of S phase populations per gates in
                                                                                             Figure S2A were normalized to EV DMSO Early
                                                                                             S populations. n = 3.
                                                                                             (B and C) Chromatin flow cytometry for chromatin-
                                                                                             bound CDC45.
                                                                                             (B) CDC45 versus DAPI levels with cell cycle phases
                                                                                             overlaid in the colors denoted. Box denotes >98th
                                                                                             percentile of CDC45 in the sgEV-DMSO sample.
                                                                                             (C) MFI of CDC45 in Early and Late S phase. n = 3.
                                                                                             (D and E) Chromatin flow cytometry for chromatin-
                                                                                             bound PCNA.
C                                           D                                                (D) PCNA versus DAPI levels with cell cycle phases
                                                                                             overlaid in the colors denoted. Box denotes >98th
                                                                                             percentile of PCNA in the sgEV-DMSO sample.
                                                                                             (E) MFI of PCNA in Early and Late S phase. n = 3.
                                                                                             Mean ± SEM; ANOVA with Tukey correction; *p <
                                                                                             0.05; **p < 0.01; ***p < 0.001.

                                                                                              peared within 2 h post-release from a
                                                                                              thymidine block after 1 h of CHK1i treat-
                                                                                              ment compared to 9 h post-release in un-
                                                                                              treated cells (Figure S4A). pFOXM1 was
                                                                                              induced by CHK1i in Late S phase in all
E                                                                                             four NSCLC cell lines tested (Figures 5B
                                                                                              and 5C), consistent with perturbation of
                                                                                              the ATR-CHK1 pathway leading to early
                                                                                              MMB-FOXM1 activity.
                                                                                                 To determine if disruption of the MMB-
                                                                                              FOXM1 complex alters gene expression
                                                                                              in response to CHK1 inhibition, RNA
                                                                                              sequencing (RNA-seq) profiling was per-
                                                                                              formed in EV, LIN54 KO, and FOXM1 KO
                                                                                              cells synchronized in S phase and treated
                                                                                              with CHK1i for 2 h. Gene set enrichment
                                                                                              analysis (GSEA) revealed that DNA repair
                                                                                              genes were not significantly perturbed by
                                                                                              CHK1 inhibition (Figure S4B). In contrast,
                                                                                              G1/S genes, comprised of genes involved
FOXM1 KO cells during Early S phase, and in EV and FOXM1 KO            in DNA replication, were significantly decreased (Figure S4C),
cells during Late S phase (Figures 4B–4E), consistent with             whereas G2/M genes, containing mitotic regulator genes, were
increased origin firing throughout S phase. Because CHK1i-             significantly increased following CHK1 inhibition (Figure S4D).
induced increases in DNA replication and origin firing were not        G1/S and G2/M genes were well represented in the top 350
blunted by the loss of LIN54 or FOXM1, particularly in Early S         most differentially expressed genes in the EV cells after CHK1 in-
phase, another function of the MMB-FOXM1 complex was                   hibition (Figure 5D). G1/S genes comprised the downregulated
required for CHK1i sensitivity.                                        genes (Figure S4E), whereas G2/M genes were among the upre-
                                                                       gulated genes (Figure S4F), consistent with the GSEA.
Activation of G2/M genes after CHK1i is MMB-FOXM1                      Compared to EV cells, a loss of LIN54 restored the expression
dependent                                                              of downregulated genes to a greater extent than the loss of
Phosphorylation of the MMB-FOXM1 components MYBL2 and                  FOXM1 (Figure S4G). The induction of upregulated genes, how-
FOXM1 by cyclin-CDK complexes promotes their transcriptional           ever, was impaired to a similar extent in both LIN54 and FOXM1
activity in an ATR-CHK1-dependent manner (Laoukili et al., 2008;       KO cells (Figure S4H). The induction of MMB-FOXM1 target
Saldivar et al., 2018; Ziebold et al., 1997). The induction of FOXM1   genes by CHK1i was significantly reduced in both the LIN54
phosphorylation on T600 (pFOXM1) after CHK1 inhibition                 and FOXM1 KO cells (Figures 5E–5G). Of note, CCNA2, a top
was assessed in synchronized (Figure S4A) and asynchronously           screen hit, and CCNB1, a significant hit in H460 cells (Fig-
replicating A549 cells by flow cytometry (Figure 5A). pFOXM1 ap-       ure S1B), were both present in a group of highly expressed

                                                                                               Cell Reports 34, 108808, March 2, 2021 7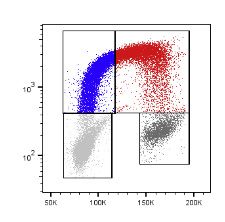
ll
      OPEN ACCESS                                                                                                                               Article

A                                                           B                                                       C

                                                            E                                         G
D

                                                            F

H                                        I                                     J                                          K

Figure 5. Activation of G2/M genes after CHK1i is MMB-FOXM1 dependent
(A–C) pFOXM1 levels in NSCLC cell lines after CHK1i. Cells were treated as in Figure 2B.
(A) pFOXM1 versus DAPI levels with cell cycle phase overlaid in the colors denoted. Box denotes high pT600 FOXM1 levels found in G2/M cells of the DMSO sample.
                                                                                                                              (legend continued on next page)

8 Cell Reports 34, 108808, March 2, 2021
ll
Article OPEN ACCESS
MMB-FOXM1 target genes not induced by CHK1i in either LIN54 An increase in pH3-positive cells was observed during Late
or FOXM1 KO cells. Levels of these genes, as well as the top hit S phase following inhibition of ATR or CHK1 but not ATM (Fig-
CDC25B, were significantly increased in S phase by CHK1 inhi- ure 6D). Similarly, ATR and CHK1 but not ATM inhibition led to
bition in EV but not in LIN54 and FOXM1 KO cells (Figures 5H, 5I, some increase in pH3 in G2/M cells (Figure 6E). Dual inhibition
and S4I–S4K). Cyclin B1 protein levels were reduced and not of ATR and CHK1 led to a significant increase, relative to either
induced by CHK1i in S-phase LIN54 KO cells (Figure S4L). alone, in pH3-positive cells during Late S phase but not in G2/
Thus, perturbing the MMB-FOXM1 complex impairs the induc- M (Figures 6D and 6E). These results indicate that inhibition of
tion of CDK1 activators during S phase after CHK1 inhibition. the ATR-CHK1 pathway leads to DNA replication and mitotic
The decrease in CDK1 activators with MMB-FOXM1 complex events occurring simultaneously particularly during Late S
perturbation suggests a positive feedback loop between the phase.
MMB-FOXM1 complex and cyclin/CDK1 complexes. Consistent Next, we assessed the role of the MMB-FOXM1 complex in
with this, CCNA2 small interfering RNA (siRNA) knockdown sub- regulating CHK1i-induced pH3 during S phase (Figure 6F).
stantially decreased the percentages of high pFOXM1 cells in CHK1 inhibition led to increased levels of pH3 during Late
Late S and G2/M (Figures S4M and S4N). The fraction of G2/M S phase in EV cells, whereas the loss of LIN54 or FOXM1 abol-
cells with high levels of pFOXM1 was not significantly affected ished this effect (Figures 6F and 6G). LIN54 and FOXM1 KO cells
by CHK1i but was significantly decreased in LIN54 KO and si- also showed a significantly smaller fraction of G2/M cells positive
MYBL2 cells (Figures 5K and S4N) Perturbation of LIN54 or for pH3 independent of CHK1i treatment (Figure 6H). This was
MYBL2 also prevented the induction of pFOXM1 in Late S phase similarly observed following siRNA knockdown of LIN54,
by CHK1i (Figures 5J, S4L, and S4M), indicating that an intact CCNA2, or MYBL2 (Figures 6I and 6J). This result indicates
MMB complex is required. Taken together, these results indicate that a functional MMB-FOXM1 complex is required for CHK1i-
that an MMB-FOXM1-CDK1 feedback loop drives the CHK1i- induced breakdown in the separation between DNA replication
dependent induction of the G2/M transcription program during and mitosis.
S phase.
Activation of an MMB-FOXM1 complex CDK1-positive
MMB-FOXM1 complex components are required for feedback loop is required for CHK1i-induced replication
CHK1i-induced premature mitosis in Late S phase catastrophe
The premature activation of the mitotic program in response to CDK1 activity has been previously implicated in ATR-CHK1i sensi-
CHK1i raised the possibility that essential S phase and mitotic tivity (Aarts et al., 2012; Ruiz et al., 2016). CDK1 activity was
processes were occurring simultaneously. Increased or prema- restricted in CHK1i-resistant FAM122A KO cells by WEE1 stabili-
ture histone H3 S10 phosphorylation (pH3), a mitotic marker, zation (Li et al., 2020), suggesting that CDK1 activities during the
has been previously observed following perturbation of the S/G2 transition influence CHK1i sensitivity. Which activities of
ATR-CHK1 pathway (Ruiz et al., 2016; Zuazua-Villar et al., CDK1 are required for replication catastrophe, however, remained
2014). A limitation of these studies is that the cell cycle phase unclear. To identify the levels of CDK1 activity necessary to trigger
was assessed by DNA content, leaving it unclear whether pH3 an MMB-FOXM1-CDK1 feedback loop and premature mitosis in S
induced by these inhibitors coincided with active DNA synthesis. phase, A549 cells were treated with CHK1i and increasing concen-
Simultaneous pH3 and BrdU staining, however, was observed in trations of the CDK1 inhibitor RO3306 (CDK1i). As levels of CDK1i
CHK1 haploinsufficient mice (Lam et al., 2004). If DNA synthesis were increased, the fraction of G2/M cells increased indepen-
and mitosis were occurring simultaneously, mitotic events could dently of CHK1 inhibition (Figure S5D) and the fraction of G1 and
sufficiently disrupt DNA synthesis and trigger replication Early S phase cells decreased correspondingly (Figures S5A and
catastrophe. S5B), whereas the levels of Late S phase cells did not change (Fig-
To determine if ATR or CHK1 inhibition led to a breakdown in ure S5C). Increased DNA synthesis in response to CHK1i was not
the separation of DNA synthesis from mitosis, levels of pH3 were diminished by less than 5 mM CDK1i (Figures 7A and 7B).
assessed by flow cytometry during each cell cycle phase in four In contrast to DNA replication, significant induction of
NSCLC cell lines (Figure 6A). Levels of pH3 were increased pFOXM1-High cells by CHK1i in Late S phase was prevented
particularly in kate S phase in all four lines (Figures 6B and 6C). by 2.5 mM CDK1i (Figure 7C). Although lower concentrations of
(B and C) Percentage of pFOXM1-High cells in Early and Late S phase (B) and G2/M (C). n = 4.
(D–G) Gene expression during S phase. EV, LIN54 KO, and FOXM1 KO cells were synchronized by single thymidine block. Samples were treated with DMSO or
100 nM CHK1i at 1 h post-release and samples were collected at 3 h post-release. Total RNA was extracted and sequenced.
(D) Heatmap showing the 350 most differentially expressed genes in EV cells between the DMSO- and CHK1-treated samples.
(E) Expression of MMB-FOXM1 target genes in relation to EV cells. Log2 fold change calculated using DESeq2.
(F and G) Expression of MMB-FOXM1 target genes upregulated in EV cells after CHK1i by R1.5-fold change (51 genes), depicted as log2 fold change determined
in relation to EV DMSO-treated cells, with % of genes upregulated above 1.5-fold change in each sample reported (F), and as a heatmap (G).
(H and I) qRT-PCR of MMB-FOXM1 target genes CCNA2 (H) and CCNB1 (I) during S phase in EV, LIN54 KO, and FOXM1 KO cells after CHK1 inhibition. Samples
were synchronized, treated, and collected as in (D)–(G). n = 3.
(J and K) pFOXM1 levels in LIN54 KO cells. EV or LIN54 KO cells were treated as in Figure 2B. Samples were stained for pFOXM1, EdU, and DAPI. Percentage of
pFOXM1-High cells in Early and Late S phase (J) and G2/M. (K) n = 4.
Mean ± SEM; ANOVA with Tukey correction; *p < 0.05; **p < 0.01; ***p < 0.001; ****p < 0.0001.
Cell Reports 34, 108808, March 2, 2021 9ll
OPEN ACCESS Article
A B C
D E
G H
F
I J
(legend on next page)
10 Cell Reports 34, 108808, March 2, 2021ll
Article OPEN ACCESS
CDK1i also significantly reduced the fraction of pFOXM1-High pKAP1 levels in G2/M and block pKAP1 induction in Late S
cells in Late S phase after CHK1i in a dose-dependent manner, phase (Figures 7G, S5J, and S5K). Furthermore, the same con-
pFOXM1-High cells were still significantly induced at these con- centration of CDK1i prevented pH3 induction, suggesting that
centrations by CHK1i. A small but significant increase in the breakdown in the separation of DNA synthesis and mitosis
pFOXM1 after CHK1i treatment was observed at 2.5 mM CDK1i is a required step for DNA replication stress after CHK1
(Figure 7D), suggesting that, although FOXM1 can still be phos- inhibition.
phorylated, the level of CDK1 activity blocked by 2.5 mM CDK1i To establish if activation of the MMB-FOXM1-CDK1 feedback
was necessary for significant accumulation of pFOXM1. loop is required for CHK1i-induced replication catastrophe, the
Increasing doses of CDK1i did not affect the fraction of amount of CDK1 activity required for apoptosis 24 h after
pFOXM1-High cells in G2/M but led to a decrease in pT600 CHK1 inhibition was assessed by Annexin V/propidium iodide
FOXM1 levels in a dose-dependent manner, with a significant (PI) staining. CHK1i induced an apoptotic population that was
drop as the concentration of CDK1i increased from 1 mM to dependent on CDK1 activity (Figure 7H). At 2.5 mM, CDK1i
2.5 mM (Figures S5E and S5F). A total of 2.5 mM CDK1i reduced blocked CHK1i-induced apoptosis, whereas 10 mM CDK1i
the accumulation of pFOXM1 in S-phase-synchronized A549 significantly induced apoptosis by itself. The induction of replica-
and H460 cells (Figure S5G). CDK1 inhibition did not alter tion stress markers was also examined at 24-h post-CHK1i treat-
pMYBL2 levels but caused a shift in the gel migration of ment (Figure S6A). pKAP1, as well as pRPA and pCHK1, were
the pMYBL2 band, suggesting that other MYBL2 phosphoryla- induced in the presence of 2.5 mM but not 10 mM CDK1i. A total
tion sites may be CDK1 dependent. The degradation of cyclin of 2.5 mM or higher of CDK1i reduced CHK1i-induced g-H2AX,
E in S phase is dependent on CDK2 activity (Clurman et al., although 10 mM CDK1i induced low levels of g-H2AX on its own.
1996). Doses up to 10 mM of RO-3306 did not affect cyclin E Replication catastrophe occurs when replication factors such
degradation after CHK1 inhibition in either A549 or H460 cells, as RPA become exhausted, leading to unrepairable DNA dam-
suggesting that CDK2 activity was not impaired by these levels age (Toledo et al., 2017). Prolonged CHK1i treatment induced
of CDK1i. a pS4/S8 RPA-positive population that was also g-H2AX positive
To determine if 2.5 mM CDK1i also blocked the induction of (Figures 7I, 7J, and S6B), indicating the accumulation of DNA
G2/M genes by CHK1i, the expression of MMB-FOXM1 target damage in replication stressed cells. A pS4/S8 RPA-positive
genes was assessed by qRT-PCR in S phase A549 and H460 population was observed with 2.5 mM CDK1i, consistent with a
cells. A total of 2.5 mM CDK1i blocked the induction of CCNB1 mitotic arrest where RPA is hyperphosphorylated (Liu et al.,
but not CDC25B or CCNA2 in A549 cells (Figure 7E) and signifi- 2012; Oakley et al., 2003). Treatment with CHK1i and 2.5 mM
cantly reduced the induction of CCNB1 and CCNA2 but not or higher CDK1i reduced levels of pS4/S8 RPA-positive/g-
CDC25B in the more sensitive H460 cells (Figure S5H). The dif- H2AX-High cells, but only 10 mM CDK1i completely blocked
ferential effect of CDK1i on these MMB-FOXM1 target genes the induction of pS4/S8 RPA in response to CHK1i. This finding
could reflect the differing number of CHR motifs in the gene pro- indicated that blocking sufficient CDK1 activity to induce mitosis
moters (Fischer et al., 2016) or the recently identified regulation during DNA replication prevented the accumulation of DNA
of epigenetic factors by CDK1 (Michowski et al., 2020). The damage but not replication stress. Chromatin-bound RPA and
consistent result is that CDK1 activity remaining after 2.5 mM g-H2AX were also examined to determine if this DNA damage
CDK1i was sufficient to block CHK1i-induced MMB-FOXM1 ac- was due to RPA exhaustion. CHK1i induced an RPA-High popu-
tivity and increased expression of CCNB1, the mitotic activator lation that was g-H2AX-High (Figures 7K, S6C, and S6D), consis-
of CDK1, during S phase. tent with replication catastrophe. An RPA-positive/g-H2AX-High
Similarly, 2.5 mM and higher doses of CDK1i reduced the population was also induced, suggesting a low RPA exhaustion
appearance of the mitotic marker pH3 in response to CHK1i dur- threshold or exhaustion of an alternative replication factor.
ing Late S phase and, in general, during G2/M (Figures 7F and Similar to pS4/S8 RPA, 2.5 mM CDK1i blocked the induction of
S5I). Both the fraction of pKAP1-positive G2/M cells as well as the RPA-High, g-H2AX-High population, indicating that prema-
CHK1i-induced pKAP1-positive S phase cells was dependent ture activation of the mitotic program is required for the accumu-
on CDK1 activity (Figures 7G, S5J, and S5K). Increasing levels lation of DNA damage in RPA exhausted cells.
of CDK1i reduced the appearance of pKAP1 in Early S, Late S, The requirement for mitotic levels of CDK1 activity in
and G2. A total of 2.5 mM CDK1i was sufficient to reduce CHK1i-induced replication catastrophe raised the possibility
Figure 6. MMB-FOXM1 complex components are required for CHK1i-induced premature activation of mitosis in Late S phase
(A–C) Flow cytometry analysis of pH3 levels by cell cycle phase in NSCLC cells. Cells were treated as in Figure 2B.
(A) Dot plot of pH3 levels versus DAPI levels with cell cycle phases overlaid in the colors denoted. Box denotes the pH3+ gate.
(B and C) Percent pH3 positive cells in Early and Late S phase (B) and G2/M (C). n = 3.
(D and E) Flow cytometry analysis of pH3 levels in A549 cells treated as in Figure 2B ± 100 nM ATRi or 1 mM ATMi.
(F–H) Flow cytometry analysis of pH3 levels by phase of the cell cycle in LIN54 KO or FOXM1 KO A549 cells after CHK1i. Samples treated as in Figure 2B.
(F) pH3 levels versus DAPI levels with cell cycle phases overlaid in the colors denoted. Box denotes the pH3+ gate.
(G and H) Percent pH3 positive cells in Early and Late S phase (G) and G2/M (H). n = 3.
(I and J) Flow cytometry analysis of pH3 levels by phase of the cell cycle in A549 cells following LIN54, CCNA2, or MYBL2 siRNA knockdown. Percent pH3 positive
cells in Early and Late S phase (I) and G2/M (J). n = 4.
Mean ± SEM; ANOVA with Tukey correction; *p < 0.05; **p < 0.01; ***p < 0.001.
Cell Reports 34, 108808, March 2, 2021 11ll
OPEN ACCESS Article
A B C
D E F
G H I
J K
(legend on next page)
12 Cell Reports 34, 108808, March 2, 2021ll
Article OPEN ACCESS
that replication catastrophe could be induced in LIN54 or FOXM1 FOXM1 complex activity, G2/M gene expression, and CDK1-
KO cells by aberrantly activating CDK activity by targeting an dependent phosphorylation required for CHK1i sensitivity.
alternate negative regulator. Levels of WEE1, which phosphory- The CHK1i-induced phosphorylation of KAP1 at S824 is an
lates an inhibitory site on CDK1 (McGowan and Russell, 1993), ATR- and CDK1-dependent event that reflects dysregulation of
were induced by CHK1 inhibition during S phase in EV, LIN54 the S/G2/M transition. A CHK1i-independent population of
KO, and FOXM1 KO cells (Figure S7A). An inhibitor of WEE1, ada- pS824 KAP1-positive cells was observed basally in G2/M. The
vosertib (WEE1i), has shown synergy in combination with CHK1 is presence of this G2/M population and its dependency on
in vivo (Carrassa et al., 2012; Chilà et al., 2015; Russell et al., CDK1 activity indicate that KAP1 S824 phosphorylation is a
2013). Treatment of EV and LIN54 KO cells with WEE1i resulted cell-cycle-dependent event. KAP1 phosphorylation promotes
in the appearance of a slower migrating FOXM1 species consis- chromatin relaxation to facilitate DNA damage repair and coin-
tent with phosphorylation resulting from increased CDK activity cides with the loss of HP1 foci on chromatin (White et al.,
(Figure S7B). The ATR-CHK1 pathway was activated after 2012; Ziv et al., 2006). HP1 chromatin dynamics are altered dur-
WEE1i treatment in EV, LIN54 KO, and FOXM1 KO cells, as de- ing mitosis to facilitate chromosome segregation (Abe et al.,
noted by induction of pCHK1 in the WEE1i-treated samples. 2016; Chu et al., 2014), so the observed pKAP1 in G2/M could
Thus, WEE1 and the ATR-CHK1 pathway work to oppose CDK result from the regulation of heterochromatin during G2/M. Sur-
activation when the other is inhibited. g-H2AX was induced in prisingly, the induction of pKAP1 in Late S by CHK1i was ATR
LIN54 or FOXM1 KO cells after WEE1i but not CHK1i treatment dependent but not ATM or DNA-PK dependent. Increased
(Figure S7B), suggesting that cells that become resistant to pKAP1 after CHK1 inhibition could reflect altered heterochro-
CHK1i by perturbation of the MMB-FOXM1 pathway may still matin dynamics, given that pKAP1 promotes chromatin relaxa-
be sensitive to WEE1i. Consistent with this observation, EV cells tion, as the cell attempts to complete DNA replication prior to
and three out of four LIN54 or FOXM1 KO cell lines had similar mitosis. Further study of KAP1 phosphorylation will be needed
sensitivities to WEE1i (Figure S7C). Viability in LIN54 KO and to understand the function of KAP1 phosphorylation in the
FOXM1 KO cells was not further reduced by the addition of S/G2 transition and in response to CHK1 inhibition.
CHK1i to WEE1i (Figure S7D), in keeping with the dependency Premature mitosis during DNA replication is necessary for
on MMB-FOXM1 complex-induced premature mitosis for replication catastrophe and stress after CHK1 inhibition. Loss
CHK1i sensitivity. of MMB-FOXM1 components reduced the induction of the
mitotic marker pH3 during Late S phase after CHK1 inhibition.
DISCUSSION CDK1 inhibition restored the separation of DNA replication and
mitosis with 2.5 mM of CDK1i, blocking the induction of a pH3-
The results in this study describe a positive feedback loop between positive population in Late S phase. The induction of pKAP1,
the MMB-FOXM1 complex, the G2/M mitotic transcriptional pro- RPA-High/g-H2AX-High cells, and apoptosis by CHK1i treat-
gram, and CDK1 activity that is restrained during S phase by ment was also blocked by 2.5 mM of CDK1i, demonstrating
CHK1 (Figure S7E). The ATR-CHK1 pathway has previously that premature mitosis was necessary for DNA replication stress
been observed to regulate FOXM1 by CDK1 activity (Saldivar and subsequent replication catastrophe. A total of 2.5 mM CDK1i
et al., 2018), whereas cyclin A or B complexes, typically expressed was previously shown to partially rescue cell death after deple-
as part of the mitotic transcription program, also promote MMB- tion of ATR by an inducible degron (Eykelenboom et al., 2013),
FOXM1 activity (Fu et al., 2008; Lane et al., 1997; Laoukili et al., suggesting that this threshold of CDK1 activity also may be rele-
2008; Ziebold et al., 1997). In addition, a loss of cyclin F, a negative vant for ATR inhibition as well. The MMB-FOXM1 target gene
regulator of CDK phosphorylation of MYBL2, sensitizes cells to in- CCNB1 appears to be a key gene for CHK1i resistance, as it
hibitors of the ATR-CHK1 pathway (Burdova et al., 2019; Klein was identified as a significant hit in H460 cells and depletion of
et al., 2015; Mavrommati et al., 2018), underscoring that interplay CCNB1 reduced CHK1i sensitivity in recently published work in
between cyclin/CDK and MMB-FOXM1 activities in ATR/CHK1i ovarian cancer cells (Nair et al., 2020). Cyclin B1 levels however
sensitivity. This study builds on these prior observations by were not predictive of CHK1i sensitivity in a panel of head and
demonstrating the interdependent nature of increased MMB- neck squamous cell lines (van Harten et al., 2019), indicating
Figure 7. Activation of an MMB-FOXM1 complex CDK1-positive feedback loop is required for CHK1i-induced replication catastrophe
(A and B) Relative EdU levels in Early (A) and late (B) S phase. EdU levels were normalized to the 0 mM CDK1i-DMSO sample. n = 5.
(C and D) pFOXM1 levels in Late S phase after dual CHK1 (100 nM) and CDK1 inhibition with % pFOXM1-High cells in Late S phase (C) and pFOXM1 MFI (D). n = 4.
(E) qRT-PCR for MMB-FOXM1 target genes CDC25B, CCNA2, and CCNB1 in S phase A549 cells. A549 cells treated as in Figure 5D ± 2.5 mM CDK1i. n = 3.
(F) pH3 levels after dual CHK1 and CDK1 inhibition in Late S phase. n = 5.
(G) pKAP1 levels after dual CHK1 and CDK1 inhibition in Late S phase. n = 5; ANOVA mixed effects analysis with Tukey correction.
(H) Percent Annexin V+ PI apoptotic cells treated with CHK1i ± CDK1i for 24 h. n = 3.
(I–K) Chromatin-associated phospho-S4/S8 RPA or RPA compared to g-H2AX in cells treated with CHK1i ± CDKi for 24 h.
(I) Percentage of pS4/S8 RPA+ cells.
(J) Percentage of pS4/S8 RPA+ and g-H2AX-High cells.
(K) Density dot plot of g-H2AX High versus chromatin-associated RPA. n = 3.
Gray boxes denote concentrations of CDK1i that showed a significant increase in pH3 levels with CHK1i in (F). Mean ± SEM; ANOVA with Tukey correction. *p <
0.05; **p < 0.01; ***p < 0.001; ****p < 0.0001.
Cell Reports 34, 108808, March 2, 2021 13ll
OPEN ACCESS Article
that other components of the mitotic program may be involved in d EXPERIMENTAL MODEL AND SUBJECT DETAILS
CHK1i sensitivity. Further investigation will be needed to identify d METHOD DETAILS
the key components of the mitotic program that promote CHK1i- B Cell Culture
induced replication catastrophe. B CRISPR positive selection screens for drug resistance
Taken together, the results of this study add to the understand- B Genomic DNA isolation, sgRNA sequencing and iden-
ing of the factors that play a role in the S/G2/M checkpoint, which tification of top hits
delays entry into mitosis until after DNA synthesis is complete, B Growth Curves
and was first described in fission yeast (Enoch and Nurse, B Clonogenic Assays
1990). Subsequently, vertebrate cells including DT40 B-lym- B Viability Assays
phoma cells lacking Chk1 were shown to enter mitosis with B Immunoblotting
incompletely replicated DNA when DNA synthesis is blocked (Za- B Flow Cytometry
chos et al., 2005). Like this study, these prior studies highlighted B RNA Expression
the crucial role of regulation of CDK1 activity. Here, we demon- d QUANTIFICATION AND STATISTICAL ANALYSIS
strated the impact of differences in CDK1 activity regulated by
an MMB-FOXM1-dependent feedback loop in triggering replica- SUPPLEMENTAL INFORMATION
tion catastrophe after CHK1 inhibition. LIN54 and FOXM1 were
separately shown to modulate CHK1i sensitivity in ovarian and Supplemental information can be found online at https://doi.org/10.1016/j.
celrep.2021.108808.
pancreatic cancer, respectively (Blosser et al., 2020; Chung
et al., 2019). This result suggests that the insights about the S/
ACKNOWLEDGMENTS
G2/M transition derived from this study could inform the use of
CHK1is in additional cancer types. We thank Huy Nguyen for assistance with bioinformatics analysis and
Synergism of CHK1 or ATR inhibition with WEE1 inhibition has visualization for Figures 1B and 1C. We thank Mona Ahmed for technical
been observed in several preclinical studies (Bukhari et al., 2019; assistance regarding the pATM staining and DNA-PKcs reagents in Figure 3.
Busch et al., 2017; Carrassa et al., 2012; Chaudhuri et al., 2014; This research was supported by the US Public Health Service grants
F31CA189328 to T.B.B.; R35CA232128, R01CA63113, R01CA173023, and
Chilà et al., 2015; Chung et al., 2019; Davies et al., 2011; Ghelli
P01CA203655 to J.A.D.; and K08CA172354 to D.K. This work was also sup-
Luserna Di Rorà et al., 2019; Hauge et al., 2017; Magnussen
ported by the Joint Center for Radiation Therapy (to D.K.) and in part by a
et al., 2015; Mak et al., 2015; Russell et al., 2013), albeit with Sponsored Research Agreement from Eli Lilly to G.I.S. and A.D.D.
incomplete understanding as to why. Aberrant activation of
CDK1 and CDK2, by inhibition of WEE1, may bypass the atten- AUTHOR CONTRIBUTIONS
uation of CDK1 activation due to the loss of the MMB-FOXM1
complex. The addition of CHK1i to WEE1i may not be beneficial Conceptualization, T.B.B., D.K., G.I.S., A.D.D., and J.A.D.; methodology,
in cells that become resistant to CHK1i due to this mechanism, T.B.B., D.K., A.E.S., and P.D.; formal analysis, T.B.B., D.K., A.E.S., and P.D.;
investigation, T.B.B., D.K., A.E.S., H.G.R., L.S., H.D.R., and P.D.; writing – orig-
but other approaches, such as the addition of a DNA damaging
inal draft, T.B.B. and D.K.; writing – review & editing, T.B.B., D.K., A.E.S., and
agent such as gemcitabine, may be more effective (Chung et al., J.A.D.; visualization, T.B.B., D.K., A.E.S., and P.D.; supervision, D.K., A.D.D.,
2019; Kausar et al., 2015). and J.A.D.; funding acquisition, D.K. and J.A.D.
Several CHK1 and ATRis as well as WEE1 inhibitors have been
the subject of ongoing and completed clinical trials. In at least DECLARATION OF INTERESTS
one trial (NCT02873975), patients were selected based on repli-
cation stress markers, which stems from the idea that tumors D.K. has served as a consultant to Vertex. G.I.S. is a consultant/advisory board
prone to replication stress due to genetic abnormalities would member for Lilly, Sierra Oncology, Merck-EMD Serono, Pfizer, Astex, Almac,
Roche, Bicycle Therapeutics, Fusion Pharmaceuticals, G1 Therapeutics,
be overwhelmed by additional DNA replication stress induced
Bayer, Ipsen, Cybrexa Therapeutics, Angiex, Daiichi Sankyo, and Seattle Ge-
by CHK1 inhibition. Rather, it appears that premature activation netics and reports receiving commercial research grants from Lilly, Sierra
of the mitotic program, which requires an intact MMB-FOXM1- Oncology, Merck-EMD Serono, and Merck & Co. A.D.D. is a consultant/advi-
CDK1 axis, triggers cell death by replication catastrophe. Our sory board member for Lilly Oncology, Merck-EMD Serono, Intellia Therapeu-
work suggests novel biomarkers that may inform our under- tics, Sierra Oncology, Cyteir Therapeutics, Third Rock Ventures, AstraZeneca,
standing of patients with responding tumors versus those with Ideaya Inc., and Cedilla Therapeutics Inc.; a stockholder in Ideaya Inc., Cedilla
Therapeutics Inc., and Cyteir; and received research support from Lilly
intrinsic resistance.
Oncology and Merck-EMD Serono. J.A.D. is a consultant to Merck & Co.
and EMD Serono and received research support from Constellation
STAR+METHODS Pharmaceuticals.
Received: July 22, 2020
Detailed methods are provided in the online version of this paper
Revised: December 24, 2020
and include the following:
Accepted: February 9, 2021
Published: March 2, 2021
d KEY RESOURCES TABLE
d RESOURCE AVAILABILITY
REFERENCES
B Lead contact
B Materials availability Aarts, M., Sharpe, R., Garcia-Murillas, I., Gevensleben, H., Hurd, M.S., Shum-
B Data and code availability way, S.D., Toniatti, C., Ashworth, A., and Turner, N.C. (2012). Forced mitotic
14 Cell Reports 34, 108808, March 2, 2021ll
Article OPEN ACCESS
entry of S-phase cells as a therapeutic strategy induced by inhibition of WEE1. Wee1 inhibition combine synergistically to impede cellular proliferation. Can-
Cancer Discov. 2, 524–539. cer Biol. Ther. 12, 788–796.
Abe, Y., Sako, K., Takagaki, K., Hirayama, Y., Uchida, K.S., Herman, J.A., De- Dobin, A., Davis, C.A., Schlesinger, F., Drenkow, J., Zaleski, C., Jha, S., Batut,
Luca, J.G., and Hirota, T. (2016). HP1-Assisted Aurora B Kinase Activity Pre- P., Chaisson, M., and Gingeras, T.R. (2013). STAR: ultrafast universal RNA-seq
vents Chromosome Segregation Errors. Dev. Cell 36, 487–497. aligner. Bioinformatics 29, 15–21.
Anders, S., Pyl, P.T., and Huber, W. (2015). HTSeq—a Python framework to Doench, J.G., Fusi, N., Sullender, M., Hegde, M., Vaimberg, E.W., Donovan,
work with high-throughput sequencing data. Bioinformatics 31, 166–169. K.F., Smith, I., Tothova, Z., Wilen, C., Orchard, R., et al. (2016). Optimized
Ashley, A.K., Shrivastav, M., Nie, J., Amerin, C., Troksa, K., Glanzer, J.G., Liu, sgRNA design to maximize activity and minimize off-target effects of
S., Opiyo, S.O., Dimitrova, D.D., Le, P., et al. (2014). DNA-PK phosphorylation CRISPR-Cas9. Nat. Biotechnol. 34, 184–191.
of RPA32 Ser4/Ser8 regulates replication stress checkpoint activation, fork Down, C.F., Millour, J., Lam, E.W., and Watson, R.J. (2012). Binding of FoxM1
restart, homologous recombination and mitotic catastrophe. DNA Repair to G2/M gene promoters is dependent upon B-Myb. Biochim. Biophys. Acta
(Amst.) 21, 131–139. 1819, 855–862.
Blosser, W.D., Dempsey, J.A., McNulty, A.M., Rao, X., Ebert, P.J., Lowery, Dunlop, C.R., Wallez, Y., Johnson, T.I., Bernaldo de Quirós Fernández, S., Du-
C.D., Iversen, P.W., Webster, Y.W., Donoho, G.P., Gong, X., et al. (2020). A rant, S.T., Cadogan, E.B., Lau, A., Richards, F.M., and Jodrell, D.I. (2020).
pan-cancer transcriptome analysis identifies replication fork and innate immu- Complete loss of ATM function augments replication catastrophe induced
nity genes as modifiers of response to the CHK1 inhibitor prexasertib. Onco- by ATR inhibition and gemcitabine in pancreatic cancer models. Br. J. Cancer
target 11, 216–236. 123, 1424–1436.
Buisson, R., Boisvert, J.L., Benes, C.H., and Zou, L. (2015). Distinct but Enoch, T., and Nurse, P. (1990). Mutation of fission yeast cell cycle control
Concerted Roles of ATR, DNA-PK, and Chk1 in Countering Replication Stress genes abolishes dependence of mitosis on DNA replication. Cell 60, 665–673.
during S Phase. Mol. Cell 59, 1011–1024. Eykelenboom, J.K., Harte, E.C., Canavan, L., Pastor-Peidro, A., Calvo-Asen-
Bukhari, A.B., Lewis, C.W., Pearce, J.J., Luong, D., Chan, G.K., and Gamper, sio, I., Llorens-Agost, M., and Lowndes, N.F. (2013). ATR activates the S-M
A.M. (2019). Inhibiting Wee1 and ATR kinases produces tumor-selective syn- checkpoint during unperturbed growth to ensure sufficient replication prior
thetic lethality and suppresses metastasis. J. Clin. Invest. 129, 1329–1344. to mitotic onset. Cell Rep. 5, 1095–1107.
Burdova, K., Yang, H., Faedda, R., Hume, S., Chauhan, J., Ebner, D., Kessler, Fischer, M., Grossmann, P., Padi, M., and DeCaprio, J.A. (2016). Integration of
B.M., Vendrell, I., Drewry, D.H., Wells, C.I., et al. (2019). E2F1 proteolysis via TP53, DREAM, MMB-FOXM1 and RB-E2F target gene analyses identifies cell
SCF-cyclin F underlies synthetic lethality between cyclin F loss and Chk1 inhi- cycle gene regulatory networks. Nucleic Acids Res. 44, 6070–6086.
bition. EMBO J. 38, e101443. Fu, Z., Malureanu, L., Huang, J., Wang, W., Li, H., van Deursen, J.M., Tindall,
Busch, C.J., Kröger, M.S., Jensen, J., Kriegs, M., Gatzemeier, F., Petersen, C., D.J., and Chen, J. (2008). Plk1-dependent phosphorylation of FoxM1 regu-
Mu€nscher, A., Rothkamm, K., and Rieckmann, T. (2017). G2-checkpoint lates a transcriptional programme required for mitotic progression. Nat. Cell
targeting and radiosensitization of HPV/p16-positive HNSCC cells through Biol. 10, 1076–1082.
the inhibition of Chk1 and Wee1. Radiother. Oncol. 122, 260–266. Furnari, B., Rhind, N., and Russell, P. (1997). Cdc25 mitotic inducer targeted
Carrassa, L., Chilà, R., Lupi, M., Ricci, F., Celenza, C., Mazzoletti, M., Broggini, by chk1 DNA damage checkpoint kinase. Science 277, 1495–1497.
M., and Damia, G. (2012). Combined inhibition of Chk1 and Wee1: in vitro syn- Furuta, T., Takemura, H., Liao, Z.Y., Aune, G.J., Redon, C., Sedelnikova, O.A.,
ergistic effect translates to tumor growth inhibition in vivo. Cell Cycle 11, 2507– Pilch, D.R., Rogakou, E.P., Celeste, A., Chen, H.T., et al. (2003). Phosphoryla-
2517. tion of histone H2AX and activation of Mre11, Rad50, and Nbs1 in response to
Chaudhuri, L., Vincelette, N.D., Koh, B.D., Naylor, R.M., Flatten, K.S., Peter- replication-dependent DNA double-strand breaks induced by mammalian
son, K.L., McNally, A., Gojo, I., Karp, J.E., Mesa, R.A., et al. (2014). CHK1 DNA topoisomerase I cleavage complexes. J. Biol. Chem. 278, 20303–20312.
and WEE1 inhibition combine synergistically to enhance therapeutic efficacy Garcı́a, P., and Frampton, J. (2006). The transcription factor B-Myb is essential
in acute myeloid leukemia ex vivo. Haematologica 99, 688–696. for S-phase progression and genomic stability in diploid and polyploid mega-
Chen, X., Mu €ller, G.A., Quaas, M., Fischer, M., Han, N., Stutchbury, B., Shar- karyocytes. J. Cell Sci. 119, 1483–1493.
rocks, A.D., and Engeland, K. (2013). The forkhead transcription factor FOXM1 Ghelli Luserna Di Rorà, A., Bocconcelli, M., Ferrari, A., Terragna, C., Bruno, S.,
controls cell cycle-dependent gene expression through an atypical chromatin Imbrogno, E., Beeharry, N., Robustelli, V., Ghetti, M., Napolitano, R., et al.
binding mechanism. Mol. Cell. Biol. 33, 227–236. (2019). Synergism Through WEE1 and CHK1 Inhibition in Acute Lymphoblastic
Chilà, R., Basana, A., Lupi, M., Guffanti, F., Gaudio, E., Rinaldi, A., Cascione, Leukemia. Cancers (Basel) 11, 1654.
L., Restelli, V., Tarantelli, C., Bertoni, F., et al. (2015). Combined inhibition of Hanna, R.E., and Doench, J.G. (2020). Design and analysis of CRISPR-Cas ex-
Chk1 and Wee1 as a new therapeutic strategy for mantle cell lymphoma. On- periments. Nat. Biotechnol. 38, 813–823.
cotarget 6, 3394–3408. Hauge, S., Naucke, C., Hasvold, G., Joel, M., Rødland, G.E., Juzenas, P.,
Chu, L., Huo, Y., Liu, X., Yao, P., Thomas, K., Jiang, H., Zhu, T., Zhang, G., Stokke, T., and Syljuåsen, R.G. (2017). Combined inhibition of Wee1 and
Chaudhry, M., Adams, G., et al. (2014). The spatiotemporal dynamics of chro- Chk1 gives synergistic DNA damage in S-phase due to distinct regulation of
matin protein HP1a is essential for accurate chromosome segregation during CDK activity and CDC45 loading. Oncotarget 8, 10966–10979.
cell division. J. Biol. Chem. 289, 26249–26262. Hong, D., Infante, J., Janku, F., Jones, S., Nguyen, L.M., Burris, H., Naing, A.,
Chung, S., Vail, P., Witkiewicz, A.K., and Knudsen, E.S. (2019). Coordinately Bauer, T.M., Piha-Paul, S., Johnson, F.M., et al. (2016). Phase I Study of
Targeting Cell-Cycle Checkpoint Functions in Integrated Models of Pancreatic LY2606368, a Checkpoint Kinase 1 Inhibitor, in Patients With Advanced Can-
Cancer. Clin. Cancer Res. 25, 2290–2304. cer. J. Clin. Oncol. 34, 1764–1771.
Clurman, B.E., Sheaff, R.J., Thress, K., Groudine, M., and Roberts, J.M. (1996). Hong, D.S., Moore, K., Patel, M., Grant, S.C., Burris, H.A., 3rd, William, W.N.,
Turnover of cyclin E by the ubiquitin-proteasome pathway is regulated by cdk2 Jr., Jones, S., Meric-Bernstam, F., Infante, J., Golden, L., et al. (2018). Evalu-
binding and cyclin phosphorylation. Genes Dev. 10, 1979–1990. ation of Prexasertib, a Checkpoint Kinase 1 Inhibitor, in a Phase Ib Study of Pa-
Cole, K.A., Huggins, J., Laquaglia, M., Hulderman, C.E., Russell, M.R., Bosse, tients with Squamous Cell Carcinoma. Clin. Cancer Res. 24, 3263–3272.
K., Diskin, S.J., Attiyeh, E.F., Sennett, R., Norris, G., et al. (2011). RNAi screen Janke, R., King, G.A., Kupiec, M., and Rine, J. (2018). Pivotal roles of PCNA
of the protein kinome identifies checkpoint kinase 1 (CHK1) as a therapeutic loading and unloading in heterochromatin function. Proc. Natl. Acad. Sci.
target in neuroblastoma. Proc. Natl. Acad. Sci. USA 108, 3336–3341. USA 115, E2030–E2039.
Davies, K.D., Cable, P.L., Garrus, J.E., Sullivan, F.X., von Carlowitz, I., Huerou, Katsuno, Y., Suzuki, A., Sugimura, K., Okumura, K., Zineldeen, D.H., Shimada,
Y.L., Wallace, E., Woessner, R.D., and Gross, S. (2011). Chk1 inhibition and M., Niida, H., Mizuno, T., Hanaoka, F., and Nakanishi, M. (2009). Cyclin A-Cdk1
Cell Reports 34, 108808, March 2, 2021 15You can also read