Absolute quantification of cohesin, CTCF and their regulators in human cells - bioRxiv
←
→
Page content transcription
If your browser does not render page correctly, please read the page content below
bioRxiv preprint first posted online Feb. 26, 2019; doi: http://dx.doi.org/10.1101/560425. The copyright holder for this preprint
 (which was not peer-reviewed) is the author/funder, who has granted bioRxiv a license to display the preprint in perpetuity.
                                  It is made available under a CC-BY 4.0 International license.

     Absolute quantification of cohesin, CTCF and their regulators in human cells

     Johann Holzmann1, 2, 3, 4, *, Antonio Z. Politi5, 6, *, Kota Nagasaka1, Merle Hantsche-
     Grininger5, Nike Walther5, Birgit Koch5, 7, Johannes Fuchs1, 2, 3, 8,
     Gerhard Dürnberger1, 2, 3, Wen Tang1, Rene Ladurner1, 9, Roman R. Stocsits1, Georg
     A. Busslinger1, 10, Bela Novak11, Karl Mechtler1, 2, 3, Iain F. Davidson1, #, Jan
     Ellenberg5, #, Jan-Michael Peters1,12, #

     1
         Research Institute of Molecular Pathology (IMP), Vienna Biocenter (VBC) Campus-Vienna-Biocenter
     1, 1030 Vienna, Austria
     2
         Institute of Molecular Biotechnology of the Austrian Academy of Sciences (IMBA), Vienna Biocenter
     (VBC), Dr. Bohr-Gasse 3, 1030 Vienna, Austria
     3
         Gregor Mendel Institute of Molecular Plant Biology Austrian Academy of Sciences
     Dr. Bohr-Gasse 3, 1030 Vienna, Austria
     4
         Present address: Technical Research and Development Novartis, Biochemiestrasse 10, 6250 Kundl,
     Austria
     5
         Chemical Biology and Biophysics Unit, European Molecular Biology Laboratory (EMBL),
     Meyerhofstrasse 1, D-69117 Heidelberg, Germany
     6
         Present address: Max Planck Institute for Biophysical Chemistry, Am Fassberg 11, D-37077
     Goettingen, Germany
     7
         Present address: Department for Chemical Biology, Max Planck Institute for Medical Research,
     Jahnstrasse 29, D-69120 Heidelberg, Germany
     8
         Present address: Proteomics Core Facility, University of Gothenburg, Box 413, SE 405 30
     Gothenburg, Sweden
     9
         Present address: Department of Biochemistry, Stanford University, Stanford, CA, USA
     10
          Present address: Hubrecht Institute, Royal Netherlands Academy of Arts and Sciences and
     University Medical Center Utrecht, Uppsalalaan 8, 3584 CT Utrecht, the Netherlands
     11
          Department of Biochemistry, University of Oxford, South Parks Road, Oxford, OX1 3QU, UK
     12
          Medical University of Vienna, Vienna, Austria

     Keywords: cell cycle, cohesin, CTCF, sister chromatid cohesion, genome organization, mass
     spectrometry, fluorescence-correlation spectroscopy.

     *These authors contributed equally.

     #
         Corresponding author. Email: davidson@imp.ac.at (IFD), jan.ellenberg@embl.de (JE),
     peters@imp.ac.at (J-MP).

                                                                                                                                    1
bioRxiv preprint first posted online Feb. 26, 2019; doi: http://dx.doi.org/10.1101/560425. The copyright holder for this preprint
 (which was not peer-reviewed) is the author/funder, who has granted bioRxiv a license to display the preprint in perpetuity.
                                  It is made available under a CC-BY 4.0 International license.

     Abstract
     The organisation of mammalian genomes into loops and topologically associating
     domains (TADs) contributes to chromatin structure, gene expression and
     recombination. Loops and TADs are formed by cohesin and positioned by CTCF. In
     proliferating cells, cohesin also mediates sister chromatid cohesion, which is
     essential for chromosome segregation. Current models of chromatin folding and
     cohesion are based on assumptions of how many cohesin and CTCF molecules
     organise the genome. Here we have measured absolute copy numbers and
     dynamics of cohesin, CTCF, NIPBL, WAPL and sororin by mass spectrometry,
     fluorescence-correlation spectroscopy and fluorescence recovery after
     photobleaching in HeLa cells. In G1-phase there are ~245,000 cohesin complexes,
     of which ~139,000 are on chromatin. Comparison with chromatin
     immunoprecipitation-sequencing data implies that some genomic cohesin and CTCF
     enrichment sites are unoccupied in single cells at any one time. We discuss the
     implications of these findings for how cohesin can contribute to genome organisation
     and cohesion.

     Introduction
     In interphase, eukaryotic genomes form long-range interactions that lead to the
     formation of chromatin loops and topologically associating domains (TADs). These
     interactions organize chromatin structurally and contribute to gene regulation and
     recombination. Cohesin complexes are not only required for the formation of
     chromatin loops and TADs (Gassler et al., 2017; Rao et al., 2017; Wutz et al., 2017),
     but also for sister chromatid cohesion, a prerequisite for chromosome segregation in
     mitosis and meiosis (reviewed in Morales and Losada, 2018). In interphase, cohesin
     is enriched at specific positions genome-wide, most of which are also associated
     with CCCTC-binding factor (CTCF) (Parelho et al., 2008; Wendt et al., 2008). CTCF
     consensus binding sites are frequently oriented convergently at TAD borders (Rao et
     al., 2014; de Wit et al., 2015; Vietri Rudan et al., 2015) and depletion of CTCF leads
     to a loss of insulation between TADs (Nora et al., 2017; Wutz et al., 2017). The
     mechanism by which cohesin and CTCF contribute to the generation of TADs is
     unknown, but it has been proposed that cohesin acts by extruding loops of DNA until
     it encounters convergently-oriented CTCF sites (Sanborn et al., 2015; Fudenberg et
     al., 2016), thus generating long-range interactions by tethering distal regions of the

                                                                                                                                    2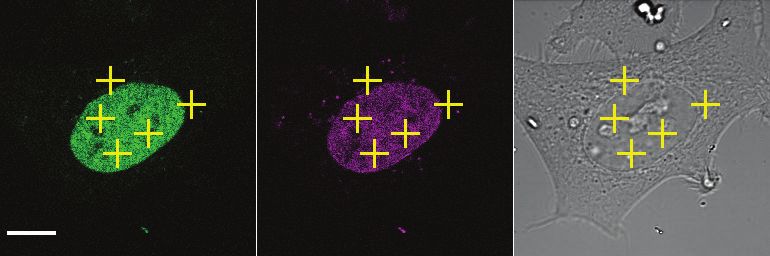
bioRxiv preprint first posted online Feb. 26, 2019; doi: http://dx.doi.org/10.1101/560425. The copyright holder for this preprint
 (which was not peer-reviewed) is the author/funder, who has granted bioRxiv a license to display the preprint in perpetuity.
                                  It is made available under a CC-BY 4.0 International license.

     same chromosome together. Contrary to this, cohesin is thought to mediate sister
     chromatid cohesion by physically entrapping two different DNA molecules, one from
     each sister chromatid (Gruber et al., 2003; Ivanov and Nasmyth, 2005; Haering et
     al., 2008). How cohesin can perform these two apparently distinct functions is poorly
     understood.

     Cohesin is a ring-shaped protein complex composed of four core subunits. The
     subunits SMC1, SMC3 and SCC1 (also called Rad21 or Mcd1) form a tripartite ring
     structure and associate via SCC1 with a fourth subunit, which exists in two isoforms
     in mammalian somatic cells termed STAG1 and STAG2 (also known as SA1 and
     SA2). Cohesin’s binding to and release from chromosomes is mediated by the
     proteins NIPBL and WAPL, respectively. Recruitment of cohesin to chromatin in vivo
     depends on NIPBL and its binding partner MAU2 (Ciosk et al., 2000; Gillespie and
     Hirano, 2004; Takahashi et al., 2004; Watrin et al., 2006; Schwarzer et al., 2017).
     NIPBL also stimulates cohesin’s ATPase activity in vitro, an activity thought to be
     essential for loading of cohesin onto DNA (Arumugam et al., 2003; Weitzer et al.,
     2003; Hu et al., 2011; Ladurner et al., 2014; Murayama and Uhlmann, 2014; Petela
     et al., 2018). WAPL, on the other hand, is required for cohesin’s release from
     chromatin in interphase and prophase, presumably via opening of the cohesin ring
     (Gandhi et al., 2006; Kueng et al., 2006; Chan et al., 2012; Buheitel and Stemmann,
     2013; Eichinger et al., 2013; Tedeschi et al., 2013; Huis in 't Veld et al., 2014). Upon
     experimental depletion of WAPL in interphase cells, cohesin relocalises to axial
     elements termed vermicelli (Tedeschi et al., 2013). This results in global compaction
     of chromatin that is detectable via DNA and chromatin staining and also by mapping
     long-range chromatin interactions via Hi-C, indicating that cohesin turnover on
     chromatin is essential for normal genome organisation (Tedeschi et al., 2013;
     Gassler et al., 2017; Haarhuis et al., 2017; Wutz et al., 2017). In S and G2 phase of
     the cell cycle, those cohesin complexes that mediate cohesion are protected from
     WAPL’s releasing activity by the protein sororin, which is essential for maintaining
     sister chromatid cohesion (Rankin et al., 2005; Schmitz et al., 2007) in the presence
     of WAPL (Nishiyama et al., 2010).

     Although the regulation of cohesin – chromatin interactions has been well-studied,
     mechanistic insight into how cohesin contributes to chromatin loop and TAD

                                                                                                                                    3
bioRxiv preprint first posted online Feb. 26, 2019; doi: http://dx.doi.org/10.1101/560425. The copyright holder for this preprint
 (which was not peer-reviewed) is the author/funder, who has granted bioRxiv a license to display the preprint in perpetuity.
                                  It is made available under a CC-BY 4.0 International license.

     formation is lacking. Most Hi-C studies into cohesin-mediated chromosome
     organisation are performed on a population of cells. The few studies that use Hi-C to
     investigate the genome organisation of single cells have found that chromosome
     organisation is variable from cell to cell (Nagano et al., 2013; Flyamer et al., 2017;
     Gassler et al., 2017; Nagano et al., 2017; Stevens et al., 2017), raising the possibility
     that TADs might be the product of ongoing loop extrusion events that occur
     stochastically and are detectable only when averaging across a cell population.
     Recent microscopy studies have however been able to identify structural features
     consistent with a TAD-like organisation in single cells (Boettiger et al., 2016; Bintu et
     al., 2018; Szabo et al., 2018).

     To gain insight into how cohesin might function within a single cell, we have used
     quantitative mass spectrometry (MS) (Picotti and Aebersold, 2012) and automated
     fluorescence-correlation spectroscopy (FCS) to determine the absolute copy number
     of soluble and chromatin-bound cohesin complexes in HeLa cells synchronized in
     G1, G2 and prometaphase. We used ChIP-seq to determine their genomic
     distribution and fluorescence recovery after photobleaching to measure their
     dynamic interactions with chromatin. Our findings, as well as those reported in
     mouse embryonic stem cells and the human cell line U2OS (Cattoglio et al., 2018)
     suggest that a fraction of cohesin and CTCF enrichment sites along chromosome
     arms may be unoccupied in a single cell at any one time. We discuss the
     implications of these findings for how cohesin might contribute to genome
     organisation and sister chromatid cohesion.

     Results
     Mass spectrometry analysis of cohesin copy number
     To determine the number of cohesin complexes that exist in HeLa cells, a widely
     used human cell line, we synchronized cells in G1 phase, G2 phase or
     prometaphase using thymidine and nocodazole arrest/release protocols, verified
     synchronization efficiency using fluorescence activated cell sorting (FACS) of
     propidium iodide-stained cells (Supplementary Figure 1A) and determined the
     number of cells collected in each condition. We separated soluble proteins from
     chromatin-bound proteins by differential centrifugation and released proteins from
     chromatin by DNase and RNase treatment. Soluble proteins were isolated from

                                                                                                                                    4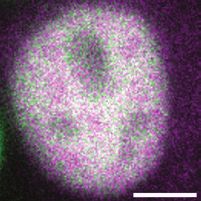
bioRxiv preprint first posted online Feb. 26, 2019; doi: http://dx.doi.org/10.1101/560425. The copyright holder for this preprint
 (which was not peer-reviewed) is the author/funder, who has granted bioRxiv a license to display the preprint in perpetuity.
                                  It is made available under a CC-BY 4.0 International license.

     between 1,400 and 4,200 cells, depending on cell cycle stage, and chromatin-bound
     proteins were isolated from 62,500 ± 3,100 cells. Liquid chromatography-MS (LC-
     MS) analyses using an LTQ Orbitrap Velos revealed that each fraction was enriched
     in marker proteins known to be soluble (glucose metabolizing enzymes) and
     chromatin-bound (core histones), respectively (Supplementary Figure 1B). For
     absolute quantification, an aliquot of each sample was combined with an equimolar
     mixture of isotopically labeled proteotypic reference peptides generated with the
     equimolarity through equalizer peptide (EtEP) strategy (Holzmann et al., 2009). This
     reference set consisted of one peptide from SMC1, five peptides from SMC3, three
     peptides from SCC1 and STAG1 and two from STAG2 (Supplementary Table 1).
     Scheduled selective reaction monitoring (SRM) analyses of the samples obtained in
     two experiments were each performed in technical duplicates on a 5500 QTRAP
     instrument.

     Using this approach, we found that the cohesin subunits SMC3 and SCC1 were
     present in approximately 417,000 and 350,000 copies per G1 cell (Figure 1, see
     Table 1 for exact values and Supplementary Figure 2 for individual peptide counts).
     The excess SMC3 detected over SCC1 is consistent with the previously reported
     existence of free cytoplasmic SMC1-SMC3 dimers not bound to SCC1 (Losada et
     al., 2000; Sumara et al., 2000; Waizenegger et al., 2000). Consistent with a 1:1:1
     stoichiometry of these subunits on chromatin, however (see below), between 61,000
     and 69,000 copies of SMC1, SMC3 and SCC1 were detectable on chromatin in G1.
     STAG2 has been reported to be in excess of STAG1 in HeLa cells (3:1 in HeLa
     nuclear extract, Losada et al., 2000; ~ 12-15:1 in SCC1 immunoprecipitates from
     HeLa total cell extract, Holzmann et al., 2011). We consistently detected more
     STAG2 than STAG1 in all conditions (Figure 1, Table 1). We detected around 15,000
     copies of chromatin-bound STAG1 and 45,000 copies of STAG2 in G1, suggesting
     that cohesin-STAG2 is present in approximately three-fold excess over cohesin-
     STAG1 on chromatin in HeLa cells in G1; this ratio increased to 4.6-fold in G2 and
     decreased to 2.9-fold in prometaphase. The combined total of STAG1 and STAG2
     on chromatin was 60,000; taken together this suggests that between 60,000 and
     70,000 chromatin-bound cohesin complexes exist in a HeLa cell in G1.

                                                                                                                                    5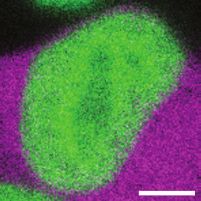
bioRxiv preprint first posted online Feb. 26, 2019; doi: http://dx.doi.org/10.1101/560425. The copyright holder for this preprint
 (which was not peer-reviewed) is the author/funder, who has granted bioRxiv a license to display the preprint in perpetuity.
                                  It is made available under a CC-BY 4.0 International license.

     The stoichiometry of cohesin complexes remains constant throughout G1, G2
     and prometaphase
     As described above, cohesin functions both in genome organisation and in sister
     chromatid cohesion. Models for cohesin function during these processes have
     predicted that cohesin might exist in a variety of stoichiometries (Nasmyth, 2011;
     Hassler et al., 2018). According to the ‘monomeric ring’ model, cohesin complexes
     are predicted to exist as monomeric complexes with a core subunit composition ratio
     of 1:1:1:1. The ‘handcuff‘ model in contrast, proposes that cohesin complexes that
     mediate cohesion exist as dimeric cohesin rings bridged by a single STAG subunit;
     i.e. these complexes exist in a 1:1:1:0.5 subunit ratio, with 0.5 being the
     stoichiometry of the sum of STAG1 and STAG2 proteins relative to the other three
     subunits (Zhang et al., 2008; Zhang and Pati, 2009). Previous experiments have
     indicated that approximately half of all chromatin-bound cohesin complexes become
     cohesive during DNA replication (Gerlich et al., 2006; Kueng et al., 2006; Schmitz et
     al., 2007). Thus, to be consistent with the handcuff model, our measurements should
     have revealed a 1:1:1:1 stoichiometry for chromatin-bound cohesin before DNA
     replication and a 1:1:1:0.75 stoichiometry after replication.

     A cohesin subunit stoichiometry of 1:1:1:1 has been previously reported for cohesin
     complexes immunoprecipitated from unfractionated HeLa cells (Holzmann et al.,
     2011). To compare the stoichiometry of soluble and chromatin-bound cohesin, we
     used SCC1 antibody beads to immunoprecipitate cohesin from soluble and
     chromatin fractions isolated from G1, G2 and prometaphase HeLa cells and then
     subjected the immunoprecipitates to LC-MS analysis on an LTQ Orbitrap instrument.
     We identified SMC1, SMC3 and STAG1/2 at ratios of 0.89, 0.95 and 0.83 relative to
     SCC1 in immunoprecipitates from G1 chromatin, at 0.9, 0.97 and 0.85 in G2 and at
     0.88, 0.98 and 0.88 in prometaphase. (Supplementary Figures 3 and 4,
     Supplementary Table 3). Since these ratios are close to 1:1:1:1 and do not
     appreciably differ between G1, G2 and prometaphase, they are consistent with the
     monomeric ring model for cohesion establishment.

                                                                                                                                    6
bioRxiv preprint first posted online Feb. 26, 2019; doi: http://dx.doi.org/10.1101/560425. The copyright holder for this preprint
(which was not peer-reviewed) is the author/funder, who has granted bioRxiv a license to display the preprint in perpetuity.
It is made available under a CC-BY 4.0 International license.
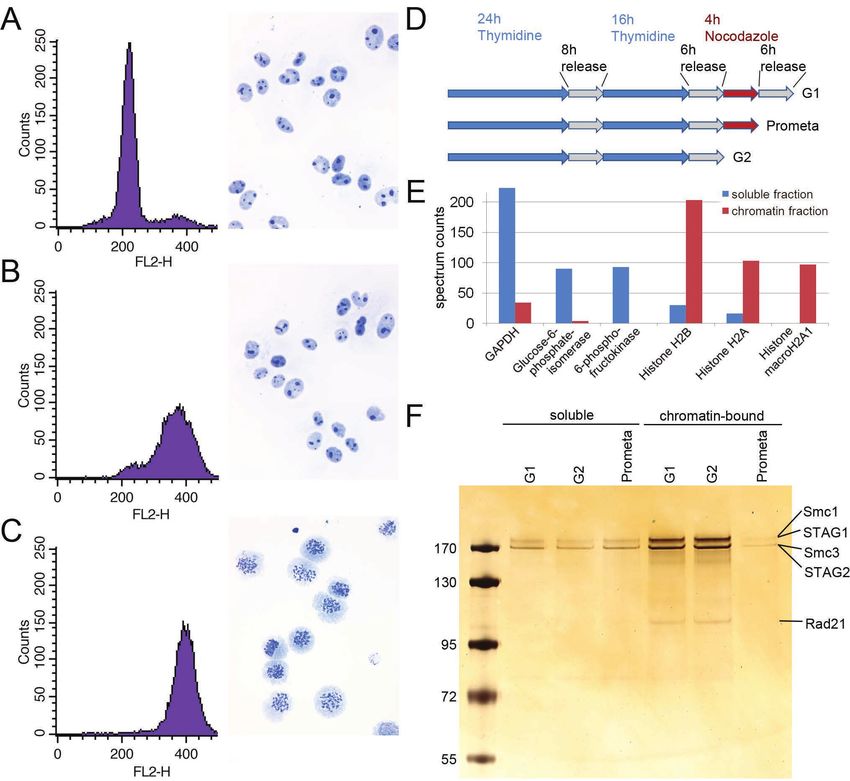
Fluorescence correlation spectroscopy analysis of cohesin, CTCF and other
cohesin regulators
By measuring the changes in photon counts caused by single molecule fluctuations
within a small illumination volume, fluorescence correlation spectroscopy (FCS)
allows determination of a number of biophysical parameters, including the
concentration of fluorescently-tagged proteins within living cells. To this end, we
used HeLa Kyoto cell lines in which the cohesin subunits SCC1, STAG1, STAG2
and NIPBL, WAPL, sororin, and CTCF were homozygously tagged with enhanced
green fluorescent protein (EGFP) at their endogenous loci using CRISPR-Cas9
genome editing (Supplementary Figure 5 and Supplementary Table 7). We
synchronized these cell lines in G1 phase, G2 phase or prometaphase using
thymidine and nocodazole arrest/release protocols similar to those used in our MS
analysis. FCS measurements were automatically acquired from positions in the
nucleus and cytoplasm (Figure 2A) and protein concentrations were computed
(Figure 2B, Supplementary Table 4). The G1 concentrations of SCC1 and STAG2 in
the nucleus were measured to be around 350 nM and 290 nM, respectively.
Consistent with our LC-MS data, the concentration of nuclear STAG1 was lower, at
around 80 nM. The cytoplasmic concentration of all proteins measured was low and
frequently fell below the detection limit of FCS. We next converted the protein
concentration values to absolute copy number using cell volumes estimated from 3D
segmentation of the nucleus and cytoplasm (Table 2). Using this approach, we
estimated that approximately 245,000 copies of SCC1-mEGFP, 55,000 copies of
STAG1-EGFP and 205,000 copies of STAG2-EGFP exist per G1 cell. This
compares to 350,000 copies of SCC1, 130,000 copies of STAG1 and 160,000
copies of STAG2 per G1 cell as estimated by LC-MS. Thus, the two methods we
used to estimate the cellular copy number of SCC1, STAG1 and STAG2 agree within
an average factor of 1.6. As also observed in the LC-MS dataset, the total copy
number of cohesin subunits increased on average 1.6-fold in G2 cells compared to
G1 cells (Table 1, Table 2). The intracellular concentration of cohesin is maintained
in G2 despite this increase in total copy number, since the volume of G2 cells also
increased 1.6-fold (Figure 2, Table 2, Supplementary Table 4).
We found that NIPBL, WAPL, sororin and CTCF were all sub-stoichiometric relative
to SCC1 in G1 and G2 HeLa cells (Figure 2B and Supplementary Table 4). This is
7bioRxiv preprint first posted online Feb. 26, 2019; doi: http://dx.doi.org/10.1101/560425. The copyright holder for this preprint
(which was not peer-reviewed) is the author/funder, who has granted bioRxiv a license to display the preprint in perpetuity.
It is made available under a CC-BY 4.0 International license.
consistent with estimates comparing nuclear levels of fluorescently tagged SCC1
and NIPBL in the human cell line HCT116 (Rhodes et al., 2017). The nuclear
concentration of SCC1, STAG1, STAG2, and CTCF differed by 10 % or less
between G1 cells and G2 cells. The concentration of NIPBL and WAPL was lower in
G2 than in G1 (~ 24 % and ~ 14 % lower, respectively). In contrast, the nuclear
concentration of sororin was ~ 61 % higher in G2 than in G1 (Figure 2B and
Supplementary Table 4). This is consistent with the finding that sororin is targeted for
degradation by the anaphase promoting complex/cyclosome (APC/C) in G1 (Rankin
et al., 2005; Nishiyama et al., 2010).
Dynamics of chromatin-bound cohesin
Our FCS experiments allowed us to measure the number of cohesin complexes that
reside in the nucleus but not the number of chromatin-bound complexes, i.e. those
that might actually contribute to chromatin architecture and sister chromatid
cohesion. To investigate the dynamics of nuclear cohesin in G1 and G2 phase
(Supplementary Figure 6A), we performed inverse fluorescence recovery after
photobleaching (iFRAP) using the same SCC1-EGFP cell line that was used in our
FCS experiments (Figure 3A, B). Consistent with previous studies that relied on
ectopically expressed GFP-tagged cohesin subunits (Gerlich et al., 2006; Schmitz et
al., 2007; Ladurner et al., 2014; Ladurner et al., 2016), the recovery kinetics obtained
from G1 phase cells could largely be fitted using a single exponential function,
indicating cohesin was dynamically bound to chromatin with a residence time of 13.7
± 2.2 min (Supplementary Figure 6B, D). We refer to this population of cohesin as
dynamic. Previous work has revealed that it arises from repeated loading and
WAPL-mediated release events (Gandhi et al., 2006; Kueng et al., 2006; Chan et al.,
2012; Buheitel and Stemmann, 2013; Eichinger et al., 2013; Tedeschi et al., 2013;
Huis in 't Veld et al., 2014). Also consistent with previous studies, the recovery
kinetics obtained from cells in G2 phase could only be fitted using a double
exponential function with a dynamic residence time of 10.0 ± 3.1 min and a stable
residence time of 8.6 ± 4.1 h (Supplementary Figure 6C – F and Gerlich et al., 2006).
Since highly mobile proteins diffuse from the unbleached area to the bleached area
during the bleaching time period, the reduction in GFP signal in the unbleached area
(Supplementary Figure 6G) provides an estimate of the soluble fraction of SCC1-
8bioRxiv preprint first posted online Feb. 26, 2019; doi: http://dx.doi.org/10.1101/560425. The copyright holder for this preprint
(which was not peer-reviewed) is the author/funder, who has granted bioRxiv a license to display the preprint in perpetuity.
It is made available under a CC-BY 4.0 International license.
EGFP. According to our FCS analysis, approximately 219,000 copies of SCC1-GFP
reside in the nucleus in G1. Our iFRAP analysis allowed us to estimate that
approximately 64 ± 4 % (139,000 ± 9000) of these molecules are bound to chromatin
(Figure 3C, D, Table 3). In G2, we estimate that 37 ± 11 % of nuclear SCC1-EGFP is
bound stably to chromatin, 36 ± 9 % is bound dynamically and 27 ± 7 % is soluble
(Figure 3C). Taking into account our FCS measurements of SCC1-EGFP copy
number in G2 phase, we estimate that around 132,000 ± 38,000 cohesin molecules
are stably bound, 130,000 ± 32,000 bind dynamically and 98,000 ± 26,000 are
soluble (Figure 3D, Table 3). Thus, our LC-MS and FCS estimates of the number of
SCC1 molecules bound to chromatin in a HeLa cell agree to within a factor of 2 in
G1 and a factor of 1.8 in G2 (Table1, Table 3). We suspect that this difference is
caused by the removal of a fraction of dynamically chromatin-bound cohesin during
sample preparation for LC-MS (see Discussion).
A mathematical model for cohesin binding to chromatin
We observed that the number of chromatin-bound cohesin complexes increased by
around a factor of two in G2 cells compared to G1 cells, as measured directly by LC-
MS (Table 1) and indirectly by integrating our FCS and FRAP data (see above). This
increase coincides with the appearance of a stably-bound population of cohesin. To
test whether an increase in cohesin's residence time is sufficient to explain these
changes, or whether other alterations in cohesin dynamics might also contribute, we
performed mathematical modeling. For this we considered the interconversion
between the different unbound and chromatin-bound forms of nuclear cohesin
(Figure 4A). By performing a number of algebraic substitutions (see Materials and
Methods), we generated an equation that allows us to plot the equilibrium distribution
of the unbound and dynamically chromatin-bound forms of cohesin as a function of
the stably chromatin-bound fraction (Figure 4B). The fraction of stable cohesin (s) in
G2 phase cells is ~ 0.367 (Figure 3C). According to our model, if s = 0.367 the
chromatin-bound fraction (bT) should be 0.769 (Figure 4B). This is very close to the
experimentally-determined fraction of chromatin-bound cohesin in G2 (0.728, Figure
3C). Therefore, we propose that the only major distinction between cohesin
dynamics in G1 and G2 phase cells is that a fraction of cohesin becomes stably
bound in G2 phase.
9bioRxiv preprint first posted online Feb. 26, 2019; doi: http://dx.doi.org/10.1101/560425. The copyright holder for this preprint
(which was not peer-reviewed) is the author/funder, who has granted bioRxiv a license to display the preprint in perpetuity.
It is made available under a CC-BY 4.0 International license.
Implications of absolute cohesin copy numbers for the occupancy of cohesin
enrichment sites
Our current knowledge regarding the genomic distribution of human cohesin and its
regulators derives largely from population-based ChIP-seq experiments. The
distribution of human cohesin on DNA has only been analysed for the ‘mappable’
non-repetitive part of the genome, and most ChIP experiments that have been
performed for this purpose have only revealed the relative distribution of cohesin and
can therefore not be used for a quantitative analysis. Nevertheless, it is interesting to
compare the absolute number of cohesin complexes that we have measured here
with data on cohesin binding sites in the human genome. We have identified around
37,000, 35,000 and 47,000 enrichment sites of SMC3, STAG1 and STAG2,
respectively in the mappable fraction of the human genome in G1-synchronised
HeLa cells (Supplementary Figure 7A, Supplementary Table 5). 88 % of SMC3 sites
overlap with the combined enrichment sites of STAG1 and STAG2, and 77 %
overlap with CTCF (Supplementary Figure 7B, Supplementary Table 6). Since only
2.7 x 10⁹ bp of the human genome is ‘mappable’ out of a total of 3.2 x 10⁹ bp, if we
assume that cohesin occupies the mappable and non-mappable portions of the
genome with equal frequency there should be around 47,000 discrete cohesin
enrichment sites per human genome (~40,000 * 1.185). Accounting for a G1 HeLa
cell ploidy of 2.54 (Landry et al., 2013), this means the chromatin of a HeLa cell
should therefore harbour around 120,000 cohesin enrichment sites. If one assumes
that all ~ 139,000 dynamically chromatin-bound cohesin complexes identified in a
single cell by FCS/FRAP are positioned at the 120,000 cohesin enrichment sites, it is
therefore theoretically possible that every site is occupied simultaneously by cohesin
in a single G1 cell. However, for reasons explained in the Discussion, at any given
time many cohesin complexes may not be positioned at cohesin enrichment sites, in
which case not all of these could be simultaneously occupied by cohesin (see
Discussion).
We identified around 41,000 CTCF binding sites in ChIP-seq experiments performed
in G1-arrested HeLa cells (Supplementary Figure 7A, Supplementary Table 5).
Using the same logic as described above, this equates to around 125,000 potential
CTCF binding sites per HeLa genome. Using FCS, we estimated that approximately
122,000 copies of GFP-tagged CTCF reside in the nucleus in G1 (Table 2). It is
10bioRxiv preprint first posted online Feb. 26, 2019; doi: http://dx.doi.org/10.1101/560425. The copyright holder for this preprint
(which was not peer-reviewed) is the author/funder, who has granted bioRxiv a license to display the preprint in perpetuity.
It is made available under a CC-BY 4.0 International license.
unknown what fraction of these molecules is bound to chromatin in HeLa cells, and
whether CTCF binds to chromatin as multimers, as has been proposed (Pant et al.,
2004; Yusufzai et al., 2004; Bonchuk et al., 2015). Nevertheless, we can conclude
that it would only be possible for every CTCF binding site to be occupied in a single
HeLa cell if at least 98 % of nuclear CTCF is chromatin-bound as a monomer, a
situation that is unlikely to be the case (see Discussion).
If cohesin/CTCF enrichment sites represent positions at which cohesin loop
extrusion frequently stalls, an estimate as to the average distance a cohesin complex
might travel during loop extrusion could be made by determining the genomic
distances between pairs of cohesin enrichment sites. If every ChIP-seq peak were
distributed equally within the mappable genome, we would expect to detect around
one peak every 67.5 kb (2.7 x 10⁹ Mb / 40,000). We found that SMC3 enrichment
sites were actually distributed over a very broad range of distances, ranging from
less than 10 kb apart to greater than 2 Mb (Supplementary Figure 7C). However,
around 80 % percent of the detected SMC3 enrichment sites resided within 100 kb of
each other. We note that this predicted cohesin loop size is very similar to those
calculated for the loops formed by the related condensin complex on mitotic
chromosomes (Walther et al., 2018). As described above, it is possible that not every
cohesin enrichment site is occupied simultaneously in a single cell, and the size of a
loop formed by a cohesin complex might depend where in between the two adjacent
cohesin enrichment sites cohesin initially binds. Nevertheless, this analysis suggests
that at least some cohesin complexes might extrude loops around 100 kb in size.
This is in line with predictions of loop extrusion processivity based on polymer
modeling (120 – 240 kb; Fudenberg et al., 2016).
Discussion
A comparison between LC-MS and FCS measurements of cohesin copy
number
As mentioned above, our LC-MS and FCS-derived estimates of total cohesin subunit
copy number were within an overall factor of 1.6 of one another in G1 and 1.4 in G2.
The LC-MS-measured copy number of chromatin-bound SCC1 was 2-fold lower in
G1 and 1.8-fold lower in G2 than that measured by FCS/FRAP. It is possible that a
fraction of the dynamically chromatin-bound cohesin complexes were lost during the
11bioRxiv preprint first posted online Feb. 26, 2019; doi: http://dx.doi.org/10.1101/560425. The copyright holder for this preprint
(which was not peer-reviewed) is the author/funder, who has granted bioRxiv a license to display the preprint in perpetuity.
It is made available under a CC-BY 4.0 International license.
purification steps that preceded our LC-MS analysis. Nevertheless, given the major
differences between these orthogonal techniques, the similarity between both
datasets is remarkable.
Occupancy of cohesin and CTCF enrichment sites in a single cell
In the loop extrusion model of cohesin-mediated genome organisation, cohesin is
predicted to bind to chromatin and translocate to extrude loops. This model therefore
predicts that chromatin-bound cohesin must transiently exist at other sites in addition
to those identifiable by standard ChIP-seq. Consistently, calibrated ChIP-seq
experiments suggest that significant amounts of budding yeast cohesin localises to
regions between peaks (Hu et al., 2015). Direct evidence of cohesin-mediated loop
extrusion is so far missing, however the budding yeast orthologue of the related
SMC complex condensin has been shown to translocate unidirectionally along DNA
(Terakawa et al., 2017) and perform loop extrusion of DNA in vitro (Ganji et al.,
2018). Fission yeast and vertebrate cohesin can translocate along DNA in vitro
(Davidson et al., 2016; Kanke et al., 2016; Stigler et al., 2016) and ChIP-seq studies
in bacteria, yeast and mammalian cells have all revealed that cohesin/SMC
enrichment sites can vary in their positions (Lengronne et al., 2004; Hu et al., 2015;
Ocampo-Hafalla et al., 2016; Busslinger et al., 2017; Wang et al., 2017; Petela et al.,
2018; Wang et al., 2018). If cohesin is indeed mobile on chromatin, our finding that
the number of chromatin-bound cohesin complexes is similar to the number of
potential cohesin binding sites means it is unlikely that every cohesin enrichment site
is occupied in a single G1 cell. One complication regarding this idea is that if cohesin
performs loop extrusion as a monomer, and the cohesin ChIP-seq binding sites that
overlap with CTCF represent stalled extrusion events, it could be that a single
cohesin complex could occupy the two cohesin enrichment sites present at the base
of chromatin loops.
We find that the ratio of nuclear CTCF to potential CTCF binding sites in G1 is 0.98.
This suggests that CTCF could only occupy all its binding sites simultaneously if
virtually all molecules are monomeric and chromatin-bound. If CTCF does not
occupy all its binding sites simultaneously, this could provide a potential explanation
as to how cohesin might ‘skip’ past the CTCF sites identified within TADs and also
how longer chromatin loops can form following WAPL depletion despite no
12bioRxiv preprint first posted online Feb. 26, 2019; doi: http://dx.doi.org/10.1101/560425. The copyright holder for this preprint
(which was not peer-reviewed) is the author/funder, who has granted bioRxiv a license to display the preprint in perpetuity.
It is made available under a CC-BY 4.0 International license.
detectable change in CTCF distribution (Gassler et al., 2017; Haarhuis et al., 2017;
Wutz et al., 2017). Similar conclusions regarding the copy number and occupancy of
cohesin and CTCF have recently been drawn in mouse embryonic stem cells and
human U2OS cells (Hansen et al., 2017; Cattoglio et al., 2018). Importantly, these
authors concluded that only around 49 % of nuclear CTCF molecules are actually
chromatin-bound (Hansen et al., 2017).
Cohesin residence time and genome organisation
Our FRAP data indicate that in G1, cohesin is bound to chromatin dynamically with a
residence time of around 13 minutes, although our measurements cannot exclude
that there are also more short-lived interactions between cohesin and chromatin as
reported earlier (Ladurner et al., 2014). To try to understand whether dynamic
cohesin complexes might participate in loop extrusion, it is interesting to consider
how fast cohesin would have to extrude to generate a chromatin loop of a defined
size within its estimated residence time. To generate a 100 kb loop (the genomic
distance that covers more than 80 % of cohesin enrichment sites; Supplementary
Figure 7C), a dynamically chromatin-bound cohesin complex would need to extrude
at around 8 kb/min. Since we found that the distance between neighbouring cohesin
enrichment sites was highly variable and cohesin occupancy at these sites is likely to
be below 100 %, an alternative estimate as to the dimensions of a typical chromatin
loop is to use the median TAD size determined in Hi-C experiments (~ 185 kb, Rao
et al., 2014). Using this value, dynamically chromatin-bound cohesin would need to
extrude at rates of around 14 kb/min. These calculated rates of dynamic cohesin-
mediated loop extrusion are close to the predicted rate of loop extrusion by cohesin
in HeLa cells (22.5 kb/min, Rao et al., 2017), condensin II in chicken cells (6 – 12
kb/min, Gibcus et al., 2018), SMC complexes in B. subtilis (54 kb/min, Wang et al.,
2017) and the maximal rate of loop extrusion observed for yeast condensin in vitro
(90 kb/min, Ganji et al., 2018).
Genome organisation and sister chromatid cohesion
The ring model of sister chromatid cohesion proposes that cohesive cohesin
complexes topologically entrap replicated sister chromatids. If cohesin extrudes
loops of chromatin, it is possible that it does so without topological entrapment,
raising the possibility that two populations of cohesin exists in cells, one that is
13bioRxiv preprint first posted online Feb. 26, 2019; doi: http://dx.doi.org/10.1101/560425. The copyright holder for this preprint
(which was not peer-reviewed) is the author/funder, who has granted bioRxiv a license to display the preprint in perpetuity.
It is made available under a CC-BY 4.0 International license.
competent for loop extrusion and the other for cohesion (Srinivasan et al., 2018).
Cohesion is believed to be mediated by stably-bound complexes, which we find
comprise around a half of all chromatin-bound cohesin in G2 (Figure 3C). Depletion
of WAPL results in the stabilization of cohesin complexes on chromatin and a
dramatic change in chromatin architecture, indicating that stably-bound cohesin
complexes are able to function in chromosome organisation and that alteration of
cohesin’s residence time may influence this process (Kueng et al., 2006; Tedeschi et
al., 2013; Gassler et al., 2017; Haarhuis et al., 2017; Wutz et al., 2017). However,
the number and position of TADs and loops does not differ significantly between G1
and G2 cells (Wutz et al., 2017), i.e. chromatin architecture does not detectably
change even though many cohesin complexes are stably bound to chromatin in G2.
This raises the interesting possibility that stably-bound cohesive cohesin in G2 is
functionally distinct from the stably-bound cohesin found in cells depleted of WAPL.
If so, it is possible that this is because the former might interact with two stretches of
chromatin topologically and the latter might do so non-topologically.
Considering the notion that around half of chromatin-bound cohesin is stably-bound
in G2 and may not function in loop extrusion, we were interested to use our LC-MS,
FCS and FRAP data to compare the number of dynamically chromatin-bound
cohesin complexes in cells synchronized in G1 and G2. If chromatin loops are
formed by dynamically bound cohesin one might expect that more of these
complexes are present on chromatin in G2-phase to be able to form long-range
chromatin interactions on both sister chromatids. However, even though the total
number of cohesin complexes bound to chromatin in G2 is twice of that in G1, our
FRAP data indicate that the number of dynamically chromatin-bound cohesin
complexes is actually slightly reduced (Table 1, Table 2, Table 3 and Figure 3D).
Thus, either stably-bound cohesin participates in genome organisation in some way
– without any of the changes in chromatin structure observed following WAPL
depletion – or the two-fold increase in DNA content in G2 must be organised by
relatively fewer cohesin complexes.
14bioRxiv preprint first posted online Feb. 26, 2019; doi: http://dx.doi.org/10.1101/560425. The copyright holder for this preprint
(which was not peer-reviewed) is the author/funder, who has granted bioRxiv a license to display the preprint in perpetuity.
It is made available under a CC-BY 4.0 International license.
Implications of cohesin copy number measurements for cohesion at
centromeric regions
Using FCS and FRAP, we estimated that around 262,000 cohesin complexes are
bound to chromatin in a typical G2 cell, of which around half are bound stably to
chromatin (Table 3, Figure 3D). Since the stable fraction is the one thought to
mediate cohesion (Gerlich et al., 2006), this suggests that around 132,000 cohesin
complexes establish cohesion between replicated genomes that each contain
120,000 predicted cohesin enrichment sites. Thus, if cohesion is mediated by
monomeric cohesin, it is possible that it is established at every cohesin enrichment
site in a single cell. However, since the proximity to a cohesin enrichment site does
not correlate with suppression of sister chromatid resolution in G2 (Stanyte et al.,
2018), it is also possible that only a subset of cohesin enrichment sites are occupied
by cohesive cohesin at any one time.
Our results obtained with prometaphase arrested HeLa cells imply that the situation
may be different at centromeres. Using LC-MS, we estimated that only around
14,000 cohesin complexes were bound to chromosomes in these cells (Figure 1 and
Table 1). These numbers are in good agreement with the previous observation that
approximately 90% of all chromatin-bound cohesin complexes dissociate from
chromosomes in prophase and prometaphase (Waizenegger et al., 2000; Gerlich et
al., 2006). Since previous immunofluorescence microscopy experiments have shown
that in prometaphase-arrested cells cohesin is exclusively detected at centromeres
(Gimenez-Abian et al., 2004) and because ChIP experiments could not detect
cohesin in the non-repetitive part of the genome in such cells (Wendt et al., 2008),
we assume that most of the 14,000 cohesin complexes that we found on
prometaphase chromosomes must have represented cohesin at centromeres. Since
the HeLa cells used in this study contained on average 64 chromosomes, our
measurements indicate that each of these chromosomes might contain around 200
cohesin complexes in its centromeric region.
With this study, we have measured the number of cohesin complexes and cohesin
regulatory proteins in a human cell line that is widely used for studying chromatin
organization and mechanisms of sister chromatid cohesion. We have approximated
how many of those cohesin complexes may participate in these two functions and
15bioRxiv preprint first posted online Feb. 26, 2019; doi: http://dx.doi.org/10.1101/560425. The copyright holder for this preprint
(which was not peer-reviewed) is the author/funder, who has granted bioRxiv a license to display the preprint in perpetuity.
It is made available under a CC-BY 4.0 International license.
have related this to the genomic distribution of cohesin enrichment sites throughout
the cell cycle. Our findings suggest that at least some but likely many of the
predicted cohesin enrichment sites are unoccupied in a single cell at a given
timepoint, implying that our current models of chromatin organization and sister
chromatid cohesion derived from large populations of cells may not fully reflect the
situation in individual cells.
Materials and Methods
Data reporting and accessibility
No statistical methods were used to predetermine sample size. The experiments
were not randomized. The investigators were not blinded to allocation during
experiments and outcome assessment. The mass spectrometry proteomics data
have been deposited to the ProteomeXchange Consortium via the PRIDE (Perez-
Riverol et al., 2019) partner repository with the dataset identifier PXD012712.
Generation of EGFP-tagged NIPBL HeLa Kyoto cell line
The EGFP-NIPBL cell line was generated by homology-directed repair using
CRISPR Cas9(D10A) paired nickase (Ran et al., 2013). A donor plasmid comprising
homology arms (700–800 bp on either side of the NIPBL coding sequence start site)
and EGFP were cloned into plasmid pJet1.2 (Thermo Scientific, K1232). Cas9 guide
RNA sequences were identified using the website crispr.mit.edu (guide A:
gTCCCCGCAAGAGTAGTAAT; guide B: gGTCTCACAGACCGTAAGTT) and
inserted into plasmid pX335 (a gift from Feng Zhang, Addgene, 42335). HeLa Kyoto
cells (Landry et al., 2013) were transfected with donor, Cas9 nickase plasmids and
Lipofectamine 2000 (Invitrogen, 11668019). Media were replaced the next day and
cells were maintained for 7 days before sorting GFP positive cells by flow cytometry
into 96 well plates. Clone F2 was selected after verification of homozygous GFP
insertion by PCR of genomic DNA and inspection by microscopy.
Characterisation of EGFP-tagged cell lines
PCR of genomic DNA was used to verify homozygous GFP insertion. The following
primers were used: EGFP-NIPBL: ATCGTGGGAACGTGCTTTGGA,
GCTCAGCCTCAATAGGTACCAACA. STAG1-EGFP:
16bioRxiv preprint first posted online Feb. 26, 2019; doi: http://dx.doi.org/10.1101/560425. The copyright holder for this preprint
(which was not peer-reviewed) is the author/funder, who has granted bioRxiv a license to display the preprint in perpetuity.
It is made available under a CC-BY 4.0 International license.
AAATCGGCGAGAGAGAGCTG, TCACTTCCAGTGAAGCCCAC. STAG2-EGFP:
AGAGGGGAAGTTTTCAAAGTGGT, CAGCCCAATGCTTGATTTCTGA. EGFP-
WAPL: TGATTTTTCATTCCTTAGGCCCTTG, TACAAGTTGATACTGGCCCCAA.
EGFP-sororin: GCTAGCCCTACGTCACTTCC, TGCAGTCCCAGTACACAACG.
Western blotting was used to detect proteins of interest in HeLa Kyoto w.t. and GFP-
tagged cell lines. For western blotting of GFP-tagged NIPBL, STAG1, STAG2, and
WAPL HeLa Kyoto cell lines, cells were resuspended in RIPA buffer (50 mM Tris pH
7.5, 150 mM NaCl, 1 mM EDTA, 1% NP-40, 0.5% Na-deoxycholate and 0.1% SDS),
supplemented with pepstatin, leupeptin and chymostatin (10 µg/ml each) and PMSF
(1 mM). Protein concentration was determined using the Bradford Protein Assay
(Bio-Rad Laboratories). Samples were separated by SDS-PAGE and western
blotting was performed using the antibodies described below. For western blotting of
GFP-tagged sororin HeLa Kyoto cell line, a chromatin extract was prepared as
described previously (Ladurner et al., 2014). Antibodies used: rabbit anti-STAG1
(Peters laboratory ID A823), goat anti-STAG2 (Bethyl, A300-158A), rabbit anti-WAPL
(Peters laboratory ID A1017), rabbit anti-sororin (Peters laboratory ID A953), rat anti-
NIPBL (Absea 010702F01), mouse anti-tubulin (Sigma, T-5168) and mouse anti-
GFP (Roche, 11814460001).
iFRAP
For live-cell imaging, cells were seeded into LabTek II chambered coverslips
(ThermoFisher Scientific) in cell culture medium without riboflavin and phenol red,
and cultured at 37 °C and 5% CO2 during imaging. Cells in G1 and G2 phase were
identified by nuclear and cytoplasmic distribution of DHB-mKate2 signals,
respectively. 1 µg/ml cycloheximide was added to the imaging medium 1 hr before
the imaging to reduce new synthesis of SCC1-mEGFP. Both FRAP and iFRAP
experiments were performed using an LSM880 confocal microscope (Carl Zeiss)
with a 40 × 1.4 NA oil DIC Plan- Apochromat objective (Zeiss). Photobleaching was
performed in half of nuclear regions with 2 iterations of 488 nm laser at max intensity
after acquisition of two images. Fluorescence was measured in bleached- and
unbleached regions followed by background subtraction with 1 min interval. iFRAP
curves were normalized to the mean of the pre-bleach fluorescent intensity and to
the first image after photobleaching. Curve fitting was performed with single
17bioRxiv preprint first posted online Feb. 26, 2019; doi: http://dx.doi.org/10.1101/560425. The copyright holder for this preprint
(which was not peer-reviewed) is the author/funder, who has granted bioRxiv a license to display the preprint in perpetuity.
It is made available under a CC-BY 4.0 International license.
exponential functions f(t) = EXP(-kOff1*t) or double exponential functions f(t) =
a*EXP(-kOff1*t)+(1-a)*EXP(-kOff2*t) in R using the minpack.lm package (version
1.2.1). Dynamic and stable residence times were calculated from 1/kOff1 and
1/kOff2 respectively. Double exponential curve fitting was performed under
constraint that 1/kOff2 is in range between 1.5 hr and 15 hr. Soluble fractions were
estimated by the reduction of fluorescence signals in unbleached area after
photobleaching.
Chromatin immunoprecipitation and Illumina sequencing
Cells were synchronized in G1 phase using the same procedure as described for
LC-MS. ChIP was performed as described (Wendt et al., 2008). Ten million cells
were used for one ChIP experiment. Cells were crosslinked with 1/10 medium
volume of X-link solution (11% formaldehyde, 100 mM NaCl, 0.5 mM EGTA, 50 mM
Hepes pH 8.0) at room temperature for 10 min and subsequently quenched with 125
mM glycine for 5 min. Cells were washed with PBS and collected by mechanical
scraping and pelleted by centrifugation. Cell pellets were lysed in lysis buffer (50 mM
Tris-HCl pH 8.0, 10 mM EDTA pH 8.0, 1% SDS, protease inhibitors) on ice for 20
min. The DNA was sonicated for 6 cycles (30 sec on/off) using a Biorupter. Ten
volumes of dilution buffer (20 mM Tris-HCl pH 8.0, 2 mM EDTA pH 8.0, 1% Triton X-
100, 150 mM NaCl, 1 mM PMSF) was added to the lysate, which was then pre-
cleared using 100 µl Affi-Prep Protein A beads at 4°C. Immunoprecipitation was
performed with rabbit IgG or specific antibody overnight; Affi-Prep Protein A beads
were then added for a further 3 hours. Anti-GFP antibody ab290 (Abcam, United
Kingdom) was used to immunoprecipitate EGFP-STAG1 and STAG2-EGFP. An
antibody raised against peptide CEMAKDFVEDDTTHG, Peters lab antibody ID:
k727, was used to immunoprecipitate SMC3. Anti-CTCF antibody 07-729 (Merck,
Germany) was used to immunoprecipitate CTCF. Beads were washed twice with
Wash buffer 1 (20 mM Tris-HCl pH 8.0, 2 mM EDTA pH 8.0, 1% Triton X-100, 150
mM NaCl, 0.1% SDS, 1 mM PMSF), twice with Wash buffer 2 (20 mM Tris-HCl pH
8.0, 2 mM EDTA pH 8.0, 1% Triton X-100, 500 mM NaCl, 0.1% SDS, 1 mM PMSF),
twice with Wash buffer 3 (10 mM Tris-HCl pH 8.0, 2 mM EDTA pH 8.0, 250 mM LiCl,
0.5% NP-40, 0.5% deoxycholate), twice with TE buffer (10 mM Tris-HCl pH 8.0, 1
mM EDTA pH 8.0), and eluted twice with 200 µl elution buffer (25 mM Tris-HCl pH
7.5, 5 mM EDTA pH 8.0, 0.5% SDS) by shaking at 65°C for 20 min. The eluates
18bioRxiv preprint first posted online Feb. 26, 2019; doi: http://dx.doi.org/10.1101/560425. The copyright holder for this preprint
(which was not peer-reviewed) is the author/funder, who has granted bioRxiv a license to display the preprint in perpetuity.
It is made available under a CC-BY 4.0 International license.
were treated with RNase-A at 37°C for 1 hour and proteinase K at 65°C overnight.
Addition of 1 µl glycogen (20 mg/ml) and 1/10th volume sodium acetate (3 M, pH
5.2) was followed by extraction with phenol/chloroform/isoamyl alcohol (25:24:1) and
precipitation with ethanol. DNA was resuspended in 100 µl of H2O, and ChIP
efficiency was quantified by quantitative PCR (qPCR). The DNA samples were
submitted to Vienna BioCenter Core Facilities for library preparation and Illumina
deep sequencing.
ChIP-seq peak calling and site overlap counting
Illumina sequencing results of ChIP-seq experiments were mapped against the
human hg19 reference assembly using bowtie2 (bowtie-
bio.sourceforge.net/bowtie2/index.shtml); the resulting alignments from two
biological replicate experiments for each immunoprecipitation were combined as
BAM files using samtools merge (samtools.sourceforge.net/). Peaks were called by
MACS 1.4.2 (liulab.dfci.harvard.edu/MACS/) with a P-value threshold of 1e-10 using
sample and control inputs. Peak overlaps were calculated by using multovl 1.3
(github.com/aaszodi/multovl). Since occasionally two peaks from one dataset
overlap with a single peak in another dataset, the output of such an overlap is
displayed as a connected genomic site and counted as one single entry.
Consequently, the overall sum of peak counts is reduced when displayed in
overlaps.
LC-MS Methods
Cell culture
HeLa Kyoto cells were cultured as described previously (Nishiyama et al., 2010).
Cells were synchronized in G2 phase by a double thymidine block (24h block in 2
mM thymidine, 8h release and 16h block in 2 mM thymidine) followed by a 6h
release into G2 phase. Cells were synchronized in Prometaphase by a double
thymidine block followed by a 6h release and a 4h block in Prometaphase using a
final concentration of 100 ng/ml nocodazole. Prometaphase cells were harvested by
shake off. Cells were synchronized in G1 phase using the same procedure as
described for Prometaphase cells, but after mitotic shake off, cells were washed
19bioRxiv preprint first posted online Feb. 26, 2019; doi: http://dx.doi.org/10.1101/560425. The copyright holder for this preprint
(which was not peer-reviewed) is the author/funder, who has granted bioRxiv a license to display the preprint in perpetuity.
It is made available under a CC-BY 4.0 International license.
twice and cultured for a further 6h. Cells were counted using a CASY counter
(Schärfe, Germany) and cells counts were verified by manual counting.
Preparation of soluble and chromatin extracts
2 x10⁷ cells in G1, G2 and Prometaphase were re-suspended in 0.5 ml lysis buffer
(20 mM Hepes pH 7.6, 150 mM NaCl, 10% glycerol, 0.2% NP40, 1 mM NaF, 1 mM
sodium butyrate, 1 mM EDTA and 10 µg/ml (w:v) each of leupeptin, pepstatin and
chymostatin) and cells were lysed with 20 strokes using a dounce homogenizer.
Chromatin and soluble fractions were separated by centrifugation at 1000 g for 3 min
at 4°C. The soluble supernatant was centrifuged for a further 20 min at 20000 g at
4°C (soluble extract). The chromatin pellet was washed by resuspension in 1 ml lysis
buffer and centrifugation at 1000 g for 3 min at 4 oC. Washing was repeated for a
total of 10 times. The chromatin pellet was then re-suspended in 250 µl nuclease
buffer (lysis buffer complimented with a final concentration of 0.04 units/µl
micrococcal nuclease, 0.1 mg/ml RNase A, 20 mM CaCl2 and 0.04 µl Turbo DNase
per µl nuclease buffer), incubated for 2 h at 4°C and for 15 min at 37°C and finally
centrifuged at 20000 g for 5 min (chromatin extract). 90% of soluble and chromatin
extracts were used for immunoprecipitation and 10% (corresponding to 2 x 10⁶ cells)
were precipitated using acetone. To compensate for losses during acetone
precipitation the protein concentration was measured before and after precipitation
using Bradford reagent (on average 17% loss). The protein pellets were
resuspended in 1 ml 500 mM tetraethylammonium chloride (TEAB, Fluka) (soluble
extract) and 50 µl 500 mM TEAB (chromatin extract), respectively. Proteolysis of
soluble and chromatin total cell extracts was performed using a double digest
protocol. After reduction in 1mM tris(2-carboxyethyl)phosphine (TCEP) at 56°C for
30 min and alkylation in 2 mM methyl methanethiosulfonate (MMTS, Fluka) for 30
min, proteins were digested with 500 ng LysC per 20 µl extract (Wako, Richmond,
VA) at 37°C for 4h. Proteins were then digested with 500 ng trypsin per 20 µl extract
(MS grade trypsin gold, Promega) for 16h at 37°C.
Absolute quantification of cohesin in total cell extracts using SRM on 5500
QTRAP
Immediately before LC-SRM analysis, digested soluble and chromatin cell extracts
were labeled with the light version of the mTRAQ reagent according to the
20bioRxiv preprint first posted online Feb. 26, 2019; doi: http://dx.doi.org/10.1101/560425. The copyright holder for this preprint
(which was not peer-reviewed) is the author/funder, who has granted bioRxiv a license to display the preprint in perpetuity.
It is made available under a CC-BY 4.0 International license.
manufacturer’s instructions. For quantification in total soluble extracts, 1.5 µg
(experiment 1) and 2 µg (experiment 2) of HeLa extract were used. The mTRAQ
light-labeled extract was spiked with heavy labeled reference peptides (2.5 and 5
fmol for the soluble extract and 10 fmol for the chromatin extract). Samples were
then separated on a Dionex Ultimate 3000 RSLCnano-HPLC equipped with a C18
PepMap100 column (75 µm ID × 500 mm length, 3 µm particle size, 100 Å pore size)
(Dionex, Amsterdam, The Netherlands) using the following gradient of solvents A
(2% ACN, 0.1% FA) and B (80% ACN, 10% TFE, 0.08% FA) at a flow rate of 250
nl/min: from 2%B to 40% B over 300 min. The mass spectrometer was operated in
scheduled SRM mode with the following parameters: multiple reaction monitoring
(MRM) detection window of 360 sec, target scan time of 2.5 sec, curtain gas of 20,
ion source gas 1 of 15, declustering potential of 75, entrance potential of 10. Q1 and
Q3 were set to unit resolution. The pause between mass ranges was set to 2.5 ms.
Three SRM transitions per peptide were monitored.
Immunoprecipitation of cohesin complexes
Immunoprecipitation (IP) was performed as described (Holzmann et al., 2011). In
brief, extracts were incubated on a rotary shaker with 30 µl SCC1 antibody-
conjugated beads for 2h at 4°C (antibody raised against peptide
FHDFDQPLPDLDDIDVAQQFSLNQSRVEEC; Peters lab antibody ID: A890, k575).
Beads were then collected by centrifugation and washed three times with 30 beads
volume lysis buffer and three times with 30 beads volume lysis buffer minus
detergent and protease inhibitor. Finally, beads were washed once with 30 bead
volumes of 5 mM Hepes pH 7.8 and 150 mM NaCl. 10 µl of beads were used for
elution with 0.2 M glycine pH 2.0 and analysed using SDS-PAGE. 20 µl of beads
were re-suspended with 40 µl 500 mM TEAB and subjected to protease elution
essentially as described (Holzmann et al., 2011). Proteolysis was performed using a
double digest protocol using LysC and trypsin (Holzmann et al., 2011).
Analysis of shotgun proteomics data
For peptide identification, the RAW-files were loaded into Proteome Discoverer
(version 2.1.0.81, Thermo Scientific). All MS/MS spectra were searched using MS
Amanda (Search Engine Version 2.2.6.11097) (Dorfer et al., 2014). RAW-files were
searched against the human swissprot database (2017-04-02; 20.153 sequences;
21bioRxiv preprint first posted online Feb. 26, 2019; doi: http://dx.doi.org/10.1101/560425. The copyright holder for this preprint
(which was not peer-reviewed) is the author/funder, who has granted bioRxiv a license to display the preprint in perpetuity.
It is made available under a CC-BY 4.0 International license.
11,315.842 residues), using the following search parameters: the peptide mass
tolerance was set to 10 ppm and the fragment mass tolerance to 0.8 Da. Trypsin
was specified as the proteolytic enzyme, cleaving after lysine and arginine except
when followed by proline. The maximal number of missed cleavages was set to 2.
Beta-methylthiolation on cysteine was set as fixed and oxidation on methionine was
set as variable modification. Proteins were grouped applying a strict parsimony
principle and filtered to 1 % false discovery rate (FDR) on PSM and protein level
using the Percolator algorithm (Kall et al., 2007) as integrated in Proteome
Discoverer. Proteins identified by a single spectra were removed. In all six samples
combined (soluble and chromatin-bound cohesin from cells in G1, G2 and
prometaphase), we identified 377 and 265 different proteins in two independent
experiments (Supplementary Table 2). In both experiments, core cohesin subunits
were among the 14 most abundant proteins identified according to the number of
peptide spectrum matches.
Absolute quantification of purified cohesin using SRM on 5500 QTRAP
Immediately before LC-SRM analysis, digested cohesin was labeled with the light
version of the mTRAQ reagent according to the manufacturer’s instructions. Labeling
efficiency was checked by LC-MS experiments on Orbitrap and found to be >98%.
mTRAQ light-labeled cohesin was spiked with 10 fmol (biological experiment 1) and
15 fmol (biological experiment 2), respectively of mTRAQ heavy labeled reference
peptides. Preparation of heavy reference peptides was performed essentially as
described (Holzmann et al., 2011), but peptide EQLSAER was replaced by
ELAETEPK. To remove excess of 2-propanol samples were concentrated in a
Speed Vac for 10 min to a final volume of approximately 25% of the starting volume
and re-diluted with 0.1% trifluoroacetic acid (TFA, Pierce). Samples were then
separated on a Dionex Ultimate 3000 RSLCnano-HPLC equipped with a C18
PepMap100 column (75 µm ID × 500 mm length, 3 µm particle size, 100 Å pore size)
(Dionex, Amsterdam, The Netherlands) using the following gradient of solvents A
(2% ACN, 0.1% FA) and B (80% ACN, 10% TFE, 0.08% FA) at a flow rate of 250
nl/min: from 2%B to 40% B over 120 min. Peptides eluting from the nanoLC were
analysed on a 5500 QTRAP instrument (ABSCIEX, Foster City, CA) equipped with a
nano-electrospray source with an applied voltage of 2.3 kV. The mass spectrometer
was operated in scheduled SRM mode with the following parameters: MRM
22You can also read