Insilicoanalysis of DNA re-replication across a complete genome reveals cell-to-cell heterogeneity and genome plasticity
←
→
Page content transcription
If your browser does not render page correctly, please read the page content below
Published online 28 January 2021                                                    NAR Genomics and Bioinformatics, 2021, Vol. 3, No. 1 1
                                                                                                              doi: 10.1093/nargab/lqaa112

In silico analysis of DNA re-replication across a
complete genome reveals cell-to-cell heterogeneity
and genome plasticity
Maria Anna Rapsomaniki 1,2 , Stella Maxouri1 , Patroula Nathanailidou1 ,
Manuel Ramirez Garrastacho1 , Nickolaos Nikiforos Giakoumakis1 , Stavros Taraviras3 ,
John Lygeros 2,* and Zoi Lygerou 1,*

                                                                                                                                                                  Downloaded from https://academic.oup.com/nargab/article/3/1/lqaa112/6122908 by guest on 24 November 2021
1
 Department of Biology, School of Medicine, University of Patras, 26500 Rio Patras, Greece, 2 Automatic Control
Laboratory, ETH Zurich, 8092 Zurich, Switzerland and 3 Department of Physiology, School of Medicine, University of
Patras, 26500 Rio Patras, Greece

Received August 25, 2020; Revised December 15, 2020; Editorial Decision December 22, 2020; Accepted January 20, 2021

ABSTRACT                                                                          ple sites across the genome, known as origins of repli-
                                                                                  cation, and continues bidirectionally through replication
DNA replication is a complex and remarkably robust                                forks that move continuously until precisely two DNA
process: despite its inherent uncertainty, manifested                             copies are produced (1,2). DNA replication is a complex
through stochastic replication timing at a single-cell                            and uncertain process, as only a small fraction of all pu-
level, multiple control mechanisms ensure its ac-                                 tative origins is selected to fire in each cell, resulting in
curate and timely completion across a population.                                 an individual progression along the genome at a single-
Disruptions in these mechanisms lead to DNA re-                                   cell level (3,4). Despite this high degree of stochasticity,
replication, closely connected to genomic instabil-                               DNA replication is also remarkably robust: it is tightly
ity and oncogenesis. Here, we present a stochastic                                regulated in time and space by multiple control mecha-
hybrid model of DNA re-replication that accurately                                nisms that ensure its completion in an accurate and timely
portrays the interplay between discrete dynamics,                                 manner (1,5–7).
                                                                                     To maintain genome stability, each part of the genome
continuous dynamics and uncertainty. Using experi-
                                                                                  must be replicated once and only once every time a cell di-
mental data on the fission yeast genome, model sim-                               vides. At the beginning of each cell cycle, two licensing fac-
ulations show how different regions respond to re-                                tors, Cdt1 and Cdc6/18, load the MCM2–7 replicative he-
replication and permit insight into the key mecha-                                licase onto DNA, thereby licensing origins for a new round
nisms affecting re-replication dynamics. Simulated                                of DNA replication (8,9). In S phase, the replicative helicase
and experimental population-level profiles exhibit a                              either becomes active and moves away from origins with
good correlation along the genome, robust to model                                the replication fork or is removed by passive replication.
parameters, validating our approach. At a single-cell                             Cdt1 and Cdc6/18 are strictly controlled and are inacti-
level, copy numbers of individual loci are affected by                            vated as soon as replication starts, ensuring that the replica-
intrinsic properties of each locus, in cis effects from                           tive helicase cannot load again onto origins that have been
adjoining loci and in trans effects from distant loci.                            replicated, and therefore origins cannot fire a second time.
                                                                                  Disruption of this control mechanism leads to re-firing of
In silico analysis and single-cell imaging reveal that
                                                                                  origins within the same cell cycle, a pathological process
cell-to-cell heterogeneity is inherent in re-replication                          known as DNA re-replication (10). Overexpression of the
and can lead to genome plasticity and a plethora of                               licensing factors Cdt1 and Cdc6/18 has been shown to pro-
genotypic variations.                                                             mote re-replication from yeast to humans. In fission yeast,
                                                                                  overexpression of Cdc18 leads to origin re-licensing within
INTRODUCTION                                                                      the same cell cycle, origin re-firing and an uneven increase of
                                                                                  DNA copy number (11), resulting in local amplification of
DNA replication ensures the maintenance of genetic in-                            the genome (12,13). Re-replication is enhanced by concomi-
formation and constitutes the basis of biological inheri-                         tant expression of Cdt1 (14,15). In budding yeast, the simul-
tance. In eukaryotes, DNA replication initiates at multi-

* To
   whom correspondence should be addressed. Tel: +30 2610 997689; Fax: +30 2610 991769; Email: lygerou@med.upatras.gr
Correspondence may also be addressed to John Lygeros. Tel: +41 44 632 8970; Fax: +41 44 632 12 11; Email: jlygeros@ethz.ch
Present address: Maria Anna Rapsomaniki, IBM Research Laboratory, Säumerstrasse 4, Rüschlikon 8803, Switzerland.

C The Author(s) 2021. Published by Oxford University Press on behalf of NAR Genomics and Bioinformatics.
This is an Open Access article distributed under the terms of the Creative Commons Attribution-NonCommercial License
(http://creativecommons.org/licenses/by-nc/4.0/), which permits non-commercial re-use, distribution, and reproduction in any medium, provided the original work
is properly cited. For commercial re-use, please contact journals.permissions@oup.com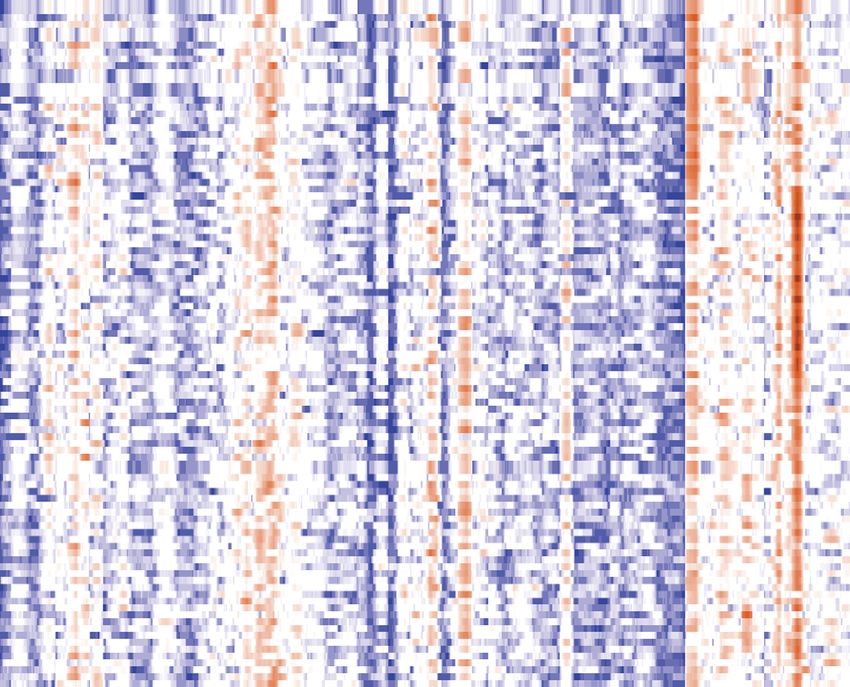
2 NAR Genomics and Bioinformatics, 2021, Vol. 3, No. 1

taneous inactivation of multiple control mechanisms leads           MATERIALS AND METHODS
to local re-replication (16,17), which can be converted to a
                                                                    DNA re-replication model and simulations
local increase in gene copy number (18,19) and increased
nucleotide-level mutagenesis (20). In mammalian cells, ec-          A complete mathematical description of the model states,
topic expression of Cdt1 alone or in combination with Cdc6          transitions and inputs is given in Supplementary Note 1.
is sufficient to drive re-replication at multiple loci (21). Both   A graphical overview of the model states and transitions is
Cdt1 and Cdc6 are often overexpressed in human tumors               given in Figure 1A-C, and model inputs and outputs are
(22), and have been linked to genomic instability early in the      shown in Supplementary Figure S1. The model was imple-
tumorigenesis process (23), which drives oncogenesis (24–           mented using MATLAB R2016b and the source code, gen-
30).                                                                erated data and extensively documented figure-generating
   Fission yeast has been used as a model organism for re-          scripts are available under an open-source license at: https:
replication studies, as regulatable expression of a single fac-     //github.com/rapsoman/DNA Rereplication. Monte Carlo

                                                                                                                                      Downloaded from https://academic.oup.com/nargab/article/3/1/lqaa112/6122908 by guest on 24 November 2021
tor (Cdc18) leads to genome-wide re-replication (11). Re-           simulations were executed on the HPC cluster of ETH
replication levels can be experimentally manipulated by reg-        Zurich.
ulating Cdc18 expression levels or co-expression of cofac-
tors, and can range from a DNA content close to normal
(2C, the DNA content of a normal G2 cell but resulting              Statistical methods and data analysis
from uneven replication along the genome) to 32C (12–14).           Denoising of raw CGH data. For the denoising step, we
At the population level, re-replication in fission yeast pro-       experimented with various methods (moving average filter,
gresses relatively evenly across the genome (12,13), while a        linear polynomial filter, a quadratic polynomial filter and
small number of prominent loci are re-replicated above the          a Savitzky–Golay filter) and a variety of parameter values
genome mean. Common features of the central origins un-             (e.g. span/window size, degree of the fitted polynomial).
derlying these re-replicating ‘hotspots’ include AT-richness,       From all combinations, a quadratic polynomial fit with a
early firing in a normal S phase and localization in large          span size of 80 units was chosen as the most appropriate, be-
intergenic regions (13), features that also characterize effi-      cause of its ability to eliminate noise while fitting the shape
cient origins (31). Re-replication and normal S-phase ori-          and preserving the height of the peaks (Figure 2, top in
gins largely overlap; however, notable differences between          black).
specific loci suggest that re-replication dynamics differ from
normal replication.                                                 Peak finding. To locate the peaks, we implemented a sim-
   To date, a number of mathematical and computational              ple peak finding method, which identifies as a peak all local
models of DNA replication in a number of organisms have             maxima, i.e. all locations where the gradient of the signal
been developed (32–41). However, the properties and under-          changes sign. We also applied an intensity cutoff threshold
lying mechanisms of DNA re-replication across the genome            and set it to 1 to eliminate the peaks whose intensity was be-
remain unknown. Given the large number of origins along             low the genome mean. At the same time, a peak-matching
the genome and the stochasticity of origin firing (42–44),          step with a threshold of 40 kb was applied, so that local
it is unclear how re-replication would progress along the           maxima in experimental and simulated data with a linear
genome in each individual cell in a re-replicating popu-            distance
NAR Genomics and Bioinformatics, 2021, Vol. 3, No. 1 3

                                                                                                                                                                             Downloaded from https://academic.oup.com/nargab/article/3/1/lqaa112/6122908 by guest on 24 November 2021
Figure 1. A stochastic hybrid model of DNA re-replication. (A) Normal DNA replication versus DNA re-replication. Normal DNA replication (left) starts
from multiple replication origins (shown here as dots) and is tightly controlled, ensuring that during each cell cycle every origin fires once and precisely
two DNA copies are produced. During DNA re-replication (right), re-firing of the origins results in many DNA copies on multiple strands and uneven
amplification of the genome. (B) Abstract representation of the DNA re-replication model. Circles of different colors represent discrete origin states and
arrows represent allowed transitions (black: transitions in normal replication; blue: transitions allowed only in re-replication). When an origin fires or is
passively replicated, its offspring automatically fall into the Pr e R state and can thus fire or be passively replicated again. (C) Evolution of re-replication and
example transitions between states. Dots of different colors correspond to origins of different states (same as in B). Solid black lines represent synthesized
DNA and dotted gray horizontal lines correspond to different strands (strand index shown in gray on the right). Initially, all origins pictured are in the
Pr e R state and located on strand j . Then, Ori i, j fires and its offspring, Ori i,2 j and Ori i,2 j +1 automatically fall into the Pr e R state. Next, the left fork
of Ori i, j reaches the location of Ori i −1, j , which leads to its passive replication and the birth of origins Ori i −1,2 j and Ori i −1,2 j +1 that automatically fall
into the Pr e R state. In the meantime, Ori i,2 j also fires and creates Ori i,4 j and Ori i,4 j +1 which again fall into the Pr e R state. Note that the doubling
of the strand index (starting with the original strand j = 1) allows us to uniquely identify all strands. (D) DNA re-replication kinetics for 100 Monte
Carlo simulations. Total DNA content (C) over time. Different curves correspond to different simulations. (E) Total number of origins per state over time.
Different colors correspond to different origin states and different curves to different simulations. Highlighted curves correspond to the simulation closest
to the mean.

repeated with 22 randomly selected origins (out of the 839                              Comparison of origin locations and efficiencies across
origins). Consistently, we calculate that the genomic regions                           datasets. A comparison between the origin locations and
assumed to be coinciding with an experimental peak have a                               efficiencies used as input in our model (31) and an indepen-
total length of 29 · 40 001 = 1 160 029 bases (29 experi-                               dent dataset by Daigaku et al. (51) was performed, to assess
mental peaks with a surrounding 40 kb window each), cor-                                if disagreements between the two datasets could explain ob-
responding to 0.0923 of the total genome (genome length                                 served inconsistencies between experimental and predicted
= 12 571 820 bases). Randomly sampling 22 genome loca-                                  re-replication peaks. It should be noted that Daigaku et
tions would lead to 22 · 0.0923 = 2.0306 ≈ 2 re-replication                             al. report efficiencies in the presence of passive replica-
peaks selected by chance alone, consistent with our numer-                              tion, and not intrinsic efficiencies, and that reported effi-
ical analysis of the null model above. The identified over-                             ciencies are overall higher in Daigaku et al. in compari-
lap between experimental and simulated data (14 out of 22                               son to (31). Nonetheless, comparing the location and rel-
peaks) is therefore much higher than expected by chance.                                ative efficiencies of assigned origins across problematic re-
4 NAR Genomics and Bioinformatics, 2021, Vol. 3, No. 1
gions in the two datasets can help pinpoint loci where in- plementation of Principal Component Analysis (PCA) and
correct origin assignment in our input dataset may be the visualized the results (variable loadings and principal com-
cause of inconsistencies between simulated and experimen- ponents) using a biplot.
tal data. Out of the 15 experimental peaks missed by the
model, 12 could potentially be attributed to a discrepancy Clustering. To identify groups of similarly amplified pro-
in reported efficiencies; the model efficiencies used as in- files in the simulated data, we performed a clustering step
put in the peak proximal region were relatively low, but using the k-means algorithm with a squared Euclidean dis-
the Daigaku et al. dataset includes at least one highly ef- tance metric. We used the Gap statistic to identify the op-
ficient proximal origin. Conversely, out of the eight peaks timal k, a goodness-of-clustering approach that compares
predicted by the model that are absent from experimen- the change in within-cluster dispersion with that expected
tal data, two could potentially be attributed to the oppo- from a reference null distribution (52). We estimated the
site effect; the model input includes a highly efficient origin Gap statistic for up to k = 50 clusters using 100 reference
Downloaded from https://academic.oup.com/nargab/article/3/1/lqaa112/6122908 by guest on 24 November 2021
that is not present in the Daigaku et al. dataset. In Sup- data sets and selected as the optimal the smallest value of
plementary Table S3, a comparison across all experimen- k for which the value of the Gap statistic is not more than
tal and simulated peaks together with the efficiencies of 1 standard error away from the first local maximum. To es-
proximal origins in both datasets is presented. In Supple- timate the stability of the clustering we used the Adjusted
mentary Figure S2, five representative examples are shown. Rand Index (ARI), a pairwise metric of similarity between
Peak III-1 is a highly amplified region, corresponding to two different clustering assignments. The simple Rand In-
two overlapping re-replication hotspots from (13), which is dex (RI) is defined as the number of agreements over all
not predicted by the model. The Daigaku et al. dataset re- pairs of samples between two different clustering assign-
ports two highly efficient origins, missing from our input ments, divided by the total number of pairs, and reflects the
dataset, which could explain the inconsistency. In contrast, probability that a randomly picked pair of samples is con-
in the same region our input dataset but not the Daigaku sistently found belonging to the same cluster. The ARI is
et al. dataset contains an efficient, left-telomere proximal an extension of the RI that additionally corrects for chance
origin, which underlies simulated peak SIII-1, missing from (53). To compute the ARI, we ran 100 repetitions of the
the experimental re-replication data. Similarly, for Peak SI- clustering for the optimal k identified as described above,
5, which is predicted by the model but not present in the where each repetition was an independent run with a ran-
experimental dataset, an underlying highly efficient origin dom centroid initialization.
from our input dataset was not validated by Daigaku et al.
Dataset inconsistencies can also explain discrepancies be-
Implementation. All methods were implemented in the
tween simulated and experimental re-replication data in the
Statistics and Signal Processing Toolboxes of MATLAB
middle of Chromosome III, where the most pronounced
2016b.
simulated peak is less strong in the experimental data and
vice-versa. Not all disagreements between experimental and
simulated re-replication data can be explained by dataset
Experimental methods
discrepancies, however. For example, the underlying effi-
ciencies for experimental Peak II-8, which is not predicted Strain construction and cell growth. For the construc-
by the model, are low, whereas the underlying efficiencies tion of the re-replicating strain with the lys1+ tag the
for simulated Peak SII-3, which is not present in exper- strain C2566 (h-, LacO::lys1+, LacI-GFP::his7+, ChrI
imental data, are high for both datasets (Supplementary 1.5Mb::TetO-hphMX, Z locus::TetR-tdTomato-natMX,
Figure S2). leu1–32, ura4-D18, ade6-M210) kindly provided by Chris-
tian Häring was employed (54). To promote re-replication
Kernel density estimation. The distribution plots were de- C2566 was crossed with a strain carrying a truncated
rived using a kernel density estimate based on a normal ker- form of cdc18 under the nmt1 promoter (h-, nmt1-d55P6
nel and evaluated at 100 equally spaced points. (leu1+), ura4-D18, leu1–32) (55). The resulting strain un-
dergoes medium level of re-replication, which is adequate
Shannon entropy. To estimate the value of Shannon en- for the manifestation of high cellular heterogeneity but does
tropy H, we first discretized the data to 0 and 1, where 0 not severely decrease the viability of the cells. Moreover,
corresponds to copy numbers below the genome mean and medium level of re-replication does not affect the integrity
1 to simulations above the genome mean. Then, H is the of the nucleus, thus it is possible to detect and quantify
entropy of a Bernoulli process with probability p of two Hoechst staining through imaging. This strain was used
possible and mutually exclusive outcomes, and is defined as for the quantification of the lys1+ locus. To induce re-
follows: replication, cells were grown at 25◦ C in Edinburgh Minimal
Medium (EMM) supplemented with uracil and adenine in
H = − plog p − (1 − p) log (1 − p) ,
the presence of thiamine (5 g/ml) up to an OD600∼0.5. At
where Pr(X = 1) = pand Pr(X = 0) = 1 − p. Entropy this point cells were harvested, washed with EMM and di-
will take its maximal value of 1 when p = 0.5, i.e. in the luted to an OD600∼0.01 in EMM supplemented with uracil
case that an origin is amplified in half of the simulations. and adenine, both with and without thiamine and grown at
25◦ C for 30 h. Cells were harvested after 30 h, fixed with 4%
Principal component analysis. To compute the principal paraformaldehyde for 5 min, washed with water and stained
components of the data we used the MATLAB function im- with Hoechst for 5 min.NAR Genomics and Bioinformatics, 2021, Vol. 3, No. 1 5
Cell imaging and image analysis. Cell images were ob- origin fires (transition Pr e R → RB) or is passively repli-
tained in an Olympus IX83 widefield microscope equipped cated (transition Pr e R → Pass R), it generates two origins
with a 100× lens (NA 1.46) and a LED light-source. on two new strands, which automatically fall back into the
Z-stacks were acquired at a step size of 0.4 m. Pre- Pr e R state and can thus fire again (blue arrows in Figure
processing, segmentation and signal quantification for GFP 1B). To assign firing propensities of these newly replicated
and Hoechst were conducted with ImageJ. The top-hat al- origins, we assume that the total firing propensity (the sum
gorithm was applied for background correction. Signals for of all firing propensities of every origin in the cell) remains
each channel individually were detected by manual thresh- constant (see limiting factor hypothesis (39) and below for
olding. alternative implementations). Each time an origin fires (or is
passively replicated), its firing propensity gets dynamically
RESULTS redistributed to all pre-replicative origins across all strands,
in proportion to their current firing propensity.
Modeling DNA re-replication across a complete genome
Downloaded from https://academic.oup.com/nargab/article/3/1/lqaa112/6122908 by guest on 24 November 2021
The DNA re-replication model requires the following in-
DNA replication initiates from hundreds of origins along puts (Supplementary Figure S1): (i) total genome length,
the genome and results in the exact duplication of the ge- measured in base pairs, (ii) genomic locations of all ori-
netic material (Figure 1A). It is a complex process that in- gins, measured in base pairs, (iii) intrinsic firing efficien-
volves a combination of discrete dynamics (associated with cies of all origins and (iv) fork speed, measured in kilobases
the switch-like activation of each origin), continuous dy- replicated per minute (kb/min). Provided that this informa-
namics (associated with the movement of the replication tion is available, the model is applicable to any eukaryotic
forks along the DNA strands) and stochasticity (in the time genome. For the purposes of this work, the model was in-
and space of origin firing). How often a putative origin is stantiated for the case of fission yeast (Schizosaccharomyces
observed to fire in a population of normally replicating cells pombe). This organism has long served as a model system
depends on how often it is licensed for replication, how of- for the study of DNA replication control, as it exhibits con-
ten it is activated to fire when licensed, and how often it is served features, while its small genome (total genome length
passively replicated. Here, we define as intrinsic firing effi- ≈ 14 × 106 bases and three chromosomes) simplifies anal-
ciency the fraction of cells where an origin would be ob- ysis. Exact origin locations and their intrinsic firing efficien-
served to fire in the absence of passive replication. Intrin- cies (fraction of origins that fire when fork movement is
sic firing efficiency thus encompasses both the ability of the blocked with hydroxyurea) have been measured experimen-
origin to become licensed and its ability to fire. We define as tally across the complete fission yeast genome during nor-
firing propensity the probability that an origin fires in a unit mal replication (31) by microarray analysis. Supplementary
of time. Mathematical and computational models of DNA Table S1 shows the locations and efficiencies of the 893 fis-
replication have been proposed in the literature to capture sion yeast origins used as input. Each origin (Ori) is named
origin firing in time and space and the dynamics of DNA for the chromosome on which it resides (I-III) and a sequen-
replication (32,34–35,37,39,41,56). We developed an exten- tial number along the chromosome.
sion of a mathematical model of normal DNA replication We have assumed a constant fork speed. Though the
(39) to allow origin re-firing, resulting in a stochastic hybrid model can accommodate different fork speeds at different
model of DNA re-replication. chromosomal locations or across time, experimental data
Contrary to normal DNA replication, where exactly two for assigning a variable fork speed are currently lacking.
DNA copies are produced, in re-replication origin re-firing While initial estimations of mean fork speed during nor-
allows each origin to produce multiple copies (referred to mal DNA replication were around 3 kb/min (31,57–58), re-
here as offspring) on multiple resulting strands (Figure 1A). cent estimations of fork speed range from 0.5 to 1.5 kb/min
Each origin copy, whether ancestral or offspring, can be (59,60). Mean fork speed in re-replication is expected to be
identified by its genomic location and strand index and is slower than normal replication, due to limited nucleotide
denoted as Orii, j , where i = 1, . . . , n denotes the origin pools and interference between forks. Therefore, in our
index and j = 1, . . . , m the strand index. Figure 1B picto- base-case model, we set fork speed equal to 0.5 kb/min and
rially summarizes the discrete dynamics of the model. Sim- assumed it is uniform across the genome. In contrast to
ilarly to the model of (39), at any point in time, each ori- normal DNA replication, where the process is completed
gin can be in one of the depicted six states: pre-replicative when all genomic regions have doubled, in re-replication
(Pr e R), replicating in both directions (RB), replicating only there is no defined endpoint. The ploidy level C, i.e. the total
to the right or to the left (RR or RL), passively repli- amount of genomic material synthesized with respect to the
cated (Pass R) and post-replicative (Post R). The continu- initial amount, can be used to define discrete points along
ous dynamics are deterministic and model the movement the process. It should be noted that re-replication is not ex-
of the replication forks. Uncertainty plays a vital role in re- pected to progress evenly across the genome and therefore
replication, and it is represented by modeling the time and different genomic regions will be amplified to different ex-
location of origin firing and re-firing as stochastic events. tents at a given time point.
Transitions between discrete states, depicted as arrows in Monte Carlo simulations of the model for the aforemen-
Figure 1B, depend on both the continuous and stochastic tioned inputs were used to study the re-replication process.
dynamics of the system. In contrast to normal DNA repli- Since the model is stochastic, each simulation corresponds
cation, origins that have already fired or have been passively to a sample path of the stochastic process, i.e. a distinct
replicated can re-fire multiple times. These transitions are sequence of random events; Monte Carlo simulations per-
visualized in an example scenario in Figure 1C, when an mit the estimation of statistics over multiple such sequences.6 NAR Genomics and Bioinformatics, 2021, Vol. 3, No. 1
Due to the complexity of the process, the discrete and con- background noise and represent averages of three probes
tinuous state space quickly becomes very large. In a nor- and two independent experiments. Still, in silico and exper-
mal DNA replication cycle, the total number of origins dou- imental profiles appear overall similar, with several peaks
bles and reaches 1786 as the total DNA content C increases coinciding. Indeed, our model predictions fit experimental
from 1 to 2, while the maximum number of active forks observations reasonably well, as the Spearman correlation
will be up to double the number of origins. During the coefficient ρ between experimental and simulated whole-
course of re-replication, however, the number of origins and genome re-replication profiles was statistically significant
forks, equivalent to the discrete and continuous states of for all three fission yeast chromosomes (ρ = 0.6 and P-value
the model, increases drastically, in an example simulation, = 3.6 · 10−41 for Chromosome I, ρ = 0.61 and P-value =
already by the time that C reaches 2, 3861 origins at vari- 5.7 · 10−33 for Chromosome II, and ρ = 0.5 and P-value =
ous states and 2515 active forks are present. For C = 16, 7.3 · 10−12 for Chromosome III). To better compare sim-
the count of origins and forks escalates and increases al- ulated and experimental profiles, a peak-calling algorithm
Downloaded from https://academic.oup.com/nargab/article/3/1/lqaa112/6122908 by guest on 24 November 2021
most 10-fold, with 35 259 origins and 18 827 active forks was used, which identified 29 and 22 peak locations in ex-
present. perimental and simulated profiles respectively (dotted ver-
In Figure 1D, examples of the kinetics of DNA synthe- tical lines), representing regions of amplification in a pop-
sis over time are shown. Each curve corresponds to a single ulation of re-replicating cells. Details on the denoising and
simulation, and the spread between individual curves indi- peak finding processes are given in ‘Materials and Meth-
cates variability due to the stochastic nature of the model. ods’ section, and indices and locations of both peak sets are
We observe that the increase in DNA content over time is given in Supplementary Table S2.
exponential, and a DNA content of 8C is reached within ∼3 We observed that most peaks predicted from simulations
h, in the same range as experimental observations (12,13). correspond to major amplification peaks in the experimen-
The number of active (RB, RR, RL), passive (Pass R) and tal data; out of the 22 re-replication peaks in the simulated
pre-replicative origins (Pr e R) over time are shown in Fig- data, 14 also exist in the experimental data (precision ≈
ure 1E. During the course of re-replication, the number of 0.64). To further assess the agreement between experimen-
active and passive origins increases rapidly over time. Ini- tal and simulated peaks and examine whether it could be
tially, passively replicated origins are fewer than the actively attributed to chance or our peak-matching algorithm pa-
replicated ones, but as re-replication progresses, the num- rameters, we repeated the analysis 100 000 times using a null
ber of passively replicated origins increases faster and sur- model of 22 randomly picked genome locations (‘Materials
passes the number of origins that fired. This indicates that and Methods’ section). We found that there was no case out
the process gets eventually dominated by passive replication of the 100 000 random repetitions, with 14 peaks overlap-
instead of firing events. Pre-replicative origins increase ex- ping in experimental and randomly picked locations, indi-
ponentially, as all firing and passive replication events lead cating that the probability of the model’s prediction being
to the birth of new Pr e R origins. attributed to chance is less than 1 in 100 000. The maximal
We have therefore developed a model which can capture overlap, occurring only once in all 100 000 random repeti-
re-replication dynamics across an entire genome, account- tions, was 10 peaks, while the median overlap between ex-
ing for transitions in origins states, fork movement and perimental and random peaks was 2 peaks. Moreover, out
stochasticity. of the nine amplification regions identified in (13), six are
also present in the simulated profiles.
Some inconsistencies do exist between the two datasets;
DNA re-replication at a population level
out of 29 peaks in the experimental data, 15 are not pre-
Simulation results from the re-replication model were com- dicted (false negative rate ≈ 0.52). Most of these false neg-
pared to experimental data from re-replicating fission yeast atives however are attributed to peaks that are present but
cells. Specifically, we computed in silico mean amplification appear less sharp in the simulations (e.g. peaks in the mid-
profiles across the genome, referred to as signal ratios in dle part of Chromosome II) or to minor disagreements due
(13), by averaging the number of copies for each origin loca- to linear shifts in peak locations (e.g. the first and third true
tion and normalizing it to the genome mean in 100 simula- peaks of Chromosome III (31)). To assess if some of these
tions. In these profiles, peaks above 1 correspond to highly discrepancies could be due to incorrect assignment of origin
re-replicated regions, and valleys below 1 correspond to re- locations or efficiencies in the input dataset, we compared
gions that are under-replicated with respect to the mean. the input data with a different origin dataset, estimated us-
Mean profiles computed at 16C are shown in Figure 2, bot- ing a polymerase usage sequencing (Pu-seq) strategy during
tom row. Note that re-replication levels are higher on Chro- an unperturbed cell cycle in S. pombe (51). In this dataset,
mosome III in comparison to the other two chromosomes, passive replication is not inhibited, and efficiencies therefore
consistent with a higher efficiency of origins on this chromo- do not correspond to intrinsic firing efficiencies, as required
some (31). Simulated re-replication profiles were compared for model input. It can nevertheless be used to pinpoint re-
to re-replication profiles defined experimentally at a sim- gions where inconsistencies could be explained by the input
ilar ploidy (13), where location-specific amplification was data. Indeed, minor disagreements across datasets could ac-
assessed using array Comparative Genomic Hybridization count for observed inconsistencies in several cases (Supple-
in fission yeast cells co-overexpressing the licensing factors mentary Table S3 and Figure S2; ‘Materials and Methods’
Cdc18 and Cdt1 (Figure 2, top row). Simulated data show section). For example, the linear shift of the first peak on
the actual number of copies generated and are thus expected chromosome III in experimental and simulated data men-
to be sharper than experimental data, which are subject to tioned above can be explained by such a disagreement inNAR Genomics and Bioinformatics, 2021, Vol. 3, No. 1 7
Downloaded from https://academic.oup.com/nargab/article/3/1/lqaa112/6122908 by guest on 24 November 2021
Figure 2. Analysis of in silico data at a population level. Comparison between experimental (top row) and simulated (bottom row) mean amplification
profiles for 100 Monte Carlo runs for 16C along the three chromosomes of the fission yeast genome. Identified peaks, representing re-replication hotspots,
are marked in dotted vertical lines. Common peaks between simulated and experimental data are marked in red dashed vertical lines. Peaks corresponding
to the nine amplification regions identified by Kiang et al. (13) are marked in vertical arrows (red: identified also in simulated data, black: identified only
in experimental data).
efficiency datasets (Supplementary Figure S2). Striking in- Sensitivity analysis
consistencies which cannot be accounted for by discrepan-
We next sought to investigate the effects of different model
cies in the input dataset are relatively few and can point to
parameters and assumptions. We first varied fork speed: 0.5
regions along the genome which are specifically regulated
kb/min (base case) was compared to 1 and 3 kb/min (Sup-
under re-replication conditions. For example, the third peak
plementary Figure S3). As expected, the increase in DNA
on chromosome II in the simulated data (Peak SII-3) is sup-
content progresses faster at higher fork speeds: C = 16 is
ported by both efficiency datasets (Supplementary Figure
reached at 251.5, 187 and 114 min as fork speed increases
S2) but is not detected in experimental re-replication data,
from 0.5 to 1 and 3 kb/min (Supplementary Figure S3A and
suggesting that re-replication of this locus may be inhibited
B). Experimental observations show that under high levels
in cells. Similarly, the eighth peak on chromosome II (Peak
of re-replication, DNA content reaches 16C 4–6 h follow-
II-8) identified in experimental data and absent in simulated
ing accumulation of Cdc18 (14). Estimates for 0.5 kb/min
data resides in a low efficiency region in both origin datasets
are therefore closer to experimental observations. Passive
available (Supplementary Figure S2) and could indicate a
replication becomes more dominant as fork speed increases
region particularly prone to re-replication. Notably, sub-
(Supplementary Figure S3C).
telomeres are also highly amplified in experimental data but
A second variant of the model was tested, that differs on
not in the simulations, pointing to location-specific effects,
how the firing propensities of newly replicated origins are
not explicitly specified in our model, as previously suggested
assigned. In this variant (referred to as Unlimited Factor
(12). Such isolated events however do not significantly affect
or UF) we assume that when an origin fires or is passively
the overall re-replication dynamics.
replicated, the offspring inherit the same firing propensity as
We conclude that simulated population data fit experi-
the parent. This implies that firing propensities depend only
mental data genome-wide reasonably well, validating our
on the genomic location and hence remain the same for the
approach.
same origin across all strands. Under this assumption the8 NAR Genomics and Bioinformatics, 2021, Vol. 3, No. 1
total firing propensity (i.e. the sum of the propensities of all To assess variability at the single-cell level, we compared
the origins) will increase during re-replication (Supplemen- amplification plots from single simulations, generated by
tary Figure S3D). By contrast, in the base-case (referred to the base-case model. To assess the outcome at different
hereafter as Limiting Factor or LF), the total system firing ploidy levels, we compared simulations at 2C and 16C. In
propensity remains constant during re-replication while the both cases, single-cell profiles are characterized by a high
firing propensities of individual origins decrease, as more degree of variability and can deviate significantly from the
origins are born (Supplementary Figure S3E). The two vari- mean behavior (examples of four random simulations at
ants of the model reflect different biological hypotheses. The 16C in Supplementary Figure S5). To quantify the variabil-
UF variant represents a situation where all factors needed ity in the simulations genome-wide, we used the Shannon
to license and activate an origin are available in virtually entropy, an information-theoretic metric (‘Materials and
unlimited quantities. The LF variant represents a situation Methods’ section) on discretized data from 100 simulations,
where one or more of these factors exists in limited quan- where 0 and 1 correspond to copy number levels less and
Downloaded from https://academic.oup.com/nargab/article/3/1/lqaa112/6122908 by guest on 24 November 2021
tities and binds to origins proportionally to their intrinsic more than the genome mean, respectively. As shown in Sup-
efficiencies (39,61). plementary Figure S6, this analysis indicates that whether
Simulation kinetics for the UF variant at a fork speed of an origin is amplified or not is highly unpredictable at 2C,
3 kb/min are shown in Supplementary Figure S3E. When while at 16C the entropy becomes bimodal, with half of the
unlimited copies of an activation factor (UF variant) are as- origins consistently over- or under-replicated and the other
sumed, the process is fast, as DNA content doubles approx- half showing a highly variable behavior.
imately every 12 min and reaches 16C inNAR Genomics and Bioinformatics, 2021, Vol. 3, No. 1 9
Downloaded from https://academic.oup.com/nargab/article/3/1/lqaa112/6122908 by guest on 24 November 2021
Figure 3. Analysis of in silico data at a single-cell level exposes heterogeneity. (A and B) Model simulations expose heterogeneous patterns of re-replication
at a single-cell level. Individual simulations of the stochastic model lead to markedly different amplification levels. Shown here are number of copies for all
origins (marked in circles) on a random region of Chromosome I, resulting from four random simulations of the model at a total DNA level of 2C (A) and
16C (B). (C) Copy number distribution of one individual origin of Chromosome I (Ori I-272), highlighted in red in (A and B), from the 100 simulations
at 16C. (D) Distributions of copy number levels of weak origins Ori II-132 and Ori II-153. Outliers of the distributions are marked in circles. (E) Mean
amplification profile of Chromosome II from all 100 simulations (blue) versus single-cell amplification profile corresponding to one individual simulation
for which Ori II-132 and Ori II-153 are amplified.
inhibitor (lacI-GFP) onto stably integrated lac operator the lys1+ locus marked by the lacO-lacI system (Figure 4A)
(lacO) arrays allows the visualization of a targeted genomic (54). The lys1+ gene is located between Ori I-272 and Ori I-
region as a fluorescent dot, the intensity of which reflects 273, which present 60 and 39% efficiency, respectively. Copy
the copy number of the lacO-targeted region (62). To in- number levels for Ori I-272 in individual simulations and
duce re-replication in a controllable manner, a fission yeast across the whole population were shown in Figure 3A–C.
cell strain stably expressing the licensing factor Cdc18 un- Re-replication was induced by removing thiamine for 30
der the repressible promoter nmt1 was employed. Absence h at 25◦ C, or not as a control, and the cells were fixed,
of the vitamin B1, thiamine, activates the promoter and stained with the DNA dye Hoechst and imaged in a wide-
leads to Cdc18 overexpression. Different promoter con- field epifluorescence microscope (Figure 4B). Image analy-
structs and different Cdc18 mutants have been described sis revealed an increase in DNA nuclear staining in the re-
which can induce re-replication to varying degrees (from a replicating cells (Figure 4C), as well as an increase in the
2C to 32C DNA content (14,63)). To avoid artifacts due intensity of the lacI-GFP dot (Figure 4D), each of them in-
to cell death and disrupted nuclear morphology under high dicating increased genomic content and increased copies of
levels of re-replication, we have employed a truncated form the lys1+ locus under re-replication, respectively. As shown
of Cdc18 (d55P6-cdc18, (55)) which induces medium-level in Supplementary Figure S7B, in control cells the distribu-
re-replication, as confirmed by flow cytometry analysis in tion of DNA nuclear staining is consistent with the presence
Supplementary Figure S7A. Under these conditions, the of G1, S and G2 phase cells, with G2 cells having approx-
vast majority of the cells (>90%) undergo re-replication, al- imately double the DNA content of G1 cells, while lacI-
beit at medium to low levels (Supplementary Figure S7A GFP foci intensities correlate with the DNA content. On
and data not shown). Additionally, the same strain carries the contrary, re-replicating cells do not present a clear sep-10 NAR Genomics and Bioinformatics, 2021, Vol. 3, No. 1
Downloaded from https://academic.oup.com/nargab/article/3/1/lqaa112/6122908 by guest on 24 November 2021
Figure 4. Quantification of lys1+ region in normal and re-replicating conditions. (A) A region proximal to the lys1+ gene (ChrI: 373492) was labeled by
integration of 128 LacO repeats in fission yeast cells expressing LacI-GFP. (B) Visualization of the GFP labeled region in cells growing under normal
replication and re-replication conditions. Cells were grown for 30 h at 25◦ C in the absence of thiamine to induce overexpression of d55P6-cdc18 and re-
replication (lower panels) or were grown in the presence of thiamine as a control (upper panels). GFP (green) and DNA stained by Hoechst (blue) were
visualized by epifluorescence microscopy. Scale bar: 5 m. (C–E) Distributions (probability density plots) of total nuclear Hoechst intensity (C), GFP
intensity at the lacO locus (D) and GFP focus intensity normalized to the total nuclear Hoechst intensity in each cell (E) is shown in cells undergoing
normal replication (n = 1632, blue) or re-replication (n = 1234, orange), as in B. A representative experiment out of three biological replicates is shown.
aration of populations and varying levels of re-replication mined experimentally (31). Figure 5A shows histograms of
are observed in different cells, consistent with flow cytom- the copy number distributions from simulations of the LF
etry data (Supplementary Figure S7A). Foci intensities ap- model at 0.5 kb/min at 16C of two origins (Ori II-45 and
pear to vary independently of the DNA content. To esti- Ori II-54), with high and low efficiencies (62 and 9%, re-
mate the relative copy number of the lys1+ region with re- spectively (31)). The median number of copies of each ori-
spect to the DNA content at the single cell level, the inten- gin is consistent with its efficiency (notice again the posi-
sity of each GFP dot was normalized with the total DNA tively skewed distribution with long tails discussed above).
nuclear intensity in each individual cell (Figure 4E). We ob- The scatterplot of Figure 5B shows a strong correlation
serve that under re-replication the distribution of the nor- between mean number of fires at 16C and efficiency for
malized GFP intensity is positively skewed with a long tail all origins (Spearman correlation coefficient −ρ = 0.96).
and an increased coefficient of variation compared to the The coefficient of variation (ratio of standard deviation
normal replicating sample (41.18% for normal and 57.54% over the mean) is inversely correlated to the efficiency (ρ
for re-replication), in agreement with the simulated data at = −0.89), with weak origins showing much higher varia-
this region (Figure 3C). We conclude that cell-to-cell het- tion than strong ones. Mean number of copies of each origin
erogeneity in the number of copies of the lys1+ genomic lo- show a weaker correlation to firing efficiency (Figure 5C, ρ
cus is evident in fission yeast cells undergoing re-replication, = 0.4) and a coefficient of variation weakly linked with effi-
consistent with in silico analysis. ciency (ρ = 0.12). Interestingly, a higher spread at low effi-
ciencies is observed, with origins considered dormant (ef-
ficienciesNAR Genomics and Bioinformatics, 2021, Vol. 3, No. 1 11
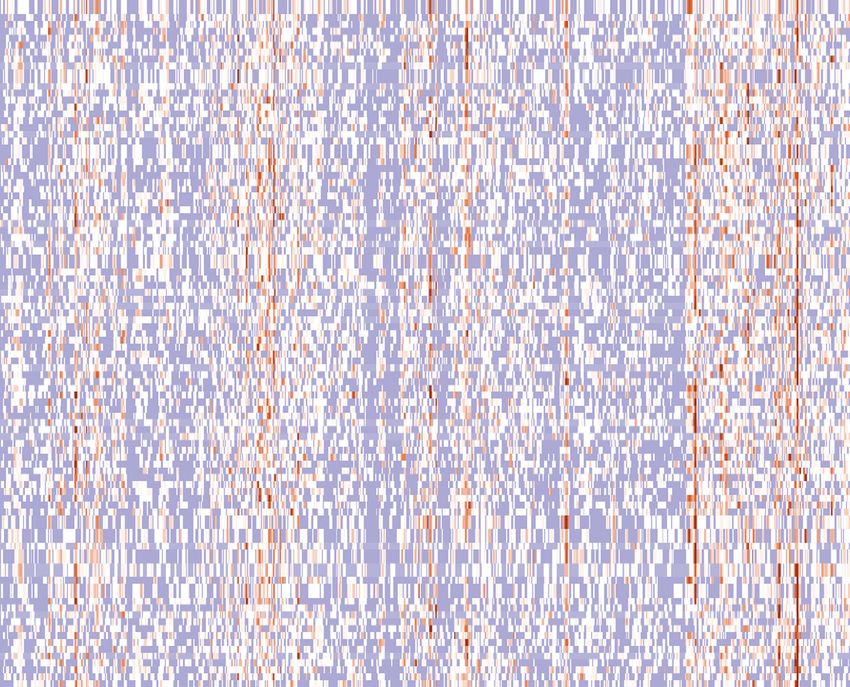
Downloaded from https://academic.oup.com/nargab/article/3/1/lqaa112/6122908 by guest on 24 November 2021
Figure 5. Analysis of in silico data at a single-cell level linked with intrinsic properties and points to in cis effects. Simulation results from 100 Monte Carlo
simulations of the LF model at 0.5 kb/min at 16C. (A–D) Amplification levels of individual loci with respect to their intrinsic properties. (A) Distributions
of copy number levels for two origins of high (purple) and low (yellow) efficiency (origin indices, efficiencies and median number of copies given in the
legend). (B) Scatterplot of mean number of fires versus firing efficiency for all origins shows a strong correlation between firing events and firing efficiency
(Spearman correlation coefficient value −ρ = 0.96). Color indicates coefficient of variation (standard deviation/mean), and points to higher variability in
firing for the weak origins. (C) Scatterplot of number of copies of individual origins versus their firing efficiencies shows a weaker correlation (ρ = 0.4)
and variation less dependent of efficiency. (D) Scatterplot of mean number of passive replications versus firing efficiency shows a very low correlation (ρ
= 0.17). (E–G) Amplification levels of individual loci with respect to local effects. (E) Distribution of copy number levels of weak origin I-287, residing
next to strong origin I-288, shows elevated levels due to passive replication. (F) Heatmap of correlations of copy number levels between different origins
exposes strong in cis effects, as shown here for a zoomed in region in the end of Chromosome III. Color indicates Spearman correlation coefficients. G
Correlation coefficients between copy number levels of the 10 origins with the highest intensity (different lines) and their neighboring origins, centered and
zoomed in the origin locations. Different color indicates varying values of the fork speed. (H–J) Firing activity of individual origins with respect to local
effects. (H) Distributions of firing events for two origins of low efficiency, with efficient (purple) and inefficient (yellow) neighbors, shows that weak origins
fire more often when residing next to strong ones. (I) Same as in (F) but showing correlations between number of fires across the genome. (J) Same as in
(G) but showing correlations between number of fires of prominent origins and their neighbors.
fected by its efficiency, while additional properties govern number levels of all origins in the genome (whole genome in
levels of amplification of individual loci, which are espe- Supplementary Figure S8 A and B, zoom in Chromosome
cially prominent for low-efficiency origins. III––end in Figure 5F). This analysis indicated strong cor-
relations between adjacent origins, pointing to in cis effects.
In cis effects. Next, we investigated origins whose amplifi- To better understand the extent of this effect, we computed
cation levels could not be explained merely by their intrin- correlations between copy number levels of the 10 peaks
sic efficiency. A relevant example is given in Figure 5E; from with the highest amplification and their neighborhood (Fig-
the distribution it is clear that, although Ori I-287 has a very ure 5G). Since our previous analysis showed that fork speed
low efficiency, its amplification levels are much higher than affects the extent of passive re-replication, we also com-
expected. A closer examination of the neighboring origins puted correlations using the simulations with a fork speed of
reveals that its left-flanking origin (Ori I-288, at a genomic 1 kb/min and 3 kb/min. The results reveal that copy num-
distance of 17424 bp) is one of the most efficient in the bers of each central amplification origin are significantly
genome, with a firing efficiency of 73%; their copy number positively correlated with the ones of its right and left flank-
levels are strongly correlated (ρ = 0.98). To further investi- ing up to a distance of 0.1 megabases; it is also clear that as
gate this, we computed correlation coefficients across copy speed increases, the extent of positive correlation increases12 NAR Genomics and Bioinformatics, 2021, Vol. 3, No. 1
as well and for fork speed equal to 3 kb/min it reaches a value = 0.0025) and characterize the three clusters. Though
distance of 0.5 megabases. re-replication at OriIII-118 may be overestimated in simu-
We then asked how the firing activity of individual origins lations in comparison to experimental re-replication data
is affected by the activity of its neighbors. We focused our (Figure 2), our analysis indicates that highly efficient ori-
analysis on Ori I-287 and Ori I-40, two origins that share the gins can interfere with each other during re-replication even
same low efficiency (9%), but Ori I-287 has an immediate when far apart. Taken together, these findings indicate in
neighbor with high efficiency (73%) whereas Ori I-40 does trans effects within the genome.
not. We observed that Ori I-40 does not fire the majority We next examined the same simulations at a DNA con-
of times, whereas Ori I-287 appears more active and occa- tent of 2C (Figure 6D, same ordering as in Figure 6B). We
sionally fires even more than five times (Figure 5H). We then observe that while specific amplification regions are start-
followed the same methodology as above and computed the ing to emerge, the re-replication levels for the majority of
correlation coefficient between the number of fires of dif- the genome are around the genome mean, amplification oc-
Downloaded from https://academic.oup.com/nargab/article/3/1/lqaa112/6122908 by guest on 24 November 2021
ferent origins across the genome (Figure 5I). This analysis curs in random regions along the genome and the process
indicated that indeed local effects exist, suggesting that the is governed by a high degree of variability. At the same time
more times an origin fires, the more will its neighbors fire as the difference between single-cell profiles of the previously
well. We notice that the firing events of each central amplifi- identified clusters is not noticeable. To validate this, we went
cation origin are significantly positively correlated with the on to independently cluster the data and estimated an op-
ones of its immediate right and left flanking neighbors, how- timal k of only 1 cluster. Forcing k equal to 3 and estimat-
ever, this time the correlation spans a smaller region, drops ing the stability across 100 random initializations indicated
sharply with distance from the central origin and does not close to random cluster assignment between different runs
appear affected by fork speed (Figure 5J). These findings (ARI = 0.36 ± 0.15). Comparing the clusters found for 2C
indicate that, in addition to passive re-replication, in cis ef- and 16C also indicated very low agreement (ARI = 0.34
fects between adjacent origin locations are also implicitly ± 0.10). Last, the correlation coefficient between Ori III-11
attributed to increased total firing activity of weak origins and Ori III-118 for 2C is now non-significant (ρ = −0.09,
located close to strong origins. Early firing of a strong origin P-value = 0.36).
will increase the newly born copies of a nearby weak origin, We conclude that re-replication is initially characterized
facilitating its re-firing. by a high degree of randomness, while in trans effects be-
come evident as the re-replication process progresses, lead-
In trans effects. To explore the variability of the re- ing to preferred genome-wide patterns of re-replication at
replication process genome-wide, we performed a principal high DNA content. These are dominated by a small number
component analysis of the genome-wide amplification pro- of high activity origins, whose amplification to high levels is
files of 100 simulations at 16C and visualized the results as mutually exclusive.
a biplot of the first two principal components (Figure 6A),
where dots correspond to simulations and vectors indicate DISCUSSION
the PCA loadings, i.e. the correlation of each origin to the
A stochastic hybrid model of DNA re-replication
unit-scaled first two principal components. From this it be-
comes clear that a large amount of the variability in the sim- In this work a stochastic hybrid model of DNA re-
ulations is dominated by two different origins of Chromo- replication was presented, developed by refining existing
some III (Ori III-11 and Ori III-118). Specifically, the first work of normal DNA replication so that it allows for ori-
and second principal component correlate strongly with Ori gin re-firing. The model accurately portrays the interplay
III-118 and Ori III-11, respectively, while Ori III-11 addi- between discrete dynamics, associated with different origin
tionally appears to correlate negatively with principal com- states, continuous dynamics, associated with the movement
ponent 1. of the replication forks, and stochasticity, associated with
To further explore how specific origins may affect random firing and re-firing events. Transitions between dis-
genome-wide amplification profiles, we clustered profiles crete states depend on both the continuous and stochas-
using k-means clustering, estimated the optimal k using the tic dynamics of the system, such as firing events or merg-
Gap statistic (52) and the stability of the clustering using ing of neighboring forks. In addition, two automatic transi-
the Adjusted Rand Index (ARI) (53) (details in ‘Materials tions, specific to the re-replication case, are incorporated in
and Methods’ section). For 100 simulations at 16C an op- the model; when an origin fires or is passively replicated its
timal number of k = 3 clusters was identified, and the clus- descendants automatically fall into the pre-replicative state
ter assignments were very consistent across 100 random ini- and can potentially fire or be passively replicated again.
tializations, with a mean ARI of 0.95 (standard deviation Using input data from experimentally determined origin
= 0.05). These clusters correspond to 3 groups of simula- locations and intrinsic firing efficiencies from fission yeast,
tions characterized by different patterns of re-replication at the model allows the simulation of re-replication along the
a genome level (Figure 6B). The clusters appear to be domi- complete fission yeast genome and thus the exploration of
nated by the amplification of origins Ori III-11 and Ori III- re-replication kinetics genome-wide. Two alternative varia-
118 in a mutually exclusive manner: either one of the two tions of the model have been implemented, depending on
origins is amplified (clusters 1 and 3) or they are both rel- how the firing propensities of the newly born origins are as-
atively low (cluster 2). Indeed, as shown in Figure 6C, lev- signed. In the base-case model variation (LF model), the
els of amplification of Ori III-11 and Ori III-118 are neg- total system propensity is kept constant and continuously
atively correlated in individual simulations (ρ = −0.3, P- redistributed to all existing and newly born origins. TheNAR Genomics and Bioinformatics, 2021, Vol. 3, No. 1 13
Downloaded from https://academic.oup.com/nargab/article/3/1/lqaa112/6122908 by guest on 24 November 2021
Figure 6. Analysis of in silico data at a whole genome level points to in trans effects within the genome. (A) Variability of copy number levels genome-wide
is governed by prominent origins. Results of a PCA analysis of the in silico copy number data, shown as a biplot of the first two principal components.
Dots correspond to simulations and black vectors expose each origin’s contribution to the first two components, both in terms of magnitude and direction
(marked here for the two most prominent ones). (B) Heatmap of DNA content (rows: simulations, columns: origins) for 100 simulations at 16C after
clustering with a k-means algorithm and k = 3. Color indicates DNA amplification levels, expressed as the log ratio of individual versus genome mean
number of copies. Identified clusters are marked with different colors. (C) Scatterplot of number of copies for origins Ori III-11 and Ori III-118 shows a
negative correlation (ρ = −0.4). Colors correspond to simulations belonging to each of the three clusters identified in B. (D) Evolution of re-replication over
time. Heatmap of DNA content for simulations of (B) at an earlier DNA content of 2C shows no cluster-specific patterns at a low-re-replication context.
(E) Underlying characteristics of DNA re-replication. In cis effects between adjacent loci. Passive re-replication of inactive origins from their efficient
neighbors leads to increased copy numbers and implicitly increases their firing activity. (F) In trans effects between distant loci. Increased amplification
of one locus leads to in trans suppression of a distant locus. (G) Emerging properties of DNA re-replication, depending on the level of analysis. (H) In
silico re-replication profiles. Simulation results reveal many possible genotypes within a population, shown here in a schematic view for three hypothetical
origins. Although the total DNA content is the same in all four single cells, individual copy number levels vary greatly.You can also read