Sensitivity of hydrologic and geologic parameters on recharge processes in a highly heterogeneous, semi-confined aquifer system
←
→
Page content transcription
If your browser does not render page correctly, please read the page content below
Hydrol. Earth Syst. Sci., 24, 2437–2456, 2020
https://doi.org/10.5194/hess-24-2437-2020
© Author(s) 2020. This work is distributed under
the Creative Commons Attribution 4.0 License.

Sensitivity of hydrologic and geologic parameters on recharge
processes in a highly heterogeneous, semi-confined aquifer system
Stephen R. Maples1 , Laura Foglia2 , Graham E. Fogg2 , and Reed M. Maxwell3
1 Hydrologic  Sciences Graduate Group, University of California, Davis, One Shields Ave., Davis, CA 95616, USA
2 Department  of Land, Air, and Water Resources, University of California, Davis, One Shields Ave., Davis, CA 95616, USA
3 Department of Geology and Geological Engineering, Colorado School of Mines,

1500 Illinois St., Golden, CO 80401, USA

Correspondence: Stephen R. Maples (srmap@ucdavis.edu)

Received: 6 August 2019 – Discussion started: 27 August 2019
Revised: 26 January 2020 – Accepted: 2 April 2020 – Published: 13 May 2020

Abstract. An increasing reliance on groundwater resources          demonstrate that large variability of MAR feasibility is typ-
has been observed worldwide during the past 50–70 years            ical for alluvial aquifer systems and that outsized recharge
and has led to unsustainable groundwater abstraction in many       rates are possible in select locations where interconnected,
regions, especially in semi-arid and arid alluvial groundwa-       coarse-texture hydrofacies occur.
ter basins. Managed aquifer recharge (MAR) has been pro-
moted to replenish overdrafted groundwater basins and aug-
ment surface water supply. However, MAR feasibility in al-
luvial groundwater basins is complicated by complex geo-           1   Introduction
logic architecture that typically includes laterally continuous,
fine-texture confining units that can impede both recharge         Geologic heterogeneity strongly affects both the movement
rates and regional propagation of increases in the hydraulic       of water in the subsurface and the exchange of water between
head. A greater feasibility of MAR hinges on identifying           subsurface and surface stores; however, rarely are enough
locations where rapid, high-volume recharge that provides          data available to explicitly represent heterogeneous geologic
regional increases in pressure head are possible, but rela-        features in groundwater models (Koltermann and Gorelick,
tively little research has evaluated the factors that control      1996; De Marsily et al., 2005). Instead, models typically sim-
MAR feasibility in alluvial groundwater basins. Here, we           plify and/or upscale heterogeneity to represent subsurface
combine a transition probability Markov chain geostatisti-         flows for purposes of regional-scale water resources man-
cal model of the subsurface geologic heterogeneity of the          agement (e.g., Fogg, 1986; Phillips and Belitz, 1991). Up-
eastern side of the northern Central Valley, California, with      scaling methods have been the focus of numerous studies
the three-dimensional, variably saturated water flow code          (e.g., Renard and De Marsily, 1997; Fogg et al., 2000; Neu-
ParFlow to explore the variability of MAR feasibility in this      man and Di Federico, 2003; Fleckenstein and Fogg, 2008),
region. We use a combination of computationally efficient          and coarse-resolution models with upscaled (i.e., effective)
local- and global-sensitivity analyses to evaluate the rela-       hydrologic properties are often adequate for regional-scale
tive importance of factors that contribute to MAR feasibil-        flow studies but typically lack enough detail to reliably cap-
ity. A novel proxy parameter approach was used to describe         ture some phenomena, like recharge and transport processes,
the configuration and proportions of subsurface hydrofacies        that are strongly influenced by geologic heterogeneity.
and the water table depth for sensitivity analyses, and results       To represent the influence of geologic heterogeneity on
suggest that recharge potential is relatively more sensitive       flow and transport phenomena, many approaches have relied
to the variability of this proxy parameter than to the vari-       on stochastic methods, like transition-probability-based in-
ability of individual hydrofacies hydraulic properties. Results    dicator geostatistics which can represent heterogeneous fea-
                                                                   tures while honoring measured data (Carle and Fogg, 1996;

Published by Copernicus Publications on behalf of the European Geosciences Union.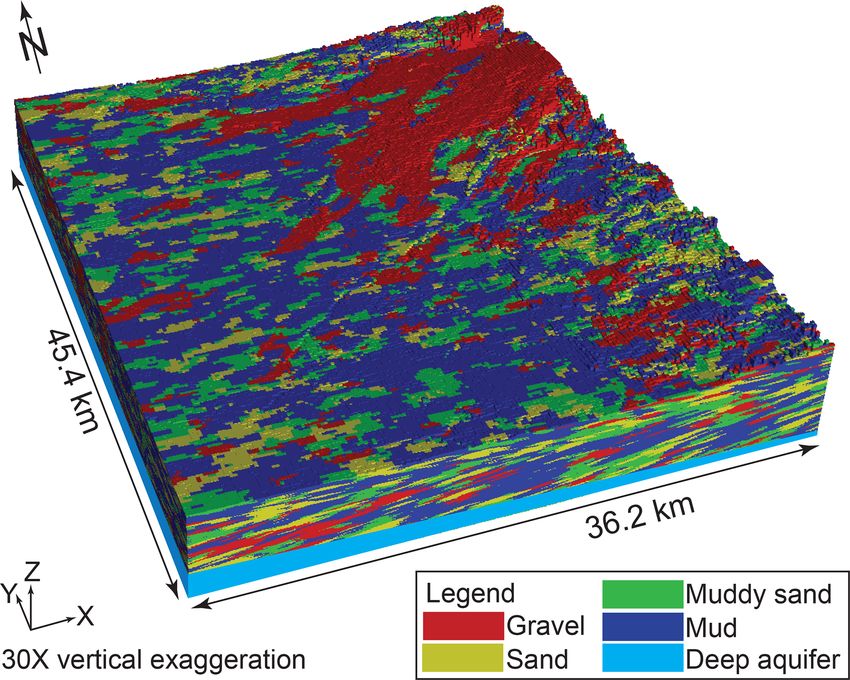
2438                          S. R. Maples et al.: Sensitivity of hydrologic and geologic parameters on recharge processes

Weissmann and Fogg, 1999; Weissmann et al., 1999). These          mingled with silt- and clay-dominated sediments. We use a
approaches represent geologic heterogeneity with hydroge-         combination of local- and global-sensitivity analyses to pro-
ologic facies categories, each of which is assigned effec-        vide insight into the relative importance of the subsurface
tive values or probability densities for estimates of hydraulic   geologic facies configuration and parameterization of sub-
properties. By categorizing facies according to depositional      surface hydraulic properties on MAR processes. This work
environment rather than texture alone, the predictable ge-        provides insight into important factors to consider when in-
ometries (i.e., facies mean lengths, proportions, and juxta-      vestigating potential MAR sites and also highlights the utility
positions) of these features can be more accurately repre-        of a combination of computationally frugal local- and global-
sented with sparse data. Studies that rely on these meth-         sensitivity analyses for computationally intensive hydrologic
ods show the strong influence of subsurface heterogene-           models.
ity on groundwater–surface-water interactions and recharge
processes (Lee, 2004; Fleckenstein et al., 2006; Engdahl
et al., 2010; Liu, 2014), including managed aquifer recharge      2     Materials and methods
(MAR; Maples et al., 2019), especially for instances when
the mean lengths and proportions of high-permeability facies      2.1    Local hydrogeology and domain extent
allow for percolation, i.e., formation of connected networks
(Fogg et al., 2000; Harter, 2005).                                The model domain covers about 1640 m2 of the eastern side
   Accurately assigning aquifer properties in models can          of the northern Central Valley, California, near the conver-
be a challenge because they are scale-dependent attributes        gence of the lower portions of the American and Cosumnes
that are challenging to measure and can vary over many            rivers with the Sacramento River (Fig. 1). The domain com-
orders of magnitude in typical aquifer systems (e.g., Su-         prises a low-angle alluvial fan complex that is typical of the
dicky, 1986; Gelhar et al., 1992; Weissmann and Fogg,             Central Valley, where previous studies have documented the
1999). While aquifer tests can accurately constrain esti-         presence of deposits that are favorable for recharge (Shle-
mates of hydraulic conductivity (K) for high-permeability         mon, 1967; Meirovitz, 2010), including massive, intercon-
facies, they are typically unreliable for estimating K of low-    nected, highly permeable sand and gravel deposits known
permeability (i.e., aquitard) facies (Fogg, 1986; Fogg et al.,    as incised valley fill (IVF; Weissmann et al., 2004, 2005)
1998), which have been shown to influence pumping re-             that form from river incision and deposition events dur-
sponse (Fogg et al., 2000) and be important for accommo-          ing cyclic Pliocene–Pleistocene Sierra Nevada glaciation.
dating recharge (Maples et al., 2019). Reconciling typically      In places, multiple IVF deposits have been shown to over-
sparse measurements of aquifer properties from aquifer tests      lap and interconnect from the land surface into the deeper
with the representation of effective values in models is of-      aquifer system, forming massive, coarse-texture, relatively
ten the source of large uncertainty because parameterization      high-permeability pathways for recharge that bypass local,
of the properties in models is scale dependent (Sudicky and       otherwise laterally extensive confining units. These features
Huyakorn, 1991) and is typically achieved through model           have been shown to accommodate recharge volumes that are
calibration.                                                      orders of magnitude greater than would be possible over the
   The contaminant transport community has long recog-            rest of the landscape (Maples et al., 2019). Other studies have
nized the strong influence of K scaling and geologic hetero-      shown that IVF features likely occur on river fans through-
geneity on transport processes (e.g., Gelhar et al., 1992; Su-    out the Central Valley (Weissmann et al., 2005) and in simi-
dicky and Huyakorn, 1991; Koltermann and Gorelick, 1996),         lar glacially influenced rivers (Pierce and Scott, 1983) but are
and recent work has extended these concepts to assess their       still largely undocumented.
role on runoff generation, evapotranspiration (ET), and feed-        The local hydrostratigraphy of the area is described in de-
backs between subsurface and land-surface water in inte-          tail by Meirovitz (2010) and Maples et al. (2019). In gen-
grated hydrologic models (Srivastava et al., 2014; Gilbert        eral, the two major rivers intersecting the domain, the Amer-
et al., 2016; Foster and Maxwell, 2019), but relatively lit-      ican and Cosumnes rivers, have markedly different depo-
tle research has focused on the influence of these factors for    sitional characteristics. The American River drains a large
MAR processes specifically. Recent work has highlighted           (> 4000 km2 ), high-elevation catchment that extends to the
the importance of connected networks of high-K facies for         Sierra Nevada crest (> 3000 m a.m.s.l. – above mean sea
MAR (Maples et al., 2019), but to our knowledge the sen-          level). As a result, the American River was greatly influenced
sitivity of MAR processes to these heterogeneous geologic         by cyclic Pliocene–Pleistocene glaciation that deposited IVF
features as compared to other uncertain hydraulic properties      in the domain area. Conversely, the Cosumnes River catch-
has not been formally evaluated. Here, we simulate variably       ment is smaller (900 km2 ) and lower in elevation. As a re-
saturated MAR dynamics in a highly resolved representa-           sult, deposits from the Cosumnes River do not contain IVF
tion of complex subsurface geologic heterogeneity of a clas-      and are typically finer in texture. In some locations in the do-
tic, unconsolidated sedimentary aquifer system that includes      main area, Quaternary and Holocene channel avulsion of the
both interconnected, high-K sand and gravel deposits inter-       American River resulted in a more southwestern course that

Hydrol. Earth Syst. Sci., 24, 2437–2456, 2020                                   www.hydrol-earth-syst-sci.net/24/2437/2020/
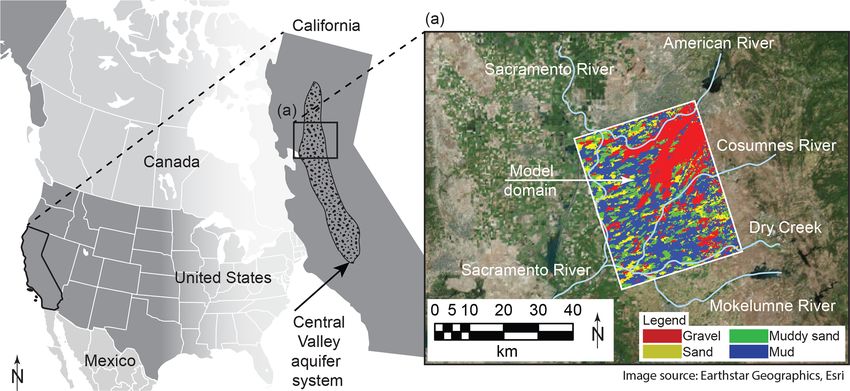
S. R. Maples et al.: Sensitivity of hydrologic and geologic parameters on recharge processes                                             2439

Figure 1. Location of the model domain in the Central Valley aquifer system in California and (a) inset of the uppermost layer of the model
hydrofacies overlain over aerial imagery of the Central Valley and local river systems (Maples et al., 2019). Imagery is derived from Earthstar
Geographics, copyright © Esri. All rights reserved (https://www.esri.com/en-us/home, last access: 8 April 2020).

intersects the current path of the Cosumnes River, creating
complex overlapping stratigraphy in that area. Cross-cutting
IVF and overlapping paleochannel networks in the domain
area result in an aquifer system that is typically unconfined
(and sometimes perched) or semi-confined at shallow depths
and increasingly confined with depth (Fleckenstein et al.,
2006; Liu, 2014; Niswonger and Fogg, 2008). Groundwater
pumping in the region typically occurs at depths > 30 m in
the deeper semi-confined or confined portion of the aquifer
system (Liu, 2014).

2.2   Hydrofacies model development

Transition probability Markov chain geostatistics (TPROGS;
Carle and Fogg, 1996, 1997; Carle, 1999) was used to sim-
ulate the subsurface distribution of hydrofacies in the do-
main area (Fig. 2). Model development is described in de-
tail by Meirovitz (2010) and Maples et al. (2019). Condition-             Figure 2. Three-dimensional representation of the model domain
ing data for the TPROGS model included about 1200 well                    (Meirovitz, 2010; Liu, 2014).
logs, soil surveys, geologic cross sections, and mapped pale-
ochannels. Geologic data were binned into four textural cate-
gories: gravel, sand, muddy sand, and mud (undifferentiated                  The model uses an orthogonal grid geometry with
silt and/or clay; Table 1; Fleckenstein et al., 2004; Meirovitz,          181 cells × 227 cells × 265 cells in the x, y, and z direc-
2010). “Mud” refers to undifferentiated silt and clay because             tions, respectively. The x and y directions of the grid
most of the subsurface data available only identify the fine-             were rotated 17.85◦ counterclockwise from the cardinal di-
grained sediments and are not sufficiently detailed to distin-            rections, and the z direction was oriented vertically. Cell
guish silt from clay. From these data the proportions for each            sizes were 200 m × 200 m × 1 m. The total domain size is
facies were calculated directly. Additional parameters were               36.2 km × 45.4 km × 0.265 km in the x, y, and z directions,
estimated describing the mean lengths of each hydrofacies                 respectively. Cells located above the land surface were desig-
along the principal directions and the embedded transition                nated as inactive in the model, resulting in about 7.3 million
probabilities to represent cross-correlation between different            active cells in the domain area.
facies. Because the depositional characteristics of the Amer-
ican and Cosumnes fans were markedly different, individual
models of each were produced and subsequently combined
by Meirovitz (2010).

www.hydrol-earth-syst-sci.net/24/2437/2020/                                             Hydrol. Earth Syst. Sci., 24, 2437–2456, 2020
2440                             S. R. Maples et al.: Sensitivity of hydrologic and geologic parameters on recharge processes

Table 1. Textural classification of hydrofacies designations (Fleckenstein et al., 2004).

                            Hydrofacies      Geologic interpretation    Texture
                            Gravel           Channel deposits           Gravel and coarse sand
                            Sand             Near channel or levee      Sand (fine to coarse)
                            Muddy sand       Proximal floodplain        Silty and clayey sand, sandy clay, and silt
                            Mud              Floodplain                 Clay, silty clay, and shale

2.3     Hydrologic model development                                         Model spinup and recharge simulations used combinations
                                                                          of specified-flux and specified-head upper boundary condi-
2.3.1    Governing equations                                              tions. An initial potentiometric surface was specified using
                                                                          interpolated groundwater level data. Monthly estimated ur-
Three-dimensional, variably saturated water flow was sim-                 ban and agricultural groundwater pumping rates were ap-
ulated with the hydrologic modeling code ParFlow (Ashby                   plied as specified fluxes representing wells screened in lower
and Falgout, 1996; Jones and Woodward, 2001; Kollet                       portions of the domain that coincide with typical screened
and Maxwell, 2006), which couples surface and subsurface                  intervals of municipal and agricultural pumping wells in the
flow with the two-dimensional diffusive- or kinematic-wave                region. Dominant sources of recharge for the region include
equation and solves the three-dimensional mixed form of                   stream recharge from the American River, Cosumnes River,
Richards’ equation for variably saturated subsurface flow:                and Deer Creek, as well as deep percolation from agricultural
            ∂h    ∂Sw (h)                                                 and urban return flows. Weekly estimates of the spatially dis-
Ss Sw (h)      +φ         = ∇ · q + qr (x, z),                   (1)
            ∂t      ∂t                                                    tributed river stage for the streams were applied as specified
where                                                                     heads along coincident land-surface cells. Monthly estimates
                                                                          of urban and agricultural recharge volumes were applied as
q = φSw (h)v = −K s (x)kr (h)∇(h + z).                           (2)      a specified-flux boundary condition across the top of the do-
In these equations Ss is specific storage (L−1 ), Sw is relative          main to simulate deep percolation of agricultural and urban
saturation (–), h is the pressure head (L), t is time (T), φ is           return flows and to equilibrate soil moisture conditions in the
porosity (–), q is the Darcy flux (L T−1 ), qr is a source or             near-surface unsaturated-zone (UZ) cells.
sink term (T−1 ), z is elevation (L), v is the subsurface flow
velocity (L T−1 ), K s (x) is the saturated hydraulic conduc-             2.3.3    Model spinup and calibration
tivity tensor (L T−1 ), and kr is relative permeability (–). The
van Genuchten relations (Van Genuchten, 1980) describe Sw                 The model spinup and calibration are described in greater
and kr as a function of h in the unsaturated zone, with pa-               detail in Liu (2014) and Maples et al. (2019). To summa-
rameters for air entry pressure α (L−1 ), pore size distribu-             rize, a 16-year simulation period was used to bring the sim-
tion n (–), and residual saturation Sres (–).                             ulated hydrology into dynamic equilibrium. Water budget
                                                                          components, including groundwater discharge, recharge, and
2.3.2    Boundary conditions                                              boundary flows along with facies hydraulic properties were
                                                                          estimated and adjusted manually to simulate a realistic wa-
Model boundary conditions are discussed in greater detail in              ter budget, water table configuration, and vertical hydraulic
Liu (2014) and Maples et al. (2019). The locations of do-                 gradients during the calibration process. Hydraulic proper-
main boundaries were chosen to simplify the assignment of                 ties for each facies category were calibrated manually (Ta-
boundary conditions for the flow model. The eastern bound-                ble 2) and are consistent with the range of literature values
ary roughly coincides with the Sierra Nevada foothills, and               for the Central Valley, California, and for similar alluvial sys-
the northern, southern, and western boundaries roughly coin-              tems (Anderson et al., 2015; Botros et al., 2009; Fleckenstein
cide with local surface water bodies (Fig. 1). A specified head           et al., 2004; Frei et al., 2009; Maserjian, 1993; Niswonger
boundary condition was applied for the eastern boundary to                and Fogg, 2008; Sager, 2012).
coincide with the local groundwater head distribution esti-                  All simulations were performed using the Cheyenne high-
mated from local monitoring well data (Liu, 2014). A gen-                 performance cluster at the National Center for Atmospheric
eral head boundary of 0 m a.m.s.l. was set 1 km beyond the                Research (NCAR) Computational and Information Systems
western boundary to approximate the Sacramento River and                  Laboratory (https://doi.org/10.5065/D6RX99HX). The nu-
Sacramento–San Joaquin Delta along the northwestern and                   merical problem was distributed on 540 cores for each simu-
southwestern portions of the western boundary, respectively.              lation. Approximately 450 model evaluations were required
No-flow boundary conditions were applied along the north-                 for the exploratory simulations, local-sensitivity analyses,
ern, southern, and bottom boundaries because the regional                 and global-sensitivity analyses described in subsequent sec-
groundwater flow direction is generally from east to west.                tions, which required approximately 400 000 core hours of

Hydrol. Earth Syst. Sci., 24, 2437–2456, 2020                                               www.hydrol-earth-syst-sci.net/24/2437/2020/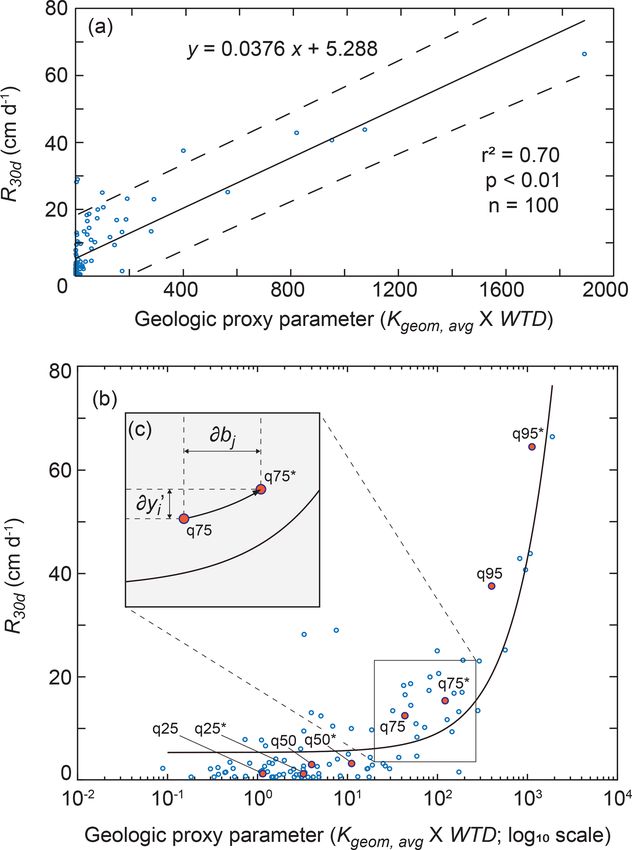
S. R. Maples et al.: Sensitivity of hydrologic and geologic parameters on recharge processes 2441
Table 2. Calibrated hydrofacies hydraulic properties (Liu, 2014).
Facies Ks Ss φ α n Sres
designation (m d−1 ) (m−1 ) (unitless) (unitless) (unitless) (unitless)
Gravel 67.5 4.00 × 10⁻⁵ 0.35 3.55 3.16 0.1
Sand 41.2 8.00 × 10⁻⁵ 0.35 3.55 3.16 0.1
Muddy sand 0.2 1.00 × 10⁻⁴ 0.40 2.69 2.00 0.1
Mud 0.0017 1.00 × 10⁻³ 0.45 1.62 2.00 0.2
Deep aquifer 45.0 4.80 × 10⁻⁴ 0.35 3.55 3.16 0.1
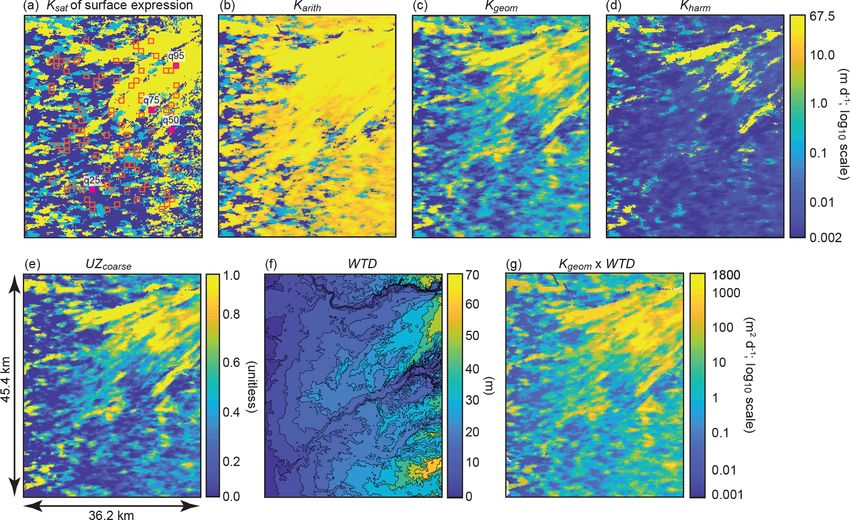
Figure 3. Plan view of the model domain, where the first row shows (a) Ksat of the uppermost model layer (i.e., the surface expression)
overlaid with the locations of 100 randomly sampled 1 km2 exploratory recharge sites (red squares) randomly chosen from 910 potential
locations as well as the four sites chosen for sensitivity analyses (q95, q75, q50, and q25; solid violet squares), along with the (b) arithmetic,
(c) geometric, and (d) harmonic mean of vertical Ksat for unsaturated-zone (UZ) facies (i.e., Karith , Kgeom , and Kharm , respectively). The
second row shows (e) the coarse-texture (gravel and sand) fraction of UZ facies (UZcoarse ), (f) the simulated initial depth to water (WTD),
and (g) Kgeom multiplied by WTD (Kgeom × WTD). Locations > 5 km from the lateral domain boundaries were excluded from the potential
sites to avoid interference with boundary conditions.
computing time in total. The large computational expense 2.4 Exploratory simulations
for each simulation (890 core hours per simulation, on av-
erage) required that computationally resources be allocated 2.4.1 Site selection
efficiently.
A total of 100 1 km2 recharge sites, each encompassing
25 upper-boundary cells, were chosen to approximate hy-
pothetical MAR infiltration basins (Fig. 3a). Each site was
randomly selected from a 910 km2 region within the domain
that excluded locations within 5 km of lateral domain bound-
www.hydrol-earth-syst-sci.net/24/2437/2020/ Hydrol. Earth Syst. Sci., 24, 2437–2456, 2020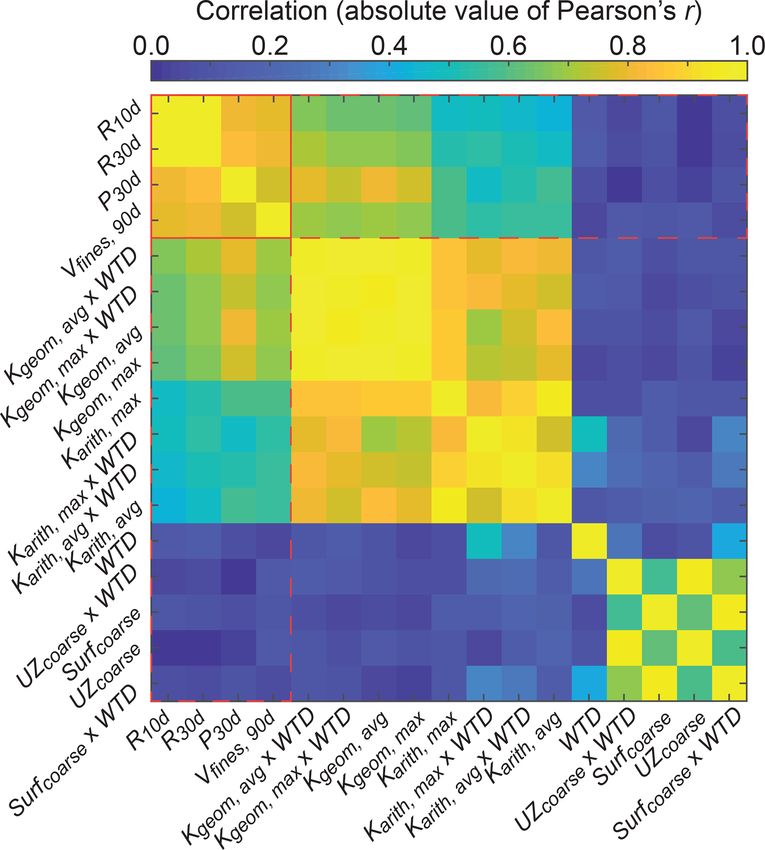
2442                            S. R. Maples et al.: Sensitivity of hydrologic and geologic parameters on recharge processes

aries to minimize the influence of boundary conditions. The            erage and maximum value of Karith , Kgeom , and Kharm for
100 exploratory sites encompass roughly 6 % of the total do-           the 25 x, y cell locations encompassing each site. In addi-
main area, which was deemed sufficient to sample the vari-             tion, the proportion of coarse-texture facies at the land sur-
ability of site characteristics observed across the domain.            face (Surfcoarse ) were calculated for each site. Site character-
The size of each site was chosen to reflect a regional-scale           istics are described in detail in Table 3. Each site was further
MAR site, which can range from large networks of basins                evaluated according to whether there was vertical connectiv-
> 25 km2 in size (e.g., Kern Water Bank Authority, 2018) to            ity (i.e., percolation) of coarse-texture facies from the land
individual infiltration basins over several hectares or smaller        surface to the aquifer system. Percolation was evaluated for
(e.g., Beganskas and Fisher, 2017) in California.                      a control volume encompassing all cells from the land sur-
                                                                       face to the initial water table depth (i.e., unsaturated-zone
2.4.2   Site characteristics                                           cells) at the 25 x, y cell locations encompassing each site.
                                                                       Percolation was defined within each site control volume by a
Maples et al. (2019) highlighted that the (1) relative propor-         six-connectivity metric (Pardo-Iguzquiza and Dowd, 2003),
tions and degree of vertical interconnection of coarse-texture         in which neighboring gravel and sand cells are said to be con-
facies (sand and gravel) and (2) unsaturated-zone thickness            nected if they intersect along a face. Coarse-texture facies
beneath recharge sites are important factors for recharge fea-         were said to percolate if any combination of gravel and sand
sibility. In this study, we sought to develop site character-          facies were interconnected within the control volume from
istics to describe recharge feasibility at the 100 exploratory         the land surface to the initial water table.
sites across the domain. First, we use a heuristic approach
of simple averages to bound the expected range of effective            2.4.3   Recharge scenarios and model postprocessing
(i.e., upscaled) vertical Ks values at all 41 087 x, y cell loca-
tions across the domain, where the arithmetic and harmonic             To evaluate the system response to recharge stress and re-
means (Karith and Kharm ) are the upper and lower bounds,              covery, 90 d recharge scenarios were run individually at each
respectively, and the geometric mean (Kgeom ) is an interme-           site, wherein recharge was simulated during the initial 30 d
diate value. Karith and Kharm are typically used to approxi-           period followed by a 60 d recovery period. Surface ponding
mate groundwater flow parallel and perpendicular to layer-             was approximated by a specified head boundary condition
ing, respectively, in anisotropic systems (Freeze and Cherry,          representing 10 cm of ponding at the 25 upper-boundary cells
1979). This concept has been generally been extended to                coincident with each recharge site, with no recharge speci-
variably saturated flow (Mualem, 1984; Yeh et al., 1985a, b;           fied for the remaining upper-boundary cells. An additional
Assouline and Or, 2006). Fogg et al. (2000) showed that ver-           simulation was run in which no recharge was specified for
tical groundwater flow in systems with vertically connected            all upper-boundary cells, i.e., as a no-recharge scenario. The
networks of permeable facies tends toward values between               initial condition for all recharge and no-recharge scenarios
Karith and Kgeom . For each x, y cell location across the do-          was the h distribution from the end of the model spinup. Re-
main, Karith , Kgeom , and Kharm are given as                          sults were output at 5 d intervals for all simulations.
                                                                          Following Maples et al. (2019), recharge responses were
       K1 + K2 + . . . + Kn
Karith =                     ,                                  (3)    isolated from other model stimuli by differencing h and to-
        p       n                                                      tal subsurface water storage (TSS) from each colocated cell
Kgeom = n K1 × K2 × . . . × Kn ,                                (4)    at each time step, in each recharge and no-recharge simula-
                n                                                      tion. In this way, perturbations in h and TSS result from the
Kharm = 1     1            1
                             ,                                  (5)
        K1 + K2 + . . . + Kn
                                                                       recharge stress alone, while other stimuli, including transient
                                                                       model response to regional boundary condition effects, are
where n is the number of vertically coincident cells from              eliminated. For each simulation, h perturbations were eval-
the land surface to the initial water table depth (i.e., the           uated at a 10 cm threshold. Domain-wide perturbations in h
unsaturated-zone cells) for each x, y cell location. In addi-          and TSS from recharge stress were evaluated for all 100 sites
tion, the initial unsaturated-zone thickness (water to depth;          at t = 30 d to calculate the volumetric extent of subsurface
WTD) and proportion of coarse-texture sand and gravel                  pressure perturbation P30 d (L3 ) and the effective recharge
unsaturated-zone facies (UZcoarse ) at each x, y cell location         rate R30 d (L T−1 ) respectively, at the end of the 30 d recharge
across the domain were included as metrics. Additional met-            stress period for each site. Similarly, domain-wide perturba-
rics were developed for each x, y cell location by combining           tions in TSS were evaluated at t = 90 d and were further de-
individual metrics; i.e., WTD was used as a multiplier for             lineated according to whether the change in storage occurred
Karith , Kgeom , Kharm , Surfcoarse , and UZcoarse . Spatial distri-   in fine-texture (muddy sand and mud) or coarse-texture (sand
butions of select metrics at all x, y cell locations are shown         and gravel) facies so that the proportion of the total recharge
in Fig. 3.                                                             volume accommodated by fine-texture facies Vfines,90 d (–)
   Site characteristics were calculated for the 100 1 km2 ex-          could be evaluated. Previous work has highlighted the im-
ploratory sites from these metrics by determining the av-              portance of fine-texture facies for accommodating recharge,

Hydrol. Earth Syst. Sci., 24, 2437–2456, 2020                                        www.hydrol-earth-syst-sci.net/24/2437/2020/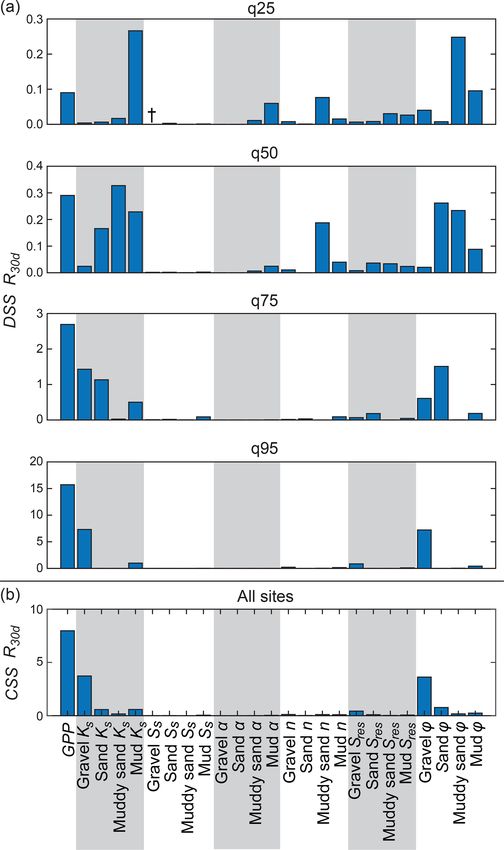
S. R. Maples et al.: Sensitivity of hydrologic and geologic parameters on recharge processes                                                                 2443

Table 3. Descriptions of site characteristics (variables) and model outputs (predictors).

 Observation type       Name          Units      Description
 Site characteristics   Karith,max    m d−1      Maximum arithmetic mean of vertical Ks for cells above the initial water table for each site
 (predictors)           Kgeom,max     m d−1      Maximum geometric mean of vertical Ks for cells above the initial water table for each site
                        Kharm,max     m d−1      Maximum harmonic mean of vertical Ks for cells above the initial water table for each site
                        Karith,avg    m d−1      Average arithmetic mean of vertical Ks for cells above the initial water table for each site
                        Kgeom,avg     m d−1      Average geometric mean of vertical Ks for cells above the initial water table for each site
                        Kharm,avg     m d−1      Average harmonic mean of vertical Ks for cells above the initial water table for each site
                        UZcoarse      unitless   Proportion of cells above the initial water table that are coarse-texture facies (gravel and sand) for each site
                        Surfcoarse    unitless   Proportion of surface cells that are coarse-texture facies (gravel and sand) for each site
                        WTD           m          Average initial water table depth for each site
 Model outputs          R10 d         cm d−1     Effective recharge rate (0–10 d average)
 (variables)            R30 d         cm d−1     Effective recharge rate (0–30 d average)
                        P30 d         m3         Volumetric extent of pressure perturbation after 30 d (10 cm threshold)
                        V90 d,fines   unitless   Proportion of total recharge volume accommodated by fine-texture facies after 90 d

especially during late time (e.g., Maples et al., 2019). All                       proxy parameter methodology described here is analogous
model outputs used for subsequent analyses are shown in Ta-                        to a transfer function (e.g., Wösten et al., 2001) in that it de-
ble 3.                                                                             scribes the influence of complex geologic heterogeneity on
                                                                                   recharge processes with relatively easily derived site charac-
2.4.4   Relations between site characteristics and                                 teristics. By using this approach in sensitivity analyses, we
        recharge potential                                                         are able to both capture this geologic complexity and also
                                                                                   reduce the overall computational expense, albeit with some
To better understand the relationships between site character-                     predictive uncertainty related to the regression relations.
istics (predictors) and model outputs (variables), correlations
(Pearson’s r, Spearman’s ρ, and Kendall’s τ ) were evaluated                       2.5     Sensitivity analyses using fit-independent statistics
between all variable and predictor pairs across all 100 sites.
Variables and predictors are described in Table 3. The pur-                        Realistic ranges of model parameters describing six hy-
pose of evaluating correlations between variables and predic-                      draulic properties for four facies types (n = 24 model param-
tors was to determine if any site characteristics could be used                    eters) are shown in Table 4 along with an estimated range of
to reasonably predict model outputs with empirical relations.                      GPP. Ranges for model parameters were chosen from litera-
The log10 data transformations were selectively performed                          ture values for the Central Valley, California, and for similar
on variables and predictors to improve the normality prior to                      alluvial systems (Anderson et al., 2015; Botros et al., 2009;
the calculation of Pearson’s r. Transformations were not per-                      Fleckenstein et al., 2004; Frei et al., 2009; Maserjian, 1993;
formed for Spearman’s ρ and Kendall’s τ , as neither require                       Niswonger and Fogg, 2008; Sager, 2012). Model parame-
normal distributions for prediction.                                               ters were assumed to be distributed uniformly within each
                                                                                   of these ranges for simplicity. The range of GPP was de-
2.4.5   Development of a geologic proxy parameter for                              termined from the range observed from the 100 exploratory
        recharge potential                                                         sites described in Sect. 2.4. The distribution GPP was ob-
                                                                                   served to be approximately log-normal, so a log10 data trans-
To incorporate descriptions of the geologic configuration in                       formation was performed for subsequent sensitivity analyses.
sensitivity analyses of recharge potential, development of a                          All sensitivity scenarios were initialized with the h dis-
geologic proxy parameter (GPP) was required. Correlations                          tribution from the end of the model spinup and were simu-
between select variables (R30 d , P30 d , and Vfines,90 d ) and pre-               lated and postprocessed following the approach outlined in
dictor pairs described in Sect. 2.4.4 were ranked, and a GPP                       Sect. 2.4.3. In this way, each scenario required that two sim-
value was determined for each by developing empirical re-                          ulations be run with the same parameter sets (i.e., a recharge
gression relations between those variables and the highest                         and no-recharge simulation), which were then differenced to
ranked predictor. Unlike other parameters, GPP cannot be                           isolate recharge stresses from other model stimuli, including
directly varied at each site, and instead it was approximated                      transient model responses to changes in parameter values.
either with linear regression of recharge response and GPP
or by relocating the recharge site within the domain to a                          2.5.1     Local-sensitivity analyses
location with the corresponding GPP value. Previous stud-
ies have shown the importance of geologic heterogeneity on                         Parameter sensitivities were evaluated locally using the
MAR feasibility (e.g., Maples et al., 2019), and the novel                         metrics of dimensionless-scaled sensitivity (DSS) and

www.hydrol-earth-syst-sci.net/24/2437/2020/                                                         Hydrol. Earth Syst. Sci., 24, 2437–2456, 2020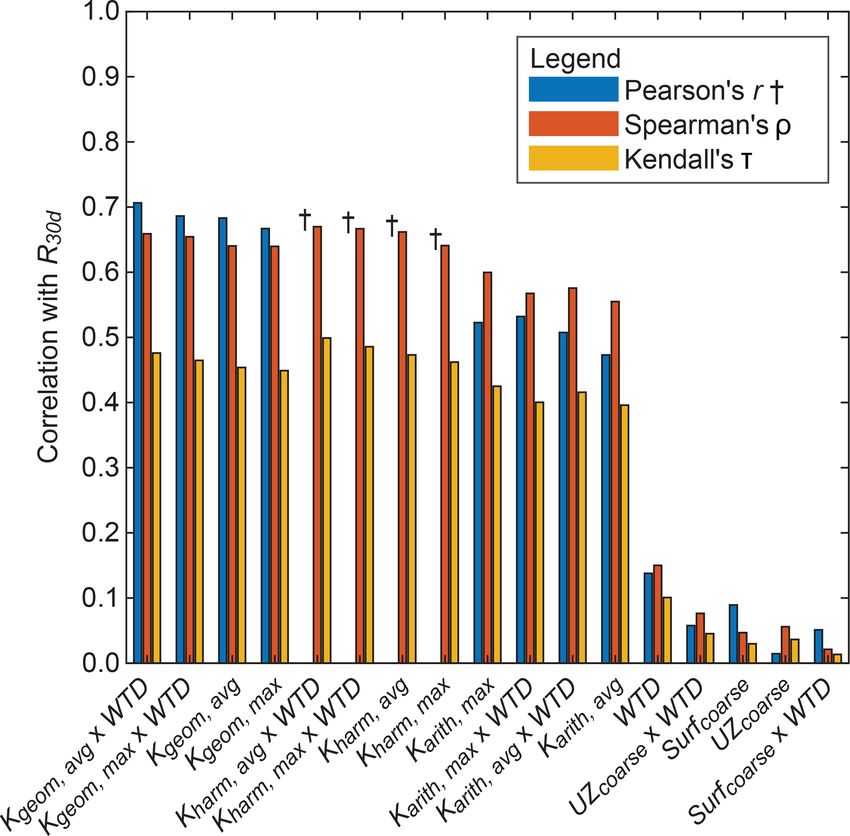
2444                             S. R. Maples et al.: Sensitivity of hydrologic and geologic parameters on recharge processes

Table 4. Parameter ranges, along with baseline and DSS perturbed parameter values for hydraulic properties and the geologic proxy param-
eter (GPP).

                        Parameter              Facies                                 Parameter          Baseline         DSS perturbed
                                               designation                               rangea        parameterb            parameter
                        Ks (m d−1 )            Gravel                             14.42–144.2                  67.5                   80.48
                                               Sand                                   5.4–54.0                 41.2                   46.06
                                               Muddy sand                           0.089–0.89                  0.20                   0.28
                                               Mud                               0.0023–0.023                0.0017                  0.0038
                        Ss (m−1 )              Gravel               1.0 × 10⁻⁶ –1.0 × 10⁻⁴             4.0 × 10⁻⁵              4.9 × 10⁻⁵
                                               Sand                 1.0 × 10⁻⁶ –1.0 × 10⁻⁴             8.0 × 10⁻⁵              8.9 × 10⁻⁵
                                               Muddy sand                    0.0001–0.001                  0.0001                  0.0002
                                               Mud                           0.0001–0.001                  0.0010                  0.0011
                        α (unitless)           Gravel                                 3.55–3.55                 3.55                    3.55
                                               Sand                                   3.55–3.55                 3.55                    3.55
                                               Muddy sand                             2.69–3.55                 2.69                    2.78
                                               Mud                                    0.35–0.45                 1.62                    1.81
                        n (unitless)           Gravel                                 2.00–3.16                 3.16                  3.044
                                               Sand                                   1.89–3.16                 3.16                  3.033
                                               Muddy sand                             1.44–2.00                 2.00                   1.94
                                               Mud                                    1.32–2.00                 2.00                   1.93
                        Sres (unitless)        Gravel                                 0.10–0.14                 0.10                  0.104
                                               Sand                                   0.10–0.14                 0.10                  0.104
                                               Muddy sand                             0.10–0.25                 0.10                   0.12
                                               Mud                                    0.16–0.23                 0.20                   0.21
                        φ (unitless)           Gravel                                 0.25–0.35                 0.35                    0.34
                                               Sand                                   0.25–0.35                 0.35                    0.34
                                               Muddy sand                             0.35–0.45                 0.40                    0.39
                                               Mud                                    0.35–0.45                 0.45                    0.44
                        GPP (m2 d−1 )          –                                   0.08–1891.6                      –                         –
                      a Ranges of hydraulic properties for each facies category were derived from literature values for the Central Valley,
                      California, and for similar alluvial systems (Anderson et al., 2015; Botros et al., 2009; Fleckenstein et al., 2004; Frei
                      et al., 2009; Maserjian, 1993; Niswonger and Fogg, 2008; Sager, 2012). b Baseline hydraulic properties were calibrated
                      manually by Liu (2014).

composite-scaled sensitivity (CSS), which are computation-                            rameter across multiple sites and for multiple model outputs
ally frugal screening methods used to compare the relative                            as
importance of different parameters to the estimation of a sim-                                     n h                  i1/2
                                                                                                   X             2
ulated model output (Hill and Tiedeman, 2007). DSS for sim-                           CSSj =                DSSij |b /n      ,                    (7)
ulated output i and parameter j is calculated as                                                   i=1
          0
            ∂yi           1/2                                                         where DSSij is from Eq. (6) and n is the total number of
DSSij =           |b bj ωii ,                               (6)
            ∂bj                                                                       simulated outputs i associated with parameter j .
                                                                                         DSS was estimated for the select model outputs R30 d ,
where yi0 is the ith simulated output, bj is the j th estimated                       P30 d and Vfines,90 d (Table 3) by perturbing each hydraulic-
parameter, ∂yi0 /∂bj is the derivative (i.e., the sensitivity) of                     property parameter (n = 24) by 10 % of its total range (Ta-
the simulated output with respect to the j th parameter, b is                         ble 4). Results from the exploratory simulations show that
the vector of parameter values at which sensitivities are eval-                       recharge response is highly dependent on site choice, so DSS
              1/2
uated, and ωii is the weight of the ith simulated output. For                         was evaluated at four representative sites which span a large
this work, the simulated outputs P30 d , R30 d , Vfines,90 d were                     range of recharge potential. Each of the four representative
weighted equally at unity.                                                            sites was chosen to correspond with the 25th, 50th, 75th, and
   Composite-scaled sensitivities (CSS) were calculated to                            95th percentile of recharge potential, as estimated by GPP.
estimate the total amount of sensitivity provided by each pa-                         These sites are hereto referred to as q25, q50, q75, and q95,

Hydrol. Earth Syst. Sci., 24, 2437–2456, 2020                                                             www.hydrol-earth-syst-sci.net/24/2437/2020/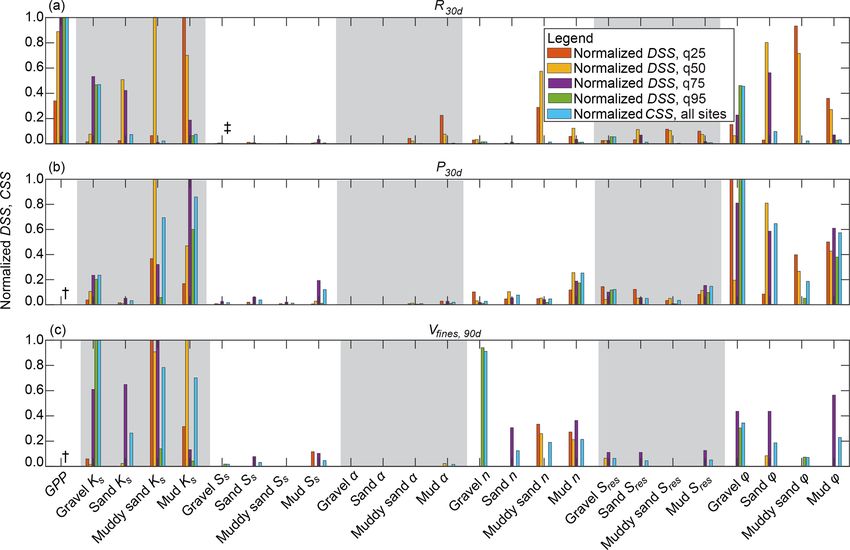
S. R. Maples et al.: Sensitivity of hydrologic and geologic parameters on recharge processes                                     2445

respectively. A total of 96 model evaluations were required           of muddy sand and mud, effectively reducing these four pa-
to estimate DSS on the three model outputs (R30 d , P30 d and         rameters into two describing “coarse-” and “fine-texture” fa-
Vfines,90 d ) for all 24 parameters (Table 4) at these four sites.    cies, respectively. By pairing parameters, Ks of gravel and
To incorporate GPP in DSS analyses, an approach was devel-            sand (and of muddy sand and mud) are perturbed within
oped using the predictive regression relation between GPP             their respective parameter ranges together. In total, three pa-
and R30 d . For example, DSS requires the perturbation of a           rameters were included in the Morris approach, including Ks
parameter (i.e., ∂bj ) by a percentage of the parameter range         values of coarse-texture facies, Ks of fine-texture facies, and
(e.g., by 10 %). A corresponding 10% perturbation in R30 d            GPP. Sensitivity indices were calculated using a sample size
(i.e., ∂yi0 ) was approximated using the predictive regression        of N = 20, resulting in a total of 80 model evaluations. Her-
relation between GPP and R30 d rather than by performing an           man et al. (2013) demonstrated that the method of Morris
additional model evaluation.                                          with N = 20 trajectories produced similar sensitivity results
   CSS was calculated for R30 d , P30 d , and Vfines,90 d (Table 3)   to the Sobol’ method (Sobol, 2001) with > 2 orders of mag-
by combining DSS estimates for each model output across               nitude fewer model evaluations.
sites q25, q50, q75, and q95 for each of 24 model parameters.            To further reduce the computational expense, the total sim-
The same approach was used to calculated CSS for GPP but              ulation time was reduced from 90 to 10 d, during which
was only estimated for R30 d and not for P30 d and Vfines,90 d .      recharge was applied for the entire simulation. Sensitivity in-
                                                                      dices, Morris µ∗j , were only evaluated with respect to the ef-
2.5.2    Global-sensitivity analyses                                  fective recharge rate at the end the 10 d simulation period
                                                                      R10 d (cm d−1 ). Morris µ∗j was not evaluated with respect
A measure of global sensitivity was provided by the method            to other model outputs describing pressure perturbation or
of Morris (1991), which relies on the calculation of el-              the volume of recharge accommodated by fines because GPP
ementary effects, i.e., local derivatives sampled one at a            was determined to be an inadequate predictor of these model
time (OAT) on a grid that covers the parameter space. The             outputs.
method of Morris creates a trajectory through the parame-                To incorporate GPP in the Morris framework, a novel ap-
ter space by perturbing each parameter xj along a grid by a           proach was developed in which the location of the sam-
step 1j . A sequence of p perturbations is required to obtain         pling site was varied to correspond with the requisite GPP
a one trajectory for a model with p parameters. For each tra-         parameter choice. For example, if a hypothetical sensitivity
jectory, the elementary effect for a single parameter EEj is          analysis required the evaluation of the model with GPP at
calculated as the ratio of the perturbation in model output to        the 50th quantile (q50; i.e., the median value), the model
the perturbation of the parameter as                                  would be run using the site with the nearest correspond-

        f x1 , . . ., xj + 1j , . . ., xp − f (x)                     ing GPP value from the 100 exploratory sites described in
EEj =                                             ,        (8)        Sect. 2.4. In this way, the variability of GPP as identified in
                           1j
                                                                      the exploratory simulations can be sampled directly by sim-
where f (x) is the evaluation of the function at the prior point      ply varying the location of the recharge site within the do-
in the trajectory. Calculating the elementary effects for p pa-       main. The Morris approach was implemented with an open-
rameters using a single trajectory requires p + 1 model eval-         source library developed by Herman and Usher (2017)
uations. Because the elementary effect for any single trajec-
tory does not account for interactions between parameters
and depends strongly on the location of the initial point x
                                                                      3     Results and discussion
in the parameter space, the method of Morris performs the
OAT approach over multiple trajectories N within the param-
                                                                      3.1    Exploratory simulations
eter space using a factorial sampling approach. A variation of
the original approach was employed to resolve issues related          Results from the exploratory simulations at the 100 selected
to the opposite signs of elementary effects affecting the cal-        sites show a wide range of R30 d , P30 d , and Vfines,90 d values
culation of total-order sensitivity (Campolongo et al., 2007),        across sites (Fig. 4). R30 d values varied over 2 orders of mag-
in which the total-order sensitivity of each parameter µ∗j was        nitude and were non-normally distributed, with a maximum,
calculated as the mean of the absolute values of N elemen-            minimum, and mean value of 66.4, 0.5, and 8.6 cm d−1 .
tary effects as                                                       P30 d values were similarly non-normally distributed and also
        1 XN                                                          showed a large range, varying over 4 orders of magnitude.
µ∗j =         EEkj .                                           (9)    Maximum, minimum, and mean P30 d values were 1.6 × 10⁵ ,
        N k=1
                                                                      33, and 1.9 × 10³ m3 , respectively. These results highlight
   Unlike DSS approaches, the method of Morris required               that a small number of sites have outsized recharge poten-
significantly greater computational resources for an equiva-          tial compared with most of the landscape. R30 d and P30 d
lent number of parameters. Computational expense was re-              values were positively correlated (r > 0.70), indicating that
duced by pairing parameters, i.e., Ks of gravel and sand and          these recharge benefits are physically related. The proportion

www.hydrol-earth-syst-sci.net/24/2437/2020/                                         Hydrol. Earth Syst. Sci., 24, 2437–2456, 2020
2446 S. R. Maples et al.: Sensitivity of hydrologic and geologic parameters on recharge processes
3.1.1 Influence of coarse-texture connectivity
Of the 100 exploratory sites, 23 were shown to have in-
terconnected coarse-texture gravel and sand facies from the
land surface to the initial water table depth. R30 d , P30 d , and
Vfines,90 d were parsed according to whether they were inter-
connected (Fig. 4). Results show that mean R30 d and P30 d
were 2.2 and 2.3 times greater, respectively, for intercon-
nected sites than for non-interconnected sites (14.7 cm d−1
vs. 6.7 cm d−1 and 1.6× = 104 m3 vs. 6.9 × 10³ m3 , respec-
tively). Mean Vfines,90 d values were 1.3 times greater for
non-interconnected sites than for interconnected sites. Dis-
tributions of R30 d and P30 d for interconnected and non-
interconnected sites differed significantly according to the
two-sample Kolmogorov–Smirnov test. Interconnected and
non-interconnected distributions of Vfines,90 d were not sig-
nificantly different.
These results indicate that sites with interconnected
coarse-texture facies have greater R30 d and P30 d potential.
However, this metric is not entirely diagnostic of recharge
potential. As shown in Fig. 4a and b, some interconnected
sites exhibited low R30 d and P30 d values. This is likely be-
cause some interconnected sites with shallow water table
depths have limited unsaturated pore volume to accommo-
date large recharge volumes. In addition, the interconnection
metric described herein only describes the vertical intercon-
nection of coarse-texture facies for unsaturated-zone cells
that are vertically coincident with the recharge site and does
not consider whether these coarse facies connect with the
greater aquifer network outside of the unsaturated-zone con-
trol volume. Results also show that some seemingly discon-
nected sites have a large recharge potential. Indeed, the in-
terconnection metric described here does not account for any
lateral interconnection from the land surface to the greater
Figure 4. Box plots of the (a) 30 d average recharge rate R30 d aquifer network, which could explain this behavior. In real-
and (b) 30 d pressure perturbation area of influence R30 d for all ity, the simplified estimator of connectivity used here likely
exploratory simulations (n = 100). Additionally, sites were parsed underestimates the number of interconnected sites.
according to whether there was a vertical interconnection of coarse-
texture facies from the land surface to the initial water table depth
3.2 Recharge metrics
(i.e., interconnected sites; n = 23) or whether sites did not have
an interconnection of coarse-texture facies (i.e., disconnected sites;
n = 77). 3.2.1 Correlation matrices
A matrix of correlations (absolute value of Pearson’s r) of
of recharge accommodated by fine-texture facies (Vfines,90 d ) pairs of site characteristics and simulated outputs for the
also showed large variability across sites, ranging from 0.13 100 exploratory simulations was generated to better under-
to 1.00, with a mean value of 0.69. The high proportion of stand the relationships between variables (Fig. 5). Simulated
Vfines,90 d values observed here is consistent with previous outputs R10 d , R30 d , and P30 d were all positively correlated
findings that suggest that fine-texture facies are the largest with all simulated outputs, while Vfines,90 d was generally
reservoir for MAR in this aquifer system (Maples et al., negatively correlated with simulated outputs. A strong corre-
2019). Vfines,90 d was negatively correlated with both R30 d lation (|r| > 0.70) was observed for 6 of 52 pairs of site char-
and P30 d (|r| > 0.70), which indicates that when intercon- acteristics and simulated outputs. A strong correlation was
nected, coarse-texture pathways are present, a greater propor- also observed among many site characteristics and among
tion of MAR is accommodated in the coarse-texture aquifer the majority of simulated outputs (i.e., collinearity), which
system. can make the choice of an optimal proxy parameter more
challenging. Site characteristics that include Kharm were not
Hydrol. Earth Syst. Sci., 24, 2437–2456, 2020 www.hydrol-earth-syst-sci.net/24/2437/2020/S. R. Maples et al.: Sensitivity of hydrologic and geologic parameters on recharge processes 2447
Figure 6. Ranked correlations (Pearson’s r, Spearman’s ρ, and
Kendall’s τ ) of site characteristics with 30 d average recharge
rate (R30 d ). † Pearson’s r was not evaluated for site characteris-
Figure 5. Correlations (absolute value of Pearson’s r) for all com- tics where the normality of the distribution could not be improved
binations of site characteristics and model outputs. Correlations with a log10 data transformation.
among site characteristics are bounded by a solid red box, and corre-
lations between site characteristics and model outputs are bounded
by a dashed red box.
(r < 0.20) with R30 d . This finding has important im-
plications for determining MAR site suitability because
shown in the correlation matrix because we were not able many geographic-information-system-derived (GIS-derived)
to improve the normality of the distribution of these data indices of recharge suitability rely solely on soil and/or sur-
with a log10 data transformation; however, additional corre- face geology to determine geologic suitability for recharge.
lation metrics (Fig. 6) indicate that site characteristics that These results suggest that even more detailed geologic de-
include Kharm may also be strongly correlated. scriptions that estimate deeper fractions of coarse-texture fa-
cies may not fully capture recharge potential. Instead, metrics
3.2.2 Ranked correlations that include some description of upscaled vertical K appear
to be most diagnostic of recharge potential.
Additional correlation metrics (Pearson’s r, Spearman’s ρ,
and Kendall’s τ ) between R30 d and site characteristics were 3.3 Recharge extrapolation
ranked and are shown in Fig. 6. Results show that site char-
acteristics that include some variation of Karith , Kgeom , or The relation between site-averaged Kgeom × DTW and R30 d
Kharm were, in general, more correlated with R30 d than was determined to be the best predictor and was used to
site characteristics that only include WTD, UZcoarse , and predict R30 d for subsequent sensitivity analyses by treating
Surfcoarse . Kgeom × WTD was, on average, most correlated Kgeom ×DTW as a GPP value (Fig. 7a). The linear regression
with R30 d . relation between Kgeom × DTW and R30 d was highly sig-
In general, site characteristics that included Kgeom and nificant (p < 0.01), and correlation coefficients (r 2 ) showed
Kharm were slightly more correlated with R30 d than site char- that empirical regression explained 70 % of the variation in
acteristics that included Karith . We speculate that this be- the data. Linear regression relations for Kgeom × DTW and
havior is related to the dominantly vertical flow direction P30 d and Vfines,90 d were deemed insufficient for prediction
of recharge across typically horizontal facies configurations. (r 2 < 0.40) and were not incorporated in sensitivity analy-
Previous work has shown that Kgeom and Kharm best describe ses.
upscaled K for these flow configurations in this domain Domain-wide Kgeom × WTD was converted to R30 d us-
(Yunjie Liu, personal communication, 2016; Fogg, 1986). ing the predictive relation described above (Fig. 8). Re-
Interestingly, site characteristics that included only sults show that 84 % of the domain has an R30 d poten-
WTD, UZcoarse , and Surfcoarse were poorly correlated tial < 10 cm d−1 , while 6 % of the domain has an R30 d po-
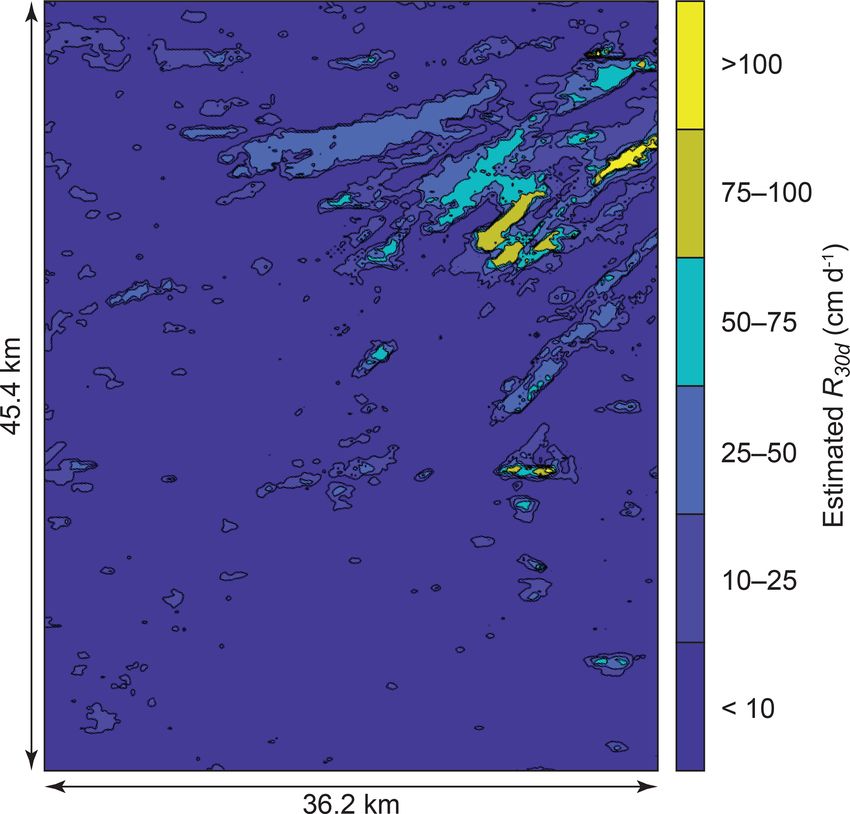
www.hydrol-earth-syst-sci.net/24/2437/2020/ Hydrol. Earth Syst. Sci., 24, 2437–2456, 20202448 S. R. Maples et al.: Sensitivity of hydrologic and geologic parameters on recharge processes
Figure 8. Domain-wide estimated distribution of 30 d average
recharge rate R30 d .
3.4 Sensitivity analyses
3.4.1 Local-sensitivity analyses
Figure 7. (a) Regression relation between the geologic proxy pa-
rameter (Kgeom × WTD) and the 30 d average recharge rate (R30 d )
GPP perturbations to estimate DSS for sites q25, q50, q75,
for all exploratory simulations shown with a solid black line, where and q95 using predictive regression relations are illustrated
dashed lines indicate the upper and lower 95 % confidence inter- in Fig. 7b and c. DSS and CSS results for each model pa-
vals. (b) The relation is shown with Kgeom ×WTD on a log10 scale, rameter and GPP with respect to R30 d is shown in Fig. 9.
where red circles indicate the original and perturbed sites at which DSS results (Fig. 9a) show that for low-recharge-potential
dimensionless scaled sensitivity (DSS) was estimated. (c) The in- sites q25 and q50, Ks of mud and muddy sand facies were
set illustrates the procedure for estimating the perturbed site (e.g., the most sensitive parameters with respect to R30 d . For high-
q75∗ ) from the original site (e.g., q75) for DSS, using the regression recharge-potential sites q75 and q95, GPP was the most sen-
relation, where ∂yi0 is the change in Kgeom × WTD and ∂bj is the sitive parameter. These findings demonstrate that Ks of fine-
estimated corresponding change in R30 d . texture facies is the dominant driver of recharge potential for
low-recharge-potential sites and the configuration of facies
and water table depth is relatively less important. However,
tential > 25 cm d−1 , and a small portion of the domain has
for high-recharge-potential sites, which presumably have a
an R30 d potential > 150 cm d−1 . These results show a large
higher proportion of coarse-texture facies, the configuration
contrast between locations with a high recharge potential and
of facies and water depth becomes the dominant driver of
those with a low recharge potential, which supports previous
recharge potential. In general, the DSS values of all parame-
findings indicating that a small fraction of the landscape has
ters were greater for sites with higher recharge potential than
a recharge potential that is orders of magnitude greater than
for sites with low recharge potential.
the rest of the landscape (Maples et al., 2019; Fleckenstein
CSS results for R30 d (Fig. 9b) show that, in general, GPP
et al., 2006). The deposition of IVF within the domain area
was the most sensitive parameter for R30 d when aggregated
has been documented by Meirovitz (2010) and explains the
across all four sites. In general, Ks and φ were also sensi-
presence of these high recharge potential locations.
tive with respect to R30 d . It is unsurprising that φ is sensitive
to R30 d because specific yield (Sy ), which is not explicitly
parameterized in ParFlow, is closely related to φ. Moreover,
Maples et al. (2019) showed that the majority of recharge
volume in this alluvial system is accommodated by the fill-
ing unsaturated-zone pore volume, which is controlled pri-
Hydrol. Earth Syst. Sci., 24, 2437–2456, 2020 www.hydrol-earth-syst-sci.net/24/2437/2020/S. R. Maples et al.: Sensitivity of hydrologic and geologic parameters on recharge processes 2449
unsaturated pore volume and is thus more dependent on φ
(and Sy ) than on Ss .
Normalized DSS values for sites q25, q50, q75, and q95
and normalized CSS values for all sites are shown in Fig. 10.
DSS values were scaled to the range [0, 1] (i.e., normal-
ized) for each group of parameters for a given site and a
given model output. For example, all DSS values at q25 for
R30 d were normalized to the maximum value of DSS for
that group of parameters. CSS values were similarly scaled
for each group of parameters for a given model output. Be-
cause DSS and CSS values are influenced by the units of
each model output, normalization allows for comparison of
their relative magnitudes between model outputs. Results
show similar sensitivity importance for each model output,
wherein Ks and φ are generally the most sensitive parame-
ters, while Ss , α, n, and Sres are all relatively unimportant,
except for n of q95 for Vfines,90 d , which was shown to be im-
portant. DSS and CSS values of GPP were not evaluated for
P30 d and Vfines,90 d because regression relations between site
characteristics and these outputs were generally poor com-
pared to those for R30 d , as noted in Sect. 3.3.
DSS and CSS results for GPP demonstrate the novel usage
of empirical regression relations in a local-sensitivity analy-
sis framework. By perturbing GPP in this way, the constancy
of other parameters can be maintained in a way that would be
otherwise difficult if GPP was perturbed by changing the lo-
cation of the recharge site. Performing local-sensitivity anal-
yses at multiple sites spanning a range of recharge poten-
tial allowed for the comparison of DSS sensitivities across
sites and highlights differences of parameter sensitivities for
low- and high-recharge-potential sites. Our findings demon-
strate that (1) facies permeability and unsaturated-zone stor-
age properties are important factors for recharge potential
and (2) the configuration of subsurface geology and water ta-
Figure 9. (a) Dimensionless scaled sensitivities (DSS) evaluated ble depth is particularly important for the total recharge vol-
for each model parameter and model output R30 d at sites q25, q50, ume that can be accommodated at a particular site, especially
q75, and q95 and (b) composite scaled sensitivities (CSS) evaluated for high-recharge-potential sites.
for each parameter and model output at all sites. DSS and CSS of
parameters were scaled to the range [0, 1] (i.e., normalized). † DSS 3.4.2 Global-sensitivity analyses
and CSS values below 0.001 are not shown.
Results from global-sensitivity analyses are shown in Fig. 11.
Morris µ∗ values indicate that GPP is the most sensitive pa-
rameter when compared with Ksat of coarse- and fine-texture
marily by Sy , and by association in this model, by φ. Em- facies. These results are consistent with findings from local-
pirical fitting parameters describing unsaturated-zone texture sensitivity analyses which also showed that GPP was the
and soil water retention, α, n, and Sres , were relatively insen- most important parameter with respect to R30 d . Unlike DSS
sitive, especially for sites q75 and q95. This suggests that and CSS results, which compared GPP to model parameters
while unsaturated pore volume is important for recharge, the for each facies, Morris analysis combined Ks parameters for
unsaturated flow processes are not particularly important, coarse- and fine-texture facies which, in turn, increased the
at least when considering the infiltration of ponded water, influence of those parameters on R30 d relative to GPP. Even
which typically allows for rapid wetting-front advancement so, results indicate that GPP is the most important parame-
through the unsaturated zone, especially for high-recharge- ter with respect to R30 d . These results further highlight the
potential sites. Results suggest that saturated storage prop- importance of the configuration of subsurface geology and
erties, i.e., Ss , were also relatively unimportant. This likely water table depth for groundwater recharge potential.
because most recharge volume is accommodated by filling
www.hydrol-earth-syst-sci.net/24/2437/2020/ Hydrol. Earth Syst. Sci., 24, 2437–2456, 2020You can also read