Retinal alterations in a pre-clinical model of an autism spectrum disorder
←
→
Page content transcription
If your browser does not render page correctly, please read the page content below
Guimarães-Souza et al. Molecular Autism             (2019) 10:19
https://doi.org/10.1186/s13229-019-0270-8

 RESEARCH                                                                                                                                         Open Access

Retinal alterations in a pre-clinical model of
an autism spectrum disorder
Elisa Maria Guimarães-Souza1, Christina Joselevitch2†, Luiz Roberto G. Britto1† and Silvana Chiavegatto3,4*†

  Abstract
  Background: Autism spectrum disorders (ASD) affect around 1.5% of people worldwide. Symptoms start around age 2,
  when children fail to maintain eye contact and to develop speech and other forms of communication. Disturbances
  in glutamatergic and GABAergic signaling that lead to synaptic changes and alter the balance between excitation
  and inhibition in the developing brain are consistently found in ASD. One of the hallmarks of these disorders is
  hypersensitivity to sensory stimuli; however, little is known about its underlying causes. Since the retina is the part of
  the CNS that converts light into a neuronal signal, we set out to study how it is affected in adolescent mice prenatally
  exposed to valproic acid (VPA), a useful tool to study ASD endophenotypes.
  Methods: Pregnant female mice received VPA (600 mg/kg, ip) or saline at gestational day 11. Their male adolescent pups
  (P29–35) were behaviorally tested for anxiety and social interaction. Proteins known to be related with ASD were
  quantified and visualized in their retinas by immunoassays, and retinal function was assessed by full-field scotopic
  electroretinograms (ERGs).
  Results: Early adolescent mice prenatally exposed to VPA displayed impaired social interest and increased anxiety-like
  behaviors consistent with an ASD phenotype. The expression of GABA, GAD, synapsin-1, and FMRP proteins were
  reduced in their retinas, while mGluR5 was increased. The a-wave amplitudes of VPA-exposed were smaller than those
  of CTR animals, whereas the b-wave and oscillatory potentials were normal.
  Conclusions: This study establishes that adolescent male mice of the VPA-induced ASD model have alterations in
  retinal function and protein expression compatible with those found in several brain areas of other autism models.
  These results support the view that synaptic disturbances with excitatory/inhibitory imbalance early in life are associated
  with ASD and point to the retina as a window to understand their subjacent mechanisms.
  Keywords: Autism, Vision, Retina, Glutamate, GABA, Valproate, Neurodevelopment, Adolescence

Background                                                                             abnormal behavior that varies greatly and may determine
Autism spectrum disorders (ASD) are a diverse group of                                 autism severity, such as fixed interest in specific objects,
developmental disorders, characterized by early-appearing                              repetitive movements, and cognitive impairment [1, 2].
social communication deficits and unusual sensory-motor                                   There are several etiologies proposed for ASD. Some pa-
behaviors (for a review, see [1]). In fact, symptoms are usu-                          tients carrying mutations in a single gene, such as
ally noticed in early childhood, at about age 2, when chil-                            Phelan-McDermid (SHANK3), fragile X (FMRP), Rett
dren fail to maintain eye contact and to develop speech                                (MeCP2), and tuberous sclerosis (TSC1/2) display autistic-
and other forms of communication. They may also develop                                like behaviors [3]. However, they are rare monogenic syn-
                                                                                       dromes and represent only a small proportion of all ASD
* Correspondence: schiaveg@usp.br                                                      cases diagnosed. Most ASD occurrences are classified as
†
 Christina Joselevitch, Luiz Roberto G. Britto, and Silvana Chiavegatto divide         multigenic/complex or idiopathic. Such patients may carry
senior authorship.
3
 Department of Pharmacology, Biomedical Sciences Institute, University of              more than one genetic abnormality at the same time,
São Paulo, Av. Prof. Lineu Prestes, 1524, São Paulo, SP 05508-000, Brazil              translating into synaptic disturbances during neurodeve-
4
 Department and Institute of Psychiatry, Clinics Hospital (HCFMUSP),                   lopment [3]. Accordingly, dysregulation in synaptic trans-
University of São Paulo Medical School, Rua Dr. Ovidio Pires de Campos, 785,
São Paulo, SP 05403-903, Brazil                                                        mission and neural circuits due to the imbalance between
Full list of author information is available at the end of the article

                                         © The Author(s). 2019 Open Access This article is distributed under the terms of the Creative Commons Attribution 4.0
                                         International License (http://creativecommons.org/licenses/by/4.0/), which permits unrestricted use, distribution, and
                                         reproduction in any medium, provided you give appropriate credit to the original author(s) and the source, provide a link to
                                         the Creative Commons license, and indicate if changes were made. The Creative Commons Public Domain Dedication waiver
                                         (http://creativecommons.org/publicdomain/zero/1.0/) applies to the data made available in this article, unless otherwise stated.
Guimarães-Souza et al. Molecular Autism   (2019) 10:19                                                            Page 2 of 16

excitation and inhibition (E/I) is hypothesized to contribute    to autism. Our results show alterations in both protein ex-
to ASD [4]. Disturbances in glutamatergic and/or                 pression and in the full-field scotopic electroretinogram
GABAergic signaling are associated with ASD in a multi-          (ERG) of adolescent mice (P30—for a definition of adoles-
tude of studies and may represent a convergence of small         cence in rodents, see [22]) prenatally exposed to VPA, in
perturbations in multiple genes and proteins. For example,       addition to the same autistic-like behavioral features de-
glutamic acid decarboxylase (GAD), the enzyme that pro-          scribed elsewhere (for a review, see [13]).
duces GABA from glutamate, is found to be reduced in
ASD patients due to an increased binding of the gene             Methods
MeCP2 to its promoter [5]. It is therefore likely that E/I       Animal care
imbalances in ASD are caused by changes in the availability      C57BL/6 mice were provided by the Animal Facility of the
of glutamate and/or GABA.                                        Department of Physiology and Biophysics (Biomedical Sci-
   In parallel with the genetic evidence of etiologically dis-   ences Institute, University of São Paulo). Animals were
tinct conditions for ASD, environmental factors may also         kept in microisolated policarbonate cages (up to five per
play a role in the increase prevalence of autism in the past     cage) in ventilated stands (Alesco, Brazil) located in a
decades. Increased exposure to pollution, pesticides,            room with controlled temperature (± 22 °C) and a 12/12 h
drugs, viral infections, and autoimmune diseases during          light cycle (lights on at 7 am), with water and feed ad libi-
pregnancy are associated with a higher risk of autism for        tum. All experiments were conducted between 7 am and
embryos in utero [6]. Valproic acid (VPA), an affordable         12 pm to avoid circadian differences that could induce
and stable drug used to treat epilepsy and bipolar disorder,     additional variability in our results.
may be one such environmental factor [7, 8]. VPA acts on
both glutamatergic and GABAergic systems in order to             VPA injection in pregnant mice
decrease excitability: it antagonizes NMDA receptors,            Adult female mice had their estrous cycle monitored
blocks sodium and calcium voltage-gated channels, and            and, when in proestrus, were housed with an
inhibits GABA transaminase, consequently increasing the          age-matched male overnight. They were removed in the
concentration of GABA in the synaptic cleft. VPA is also a       next morning, and their weight and vaginal smears were
potent inhibitor of histone deacetylase (HDAC) and of            monitored; females were considered pregnant if they had
glycogen synthase kinase-3 beta (GSK-3 beta) [9]. How-           gained about 3 g on day 7 after being with the male (E7)
ever, VPA is very teratogenic [10], and several women who        and were constantly in diestrus. On E11, 15 females
inadvertently continued taking VPA during their preg-            were injected ip with either 100 μL of a 0.9% NaCl solu-
nancy gave birth to children with cranial malformations,         tion (control group, referred to as “CTR”) or 600 mg/kg
specific facial characteristics, cognitive problems, and/or      of VPA sodium salt (P4543, Sigma Aldrich) diluted in
autism [11]. These observations led researchers to con-          100 μL of a sterile 0.9% NaCl solution (experimental
sider VPA a good pharmacological tool to induce a pheno-         group, referred to as “VPA”). The final pH value of the
typic ASD model [9, 12, 13]. At the same time, this              VPA solution (6.05) was calculated from the pKa of VPA
pharmacologically induced model has the advantage to             (4.6) and the concentration of the ip injection (36 μM of
represent what would be a syndrome of environmental              sodium valproate). This pH is within the acceptable
etiology, allowing us to identify similarities and differences   range (4.5–8) for non-buffered solutions via all routes of
between this model and the more defined genetic syn-             administration in the mouse [23]. Therefore, pH adjust-
dromes [14].                                                     ment of the VPA solution was not necessary. After birth,
   In this work, we have investigated the retina of the          only male pups were used for our experiments, since fe-
VPA-induced model, since one of the hallmarks of ASD is          male mice prenatally exposed to VPA appear to have
hypersensitivity to sensory stimuli [15–18], and the retina      their social interaction scores preserved in comparison
is the primary sensory detector for vision. For example,         to males [24, 25].
ASD patients apparently perform better than usual in               Twelve pregnant females (median 152 days old—from
some visual tasks, and worse in others [19]. It has also         65 to 165—at the injection day) yielded viable litters
been shown that certain types of visual stimulus, such as        with 39 male pups that were weaned at P21. At P29,
computer screen lights, capture the attention of individ-        adolescent males were submitted to two behavioral ex-
uals affected by ASD more than would be expected for             periments (the open field test and the social interaction
neurotypical people [20]. Additionally, because the retina       test), and between P30 and P35, some of these mice
is part of the central nervous system (CNS), it uses mainly      were subjected to full-field scotopic electroretinograms
glutamate and GABA to transmit and modulate visual sig-          (ERGs) to assess their retinal function, while some of
nals [21] and produces most, if not all, neurotransmitters       them were used for immunoblotting and immunohisto-
found in the brain. It is therefore likely that the retina is    chemistry. Some mice were exclusively used for immu-
also affected by the developmental disturbances that lead        noassays. Detailed information regarding the number of
Guimarães-Souza et al. Molecular Autism   (2019) 10:19                                                          Page 3 of 16

animals in each group and type of experiment is given in       receptors [27], which are abundantly present in the inner
Additional file 1: Figure S1.                                  retina [28].
                                                                  On the day before the experiment, animals were
Open field test                                                weighted and left in the experiment room to dark adapt
The open field consisted of a wooden arena covered with        overnight (~ 16 h), with feed and water ad libitum. On
white Formica measuring 66 × 66 × 30 cm, and its floor         the day of the ERG, the mice were anesthetized under
was divided into 6 × 6 cm squares. Each mouse was              dim red light (λ = 680 nm, 6.44 cd/m2) with an intraperi-
placed in the center of the arena and allowed to explore       toneal injection of 80 mg/kg ketamine and 2.5 mg/kg
the environment freely for 5 min. Experiments were re-         xylazine diluted in 150 μL of a sterile 0.9% NaCl solution
corded with a Nikon P3200 camera. Videotrack software          and laid on a heated table (~ 39 °C) to maintain their
(ViewPoint, France) was used to analyze the experi-            body temperature. All subsequent procedures were per-
ments; evaluated behaviors were (i) total locomotion, (ii)     formed with lights off and using infrared goggles (Night
locomotion in the central area, and (iii) time in the cen-     Cougar, ATN).
tral area. See Additional file 1: Figure S2 for details           We used eye drops to locally anesthetize (0.5% proxy-
about the delimitation area.                                   metacaine hydrochloride, Anestalcon, Alcon) and dilate
                                                               (0.5% tropicamide, Mydriacyl, Alcon) the animals’ pupils.
                                                               Five electrodes (Roland Consult, Germany) were con-
Social interaction test                                        nected to their body: one needle electrode at the base of
The social interaction test we used was a modified ver-        the tail as ground, two needle electrodes at each side of
sion of the three-chamber social interaction test. We          the forehead as references, and two gold ring electrodes
adapted this assay for adolescent mice in our lab using        (0.25 mm wire; 2.5 mm diameter) on the corneas for re-
only two contiguous and connected chambers (40.5 ×             cording. A Ganzfeld LED stimulator (Q450 SC Roland
20 × 22 cm height each) of the sociability cage (Noldus,       Consult, Germany) was used to produce homogeneous
Wageningen, The Netherlands). The salient sensory cues         light stimuli over the entire retina (λmax = 459 nm), ran-
that contribute to social approach performance are pri-        ging from − 2.01 to 4.09 log photons*μm−2*s−1 in ~ 0.5
marily olfactory in nature, with visual cues appearing to      log increments. Experiments were controlled, amplified,
play a remarkably minor role [26]. The subject mouse           and digitized by a computerized system (RetiPort, Ro-
was placed in an empty and clean chamber and was free          land Consult, Germany). For each light intensity, the
to explore the whole apparatus for a 3-min habituation         mean response to at least five presentations was calcu-
period. It was then removed, while a perforated acrylic        lated. ERG sessions typically lasted 40–60 min; data was
cylinder containing a naïve male adolescent mouse of           discarded whenever (i) electrode contact was deemed in-
approximately the same size was introduced in the other        adequate, (ii) the anesthesia wore out during the experi-
chamber. The subject mouse was subsequently placed             ment, or (iii) the animal came to pass during the
back in the empty chamber and allowed to explore for an-       experiment. In the first case, only the data from the af-
other 3 min. We evaluated the subject’s latency to enter       fected eye was discarded. In the latter cases, all records
the interaction area, the time during which it stayed in the   of that animal were discarded.
interaction area, and the locomotion around the cylinder          Data were further processed using macros programmed
with the novel animal (see Additional file 1: Figure S2 for    in OriginPro 8 software (OriginLab). A notch digital filter
area delimitation). The frequency of sniffing between the      at 60 Hz was used to eliminate noise originating from the
cylinder bars towards the novel mouse was considered so-       electrical network. A-wave amplitudes, which reflect
cial exploration. Sessions were recorded and analyzed by       photoreceptor (rod and cone) activity, were measured dir-
Videotrack software (ViewPoint), and the nose pokes were       ectly on the raw traces from the baseline (dotted gray line
manually quantified from the videos in a blind fashion.        in Fig. 1, upper panel) until the trough of the trace.
                                                               B-wave amplitudes, which are generated by ON BCs and
Full-field scotopic electroretinogram                          provide a useful estimate of signal transmission between
In order to evaluate the function of outer retinal neu-        photoreceptors and second-order neurons, were subse-
rons such as photoreceptors (rods and cones) and de-           quently measured from the trough of the a-wave to the
polarizing bipolar cells (ON BCs), as well as amacrine         peak of the trace (Fig. 1, upper panel) after treatment with
cells (ACs) in the inner retina, full-field (Ganzfeld) sco-    a 60-Hz low-pass filter to eliminate oscillatory potentials
topic electroretinograms (ERGs) were measured in ani-          (OPs). Finally, OPs, generated by the joint activity of dif-
mals between P30 and P35 (details in Additional file 1:        ferent AC types and providing a readout of signal trans-
Figure S1). Mice examined with the ERG were not used           mission from bipolar cells to the inner retina, were
for immunoassays or immunohistochemistry, since the            quantified by calculating the absolute areas of the traces
anesthetic drug used for the ERG interferes with NMDA          (i.e., the sum of absolute trapezoid values, in μV*ms) from
Guimarães-Souza et al. Molecular Autism (2019) 10:19 Page 4 of 16
250 μV
a b
25 ms
OPs
Fig. 1 ERG analysis. Representative ERG trace showing the different retinal waves in response to a full-field light stimulus (timing indicated by the
red arrow). A-wave and b-wave amplitudes are represented by blue arrows, and the total OP area is the absolute sum of the areas shaded in blue
between 30 ms (stimulus onset) and 150 ms (end of oscillations, indicated by the blue arrow)
30 ms (stimulus onset, red arrow in Fig. 1, lower panel) to Immunoblotting
150 ms (end of oscillations) after isolation with a 120-Hz P30–35 mice were euthanized with an overdose of iso-
high-pass filter. flurane and their eyecups were removed. Retinas were
Amplitudes of the a- and b-waves were fitted by a dissected, collected in RIPA buffer and sonicated. Sam-
sigmoid function of the form: ples were centrifuged at 12000×g and the supernatant
was collected. We used the Bradford method [31] to
measure protein content in the samples, and then added
In
V ¼ V max ; alkaline denaturing buffer. Samples were heated at 60 °C
k þ In
n
for 10 min, and 60 μg of each protein sample were
loaded into 8% polyacrylamide gels for electrophoresis.
in which Vmax is the maximal response amplitude, k is Proteins were transferred to nitrocellulose membranes,
the intensity required to evoke 50% of Vmax, n is the incubated with primary antibodies (Table 1, dilutions
slope, and I is the stimulus intensity. This relation is referenced as WB) overnight, rinsed, and incubated with
called Hill function and is a variation of the Michaelis- HRP-conjugated secondary antibodies. We used a
Menten equation originally developed for enzyme kinet- chemiluminescence kit (Clarity ECL, Biorad) to reveal
ics [29]. Since the area-intensity relationship of OPs has the bands, and the membrane was imaged with Image
a biphasic nature, two light intensities were compared: Studio Digits 4.0 software together with the c-Digit
(i) an intermediate intensity (intensity #8, 1.56 log scanner (both from LI-COR Biosciences) to measure the
photons*μm−2*s−1), corresponding to a first plateau in optical density (OD) of each band. It uses an algorithm
this relationship and well within the scotopic (rod- that subtracts the background from the chemilumines-
driven) range for the mouse [30] and (ii) the last inten- cent signal captured by the device. Measurements are
sity (intensity #13, 4.09 log photons*μm−2*s−1), which is therefore reliable, because they are independent of image
in the mesopic/photopic range and reflects therefore contrast, brightness, or exposure. Membranes were
cone-driven activity [30]. stripped with a glycine solution (pH 2.2) for reprobing.Guimarães-Souza et al. Molecular Autism (2019) 10:19 Page 5 of 16
Table 1 Information about primary antibodies used in this study
Antibody Catalog #/company Species Dilution
Anti-beta-actin A5316 Mouse 1:50000 (WB)
Anti-synapsin-1 (SYN-1) AB1543/Millipore Rabbit 1:500 (IHC); 1:5000 (WB)
Anti-mGluR5 ab76316/Abcam Rabbit 1:200 (IHC); 1:1000 (WB)
Anti-FMRP ab17722/Abcam Rabbit 1:200 (IHC); 1:1000 (WB)
Anti-GABA A2052/Sigma Rabbit 1:1000 (IHC)
Anti-GAD AB1511/Millipore Rabbit 1:200 (IHC); 1:1000 (WB)
Anti-GAT-1 ab426/Abcam Rabbit 1:500 (IHC)
IHC immunohistochemistry, WB Western blot
Lastly, all membranes were incubated with beta-actin Data normality was checked with the Shapiro-Wilk test.
antibody (A5316, Sigma), and beta-actin bands were For non-normal data, two-tailed Mann-Whitney tests
used for normalization. were used to compare results; in these cases, medians are
reported instead of means. For normal data, the F test was
Immunohistochemistry used to analyze the equality of variances, followed by the
Eyecups were fixed in 4% paraformaldehyde diluted in 0.1 appropriate unpaired two-tailed t test; in these cases, the
M phosphate buffer (pH = 7.2, PB). Tissues were cryopro- means ± SDs are reported. For all statistic tests, a confi-
tected in a sucrose gradient (10%, 20%, and 30%), sectioned dence interval of 0.95 was initially chosen (i.e., α = 0.05).
in a cryostat at 12 μm and placed onto gelatinized glass Whenever more than one comparison was performed
slides. CTR and VPA sections were collected on the same with the same dataset, Bonferroni correction was applied
slide to ensure the same immunohistochemical reaction according to the number of hypotheses tested, by adjust-
for both samples. Sections were washed with PB and then ing either the level of significance p or α. For non-normal
blocked with 5% normal donkey serum for 1 h. After three data, p was divided by the number of comparisons (i.e.,
washes with PB, sections were incubated with the primary for two comparisons using the same dataset, the signifi-
antibodies listed in Table 1 (dilutions referenced as IHC) cance level was reduced from p = 0.05 to p = 0.05/2 =
overnight. The next day, sections were washed three times 0.025). For normal data, α was divided by the number of
and incubated with a fluorescent secondary anti-rabbit comparisons, and p remained 0.05.
antibody raised in donkey (Alexa 594, Invitrogen) for 2 h. For the remainder of the data, after checking for data
Sections were then washed three times and mounted with normality with the Shapiro-Wilk test, two-tailed un-
Vectashield (VectorLabs) containing DAPI. paired t tests were performed with Prism 6 software
Images were captured with a DXM 1200 camera (Graphpad); results were considered significantly differ-
coupled to an Eclipse E1000 fluorescence microscope ent when p < 0.05. Immunohistochemistry analyses were
using a × 40 objective (all from Nikon, Japan). CTR and done with two-tailed paired t tests (p < 0.05), to compare
VPA photographs were taken on the same day using the results obtained from CTR and VPA in the same slide
same resolution and exposure settings to prevent artifacts and immunohistochemical procedure.
induced by time-dependent fluorescence decay. Analysis
was performed using the RGB value plugin of ImageJ soft-
ware (NIH). We used the polygon tool to draw a selection Results
around each retinal layer (outer plexiform layer, OPL; Mice from VPA-injected dams display different physical
inner nuclear layer, INL; inner plexiform layer, IPL; gan- characteristics from control mice
glion cell layer, GCL) and measured the red value. We an- Our first approach was to physically inspect all pups.
alyzed ten images from each retina, totalizing at least 50 We observed features in the VPA prenatally exposed
images for each group. Individual values obtained from mice that were similar to those already described in the
single images were summed to account for the whole ret- literature: some pups showed hair loss; some exhibited
ina. It should be noted that the final number of eyes used crooked tails, which probably indicates problems in the
for IHC is smaller than the one for immunoblotting be- development of the CNS [32, 33]; and some pups were
cause we only analyzed images from eyes that yielded at smaller and weighed less than the average for control
least ten perfectly labeled images. animals (Additional file 1: Figure S3). These characteris-
tics were either found in the whole litter or were re-
Statistical analyses stricted to one or two pups in the litter. All males were
Statistical tests were performed on the ERG data using used for the following experiments, independent of size,
Origin Pro 8 software (OriginLab) and Excel (Microsoft). weight, or appearance.Guimarães-Souza et al. Molecular Autism (2019) 10:19 Page 6 of 16
Behavioral evaluation of the VPA-exposed adolescent since all of them visited both chambers equally. Once
mice confirms anxiety and anti-social features the novel animal was introduced, VPA mice (n = 11) took
VPA mice did not show ambulatory deficits in the open field a longer time in comparison to CTR mice (n = 14) to visit
test [total distance traveled: 4612 ± 562 cm for CTR (n = 13; the chamber where the novel animal was placed (32 ± 16 s
one animal was not filmed due to technical problems) vs. for CTR vs. 67 ± 47 s for VPA; p = 0.016; Fig. 2d). After
4449 ± 800 cm for VPA (n = 9; two animals were not filmed the first interaction episode, VPA mice spent the same
due to technical problems); mean ± SD; p = 0.580; Fig. 2a]. time as CTR mice in the interaction area (118 ± 24 s for
However, in the central area, VPA animals ambulated less CTR vs. 97 ± 32 s for VPA; p = 0.076). However, they am-
(426 ± 156 cm for CTR vs. 262 ± 106 cm for VPA; p = 0.012; bulated around the novel animal significantly less than
Fig. 2b) and spent less time than CTR mice (23 ± 11 s for CTR CTR animals, indicating a lower level of energy or interest
vs. 13 ± 6 s for VPA; p = 0.015; Fig. 2c). The shorter time of to explore the cylinder with the novel mouse (2624 ± 803
VPA mice in the most aversive area of the open field was not cm for CTR vs. 1769 ± 747 cm for VPA; p = 0.012; Fig. 2e).
due to different traveling speed (19 ± 4 cm/s for CTR vs. 20 ± We found a significant decrease in the number of times
5 cm/s for VPA; p = 0.455). Conversely, animals of the VPA VPA animals approached the cage to sniff between bars
group preferred to explore the peripheral area for a longer towards the novel animal (social investigation) in relation
time (229 ± 16 s for CTR vs. 245 ± 19 s for VPA; p = 0.046), to CTR (nose poke events, 16 ± 3 for CTR vs. 10 ± 4 for
what may be interpreted as a higher anxiety trait in these mice VPA; p < 0.001; Fig. 2f). There was no statistically signifi-
(Additional file 1: Videos S1 and S2). cant difference between VPA and CTR in terms of total
In the social interaction experiment, VPA mice did not locomotion (5067 ± 1232 cm for CTR vs. 4210 ± 1342 cm
show specific interest for either chamber during the ini- for VPA; p = 0.110). In summary, these results suggest that
tial habituation period (before adding the novel animal), VPA adolescents have reduced interest to explore and
A B C
D E F
Fig. 2 Behavioral phenotype of adolescent (P29) VPA male mice. a–c In the open field test, VPA mice (n = 9; black bars) show similar total locomotor
activity and higher anxiety-like behaviors than CTR (n = 13; white bars); d–f in the social interaction test, VPA mice (n = 11; black bars) show reduced
interest to approach and to investigate (sniffing events) the novel animal than CTR mice (n = 14; white bars). Mean ± SEM, *p < 0.05, and ***p < 0.001.
In Additional file 1, see Figure S2 for area delimitation and representative videos for the open field (Videos S1 and S2) and social interaction test
(Videos S3 and S4)Guimarães-Souza et al. Molecular Autism (2019) 10:19 Page 7 of 16
socialize with other mice, confirming that they phenotyp- Hill fits to the data points). This would suggest that syn-
ically resemble individuals with ASD (Additional file 1: aptic transmission between photoreceptors and ON BCs,
Video S3 and S4). as well as ON BC activity itself, were not only intact, but
slightly supranormal, since they partially compensated for
ERGs of VPA-exposed animals are abnormal the smaller photoreceptor input: median Vmax was
As mentioned previously, VPA animals were significantly 763.9 μV for CTR vs. 646.8 μV for VPA (two-tailed
smaller and lighter than CTR mice (Additional file 1: Mann-Whitney U = 114, n1 > n2; p = 0.256; Fig. 3e); k was
Figure S3). Even though the dose of anesthetic was care- 1.46 ± 1.15 for CTR vs. 1.47 ± 0.67 for VPA (p = 0.971,
fully calculated for each animal, the mortality of VPA two-tailed t test; Fig. 3g); and median n was 0.31 for CTR
mice during the ERG experiments was much higher than vs. 0.34 for VPA (two-tailed Mann-Whitney U = 70, n1 > n2;
that of CTR (5 VPA animals vs. 0 CTR). Since the re- p = 0.347; Fig. 3h). Despite the smaller a-waves and lack of
cords of deceased animals were excluded from the ana- significant difference between the b-wave amplitude of
lysis in order to prevent artifacts (see the “Methods” CTR and VPA animals, the overall relationship between the
section), the final number of animals reported hence- b-wave amplitude and a-wave amplitude was not signifi-
forth for the VPA group (n = 6 animals, 12 eyes) is cantly changed in the VPA model (Fig. 3i-k; the median b/a
smaller than that of the CTR group (n = 9 animals, 15 ratio of each group, indicated by the dashed arrows in the
eyes; some records were excluded due to poor electrode cumulative histogram of Fig. 3k, was CTR 2.99 vs. VPA
contact, see the “Methods” section). 3.56, two-tailed Mann-Whitney U = 3771, n1 > n2; p = 0.62),
Although the ERG traces of VPA mice appeared at indicating that BCs indeed do not compensate completely
first glance similar to those of CTR animals, close in- for the smaller photoreceptor input.
spection revealed significant differences between groups. Finally, the mean OP areas in VPA mice (Fig. 4a, solid
Figure 3a presents the mean intensity-response relation- symbols) were similar to those in the CTR group (Fig. 4a,
ship of the a-wave for CTR (open symbols) and VPA open symbols) throughout the whole range of light inten-
(solid symbols) mice and shows that a-wave amplitudes sities tested (error bars are SEM), suggesting that the
were smaller in the VPA group, especially at higher inner retina compensated further for the smaller photo-
stimulus intensities (error bars are SEM, solid lines are receptor input in VPA animals, since OPs result from the
Hill fits to the data points). Indeed, the mean a-wave activity of ACs, which are neurons downstream of the
Vmax was significantly smaller for VPA animals (Vmax, BCs that generate the b-wave. At intensity #8, mean OP
377.3 ± 87.5 μV for CTR vs. 259.7 ± 121.1 μV for VPA; p areas were 698.7 ± 298.5 μV*ms vs. 712.3 ± 356.3 μV*ms
= 0.007, two-tailed t test; Fig. 3b), indicating that photo- for CTR and VPA groups, respectively (p = 0.921,
receptor activity is impaired in this group. On the other two-tailed t test, Fig. 4b); at intensity #13, mean OP areas
hand, the semi-saturation constant (k, 2.67 ± 0.50 log for were 1836.7 ± 874.4 μV*ms for CTR vs. 1971.6 ±
CTR vs. 2.52 ± 0.39 log for VPA; p = 0.415, two-tailed t 896.3 μV*ms for VPA (p = 0.725, two-tailed t test, Fig. 4b).
test; Fig. 3c) and slope (n, 0.79 ± 0.24 for CTR vs. 0.77 ± Because the a-wave of VPA animals was subnormal
0.26 for VPA; p = 0.839, two-tailed t test; Fig. 3d) of the (Fig. 3a, b), and the b-wave marginally subnormal (Fig. 3e,
a-wave intensity-response relationship were not signifi- f), but the OP area was similar to that of CTR (Fig. 4a),
cantly different between groups. Together, these results the relationship between OP area and the amplitudes of
suggest that VPA exposure did not affect photoreceptor the a- and b-waves was significantly altered in the VPA
sensitivity (quantified by k) or the degree of cooperativity group. In Fig. 4c, OP area is plotted vs. a-wave amplitude
between stimulus increment and the rate of closure of and vs. b-wave amplitude (Fig. 4d) for CTR animals (open
ionic channels in the photoreceptor membrane (quanti- symbols) and VPA mice (solid symbols) and shows that in
fied by n), but may have affected other aspects of the VPA-exposed animals OP areas are significantly larger
photoreceptor intracellular machinery, such as the amp- than in the CTR group in relation to their corresponding
lification or the inactivation of the phototransduction a-wave amplitudes (medians = 7.70 for CTR vs. 9.71 for
cascade (quantified by Vmax). Furthermore, since the VPA, two-tailed Mann-Whitney U = 3123, n1 > n2; p
a-wave receives mixed contribution from rods and cones = 0.023) and b-wave amplitudes (medians = 2.16 for CTR
[30, 34], which are active at low and high light levels, re- vs. 3.04 for VPA, two-tailed Mann-Whitney U = 2786,
spectively, and the effect reported here is more pro- n1 > n2; p = 0.0007) in the same trace (= same animal,
nounced at higher intensities, it seems likely that cones same eye, same intensity). Solid lines are linear fits to the
are more affected than rods in the VPA model. data (left graph: CTR adjusted R2 = 0.53, VPA adjusted R2
The mean b-wave amplitudes of VPA mice (Fig. 3e, = 0.62; right graph: CTR adjusted R2 = 0.46, VPA adjusted
solid symbols) were slightly smaller at higher intensities R2 = 0.66).
than those of the CTR group (Fig. 3e, open symbols), al- The latencies of the a- and b- waves and the kinetics
beit not significantly (error bars are SEM, solid lines are of OPs were unaltered in VPA mice (data not shown).Guimarães-Souza et al. Molecular Autism (2019) 10:19 Page 8 of 16 A B C D E F G H I J K Fig. 3 (See legend on next page.)
Guimarães-Souza et al. Molecular Autism          (2019) 10:19                                                                                  Page 9 of 16

 (See figure on previous page.)
 Fig. 3 VPA animals have significantly smaller a-waves than CTR. a Semi-log plot of a-wave mean amplitudes obtained at each light intensity for CTR (open
 symbols, n = 8 animals, 15 eyes) and VPA animals (solid symbols, n = 6 animals, 12 eyes). The solid lines are Hill fits to the data points. The a-wave
 amplitudes of the VPA group are smaller, especially at higher stimulus intensities. b The mean maximal a-wave amplitude (Vmax) of VPA is smaller than that
 of CTR mice (***p < 0.001). c, d The mean semi-saturation constant (k) and slope (n) of the a-wave intensity-response relationship for CTR vs. VPA are not
 significantly different. e Semi-log plot of b-wave mean amplitudes obtained at each light intensity for CTR (open symbols, same n as in (a–d)) and VPA
 animals (solid symbols, same n as in (a–d)). The solid lines are Hill fits to the data points. Although b-waves are slightly smaller in the VPA group, the
 difference did not reach statistical significance. f–h The mean maximal b-wave amplitude (Vmax), semi-saturation constant (k), and slope (n) of the b-wave
 intensity-response relationship for CTR vs. VPA are not significantly different. For all panels, error bars are SEM. i Amplitudes of the b-wave vs. the
 corresponding a-wave amplitude in the same trace for CTR (open symbols) and VPA mice (solid symbols). Solid lines are linear fits to the data (CTR:
 adjusted R2 = 0.64; VPA: adjusted R2 = 0.66). j The distributions of the ratios between the b-wave and a-wave in the same trace for CTR (open symbols)
 and VPA mice (solid symbols) are very similar. k Cumulative distribution of the ratios between the b-wave and a-wave in the same trace for CTR (open
 symbols) and VPA mice (solid symbols). Dashed arrows indicate the median of each group (same color code as the respective symbols)

Taken together, these results suggest that photoreceptor                        animals, mGluR5 labeling was relatively faint and diffuse
function is significantly altered in VPA male mice at this                      and confined to the synaptic layers of the retina (Fig. 5c).
stage in life and that there are adaptive mechanisms at                         However, retinas from VPA mice presented higher
play in both the outer and inner retina to compensate                           mGluR5 immunoreactivity in both OPL (CTR 289,483 ±
for their smaller photoreceptor responses, but with no                          107,387 fluorescence units vs. VPA 491,492 ± 222,137
effects on response kinetics.                                                   units; n = 6 each; paired t test, p = 0.010) and IPL (CTR
                                                                                357,344 ± 129,013 fluorescence units vs. VPA 514,333 ±
Decreased synapsin-1 expression in the retinas of                               234,008 units; n = 6 each; paired t test, p = 0.018; individ-
prenatally VPA-exposed mice                                                     ual data in Additional file 1: Table S2). In the IPL, labeling
We next evaluated the retinal expression of proteins re-                        in VPA retinas seemed to be more concentrated at the
lated to the synaptic function that have been previously                        inner IPL sublaminae. Figure 5d shows that the mean
related to ASD. Since autism is considered a synaptic dis-                      fluorescence signal of VPA retinas after normalization to
ease [35], the first molecule we analyzed was synapsin, a                       the respective CTR pair in the same microscope slide was
regulator of neurotransmitter release of conventional                           1.66 ± 0.28 times that of CTR retinas in the OPL and 1.41
synapses. Synapsin is only expressed in the IPL, being ab-                      ± 0.18 higher than that of CTR in the IPL. Accordingly,
sent in the OPL and in ribbon synapses in general [36]. As                      immunoblots also presented increased mGluR5 content in
expected, the synapsin-1 (SYN-1) antibody labeled exclu-                        VPA retinas in relation to CTR (CTR 0.10 ± 0.15
sively the IPL in both groups of animals (Fig. 5a). Labeling                    mGluR5/beta-actin OD, n = 7 vs. VPA 0.65 ± 0.52
was diffuse and relatively homogeneous throughout the                           mGluR5/beta-actin OD, n = 6; p = 0.022; Fig. 5h).
IPL in CTR and absent from the other retinal layers. VPA
mice exhibited a decreased and less diffuse labeling pat-                       Reduced retinal FMRP expression in the VPA model
tern in the IPL when compared to CTR, with areas of con-                        Since mGluR5 regulates the local translation of FMRP (fra-
centrated fluorescence in the vitread portion of the IPL.                       gile X mental retardation protein), and Fmr1−/− is a widely
Figure 5b quantifies this decrease in mean SYN-1 im-                            used animal model with ASD-like behaviors, we evaluated
munofluorescence in the VPA group after normalizing the                         FMRP in our VPA mice [37]. In CTR retinas, FMRP signal
signal from each VPA retinal section to its CTR pair in the                     was faint in the OPL and INL, and strong in the IPL and
same microscope slide and shows that fluorescence signal                        GCL (Fig. 5e); VPA mice exhibited a slightly (albeit not sig-
for the VPA group was 0.61 ± 0.21 times that of CTR ret-                        nificantly) higher FMRP immunoreactivity in the OPL
inas (CTR 577,648 ± 295,649 fluorescence units; VPA =                           (CTR 182,911 ± 36,194 fluorescence units vs. VPA 272,634
392,957 ± 294,104 units, n = 5 each, paired t test, p                           ± 91,881 units; n = 5 each; paired t test, p = 0.115) and INL
= 0.021, data in Additional file 1: Table S1). Consistent                       (CTR 132,693 ± 55,511 units vs. VPA 197,037 ± 109,890
with this observation, immunoblots of VPA retinas also                          units; n = 5 each; p = 0.218; Fig. 5e, f). On the other hand,
presented decreased SYN-1 content in comparison to                              FMRP labeling was significantly fainter in the IPL (CTR
CTR (0.91 ± 0.38 SYN-1/beta-actin OD for CTR, n = 7 vs.                         746,590 ± 213,539 vs. VPA 667,232 ± 255,715 units; n = 5
0.50 ± 0.3 SYN-1/beta-actin OD for VPA, n = 7; p = 0.026),                      each; paired t test, p = 0.050; Fig. 5e, f) and in the GCL of
as shown in Fig. 5g.                                                            VPA mice (CTR 360,906 ± 80,118 units vs. VPA 265,780 ±
                                                                                62,757 units; n = 5 each; paired t test, p = 0.020; Fig. 5e, f,
Retinas of VPA-exposed animals have increased mGluR5                            all individual data in Additional file 1: Table S1). Regard-
expression                                                                      ing the retina as a whole, immunoblots showed signifi-
MGluR5 is a group I metabotropic glutamate receptor im-                         cantly decreased FMRP content in the VPA mouse retina
plicated in the pathogeny of ASD [37]. In both groups of                        in comparison to CTR (CTR 0.70 ± 0.40 FMRP/beta-actin
Guimarães-Souza et al. Molecular Autism (2019) 10:19 Page 10 of 16
A B
2400
CTR 3000
CTR
VPA
OP area (μV*ms) VPA
OP area (μV*ms)
1800
1200
1500
600
0
0
-2 0 2 4 Int. 8 Int.13
log photons*μm-2*s-1
C D
4000 4000
CTR CTR
VPA VPA
OP area (μV*ms)
OP area (μV*ms)
2000 2000
0 0
0 300 600 0 500 1000
a-wave amplitude (μV) b-wave amplitude (μV)
Fig. 4 OP areas are similar in both groups. a Semi-log plot of mean OP areas (± SEM) obtained at each light intensity for CTR (open symbols, n = 8
animals, 15 eyes) and VPA animals (solid symbols, n = 6 animals, 12 eyes). Areas are similar at all intensities. b Mean OP areas obtained from CTR and VPA
animals at light intensity 8 (1.56 log photons*μm−2*s−1) and at light intensity 13 (4.09 log photons*μm−2*s−1). There was no significant difference between
groups. Error bars are SEM. c OP area vs. a-wave amplitude for CTR (open symbols) and VPA mice (solid symbols). d OP area vs. b-wave amplitude for CTR
(open symbols) and VPA mice (solid symbols). OP areas in VPA mice are significantly larger in relation to the a-wave amplitudes (*p = 0.023) and b-wave
amplitudes (***p = 0.0007) in the same trace than those of CTR animals
OD, n = 8 vs. VPA 0.31 ± 0.25 FMRP/beta-actin OD; n = 7; paired t test, p = 0.030) and GCL (CTR 449,120 ± 106,054
p = 0.05; Fig. 5i). fluorescence units vs. VPA 319,857 ± 110,109 units; n = 6
each; paired t test, p = 0.040; Fig. 6a, individual data in
Additional file 1: Table S1). Figure 6b shows that the mean
VPA-exposed animals have altered retinal expression of GABA-immunoreactive signal of VPA retinas after
proteins important for GABAergic function normalization was 0.81 ± 0.19 times that of CTR retinas in
It was reported that GABA releasing neurons in the mouse the IPL and 0.73 ± 0.23 times that of CTR in the GCL.
retina are likely to be restricted to several subtypes of AC A decreased GABA content in cells and synapses
in both the INL and GCL and a subtype of interplexiform might be caused by either diminished synthesis or in-
cell with processes in the OPL [38]. GABA immunoreac- creased release. In order to investigate the role of these
tivity was very faint and did not differ between groups in two factors in our results, we studied the retinal expres-
the OPL (CTR 100,986 ± 46,894 fluorescence units vs. sion of GAD (an enzyme involved in the synthesis of
VPA 89,227 ± 93,380 units; n = 6 each; paired t test, p GABA) and of the neuronal GABA transporter (GAT-1),
= 0.735) and in the INL (CTR 182,965 ± 57,403 fluores- responsible for both uptake and transporter-mediated
cence units vs. VPA 167,146 ± 51,914 units; n = 6 each; p GABA release in the retina [39]. GAD immunoreactivity
= 0.425; Fig. 6a). However, VPA retinas presented de- in CTR retinas was restricted to a diffuse labeling pat-
creased labeling in both IPL (CTR 671,074 ± 199,068 fluor- tern in the IPL that was decreased in VPA mice (CTR
escence units vs. VPA 545,808 ± 199,725 units; n = 6 each; 576,988 ± 230,994 fluorescence units vs. VPA 434,265 ±Guimarães-Souza et al. Molecular Autism (2019) 10:19 Page 11 of 16
A CTR VPA DAPI
B
SYN-1 1.5 SYN-1
ONL
VPA / CTR (IF)
1 CTR
OPL *
0.5
INL
IPL 0
IPL
GCL
C DAPI D
mGluR5 2 mGluR5
*
ONL
VPA / CTR (IF)
1.5 *
OPL
INL 1 CTR
IPL 0.5
OPL IPL
GCL
E DAPI
F
FMRP 2 FMRP
VPA / CTR (IF)
ONL
1.5
OPL INL
CTR
INL 1 *
*
IPL
0.5
GCL OPL INL IPL GCL
G H I
mGluR5 / β-actin (OD)
1 1 1
SYN-1 / β-actin (OD)
FMRP / β-actin (OD)
*
0.5
* 0.5 0.5
*
0 0 0
CTR VPA CTR VPA CTR VPA
kDa kDa kDa
SYN-1 77 mGluR5 132 FMRP 75
β-actin 42 β-actin 42 β-actin 42
CTR VPA CTR VPA CTR VPA
Fig. 5 (See legend on next page.)Guimarães-Souza et al. Molecular Autism (2019) 10:19 Page 12 of 16
(See figure on previous page.)
Fig. 5 Altered expression of SYN-1, mGluR5, and FMRP in the VPA retina. a Photomicrographs of CTR and VPA retinal sections immunolabeled for
synapsin-1 (SYN-1, red) and nuclei (DAPI, blue). SYN-1 immunoreactivity is located exclusively in the IPL in CTR and VPA mice and appears brighter in CTR.
Scale bar = 25 μm. b The mean SYN-1 immunofluorescence signal of VPA retinal sections (normalized to CTR ± SEM; n = 5 each) is significantly smaller
(*p = 0.021). c Photomicrographs of CTR and VPA retinal sections immunolabeled for mGluR5 (red) and nuclei (DAPI, blue). mGluR5 immunoreactivity is
confined to both synaptic layers in CTR and VPA mice and appears brighter in VPA retinas. Scale bar = 25 μm. d The mean mGluR5 immunofluorescence
of VPA retinal sections (normalized to CTR ± SEM; n = 6 each) is significantly larger in the OPL (*p = 0.010) and IPL (*p = 0.018). e Photomicrographs of CTR
and VPA retinal sections immunolabeled for FMRP (red) and nuclei (DAPI, blue). FMRP immunoreactivity is strong in the IPL and GCL in CTR mice and
fainter in VPA animals. Scale bar = 25 μm. f The mean FMRP signal in VPA retinal sections (normalized to CTR ± SEM; n = 5 each) is significantly reduced in
the IPL (*p = 0.050) and GCL (*p = 0.020). The red dashed lines in panels b, d, and f) represent the value for CTR (= 1). g Top: Mean optical density
(± SEM) of SYN-1 in immunoblots of CTR (white bar, n = 7) and VPA (black bar, n = 7) retinas, normalized to the beta-actin signal (*p = 0.026). Bottom:
Representative SYN-1 bands (77 kDa) and the corresponding beta-actin bands (42 kDa) of CTR vs. VPA. h Top: Mean optical density (± SEM) of the mGluR5
signal in immunoblots of CTR (white bar, n = 7) and VPA (black bar, n = 6) retinas, normalized to the beta-actin signal (*p = 0.022). Bottom: Representative
mGluR5 bands (132 kDa) and the corresponding beta-actin bands (42 kDa) of CTR vs. VPA. i Top: Mean optical density (± SEM) of the FMRP
immunofluorescence in blots of CTR (white bar, n = 8) and VPA (black bar, n = 7) retinas, normalized to the beta-actin signal (*p = 0.050). Bottom:
Representative FMRP bands (75 kDa) and the corresponding beta-actin bands (42 kDa) of CTR vs. VPA
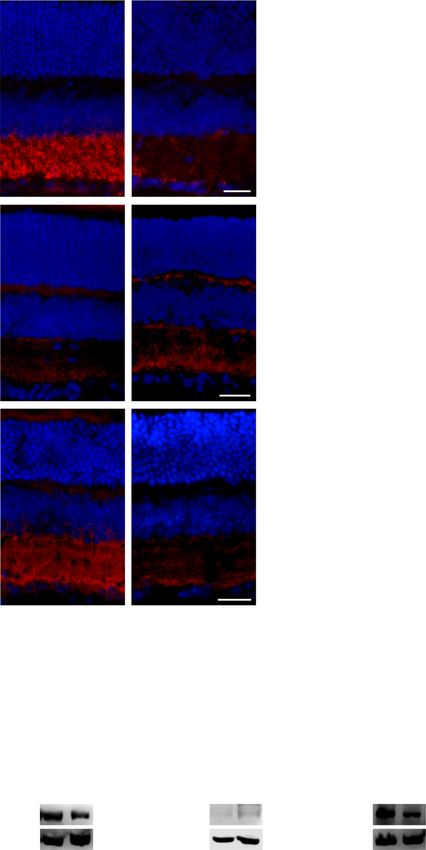
A CTR VPA DAPI
B
GABA 1.5
GABA
ONL
VPA / CTR (IF)
CTR
1
* *
OPL
0.5
INL
IPL 0
OPL INL IPL GCL
GCL
C DAPI D E
1.5 kDa
GAD GAD
GAD 65/67
ONL 1
VPA / CTR (IF)
β-actin
GAD / β-actin (OD)
1 42
CTR
OPL * CTR VPA
0.5
INL 0.5 **
IPL 0 0
IPL CTR VPA
GCL
F DAPI
G
GAT-1 1.5 GAT-1
ONL
VPA / CTR (IF)
1 CTR
OPL
INL 0.5
IPL
0
GCL IPL
Fig. 6 Decreased GABA and GAD expression in the VPA retina. a Photomicrographs from CTR and VPA retinal sections showing immunolabeling for
GABA (red) and cell nuclei (DAPI, blue). The GABA antibody labels somas in the INL and GCL and bands of immunoreactive processes in the IPL. Scale
bar = 25 μm. b Mean GABA fluorescence in VPA retinas relative to CTR (± SEM; n = 6 pairs) in the OPL (p = 0.735), INL (p = 0.425), IPL (*p = 0.030), and
GCL (*p = 0.040). c Photomicrographs of sections from CTR and VPA retinas showing immunolabeling for GAD (red) and nuclei (DAPI, blue). GAD
immunoreactivity is located in the IPL. Scale bar = 25 μm. d Mean GAD fluorescence in VPA retinas relative to CTR (± SEM; n = 5 pairs, *p = 0.037). e Left:
Mean optical density (± SEM) of the GAD immunofluorescence in blots of CTR (white bar, n = 8) and VPA (black bar, n = 7) retinas, normalized to the
beta-actin signal (**p = 0.007). Right: Representative GAD bands (65/67 kDa) and the corresponding beta-actin bands (42 kDa) of CTR vs. VPA. f
Photomicrographs of sections from CTR and VPA retinas showing immunolabeling for GAT-1 (red) and nuclei (DAPI, blue). GAT-1 immunoreactivity is
diffusely distributed throughout the IPL. Scale bar = 25 μm. g Mean GAT-1 signal in VPA retinas relative to CTR (± SEM; n = 5 pairs, p = 0.973). The red
dashed lines in b, d, and g represent the value for CTR (= 1)Guimarães-Souza et al. Molecular Autism (2019) 10:19 Page 13 of 16
313,477 units; n = 5 each; paired t test, p = 0.040; Fig. 6c, light-adapted ERGs, which reflect cone and cone-driven
d); the IPL was a region in which GABA content was activity in the retina, are more altered than dark-adapted
also reduced in VPA animals (Fig. 6a, b). Figure 6d ERGs, which reflect rod and rod-driven activity [45].
shows that the mean GAD immunofluorescence of VPA Further analogies with work in humans are however
retinas after normalization was 0.65 ± 0.34 times that of harder at this point, due to the scarcity of literature and
CTR in the IPL. The total retinal GAD content was also to the small and inhomogeneous samples inherent to
decreased in VPA mice (CTR 0.67 ± 0.20 GAD/beta-actin available studies.
OD, n = 8 vs. VPA 0.36 ± 0.18 GAD/beta-actin OD, n = 7; On top of that, both the b-wave and the OPs appear nor-
p = 0.007; Fig. 6e). On the other hand, neither the GAT-1 mal in the VPA model, despite the smaller a-wave and pos-
immunoreactivity pattern nor its intensity was altered in sible decreased photoreceptor input to BCs and from BCs
VPA mice in relation to CTR; labeling was diffusely distrib- to ACs. These results indicate that adaptive changes are
uted throughout the IPL in both groups (CTR 749,768 ± probably taking place in both synaptic layers of the retina
51,331 fluorescence units vs. VPA 745,521 ± 238,720 units; in order to adjust the gain of these synapses and to com-
n = 5 each; paired t test, p = 0.973; Fig. 6f, g, individual data pensate for the smaller photoreceptor input. Comparatively
in Additional file 1: Table S1). Therefore, the GABA de- similar compensatory mechanisms in the signal transmis-
crease found in VPA-exposed mice is likely to be due to its sion from the outer to the inner retina were also described
diminished synthesis rather than its increased release or re- in the ERGs of the Fmr1−/− mouse [43, 44] and were shown
duced uptake. to have very early onset in development [44]. Our ERG re-
sults are therefore consistent with the work of others and
Discussion also with the altered expression of synaptic proteins in the
In this paper, we show that VPA-exposed pups are smaller outer and inner retina of VPA mice that we report here.
and lighter than CTR animals and present behavioral However, one cannot at this point establish causality, be-
traits consistent with an ASD model. As previously shown cause the exact function of several of these proteins is still
by other groups [24, 25], intra-uterine exposure to VPA unknown in the retina, as discussed below. It is of note,
induces more anxiety-like behaviors and reduced social however, that the magnitude of alterations observed seems
interest in male rodents, allowing us to consider them a larger at the protein level than at the functional level, which
valid phenotypic ASD model. Several structures and or- raises the question of how substantial a structural change
gans have been studied in these animals, such as the must be for it to translate into a sizeable effect.
hippocampus [40], the cortex [41], and the liver [42], but Since ASD has been considered a synaptic disorder, the
this is the first study to explore the retina. first molecule we analyzed was synapsin-1 (SYN-1), a mem-
We here report that the ERGs of VPA mice are signifi- ber of the synapsin family of phosphoproteins essential for
cantly altered in comparison to those of CTR animals. the fine-tuning of synaptic plasticity. SYN-1 is a crucial regu-
The a-wave amplitudes are smaller at higher light levels. lator of neurotransmitter release at pre-synaptic compart-
This effect is unlikely to result from photoreceptor loss, ments of both excitatory and inhibitory conventional
since the thickness of the outer nuclear layer (ONL) is synapses (reviewed in [46]). An important role for molecular
similar in both mouse groups (i.e., compare CTR and processes shaping higher brain functions was suggested by
VPA photomicrographs in Figs. 5 and 6) and since the the observed phenotypes of synapsin null mutants. The ab-
sensitivity (k) and slope (n) of the a-wave intensity-re- sence of syn genes induced behavioral alterations in mice
sponse relation are unchanged in the VPA model. Such a similar to those observed in ASD [47].
decrease in the maximal amplitude with no concomitant According to previous reports, SYN-1 is expressed by
change in the sensitivity or gain of the ERG a-wave was ACs the IPL, being absent from ribbon synapses in the
also described in the Fmr1−/− mouse, an animal model outer and inner retina [36, 48]. It is important for the
with ASD-like behaviors that lacks the FMRP protein, proper development of connections between cells in the
among other retinal alterations [43, 44], and points to INL and GCL [49]. The decreased SYN-1 expression
the possibility that the phototransduction machinery that we find in VPA mice might indicate a less devel-
within photoreceptors may be changed in the VPA oped inner retina, with immature or decreased number
model. Furthermore, since (i) the a-wave is contributed of connections. Therefore, our experimental model pro-
to by both rods and cones [30, 34], (ii) rods contribute duces in the retina a pattern of reduced SYN-1 expres-
more to the ERG at low light levels, whereas cones con- sion reported in the pathogenesis of ASD [50].
tribute more at higher light levels [30, 34], and (iii) our It is known that mGluR5-enhanced activity mediates
results show a larger effect at high light intensities, it is some of the behavioral characteristics observed in ASD
likely that cones are more affected than rods in patients, and mGluR5 antagonists have been studied as
VPA-exposed animals. This interpretation is supported possible therapeutic agents for autism disorders [37]. In-
by the finding in individuals with ASD that the deed, increased mGluR5 has been shown in the retinasGuimarães-Souza et al. Molecular Autism (2019) 10:19 Page 14 of 16
of the Fmr1−/− mouse [43], suggesting that it is likely to glutamatergic, and GABAergic markers in both synaptic
be a common feature of ASD models. We have also layers of the retina. Importantly, these animals present
found increased mGluR5 immunoreactivity in the ret- significant alterations in the full-field scotopic ERG, sug-
inas of VPA-exposed mice. Retinal functions for mGluR5 gesting photoreceptor dysfunctions, with cones probably
are probably manifold. In the outer retina, pharmaco- more affected than rods. These functional alterations are
logical activation of group I mGluRs (which include accompanied by compensatory mechanisms in the
mGluR1 and mGluR5) leads to closure of the K+ con- post-receptoral circuitry, which are consistent with the
ductance in Müller cells [51]; because glutamate uptake structural changes that we report in this model and in
from these glial cells is controlled both by voltage and the literature dealing with other ASD models [43, 44]. It
by their internal K+ concentration [52, 53], it was sug- remains to be shown how these animals respond to dif-
gested that increased mGluR5 expression could lead to ferent stimulation protocols, such as the photopic and
changes in local glutamate homeostasis [54]. In the inner pattern ERGs, which test cone-driven pathways and the
retina, group I mGluRs may modulate GABA release inner retina, respectively [62, 63]. Also, since the actual
from ACs [39]; mGluR5, specifically, appears to have ef- role of the proteins related to ASD in the retina is still
fects onto GABAA receptor function in cultured ACs unknown, it would be interesting to examine the retinal
[55]. Therefore, the increased expression of mGluR5 in anatomy and physiology of transgenic mice lacking or
VPA animals could potentially induce changes in both overexpressing these proteins in order to establish their
glutamatergic and GABAergic signaling pathways. importance for retinal function and vision. Finally, our
Several proteins related to the GABAergic system are results clearly confirm that the retina is an accessible
reduced in individuals with fragile X syndrome [56, 57]. window to study brain wiring and function in both
In our study, we observed a decrease in GABA and health and disease. It can thus provide invaluable insight
GAD expression in the IPL of animals prenatally ex- into the underpinnings of psychiatric disorders and sub-
posed to VPA, but not in neuronal transporter GAT-1, serve translational approaches aiming to diagnose and
suggesting that the GABAergic activity in the retina treat such conditions.
could be decreased due to diminished GABA synthesis.
Alternatively, the higher expression of mGluR5 in VPA Additional file
retinas could lead to an increase in transporter-mediated
GABA release from ACs [39], which would in turn Additional file 1: Figure S1. Experimental design. IHC:
translate into GABA content inside these neurons. immunohistochemistry; WB: Western blotting; BH: behavioral experiments;
ERG: electroretinogram. Figure S2. Chambers used for the behavioral assays
Genetic mutations that lead to decreased FMRP cause
in our study. Figure S3. VPA-exposed animals are smaller and lighter than
fragile X syndrome, the most commonly known inherited CTR mice. Video S1. Representative CTR animal in the open field test. The
form of intellectual disability (ID), which has an ASD video shows the first 3 min of exploration. Video S2. Representative VPA ani-
mal in the open field test. The video shows the first 3 min of exploration.
diagnosis associated in some patients [58]. FMRP is an
Video S3. Representative CTR animal in the social interaction test. Video S4.
RNA-binding protein that regulates local protein synthesis Representative VPA animal in the social interaction test. Table S1. Arbitrary
in the synapse when dephosphorylated by mGluR5 [59]. fluorescence units obtained from individual retinas. Results from CTR and VPA
pairs (shown in the same line) were processed together on the same day.
Low FMRP expression causes the excessive synthesis of
Statistics were performed through a paired Student’s t test to take into consid-
proteins that should only be translated upon mGluR5 acti- eration the fact that results in different lines are attributed to signal variation
vation, a phenomenon that leads to protein accumulation between experiments. (DOCX 6386 kb)
and consequent synaptic disturbance [59, 60]. FMRP is
present in the retina and its expression is lower in Abbreviations
dark-adapted conditions than after light adaptation [61]. AC: Amacrine cell; ASD: Autism spectrum disorders; CNS: Central nervous system;
ERG: Electroretinogram; FMRP: Fragile X mental retardation protein;
Therefore, FMRP expression changes might lead to alter-
GABA: Gamma-aminobutyric acid; GAD: Glutamic acid decarboxylase; GAT-
ations in physiological responses of retinal neurons. In 1: Sodium- and chloride-dependent GABA transporter 1; GCL: Ganglion cell
fact, Fmr1−/− animals present functional changes in both layer; GSK-3 beta: Glycogen synthase kinase-3 beta; HDAC: Histone deacetylase;
INL: Inner nuclear layer; IPL: Inner plexiform layer; mGluR5: Metabotropic
outer and inner retinal anatomy and function [43, 44]. Ac-
glutamate receptor 5; NMDA: N-methyl-D-aspartate receptor; OD: Optical density;
cordingly, our results show that not only does the retina ON BC: Depolarizing bipolar cell; ONL: Outer nuclear layer; OPL: Outer plexiform
of the VPA-exposed mice express less FMRP than control layer; OPs: Oscillatory potentials; P30: Postnatal day 30; SYN-1: Synapsin-1;
VPA: Valproic acid
mice, but it also displays morphological and physiological
features similar to the Fmr1−/− model.
Acknowledgements
We thank Adilson da Silva Alves for the technical support, Alicia Tamais, Ariádne
Conclusion Belo, Bruna Genisa and Fernanda Miki Honda for helping with the behavioral
In summary, we conclude that male adolescent mice experiments, Ricardo Tiosso Panassiol and André Mauricio Passos Liber for
helping with the ERGs, and Monique Patrício Singulani for helping with estrous
born from VPA-injected dams display ASD-like behav- cycle assessment. We would also like to thank Dr. Karin Calaza for providing
iors and show altered expression of synaptic, some antibodies, Dr. Rafael Linden and Dr. Hilda Petrs for kindly providing VPA,You can also read