Chemical discrimination of the particulate and gas phases of miniCAST exhausts using a two-filter collection method
←
→
Page content transcription
If your browser does not render page correctly, please read the page content below
Atmos. Meas. Tech., 13, 951–967, 2020
https://doi.org/10.5194/amt-13-951-2020
© Author(s) 2020. This work is distributed under
the Creative Commons Attribution 4.0 License.

Chemical discrimination of the particulate and gas phases of
miniCAST exhausts using a two-filter collection method
Linh Dan Ngo1,2 , Dumitru Duca1 , Yvain Carpentier1 , Jennifer A. Noble1,a , Raouf Ikhenazene1 , Marin Vojkovic1 ,
Cornelia Irimiea3 , Ismael K. Ortega3 , Guillaume Lefevre4 , Jérôme Yon4 , Alessandro Faccinetto2 , Eric Therssen2 ,
Michael Ziskind2 , Bertrand Chazallon2 , Claire Pirim1 , and Cristian Focsa1
1 Univ.Lille, CNRS, UMR 8523 – PhLAM – Laboratoire de Physique des Lasers Atomes et Molécules, 59000 Lille, France
2 Univ.Lille, CNRS, UMR 8522 – PC2A – Physicochimie des Processus de Combustion et de l’Atmosphère,
59000 Lille, France
3 ONERA – The French Aerospace Laboratory, 91123 Palaiseau, France
4 Normandie Univ., INSA Rouen, UNIROUEN, CNRS, CORIA, 76000 Rouen, France
a now at: CNRS, Aix Marseille Université, PIIM, UMR 7345, 13397 Marseille CEDEX, France

Correspondence: Yvain Carpentier (yvain.carpentier@univ-lille.fr)

Received: 13 July 2019 – Discussion started: 5 September 2019
Revised: 4 January 2020 – Accepted: 18 January 2020 – Published: 28 February 2020

Abstract. Combustion of hydrocarbons produces both               reveal how subtle changes in combustion parameters affect
particulate- and gas-phase emissions responsible for ma-         particle surface chemistry.
jor impacts on atmospheric chemistry and human health.
Ascertaining the impact of these emissions, especially on
human health, is not straightforward because of our rela-
tively poor knowledge of how chemical compounds are par-         1   Introduction
titioned between the particle and gas phases. Accordingly,
we propose coupling a two-filter sampling method with a          Particulate matter (PM) produced by incomplete combustion
multi-technique analytical approach to fully characterize the    of hydrocarbon-based fuels is often found associated with
particulate- and gas-phase compositions of combustion by-        gas-phase compounds that include carbon and nitrogen ox-
products. The two-filter sampling method is designed to re-      ides (CO, CO2 , and NOx ), along with a volatile fraction of
tain particulate matter (elemental carbon possibly covered       organic species encompassing low-mass polycyclic aromatic
in a surface layer of adsorbed molecules) on a first quartz      hydrocarbons (PAHs). The presence of PAHs in the atmo-
fiber filter while letting the gas phase pass through and then   sphere is of great concern due to their carcinogenic and mu-
trap the most volatile components on a second black-carbon-      tagenic potential (Kim et al., 2013). In fact, in the current
covered filter. All samples thus collected are subsequently      European air quality legislation (European Fourth Air quality
subjected to a multi-technique analytical protocol involv-       Daughter Directive 2004/107/EC), seven potentially harmful
ing two-step laser mass spectrometry (L2MS), secondary ion       PAHs must, at least, be monitored, but restrictions on PAH
mass spectrometry (SIMS), and micro-Raman spectroscopy.          concentrations are currently solely limited to benzo[a]pyrene
Using the combination of this two-filter sampling–multi-         because of its recognized high toxicity (annual target value
technique approach in conjunction with advanced statistical      of 1 ng m−3 in the PM10 particulate-phase fraction; Pandey
methods, we are able to unravel distinct surface chemical        et al., 2011). However, it is the conjunction of the PM intrin-
compositions of aerosols generated with different set points     sic physicochemical properties (e.g., nature of adsorbed PAH
of a miniCAST burner. Specifically, we successfully dis-         – Dachs and Eisenreich, 2000 – or water affinity) with pres-
criminate samples by their volatile, semi-volatile, and non-     sure, temperature, hygrometric variations, or aging processes
volatile polycyclic aromatic hydrocarbon (PAH) contents and      in the atmosphere that ultimately condition phase partition-
                                                                 ing (free vs. bound fraction; Ravindra et al., 2006). Con-

Published by Copernicus Publications on behalf of the European Geosciences Union.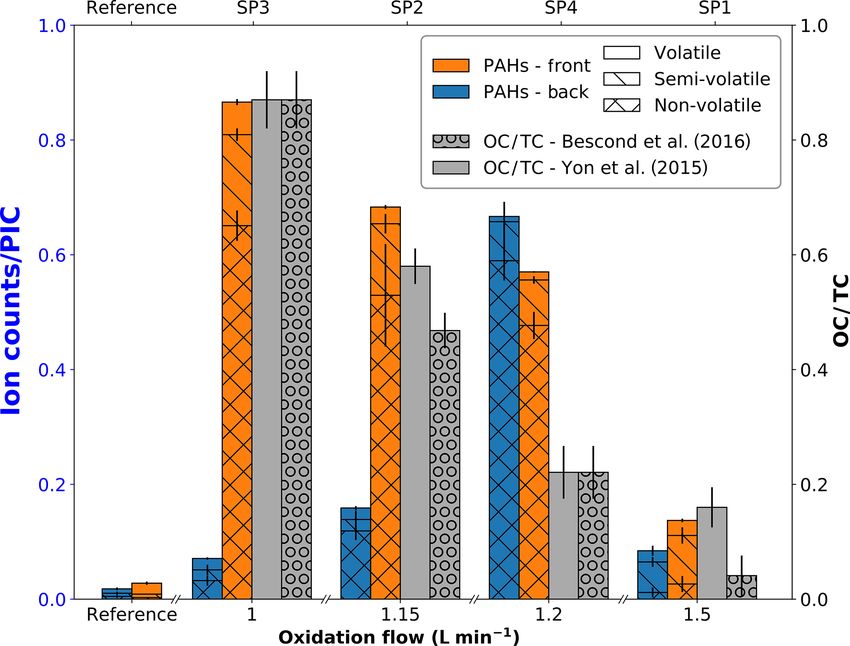
952                    L. D. Ngo et al.: Chemical discrimination of the particulate and gas phases of miniCAST exhausts

sequently, gas-phase PAHs which are relatively abundant –          characterizing the particulate and gas phases can thus be ex-
yet known to bear only weak carcinogenic or mutagenic ef-          tremely useful when evaluating the impact of various sources
fects (Nisbet and LaGoy, 1992) – can further react through         (aircraft jet engines, wood combustion stoves, biomass burn-
gas-phase processes or heterogeneous gas–PM exchanges to           ing) on the environment, as the gas–particulate partitioning
produce noxious oxy- or nitro-PAHs, for instance (Atkinson         conditions the overall reactivity. The two-filter method pre-
and Arey, 1994; Bandowe et al., 2014). PAHs emitted in ex-         sented here can therefore be utilized to assess the efficiency
hausts, in either the gas phase or the particulate phase, must     of after-treatment systems, which are known to successfully
be analyzed and fully characterized at the same time to bet-       remove the majority of particle-bound organic species from
ter understand their deposition mechanism or chemical trans-       the surface, which results in increasing the elemental car-
formation in the atmosphere and help ascertain their overall       bon (EC) to organic carbon (OC) contribution (Focsa et al.,
toxicity and impact on human health.                               2019). Time-of-flight aerosol mass spectrometry (ToF-AMS)
   Several methods allowing the concomitant sampling of            has been used in the past by Ferge et al. (2006) and Mueller
airborne PAHs in both the gas and particulate phases have          et al. (2015) to study PAH formation in a CAST generator at
been developed in recent decades (see, for example, the re-        different oxidation flows. However, because only the particle
views by Pandey et al., 2011; Szulejko et al., 2014; Munyeza       phase has been analyzed, no information about the gas-phase
et al., 2019). The sampling protocol starts with the choice        composition can be derived in these experiments, which pro-
of a suitable sorbent material to either solely capture the va-    vide only an incomplete picture of the PAH family emitted
por phase or solely retain PM. The former sorbent material         in the exhausts.
mostly consists of polyurethane foam, resins, or graphitized          In this work, we coupled a two-filter sampling method
carbon black mesh, whereas the latter is made of glass fiber,      with a multi-technique analytical approach to fully charac-
quartz fiber, or Teflon. The sorbents are placed in series,        terize the particulate- and gas-phase compositions of com-
i.e., one after the other in the exhaust line. The soluble or-     bustion by-products. The two-filter collection method is in-
ganic fraction is then extracted off-line from the sorbent (fil-   tended to separate the particulate phase (front filter) from
ter and/or resin) for subsequent gas chromatography–mass           the gas phase (back filter) using fibrous filtration media
spectrometry (GC–MS) analyses (An et al., 2016; Elghawi            (quartz fiber filters – QFFs). Once collected, the filters are
et al., 2010; Sun et al., 2006). However, such solvent extrac-     analyzed using a multi-technique approach encompassing
tion methods exhibit recovery rates that are highly depen-         two-step laser mass spectrometry (L2MS), secondary ion
dent upon the technique applied and the nature of PAHs a           mass spectrometry (SIMS), and micro-Raman spectroscopy.
priori present. Accordingly, the GC–MS method, which re-           The L2MS technique has been extensively developed in our
lies on solvent extraction methods and calibration standards,      group (at the University of Lille, PhLAM laboratory) over the
is a time-consuming technique which is inherently more             last decade to specifically probe the chemical composition
sensitive towards compounds having the greatest solubil-           of combustion by-products (Delhaye et al., 2017; Faccinetto
ity. To circumvent this limitation, solvent-free methods have      et al., 2011, 2015; Moldanová et al., 2009; Popovicheva et
been recently developed based on thermal desorption (e.g.,         al., 2017). Its high sensitivity and selectivity towards specific
Villanueva et al., 2018), microwave-assisted desorption, or        classes of compounds owing to different ionization schemes
solid-phase micro-extraction (Szulejko et al., 2014). How-         makes it an extremely valuable analytical tool that can be
ever, because sampling substrates may differ for PM and gas        adapted to various samples. Using three different ionization
trapping, and often necessitate extraction techniques before       wavelengths, it is possible to target various classes of com-
characterization whose efficiencies are substrate-dependent,       pounds such as aromatic and aliphatic compounds. In addi-
results obtained for the two phases may be difficult to com-       tion, it is possible to reach a sub-femtomole limit of detection
pare and do not necessarily represent the whole PAH family         for PAHs upon specific desorption and ionization conditions
making up either filter.                                           (Faccinetto et al., 2011, 2015). The laser desorption process
   The CAST (Combustion Aerosol Standard) generator is             along with its coupling with the subsequent ionization step
often chosen to produce combustion-generated particles as it       have been optimized over the years (Faccinetto et al., 2008;
is easy to implement for systematic laboratory experiments,        Mihesan et al., 2006, 2008) and ensure a soft removal (with
with the fuel and oxidation air flows being easily modifi-         minimum internal energy excess) of molecules adsorbed on
able, enabling the investigation of a variety of chemistries.      the particle surface, while avoiding/limiting both their frag-
A miniCAST soot generator operated with different parame-          mentation and the in-depth damaging of the underlying car-
ters as a source of combustion by-products can mimic some          bon matrix (Faccinetto et al., 2015). L2MS spectra obtained
of the physicochemical properties of aircraft emissions, for       in this work are additionally reinforced with the SIMS spec-
example (Bescond et al., 2014; Marhaba et al., 2019; Moore         tra of deposited miniCAST PM, with no sample preparation
et al., 2014). The observations derived from soot produced         prior to the analyses since the particulate matter is preferen-
with this generator hence allows for potential real-world ex-      tially trapped on the front filter. Subtle differences and simi-
trapolations, especially for combustion devices not equipped       larities between front and back filters are revealed using mass
with after-treatment systems. Concomitantly sampling and           spectrometry measurements (L2MS and SIMS) and the re-

Atmos. Meas. Tech., 13, 951–967, 2020                                                  www.atmos-meas-tech.net/13/951/2020/
L. D. Ngo et al.: Chemical discrimination of the particulate and gas phases of miniCAST exhausts                                953

cently developed advanced statistical methodologies (Duca          roughly estimate that the MPPS for the “front filter” is be-
et al., 2019; Irimiea et al., 2018, 2019) based on principal       low 100 nm. Two filters were used for each sampling period:
component analysis (PCA).                                          the front filter was a bare QFF placed in the exhaust line; the
                                                                   “back filter” was a QFF covered with a thin layer of black
                                                                   carbon (Pureblack 100 Carbon, Columbian Chemicals Com-
2     Experimental methods                                         pany, specific surface area 80–150 m2 g−1 ) and placed 3.5 cm
                                                                   downstream of the front filter in the sampling line. Prior to
2.1    Sample collection                                           sampling, the back filter was heated in an oven at 150 ◦ C
                                                                   for 16 h to remove pre-adsorbed species. Back filters thus
PM was sampled from the exhaust of a miniCAST genera-              produced were shown to yield no signal when analyzed by
tor (5201c) from Jing Ltd., as described previously in Yon         L2MS. Black carbon has previously been used as a matrix
et al. (2018), for example. Briefly, the miniCAST contains a       upon which pure PAHs were adsorbed for mass spectromet-
propane–nitrogen flame with operating conditions controlled        ric analysis of soot surrogates (Faccinetto et al., 2011, 2015).
by the flow rates of propane, nitrogen, oxidation air (Qair ),     In the same studies, black-carbon-covered filters were also
and dilution air. The working points used in this study (and       used to sample the volatile fraction in flames. In the present
others in this series; Bescond et al., 2014; Ouf et al., 2016;     study, the sampling line was designed to collect PM (includ-
Yon et al., 2015) are detailed in Fig. 1. The main difference      ing adsorbed species) on the front filter (FF) and to trap gas-
between these working points is the oxidation air flow and         phase molecules from the remaining exhaust on the back fil-
– for the SP4 point – nitrogen dilution, with an increasing        ter (BF, Fig. 1). Note that particle buildup on the front fil-
oxidation air flow in the order Qair        air      air    air
                                     SP3 < QSP2 < QSP4 < QSP1 .    ter could potentially increase its filtration efficiency and con-
Note that the sole dilution system in our experimental setup       sequently trap PAHs that would instead pass through if the
is that of the miniCAST generator itself (dilution airflow         thickness of the PM collected on the front filter were not as
20 L min−1 , Fig. 1). The samples were deposited on quartz         high. Alternatively, species originally adsorbed on the PM
fiber filters (QFFs, Pall Tissuquartz QAT-UP 2500) using a         can also be desorbed during the sampling and be retained on
specially designed sampling line (as illustrated in Fig. 1). A     the back filter, which would lead to an overestimation of the
bypass line parallel to the sampling system has been added         gas-phase fraction (Paolini et al., 2017). However, our results
to ensure the miniCAST is maintained at atmospheric pres-          will show that if this is the case, only specific PAHs of inter-
sure. These QFFs are typically used in soot collection, for        mediate volatility are impacted by this phenomenon. In addi-
example in studies of aircraft PM (Delhaye et al., 2017), and      tion, this effect would not affect our statistical analysis (i.e.,
are also employed when deriving organic carbon to total car-       the covariance between mass peaks (m/z)) as similar diffu-
bon ratios (OC/TC) of deposited soot (Bescond et al., 2016;        sion behaviors can be expected within SP1 and SP3 samples,
Yon et al., 2015). QFFs are chosen because they proved to be       which exhibit similar soot porosity (e.g., the porosity of the
highly efficient in capturing combustion emissions and they        soot material deposited on silicon wafers for SP1 and SP3 set
have a stable penetration curve among other filters when a         points were calculated to be about 98.1 % and 97.4 %, respec-
range of physical parameters are varying in the sampling line      tively; Ikhenazene et al., 2020). We therefore expect, from
(Zíková et al., 2015). From a theoretical point of view, it is     a statistical standpoint, that for each given m/z, the covari-
very difficult to predict the collection efficiency of QFF for     ance will only negligibly be affected by diffusion. Sampling
particles within the nanometer size domain, as generated in        was performed for 20 min per working point. “Reference”
our combustion conditions (e.g., 99–166 nm modal diameter;         samples (front and back filters) were collected by running
Bescond et al., 2016). Filter collection efficiency is directly    the miniCAST generator for only 2 min under set point SP1
related to inertial impaction, direct interception, Brownian       conditions. These samples represent pre-stabilization burner
diffusion, and electrostatic forces (Brochot et al., 2019; Lind-   conditions. They were collected as a reference to ensure that
sley, 2016; Zíková et al., 2015). The resulting component of       the samples were not impacted by this early combustion
these forces is translated into a function that displays near-     phase, and the loading on these reference samples was much
100 % collection efficiency for particles smaller than 20 nm       lower. After collection, samples were placed in watch glasses
and larger than 300 nm. The minimum collection efficiency,         covered with Al foil and stored at 4 ◦ C prior to analysis.
which is also referred to as the most penetrating particle size
(MPPS), is obtained for the 100–300 nm size range. How-            2.2   Two-step (desorption–ionization) laser mass
ever, some studies showed that the MPPSs for QFF may peak                spectrometry
around 60 nm and are possibly < 100 nm for other fibrous me-
dia (Brochot et al., 2019; Zíková et al., 2015). While these       Samples were analyzed using a two-step laser mass spec-
measured values are mostly influenced by both the flow ve-         trometry (L2MS) technique built in-house (Mihesan et al.,
locity in the sampling line and the pressure drop at the sur-      2008). Briefly, the soot sample is introduced into the analy-
face of the filter, our flow conditions are close to those used    sis chamber (10−8 mbar) via a preparation chamber, where
in the work of Zíková et al. (2015). Consequently, we can          it is pre-cooled by a constant flow of liquid nitrogen in the

www.atmos-meas-tech.net/13/951/2020/                                                    Atmos. Meas. Tech., 13, 951–967, 2020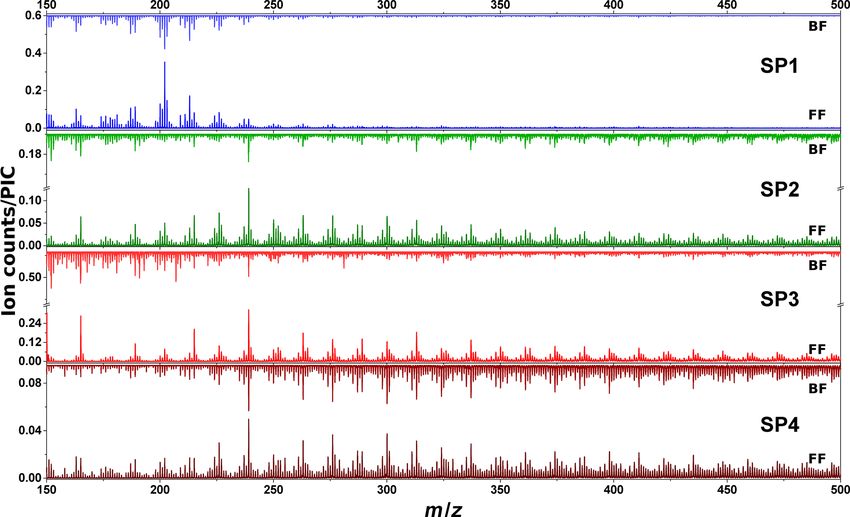
954                    L. D. Ngo et al.: Chemical discrimination of the particulate and gas phases of miniCAST exhausts

                                                                   mass analyzed in a 1.72 m long reflectron ToF-MS (RM Jor-
                                                                   dan) with a mass resolution of m/1m 1000. Ion detector sig-
                                                                   nals are recorded using a digital oscilloscope (LeCroy Wa-
                                                                   verunner 9350AM) at a time resolution of 4 ns per point.
                                                                   Each spectrum corresponds to an average of at least 200 des-
                                                                   orption shots at different locations on the sample. A set of
                                                                   three spectra was obtained for each miniCAST sample (front
                                                                   and back filters) and each ionization scheme. Therefore, in
                                                                   total, 18 spectra were obtained for each miniCAST set point.

                                                                   2.3   Secondary ion mass spectrometry

                                                                   Time-of-flight secondary ion mass spectrometry analysis was
                                                                   conducted with the TOF.SIMS5 instrument from IONTOF
                                                                   GmbH. Briefly, samples were introduced into the analysis
                                                                   chamber with a residual pressure of 10−8 mbar. The sample
                                                                   surface was bombarded by a 25 keV Bi+      3 ion beam with a
Figure 1. Schematic of the sampling line and photos of collected
                                                                   current of 0.3 pA in static mode. The 180 s acquisition time
samples. The combustion parameters for the miniCAST burner are     and 25 random scans per acquisition were used for an ana-
presented in the table.                                            lyzed area of 500 µm × 500 µm on the sample surfaces. Mass
                                                                   spectra were collected in both positive and negative polari-
                                                                   ties for at least three areas per sample. The mass resolution
sample holder to avoid the sublimation of the most volatile        at m/z 29 is approximately 2700. For this analysis samples
species. In the analysis chamber of the time-of-flight mass        are not cooled down. Ion signals in SIMS mass spectra were
spectrometer (ToF-MS), the sample is irradiated at normal          identified and calibrated using SurfaceLab 6 software from
incidence by the beam of a frequency-doubled Nd:YAG laser          IONTOF GmbH. Positive spectra were calibrated with peaks
(Continuum Minilite, λd = 532 nm, 4 ns pulse width) shaped         C+ (m/z 12.000), CH+                          +
                                                                                            3 (m/z 15.023), C7 H7 (m/z 91.055),
                                                                         +                             +
using a circular aperture and a 10 cm focal length plano-          C16 H10 (m/z 202.078), and C19 H11 (m/z 239.086). Negative
convex CaF2 lens to form a top hat beam, 0.8 mm diameter           spectra were calibrated with peaks at C− (m/z 12.000), CH−
spot on the sample surface. Such irradiation is known to in-       (m/z 13.008), O− (m/z 15.995), C−     2 (m/z 24.000), C4 H
                                                                                                                               −

duce the desorption of neutral species from soot without af-       (m/z 49.008), and C8 H− (m/z 97.008). A set of five spectra
fecting the carbon matrix (Faccinetto et al., 2011). All sam-      was obtained for each miniCAST sample (FF and BF) and
ples were analyzed with same desorption conditions (λd =           each polarity. Therefore, in total, 20 spectra were acquired
532 nm, 400 µJ pulse−1 , 80 mJ cm−2 i.e., 20 MW cm−2 ).            for each miniCAST set point.
   The desorbed plume propagates normally from the sam-
                                                                   2.4   Raman micro-spectroscopy
ple surface in between the extraction plates of the ToF-MS.
The molecules from the desorbed plume are then ionized             Raman analyses were performed with an inVia reflex spec-
by either a resonant two-photon ionization R2PI (Haefliger         trometer (Renishaw) equipped with an Olympus microscope
and Zenobi, 1998; Mihesan et al., 2006; Zimmermann et              (BXFM) (Chazallon et al., 2014). The spectra presented in
al., 2001) process at λi = 266 nm (4 ns width pulsed UV            this work were obtained by irradiation with a 514 nm laser
laser, Continuum Powerlite, 1 mJ pulse−1 ) or a single-photon      with a nominal power of 150 mW. The laser power was re-
ionization (SPI) process at λi = 157 nm (5 ns width pulsed         duced to avoid thermal effects at the sample surface. Using
vacuum ultraviolet (VUV) excimer laser, Coherent ExciStar          a lens with 20× magnification (N.A. 0.5), the laser was fo-
XS 200) or λi = 118 nm (in-house built coherent nanosec-           cused on the sample surface to a 3.0 µm diameter spot. The
ond source). The ninth harmonic of the Nd:YAG laser (λi =          spectrometer was calibrated using the Stokes Raman signal
118.2 nm) was generated by tripling the 355 nm output of a         of pure Si at 520 cm−1 . Raman spectra of spectral resolu-
Continuum Surelite pulsed laser in a Xe cell (Hilbig, 1982;        tion 12 cm−1 were collected at four different spots on each
Popovicheva et al., 2017). For the two SPI wavelengths, the        sample using integration times of 60 s with 10–20 scans ac-
setup was optimized to the maximum output (i.e., maximum           cumulated per spectrum.
electric potential for the 157 nm excimer laser, and maxi-
mum pumping energy for the 355 nm laser; 34 mJ pulse−1 )           2.5   Multivariate data analysis: principal component
to maximize 118 nm conversion, at an estimated conversion                analysis (PCA)
efficiency of 0.01 % (Butcher, 1999). The time delay between
desorption and ionization is set to 100 µs by a digital delay–     PCA is a technique used to highlight variation and patterns
pulse generator (Stanford DG535). Generated ions are then          in a dataset, and in this case it was used to reveal the differ-

Atmos. Meas. Tech., 13, 951–967, 2020                                                 www.atmos-meas-tech.net/13/951/2020/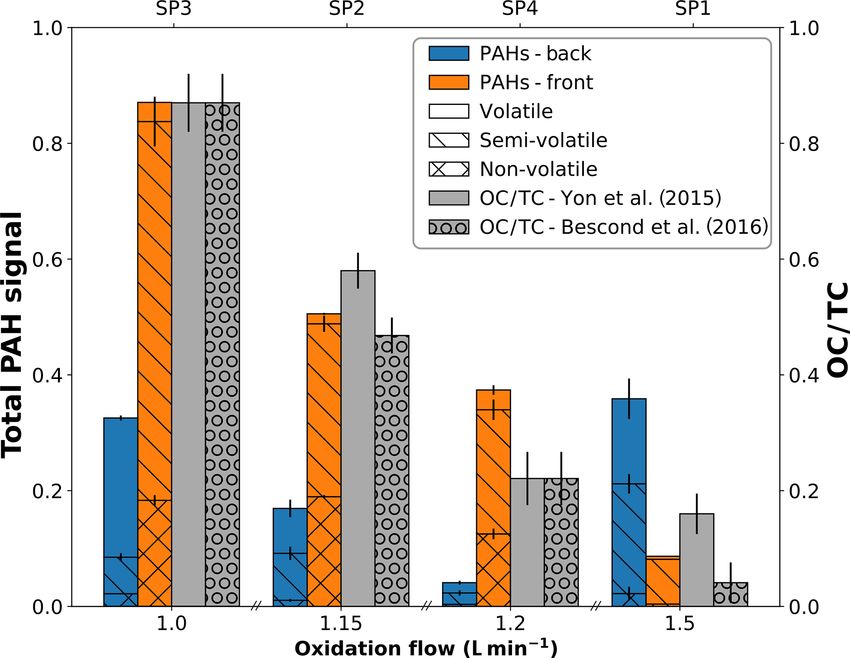
L. D. Ngo et al.: Chemical discrimination of the particulate and gas phases of miniCAST exhausts                              955

ences in chemical composition of the samples, and in partic-      ically to PAHs (Fig. 2). An important advantage of L2MS
ular between (i) front and back filters and (ii) miniCAST set     is to generate, for the most part, fragment-free mass spectra
points. PCA is very convenient to outline the subtle differ-      while maintaining a high signal-to-noise ratio, due to the con-
ences between datasets, since it reduces the dimensionality       trolled desorption and ionization fluences (Faccinetto et al.,
of complex data while preserving most of the information.         2011). On all mass spectra generated with the 266 nm ion-
PCA was applied to each of the five datasets (three L2MS          ization wavelength, the lightest detected PAH is naphthalene
ionization wavelengths and two SIMS polarities) following         (C10 H+ 8 , m/z 128).
the procedure detailed in Popovicheva et al. (2017), Irimiea          On front filters (λi = 266 nm, Fig. 2), the heaviest detected
et al. (2018), and Duca et al. (2019). Further information can    mass varies from sample to sample: SP1FF – m/z400, SP2FF
also be found in Sect. S1 in the Supplement. Briefly, each        – m/z 546, SP3FF – m/z 546, and SP4FF – m/z 522. The
mass spectrum was represented by the integrated areas of a        base peak is at m/z 202 for SP2FF , SP3FF , and SP4FF and
selected number of mass peaks in the spectrum. The num-           at m/z 178 for SP1FF . One can observe that the increase
ber of selected mass peaks was 66, 105, and 60 in L2MS            in oxidation air flow (Qair         air     air     air
                                                                                              SP3 < QSP2 < QSP4 < QSP1 ) results in
mass spectra recorded at λi = 266, 157, and 118 nm, respec-       a significant variation in the shape of the mass spectra. In
tively, and 138 and 70 in SIMS mass spectra recorded in pos-      the SP1 regime, most of the signal comes from three- and
itive and negative polarity, respectively. PCA analyses were      four-ring PAHs, while the heavier PAHs are less conspicu-
performed using a covariance matrix, i.e., each dataset was       ous. Regimes with the lowest oxidation air flow tend to pro-
organized into a matrix containing observations (i.e., sam-       duce more of the heavier PAHs, although the increase in con-
ples) arranged in rows and variables (i.e., peak integrated ar-   tribution for each mass is not the same. For samples SP2FF
eas) arranged in columns. Principal components (PCs) were         and SP4FF , most of the PAHs are concentrated in the mass
constructed as linear combinations or mixtures of the initial     range m/z 178–350 (C14 H+               +
                                                                                                10 −C28 H14 ), with comparable rel-
variables (peak integrated areas). The physical meaning of all    ative intensities. However, the SP3 regime has high peak in-
derived PCs can be inferred from the contribution of the vari-    tensities for C14 H+                      +
                                                                                        10 (m/z 178), C16 H10 (m/z 202), C18 H12
                                                                                                                                 +
                                                                                            +
ous molecular species to the loadings, i.e., by determining the   (m/z 228), and C20 H12 (m/z 252), while the relative contri-
relative importance of each mass peak integrated area to the      butions of heavier PAHs remain comparable. Literature data
main variance in the dataset. Scree plots and loadings for all    converge towards the fact that the SP3 set point is distinct
L2MS PCA analyses discussed in this article can be found in       from the others in that (i) the organic-to-total carbon ratio
the Supplement (Figs. S1 and S2). It should be further noted      is higher (87 % versus ≤ 47 % for the other set points), and
that initial PCA tests included reference samples (in both        (ii) the crystallites of the particles produced in these condi-
L2MS and SIMS PCAs). This preliminary step resulted in            tions are significantly smaller and form a distinct disordered
PC1 (the largest variance in the dataset) being dominated by      arrangement exhibiting many carbon edges (Bescond et al.,
the variance between the reference samples (front and back        2016; Marhaba et al., 2019; Ouf et al., 2016; Yon et al.,
filters) and all other samples, confirming that the 2 min pre-    2015). Such smaller crystallites suggest that SP3 may un-
stabilization deposition does not influence the spectra of the    dergo nucleation and growth processes different from those
various set points measured (see Sect. 2.1). After this con-      of the other set points, subsequently leading to distinct chem-
firmation step, the reference samples were removed from the       ical compositions (e.g., different isomeric distributions) of
covariance matrix used to perform the PCA and therefore are       the PM. The relative ion signals observed between the front
not presented in the following sections.                          and back filters hence depend upon the relative volatilities
                                                                  and the response of the chemical compounds present on the
                                                                  samples to the 266 nm R2PI L2MS.
3     Results and discussion                                          On back filters (λi = 266 nm, Fig. 2), the signal is mostly
                                                                  concentrated in a low mass region. Mass spectra of all back
3.1     L2MS analysis                                             filters are dominated by m/z 128 (naphthalene, C10 H8 ). The
                                                                  spectrum of SP4BF shows more peaks of higher masses than
3.1.1    Mass spectra obtained by L2MS at individual              what is observed on other samples. The first aromatic com-
         ionization wavelengths                                   pound visible on all samples is benzene (m/z 78); however
                                                                  its intensity is drastically reduced for both SP2BF and SP3BF
L2MS mass spectra of samples SP1, SP2, SP3, and SP4 (for          compared to that of SP1BF or SP4BF . The same trend is ob-
both front and back filters) produced at three different ion-     served for aromatic compounds lighter than m/z 128. Oxi-
ization wavelengths (266, 157, and 118 nm) are discussed in       dation air flows associated with set points SP4 and SP1 thus
this section. Mass spectra obtained with the 266 nm ioniza-       resulted in the formation of more of the smallest-sized aro-
tion wavelength are presented in Fig. 2, whereas results ob-      matic species (m/z 78–128).
tained for 157 and 118 nm are both presented in Fig. S3.              The various miniCAST set points exhibit different PAH
   Upon 266 nm ionization, all mass spectra are dominated         mass distributions on their front and back filters, which likely
by signals attributed to aromatic species, and more specif-       relates to the different volatility properties of PAHs and prob-

www.atmos-meas-tech.net/13/951/2020/                                                   Atmos. Meas. Tech., 13, 951–967, 2020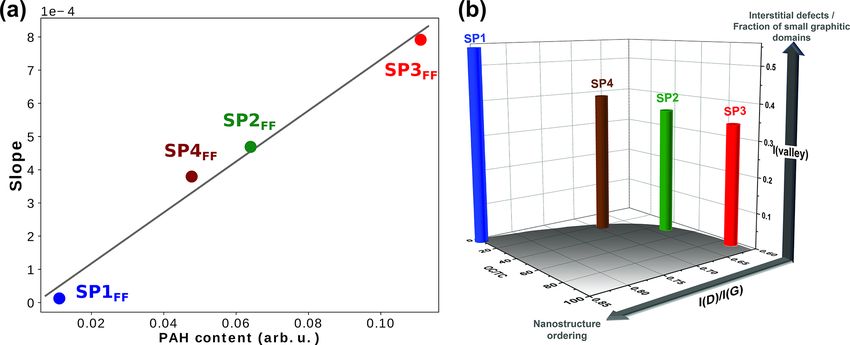
956                      L. D. Ngo et al.: Chemical discrimination of the particulate and gas phases of miniCAST exhausts

Figure 2. Comparison between mass spectra for SP1, SP2, SP3, and SP4 samples recorded with λi = 266 nm for front filters (lower spectra)
and back filters (upper spectra). Note that four different areas have been averaged to yield each of these spectra. Proposed structural formulae
based on molecular formulae obtained from mass spectra are also shown.

ably affects their subsequent trapping on front and back fil-
ters. Distinct volatility properties have been observed in the
past on particles originating from wood combustion by Bari
et al. (2010), who classified the PAHs on the basis of their
number of aromatic rings resulting in the detection of three
different PAH categories. The authors classified the PAHs
consisting of two aromatic rings as volatiles as they were
mostly found in the gas phase, while those made of three
and four rings were classified as semi-volatiles. PAHs com-
prising more than four rings were classified as non-volatile
as they were observed in the PM in their study. Note that
slightly different classes have also been defined elsewhere in
the literature (An et al., 2016; Elghawi et al., 2010; Sun et al.,
2006). In our study, we largely found compounds consisting
of one and two aromatic rings on back filters, while PAHs
of m/z 176–242 were found on both back and front filters                  Figure 3. “Contrast plot” representing the variation in PAH sig-
and those of m/z ≥ 252 predominantly on front filters. Such               nal detected with L2MS at λi = 266 nm for the four miniCAST set
PAH partitioning between front and back filters is in line with           points. Values on the y axis correspond to the partitioning of the
the work of Bari et al. (2010). Similarly, we categorized the             species between the front filters and back filters: −1 indicates that
                                                                          the species are all found on the BF, +1 that they are all found on the
PAH distributions found on miniCAST samples into volatile,
                                                                          FF, and 0 that they are equally partitioned on both filters.
semi-volatile, and non-volatile fractions (Fig. 3), where the
volatile fraction here encompasses aromatic species made of
one to two aromatic rings (m/z 78–166), the semi-volatile
fraction comprises PAHs with a mass range of m/z 176–242,                    The total PAH signal derived from L2MS measurements
and the non-volatile fraction includes PAHs of m/z = 252.                 (λi = 266 nm) can be further refined according to the PAH
The boundaries of these intervals have been refined using the             mass range distribution present on each sample (Fig. 4) as
representation of Fig. 3 in which the “contrast function” de-             previously defined in Fig. 3. Delhaye and coworkers showed
fined as the SSFF −SBF
               FF +SBF
                       ratio is represented for the 266 nm L2MS           that the total PAH signal in mass spectra obtained with λi =
data, where SFF and SBF are the ion signals associated with               266 nm can be indicative of the amount of organic carbon
a mass peak on the front filter and the back filter, respec-              in aeronautical soot samples because of the good agreement
tively. This representation clearly underlines that small aro-            between total PAH mass signal and OC/TC values derived
matic species are found solely on the back filters, whereas               by a commonly used thermo-optical protocol (see Fig. 7 in
large PAHs are mostly on the front filters.                               Delhaye et al., 2017). In Fig. 4, the total PAH signal, corre-
                                                                          sponding to the sum of all peaks attributed to PAHs in the

Atmos. Meas. Tech., 13, 951–967, 2020                                                           www.atmos-meas-tech.net/13/951/2020/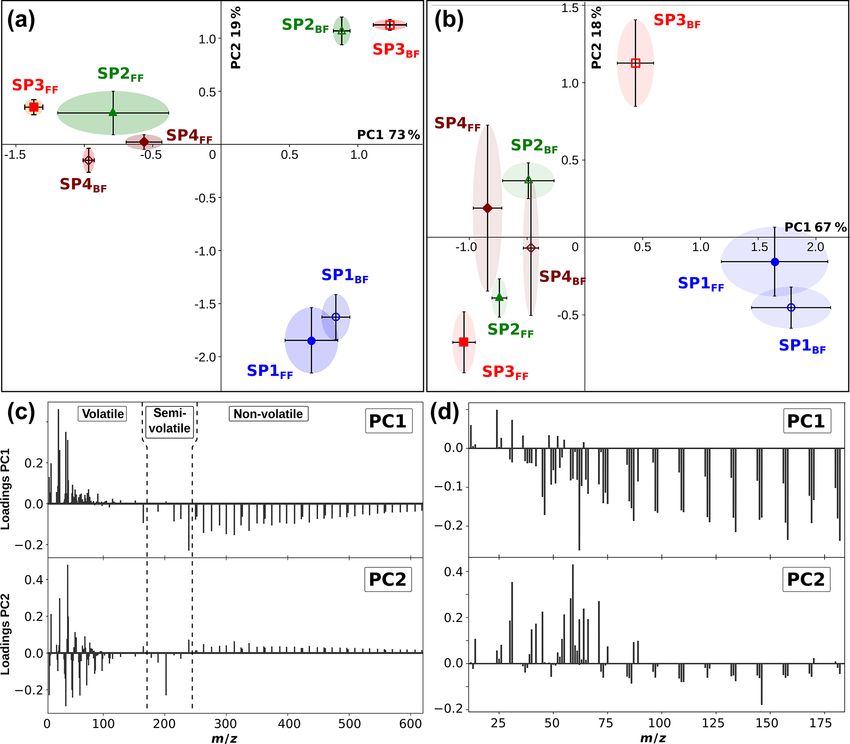
L. D. Ngo et al.: Chemical discrimination of the particulate and gas phases of miniCAST exhausts                                   957

                                                                       ment ions, which could result from multi-photon ionization
                                                                       processes. Analysis of the peak at m/z 31 suggests the pres-
                                                                       ence of heteroatoms in the fragments as it cannot be assigned
                                                                       to a Cn H+m hydrocarbon formula. The series of m/z 91, 103,
                                                                       and 115 corresponds to fragments (C7 H+              +        +
                                                                                                                    7 , C8 H7 , C9 H7 ),
                                                                       which are attributed to alkylbenzene species (McLafferty and
                                                                       Turecek, 1993).
                                                                          Mass spectra obtained with SPI at 118 nm (Fig. S3) show
                                                                       a high degree of fragmentation. In all cases, peaks at m/z 23
                                                                       and 39 are due to the presence of trace amounts of the usual
                                                                       contaminants Na and K. PAHs were detected on all samples,
                                                                       but the signal intensity is low due to a high fragmentation
                                                                       rate caused by the excess of energy at λi = 118 nm. Frag-
                                                                       ment ions at m/z 50, 51, 52, 53, 63, and 65 also suggest
Figure 4. Variation in total PAH signal detected with L2MS at λi =     the presence of aromatic compounds. Series of highly unsat-
266 nm on front (orange) and back (blue) filters plotted as a func-    urated aliphatic compounds (C2n H+                  +
                                                                                                              2 and C2n H4 , n = 2–5)
tion of oxidation air flow. The PAH contribution is divided into ad-   are present. Fragments of alkyl compounds (Cn H+
sorbed species non-volatile (m/z ≥ 252), semi-volatile (m/z 176–                                                            2n+1 ) were
                                                                       also found at m/z 15, 29, 43, 57, 71, 85, and 99, with a
242), and volatile (m/z 78–166) fractions. OC/TC values reported
in the literature are plotted in grey for comparison.
                                                                       relatively low intensity compared to fragments of aromatic
                                                                       compounds. Another distinctive series – attributed to Cn H+    2n
                                                                       fragments – was found at m/z 28, 42, 56, and 70. These frag-
                                                                       ments may result from a McLafferty rearrangement involving
266 nm normalized mass spectra, is plotted against the oxi-            alkene chains (McLafferty and Turecek, 1993).
dation air flow and is further compared to the OC/TC values               In conclusion, our L2MS results for the three ionization
given in Bescond et al. (2016) and Yon et al. (2015). Ac-              wavelengths converge to show that heavy PAHs (m/z ≥ 252)
cording to these studies, SP1 has the lowest OC/TC ratio               are largely found on the front filters, whereas the volatile aro-
at 4.1 %, followed by SP4 (OC/TC 22.1 %), SP2 (OC/TC                   matic species (one to two rings) are solely detected on the
46.8 %), and SP3 (OC/TC 87 %). Slightly different values               back filters. This detailed mass spectrometry analysis cou-
for SP2 (OC/TC 58.3 %) and SP1 (OC/TC 16.2 %) are given                pled with our two-filter collection system shows very effec-
by Yon et al. (2015), but the same overall trend is main-              tive partitioning of the PM–gas phases on FF and BF and a
tained. The same evolution with oxidation air flow was evi-            clear dependence on the volatility of the molecules. We find
denced for the PAH-to-soot ratio in Moore et al. (2014) using          that the total PAH content varies with the oxidative air flow,
a different method (photoelectric aerosol sensor). Figure 4            as shown in previous studies. Finally, this two-filter system
shows that the total PAH signal measured by mass spectrom-             allows us to evidence subtle differences in the chemical com-
etry (λi = 266 nm) on front filters (orange bars) follows the          position of the various miniCAST set points.
same trend as the OC/TC ratios measured by the thermo-
optical protocol for the same miniCAST set points (Bescond             3.1.2   Principal component analysis of L2MS spectra
et al., 2016; Yon et al., 2015). Although the total PAH signal
on back filters (blue bars, Fig. 3) also follows the trend ob-         In order to better discriminate the chemical composition of
served on front filters for samples SP3BF , SP2BF , and SP4BF          the various samples, particularly (i) the front and back fil-
(decreasing PAH signal with increasing oxidation air flow),            ters and (ii) the miniCAST set points, principal component
total PAH signal of SP1BF is high compared to that of SP1FF .          analysis (PCA) was applied to mass spectra recorded for all
This is likely due to the nature of its PAH content for this set       three individual ionization wavelengths. A full description of
point, which likely includes more volatile and semi-volatile           this statistical method is provided in Sect. S1. Here, the co-
aromatic species.                                                      variance matrix was built from the integrated areas of all the
   In order to access other classes of molecules, the mini-            detected peaks with a signal-to-noise ratio (SNR) > 3. The
CAST set points have been also analyzed using 157 and                  physical meaning of all derived principal components can
118 nm ionization wavelengths. The majority of PAHs were               be inferred from the contribution of the various molecular
also detected with SPI at 157 nm for both front and back fil-          species to the loadings (see Sect. S1 and Figs. 5b and S2).
ters, albeit at a lower signal intensity (as can be seen by com-       By identifying the molecular families contributing to this
paring the two sets of spectra in Figs. 2 and S3). The over-           variance, we can interpret the PCA score plots (Fig. 5) and
all shape changes due to the different ionization efficiencies         grasp the nature of the subtle chemical differences between
of PAHs from R2PI at 266 nm and SPI at 157 nm. At lower                the samples.
masses, additional peaks with prominent features at m/z 28,               The loading and scree plots corresponding to the L2MS
43, 55, and 69 are present and are assigned to aliphatic frag-         data generated with the 266 nm ionization wavelength are

www.atmos-meas-tech.net/13/951/2020/                                                        Atmos. Meas. Tech., 13, 951–967, 2020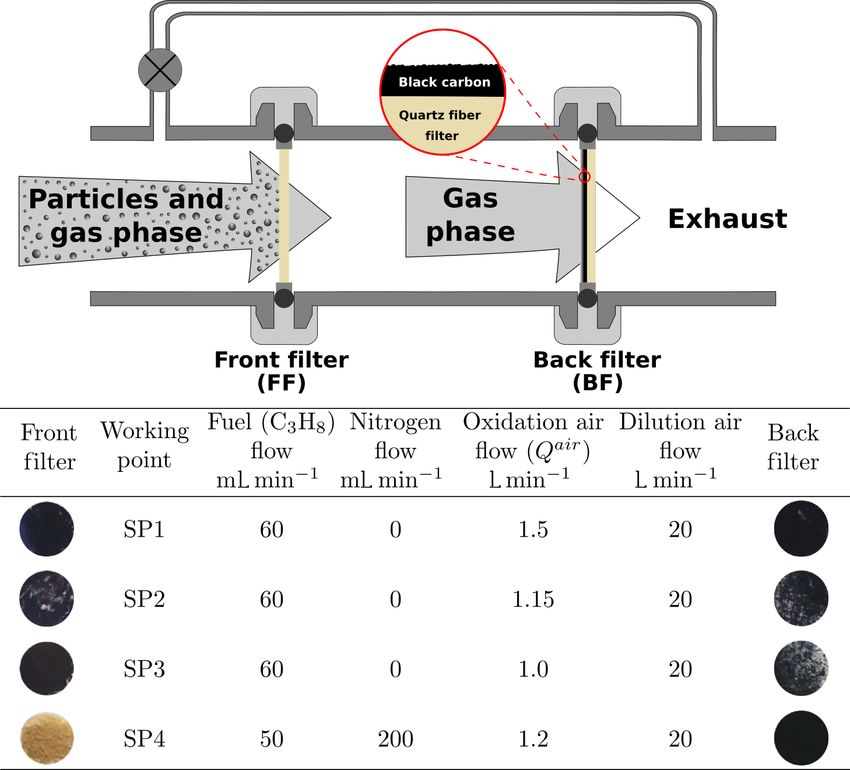
958 L. D. Ngo et al.: Chemical discrimination of the particulate and gas phases of miniCAST exhausts
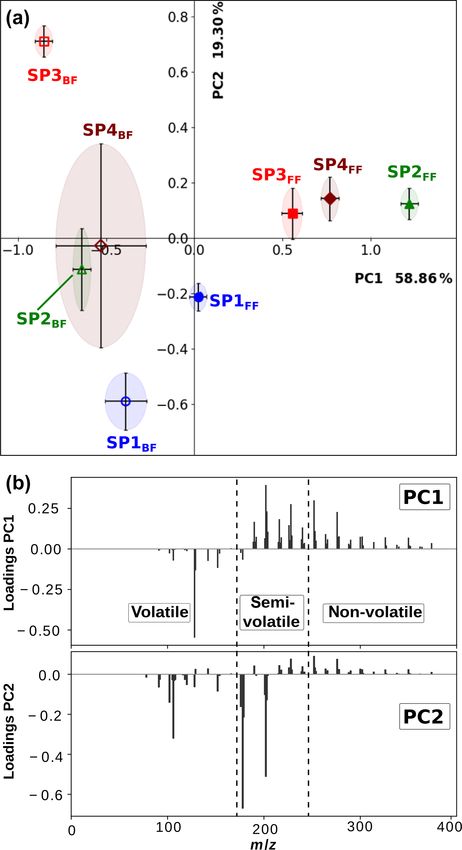
presented in Figs. 5b and S1a, respectively. They show that
PC1 expresses the largest variance (58.86 %) in the dataset
and differentiates samples having a large number of high-
mass PAHs (positive contribution: m/z ≥ 189) from those
containing more of low-mass aromatic species (negative con-
tribution: up to three aromatic rings), especially naphthalene
(m/z 128). PC2 (19.30 %) denotes the relative contribution
between high-mass PAHs (positive contribution: m/z ≥ 216)
bearing four and more aromatic rings and aromatic com-
pounds containing up to m/z 202, especially m/z 178 and
202, and benzene and its alkyl derivatives. The dataset, in
terms of PC1 and PC2, is illustrated in a score plot in Fig. 5a.
According to PC1, the largest separation appears between
sample groups SP2–4FF and SP1–4BF . It can be attributed
to the higher fraction of high-mass PAHs (m/z ≥ 189) rela-
tive to smaller aromatic species in SP2–4FF . The first conclu-
sion is that our samples are mainly separated regarding their
chemical composition (non-volatile and semi-volatile frac-
tions vs. volatile fraction) because of the two-filter collec-
tion system rather than the miniCAST operating conditions.
However, a refined observation in the PCs can help to inter-
pret composition variations between the different set points.
For back filters, the PC1 score decreases along with the oxi-
dation air flow, indicating a greater contribution of small aro-
matic species, especially naphthalene, for lower-oxidation air
flows. Data points for front filters generally display a posi-
tive PC2 component except for SP1FF , a phenomenon pos-
sibly explained by the very small fraction of non-volatile
PAHs produced in this regime relative to m/z178 and 202.
The almost constant score of PC2 for SP2–4FF , which is in Figure 5. Score (a) and loading (b) plots of PC2 and PC1 derived
contrast with the very different scores for the back filters from principal component analysis of the L2MS data obtained with
(Fig. 5a), and the high contribution of semi-volatile species to 266 nm ionization.
the PC2 loadings (Fig. 5b) highlight that the ratios of semi-
volatile compounds vary between the front and back filters
for the different set points. This observation suggests that tation, which is intrinsic to the technique and caused by the
the partitioning between the front and back filters is not only energetic primary ion beam. To start with front filter sam-
driven by thermodynamic conditions (volatility) but also by ples, and similarly to what has been observed in L2MS, the
the nature of the soot matrix produced at the different set PAH distribution across samples varies with set points, the
points. Note that details about the PCA applied to the 157 highest detected mass on SP1FF , SP2FF , SP3FF , and SP4FF
and 118 nm L2MS data can be found in the Supplement being m/z 452, m/z 871, m/z 825, and m/z 908, respec-
(Sect. S1). The statistical approach developed in this sec- tively. SP1FF shows a shorter high-mass PAH “tail” com-
tion confirms from a quantitative standpoint the descriptive pared to other front filter samples. The high-mass PAH re-
results obtained in Sect. 3.1.1. gion observed in SIMS is in good agreement with that of
L2MS, whereas the significant fragmentation observed in
3.2 SIMS analysis SIMS seems to impair the low-mass region (ca. m/z < 228)
more conspicuously and as a result makes SIMS and L2MS
3.2.1 Mass spectra obtained by SIMS spectra look more distinct in this region. It is worth recall-
ing that SIMS measurements are performed at room temper-
SIMS measurements are complementary to L2MS analysis ature, which contrasts with L2MS measurements that involve
as they can provide insights into the compounds that pref- nitrogen cooling. This may potentially result in SIMS anal-
erentially produce negative ions. For the sake of compari- yses providing an incomplete picture for some specific low-
son with L2MS results, SIMS measurements were first ob- mass PAHs. The base peak of SP2FF , SP3FF , and SP4FF sam-
tained in positive mode. Positive spectra of SP1, SP2, SP3, ples is located at m/z 239 (C19 H+ 11 ), whereas SP1FF exhibits
and SP4 samples are presented in Fig. 6 (m/z 150–500 its highest-intensity peak at m/z 202 (C16 H+ 10 ). The absolute
range). All SIMS mass spectra feature significant fragmen- intensity of the overall signal is the highest for SP3FF , fol-
Atmos. Meas. Tech., 13, 951–967, 2020 www.atmos-meas-tech.net/13/951/2020/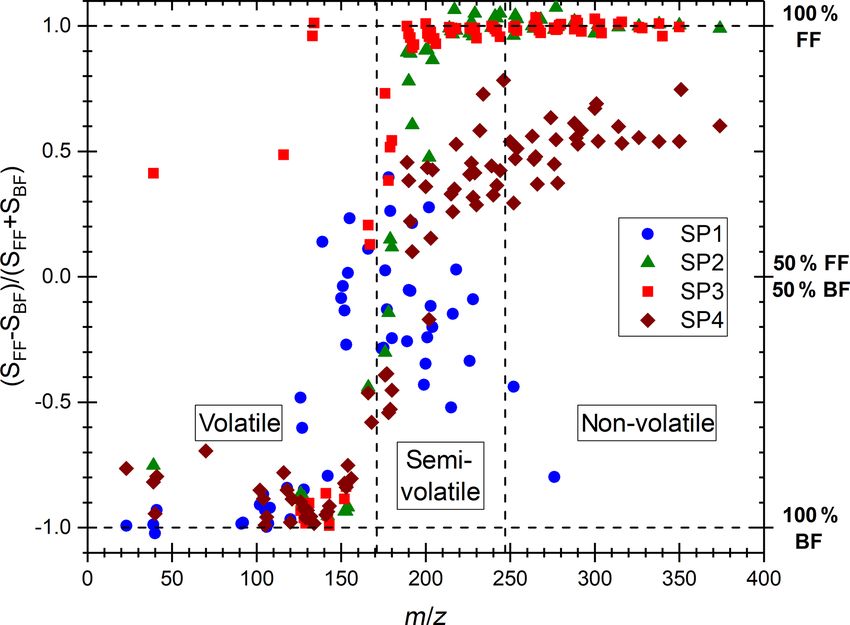
L. D. Ngo et al.: Chemical discrimination of the particulate and gas phases of miniCAST exhausts 959
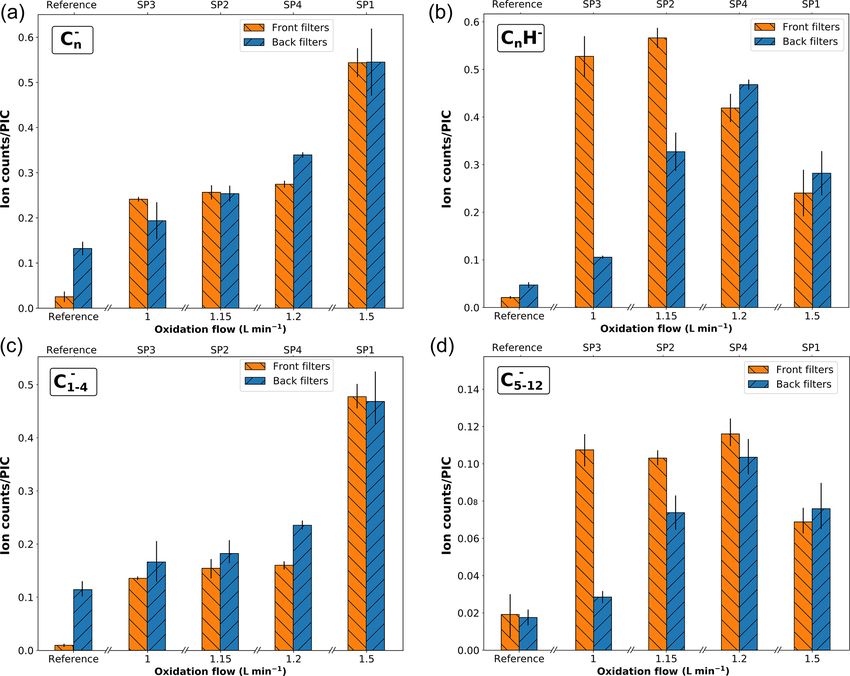
lowed by SP2FF , SP4FF , and SP1FF . Likewise, the total PAH sidered to be markers of the EC content (Duca et al., 2019;
contribution in each sample (i.e., summed areas of all peaks Pagels et al., 2013; Popovicheva et al., 2017). For instance,
attributed to PAHs in positive mode) decreases with the oxi- Pagels et al. (2013) used the sum of C− n (n = 2–4) fragment
dation air flow rate for front filters, as shown in Fig. 7, which signals as a marker of EC in aerosol time-of-flight mass spec-
indicates that the general trend previously shown with L2MS trometer (ATOFMS) measurements for wood stove PM emis-
is also observed with SIMS. Consequently, the total PAH sions, and the same marker ions have been used to discrim-
signal derived from SIMS measurement is also in line with inate diesel from biodiesel PM emissions by Popovicheva et
OC/TC measurements obtained from thermo-optical meth- al. (2017). Cn H− fragments are commonly associated with
ods (Bescond et al., 2016; Yon et al., 2015) for all front filter OC contents (Ewinger et al., 1991; Le Roy et al., 2015), but
samples (Fig. 7). Here, non-volatile species are predominant it is worth noticing that both series have been detected in
on SP3FF , SP2FF , and SP4FF , while semi-volatile species mass spectra of pure PAHs (Bentz et al., 1995; Le Roy et
constitute the main class of compounds observed on SP1FF . al., 2015). Here, the relative proportion of C− n fragments in-
The prevalent class of chemical compounds in L2MS or creases with the initial oxidation air flow conditions on front
SIMS mass spectra (Fig. 4 vs. Fig. 7) is linked to the ioniza- filter samples and exhibits a similar contribution across front
tion process (λi = 266 nm vs. Bi+ 3 ion beam). Semi-volatile and back filter samples. It should be noted that the black
compounds (m/z 178–228) are prevalent in spectra gener- carbon, pre-deposited on back filters, also contributes to the
ated with the 266 nm ionization wavelength, whereas high- C−n signal. However, for all miniCAST samples, the total Cn
−
mass aromatic compounds (m/z 250–500) dominate SIMS contribution is higher than that of the reference sample, sug-
mass spectra. This suggests that miniCAST samples contain gesting that some proportion of C− n on back filters originates
PAHs with a high stability in the high-mass range (i.e., sta- from the deposited material. On the other hand, the Cn H−
bilomers; Stein and Fahr, 1985), which are eventually less ion series shows a distribution across front and back samples
prone to fragmentation in SIMS with respect to other semi- akin to that of the total PAH signal (i.e., the total PAH sig-
volatile compounds. Consequently, a smaller relative fraction nal in positive polarity; see Fig. 7). This positive correlation
of molecules is fragmented in L2MS, which leads to a more indicates a possible polyaromatic origin of the Cn H− frag-
reliable PAH content determination in the semi-volatile mass ments. In order to better delineate the contributions of EC,
range from their L2MS mass spectra compared to SIMS. PAHs, and other components to the C− n carbon cluster series,
As to the PAH distribution observed on back filters, it is Pearson correlation coefficients between all C− n and Cn H
−
distinct from that of front filters in that the highest mass de- have been evaluated for the complete set of negative SIMS
tected is m/z 411 on SP1BF , m/z 570 on SP2BF , m/z 448 spectra. C−n (n = 1–4) ions display high positive correlation
on SP3BF , and m/z 793 on SP4BF (i.e., the m/z distribu- (r ≥ 0.60) with a maximal value for C− −
3 and C4 (r = 0.91).
tion of back filters is less spread out towards high masses). In contrast, this group of peaks is not correlated with the C− 5
The total PAH signal now shows a different behavior to that fragment ion and is anticorrelated with all heavier carbon
observed on front filters (Fig. 7), where SP4BF exhibits the cluster ions (n ≥ 6). This first analysis shows that at least two
highest PAH signal, followed by SP2BF , SP1BF , and SP3BF . components contribute to the C− n signal. Furthermore, posi-
Additionally, the PAH signal of SP4BF determined by SIMS tive correlations are also found between the Cn H− (n = 3–
is higher than the one of its corresponding front filter, which 12) fragments, but also between these Cn H− ions and the C− n
is in contradiction to what has been derived from L2MS (n =5–12) fragments. For better visibility, specific subsets of
(λi = 266 nm) spectra, where the front filter showed a much C−n fragment ions (n = 1–4 and n = 5–12) are plotted sepa-
higher PAH signal. This behavior may originate from the na- rately in Fig. 8c, d. Panel (c) shows that the ions with carbon
ture of deposited PAHs on front and back filters, which may numbers n = 1–4 primarily contribute to the total C− n signal,
have different volatility and stability properties and hence whereas panel (d) highlights the correlation between subset
will react differently to the energetic Bi+ 3 ion beam used in ions with carbon numbers n = 5–12 and Cn H− fragments. In
SIMS analysis. addition, the similar distribution across front and back filters
Negative polarity mass spectra obtained for front and back between Cn H− fragment ions and total PAH signal which is
filters are presented in Fig. S4. H− and C− 2 fragment ions a proxy for OC supports the fact that Cn H− fragments can be
have the highest abundance in mass spectra of SP1FF and considered a marker for OC in our soot samples. Therefore,
SP1BF , whereas SP2FF , SP3FF , SP4FF , and SP4BF are dom- while a predominant fraction of C− n fragments (n = 1–4) are
inated by H− and C2 H− . Similarly to that of the reference markers for EC, a non-negligible part (C− n with n ≥ 5) also
sample, spectra of SP2BF and SP3BF are dominated by H− originates from the organic fraction present on our samples.
and OH− ions. The Cn H− series is observed in mass spectra SIMS results confirm L2MS measurements regarding the
of SP2, SP3, and SP4 samples (front and back filters), with organic carbon and more specifically the PAH contents and
the intensity decreasing with the mass (for n ≥ 2). To fur- mass distributions for the various miniCAST set points. In
ther understand this behavior, the relative abundances of the contrast to L2MS, specific SIMS fragmentation patterns pro-
C− −
n and Cn H fragments are plotted as a function of the ox- vide additional information about the presence of elemental
idation air flow in Fig. 8. C−n fragments are commonly con-
www.atmos-meas-tech.net/13/951/2020/ Atmos. Meas. Tech., 13, 951–967, 2020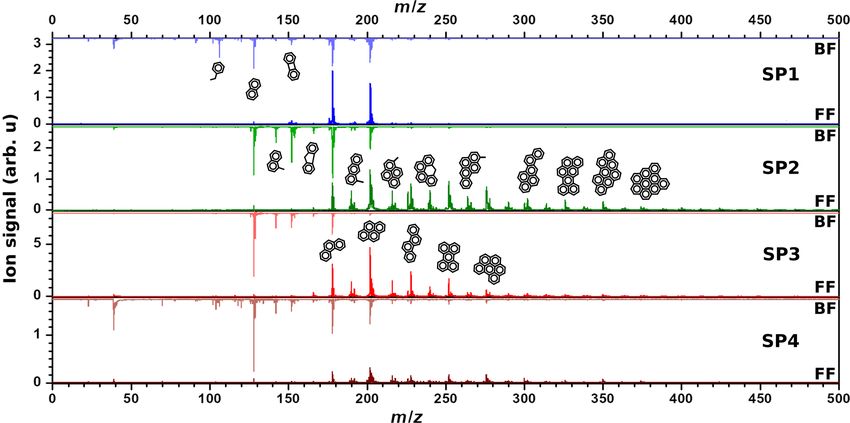
960                     L. D. Ngo et al.: Chemical discrimination of the particulate and gas phases of miniCAST exhausts

Figure 6. ToF-SIMS mass spectra of samples SP1, SP2, SP3, and SP4 obtained in positive polarity for front filters (lower spectra) and back
filters (upper spectra). For visualization purposes, we focus on the m/z 150–500 range. Note that for SP2 and SP3 samples front and back
filters have different scales.

                                                                       and their corresponding loadings are shown in Fig. 9c. PC1
                                                                       represents 73 % of the variance and is associated with small
                                                                       fragment ions with m/z < 160 (e.g., Cn H+      3 with n = 1–3,
                                                                                               +
                                                                       Cn H+m with  m > n, C H
                                                                                            7 7  , positive coefficients), and with pol-
                                                                       yaromatic species with m/z ≥ 165 (negative coefficients).
                                                                       All back filter samples (containing gas-phase PAHs) except
                                                                       SP4BF have positive PC1 scores, whereas all front filters but
                                                                       SP1FF exhibit negative PC1 scores due to their high PAH
                                                                       contents. From this result, it can be determined that SP3FF
                                                                       has the highest relative PAH content. Among front filters,
                                                                       SP1FF has the smallest contribution from PAHs. SP3BF has
                                                                       the highest contribution from fragments associated with both
                                                                       aliphatic and aromatic species. The negative contribution of
                                                                       PC2 (19 % of the variance) is associated with the hydrogen-
                                                                       poor fragments (Cn H+  m with m < n) and volatile and semi-
Figure 7. Total PAH signal detected with SIMS on front (orange)
and back (blue) filters plotted as a function of oxidation air flow,
                                                                       volatile PAHs (m/z 128–228) with the exception of m/z 165.
along with OC/TC values reported in the literature for the same        The positive coefficients of PC2 are associated with aliphatic
miniCAST set points. All values are normalized to the partial ion      fragments (e.g., Cn H+m with m > n) and large PAHs (m/z ≥
count (PIC) corresponding to the signal of all selected peaks.         239). As most of the variance was contained in only two prin-
                                                                       cipal components (92 %), there are only two available criteria
                                                                       for differentiating between samples: PC1, corresponding to
carbon and outline the distinct elemental carbon vs. organic           the amount of PAHs relative to fragments, and PC2, depend-
carbon contents for the different miniCAST set points.                 ing partially on the hydrogen content of fragments originat-
                                                                       ing from aromatic and aliphatic species. SP1FF and SP1BF
3.2.2   Principal component analysis of SIMS spectra                   are located in almost the same position due to their positive
                                                                       scores in PC1 and negative scores in PC2, which corresponds
PCA was applied to the positive-mode SIMS spectra. All hy-             to their limited high-mass PAH content and high fragment
drocarbon fragments and the most representative peaks for              content on the one hand and small PAHs and hydrogen-rich
PAHs were chosen for the analysis (see Sect. S3). The PCA              fragments on the other hand.
score plot for the first two components (PC1 and PC2, re-
sponsible for 92 % of the variance) is presented in Fig. 9a,

Atmos. Meas. Tech., 13, 951–967, 2020                                                       www.atmos-meas-tech.net/13/951/2020/
L. D. Ngo et al.: Chemical discrimination of the particulate and gas phases of miniCAST exhausts 961
Figure 8. Variation in the signal of various markers, as derived from SIMS spectra. The panels represent the total peak areas of the following
families: (a) C− − − −
n , (b) Cn H , (c) C1–4 , and (d) C5–12 . All values are normalized to the partial ion count (PIC) corresponding to the signal of
all selected peaks.
PCA was also applied to the negative-mode SIMS spec- tinguishes SP3BF , and SP2BF to a lesser extent, by their cov-
tra for selected mass peaks, including carbon clusters C− n, erage in oxygen- and nitrogen-containing species.
Cn H− , and some oxygenated and nitrogenated fragment To sum up, PCA on SIMS results confirms the existence
ions. The first two components were determined to represent of various families of carbon clusters on the PM that can be
more than 85 % of the variance. The score plot of PC1 vs. associated either with the soot matrix or with the surface PAH
PC2 is presented in Fig. 9b, along with their corresponding coating.
loadings (Fig. 9d). The first component, which accounts for
over 67 % of the variance, separates the samples containing 3.3 Raman micro-spectroscopy analysis
low-mass carbon clusters C− n (with n ≤ 3) and nitrogen- and
oxygen-bearing compounds (e.g., CN− , C3 NH− , CH3 O− ) The two-filter system provides a unique opportunity to per-
(positive PC1) from Cn H− 0–2 with n ≥ 4, oxygenated, and ni-
form Raman spectroscopy on either the gas phase trapped on
trogenated fragments – negative contribution. The opposite the back filter or the PM collected on the front filter. Raman
contributions to PC1 of small carbon clusters in comparison spectra measured for each sample are presented in Fig. 10.
to larger ones, with a transition size of n = 3–4, strengthen All spectra for PM deposited on front filters are in very good
their dichotomous origin as already discussed in Sect. 3.2.1. agreement with those already measured for the same mini-
In the light of the score plots, SP1FF and SP1BF samples are CAST set points (e.g., Ess et al., 2016), while back filter
characterized by low surface coverages where small carbon spectra are dominated by the absorption of the pre-deposited
clusters are associated with the soot matrix and the black car- black carbon. Soot particles often exhibit distinct Raman sig-
bon, respectively, whereas the other samples feature PAH- natures that can be used to distinguish samples mostly by
rich surfaces. PC2, accounting for 18 % of the variance, sep- their hybridization and nanostructure (e.g., stacking proper-
arates data points based on the contribution from hydro- ties) compared to that obtained for a perfect graphite crystal,
carbon compounds (Cn H− m , negative PC2) and oxygen- and
i.e., a crystal made of sp2 -hybridized carbons and graphene
nitrogen-bearing fragments (positive contribution). PC2 dis- sheets stacked with their surfaces parallel and slightly offset.
When samples differ from perfect crystalline graphite, de-
fects appear and can take the form of stacking disorder (such
www.atmos-meas-tech.net/13/951/2020/ Atmos. Meas. Tech., 13, 951–967, 2020962 L. D. Ngo et al.: Chemical discrimination of the particulate and gas phases of miniCAST exhausts
Figure 9. Score plots of PC1 and PC2 derived from positive (a) and negative (b) polarity SIMS mass spectra of miniCAST soot samples
SP1, SP2, SP3, and SP4 (front and back filters). Loadings corresponding to the contribution of different species to PC1 and PC2 derived
from positive (c) and negative (d) polarity SIMS mass spectra.
as in turbostratic arrangements where tortuosity reduces the Two conclusions can be drawn from these observations.
stacking order), edge sites, missing atoms in the graphite lat- First, when comparing fluorescence signals of back and front
tice, or even altered local or semi-long-range arrangements filter samples to PAH content, we can further refine our def-
of carbon atoms (Parent et al., 2016). inition of organic content. Fluorescence is not just related
Both the fluorescence background (FB) and the soot Ra- to the total PAH signal, although this is a good marker of or-
man feature are observed to vary significantly with the set ganic content. If it were, fluorescence would also be observed
point (Fig. 10). The former refers to the baseline, whereas for back filter samples, in accordance with their relatively
the latter refers to the two broadbands centered at 1356 high gas-phase PAH contents. The lack of fluorescence signal
and 1598 cm−1 , termed D (for defect) and G (for graphite), on back filters, whose chemical composition is dominated by
which correspond to Raman scattering involving E2g and small PAHs, suggests that the fluorescence can be attributed
A01g symmetry, respectively (Ferrari and Robertson, 2000; mainly to non-volatile PAHs in the particulate phase, even
Sadezky et al., 2005). FB is attributed to surface organic though the heaviest mass detected in L2MS (m/z 546) is still
content (Cloutis et al., 2016) and is observed to decrease small to expect fluorescence with a 514 nm excitation wave-
with increasing oxidation air flow for front filter samples length (Mercier et al., 2019). Consequently, the interaction
(FBSP3 > FBSP2 > FBSP4 > FBSP1 ). This trend is even clearer of PAHs with one another or with the PM surface seems to
when the fluorescence slope fitted as a straight line between trigger the fluorescence excited at 514 nm. Such a perturba-
800 and 2200 cm−1 (Raman shift) is plotted against the to- tive effect (e.g., aggregate formation) on the luminescence
tal PAH signal determined in L2MS (Fig. 11). The linear fit has been observed in solutions (Nakagawa et al., 2013).
(R 2 = 0.992) obtained in Fig. 11 reflects the good agreement Information on soot nanostructure ordering can be derived
between the FB and the measured trend in total PAH sig- from the I (D)/I (G) height ratio, whose increase in intensity
nal. For back filter samples, the FB signal is nonexistent and reflects a higher degree of order for soot made of crystallites
spectra resemble that of black carbon except in the “valley” (La ) smaller than 2 nm (Ess et al., 2016; Ferrari and Robert-
region (i.e., in between the two soot peaks). son, 2000). The intensity of the valley region between the
two peaks (1440–1540 cm−1 ) provides insights into the pres-
Atmos. Meas. Tech., 13, 951–967, 2020 www.atmos-meas-tech.net/13/951/2020/You can also read