Analysis of aerosol-cloud interactions and their implications for precipitation formation using aircraft observations over the United Arab Emirates
←
→
Page content transcription
If your browser does not render page correctly, please read the page content below
Atmos. Chem. Phys., 21, 12543–12560, 2021
https://doi.org/10.5194/acp-21-12543-2021
© Author(s) 2021. This work is distributed under
the Creative Commons Attribution 4.0 License.

Analysis of aerosol–cloud interactions and their implications
for precipitation formation using aircraft observations
over the United Arab Emirates
Youssef Wehbe1 , Sarah A. Tessendorf2 , Courtney Weeks2 , Roelof Bruintjes2 , Lulin Xue2 , Roy Rasmussen2 ,
Paul Lawson3 , Sarah Woods3 , and Marouane Temimi4
1 National  Center of Meteorology, Abu Dhabi 4815, United Arab Emirates
2 Research  Applications Laboratory, National Center for Atmospheric Research, Boulder, CO 80307, USA
3 Stratton Park Engineering Company, Boulder, CO 80301, USA
4 Department of Civil, Environmental and Ocean Engineering, Stevens Institute of Technology, Hoboken, NJ 07030, USA

Correspondence: Youssef Wehbe (ywehbe@ncms.ae)

Received: 7 March 2021 – Discussion started: 6 April 2021
Revised: 27 June 2021 – Accepted: 21 July 2021 – Published: 23 August 2021

Abstract. Aerosol and cloud microphysical measurements            1   Introduction
were collected by a research aircraft during August 2019
over the United Arab Emirates (UAE). The majority of scien-       Aerosol particles are key components of the atmosphere and
tific flights targeted summertime convection along the east-      have multiscale impacts on Earth’s climate and hydrological
ern Al Hajar Mountains bordering Oman, while one flight           cycle, primarily through radiative transfer and precipitation
sampled non-orographic clouds over the western UAE near           formation. Aerosol effects are grouped into direct radiative
the Saudi Arabian border. In this work, we study the evolu-       effects (Ming et al., 2005) and indirect aerosol–cloud inter-
tion of growing cloud turrets from cloud base (9 ◦ C) up to the   actions (Lohmann et al., 2010). The magnitude of uncertainty
capping inversion level (−12 ◦ C) using coincident cloud par-     from indirect effects remains more difficult to quantify com-
ticle imagery and particle size distributions from cloud cores    pared with that from direct effects (Solomon et al., 2007).
under different forcing. Results demonstrate the active role of   This is primarily due to the complexity of the microphysi-
background dust and pollution as cloud condensation nuclei        cal processes involved and their interdependencies (Morri-
(CCN) with the onset of their deliquescence in the subcloud       son et al., 2005). Furthermore, the contributions from ther-
region. Subcloud aerosol sizes are shown to extend from           modynamic and dynamic factors introduce additional com-
submicron to 100 µm sizes, with higher concentrations of          plexities to the precipitation generation process. Hence, as-
ultra-giant CCN (d > 10 µm) from local sources closer to the      sessing the impact of aerosols on cloud microphysics and
Saudi border, compared with the eastern orographic region         precipitation generation has been a long-standing research
where smaller CCN are observed. Despite the presence of           area with many processes yet to be fully understood (Mor-
ultra-giant CCN from dust and pollution in both regions, an       rison et al., 2020; Flossmann et al., 2019; Solomon et al.,
active collision–coalescence (C–C) process is not observed        2007; Squires, 1958; Rosenfeld, 1999). Our current knowl-
within the limited depths of warm cloud (< 1000 m). The           edge is based primarily on observing the influence of back-
state-of-the-art observations presented in this paper can be      ground aerosols on the number and size distribution of hy-
used to initialize modeling case studies to examine the influ-    drometeors (Rosenfeld et al., 2008; Freud et al., 2008; Tao et
ence of aerosols on cloud and precipitation processes in the      al., 2007; Rosenfeld, 2000; Feingold et al., 1999). Isolating
region and to better understand the impacts of hygroscopic        these impacts has been shown to be particularly challenging
cloud seeding on these clouds.                                    in polluted and dusty environments where the physiochem-
                                                                  ical properties of aerosols are continuously altered between
                                                                  large dust particles, fine particle pollution as well as com-

Published by Copernicus Publications on behalf of the European Geosciences Union.
12544          Y. Wehbe et al.: Analysis of aerosol–cloud interactions and their implications for precipitation formation

plex aggregates depending on both regional and local forc-          gion (Almazroui and Farrah, 2017; Al Hosari et al., 2021).
ing (Abuelgasim and Farahat, 2020; Filioglou et al., 2020;          In addition to an in-depth understanding of the local mete-
Semeniuk et al., 2014).                                             orology, cloud seeding programs require an accurate char-
   The role of dust aerosols as ice-nucleating particles (INPs)     acterization of the background aerosol particles and their
is well established in the literature (Kanji et al., 2019; Atkin-   potential to serve as CCN or INPs. To this end, the UAE
son et al., 2013; Hoose and Möhler, 2012; Prenni et al., 2009;      Unified Aerosol Experiment (UAE2 ) was the first compre-
Möhler et al., 2006). Dust INPs have been shown to pro-             hensive airborne assessment of aerosol characteristics in the
long cloud lifetimes and enhance precipitation in relatively        Arabian Gulf (Reid et al., 2006). The measurements indi-
unpolluted continental tropical and maritime regimes (Liu et        cated an abundance of sulfate-dominant fine-mode aerosols
al., 2020; Koren et al., 2005). Alternatively, when ingested        which may have strong influences on cloud and precipitation
into strong convective updrafts, large populations of mineral       formation. Further evaluation of the impact of background
dust INPs tend to limit the growth of hydrometeors in the           aerosols as CCN/INPs on cloud microphysics and precipita-
upper levels due to their competing effect for available wa-        tion was recommended as a high priority to refine operational
ter vapor (Kant et al., 2019; Min et al., 2009; DeMott et al.,      cloud seeding activities over the UAE (Semeniuk et al., 2014;
2003; Sassen et al., 2003). On the other hand, the role of          Breed et al., 2007).
dust as cloud condensation nuclei (CCN) in polluted desert             In line with the recommendations from the UAE2 work,
environments with diverse aerosol physio-chemistry is less          a flight campaign was conducted in August 2019 by the
understood. The recent study by Chen et al. (2020) showed           Stratton Park Engineering Company (SPEC) Inc., supported
non-linear responses of precipitation to dust when it serves        by the UAE Research Program for Rain Enhancement Sci-
as both CCN and INPs.                                               ence (UAEREP). The aircraft was equipped with state-of-
   Dust introduces large particles with diameters exceed-           the-art cloud physics instrumentation, outlined in Lawson et
ing 2 µm which could serve as giant CCN (GCCN) (Jensen              al. (2019), to sample summertime convective clouds over the
and Nugent, 2017; Yin et al., 2000; Jensen and Lee, 2008).          UAE (see Sect. 4). Here, we use in situ aerosol and cloud
This alludes to more effective droplet collection during the        microphysical measurements from the SPEC UAE campaign
collision–coalescence (C–C) process. However, Rosenfeld et          to assess the role of background aerosols on natural pre-
al. (2001) attributed the reduction in cloud droplet effective      cipitation formation. Representative measurements from two
radii (re < 14 µm) over the Saharan Desert to the presence          separate flight cases (12 and 19 August 2019) are used to
of large concentrations of submicron CCN originating from           study dominant eastern orographic convection along the Al
desert mineral dust. This is shown to inhibit C–C and warm-         Hajar Mountains (Branch et al., 2020) and the less frequent
rain formation, exacerbating a reduction in precipitation over      southwestern convection associated with the Arabian heat
the Saharan region. A similar conclusion was derived from           low (AHL) near the Saudi Arabian border (Steinhoff et al.,
the modeling studies of Flossmann and Wobrock (2010).               2018).
These findings contradict with previous work that suggested
enhanced C–C by GCCN regardless of the fine-mode con-
centrations (Johnson, 1982; Takeda and Kuba, 1982). Aside           2   Regional setting
from size and concentration, aerosol chemistry plays an im-
portant role in determining the nucleation properties of dust       Given its geographical setting, the UAE is impacted by
particles. Laboratory deliquescence experiments show that           both mesoscale sea–land breezes and microscale orographic
pure insoluble mineral dust particles remain hydrophobic at         storms with lifetimes of less than 30 min. Interestingly, de-
100 % relative humidity (RH), whereas the aggregation of            spite its minimal contribution to the country’s mean annual
dust particles with soluble compounds (e.g., NaCl) results in       rainfall, the summer season records rainfall accumulations
their deliquesce at 74 % RH (Wise et al., 2007). Similarly,         exceeding 100 mm over the eastern Al Hajar Mountains bor-
compounds from anthropogenic pollution (sulfates) interact          dering Oman (Wehbe et al., 2020, 2017). In a recent study,
with mineral dust to produce internally mixed aggregates that       Branch et al. (2020) calculated back-trajectories of summer-
deliquesce at 80 % RH (Semeniuk et al., 2015).                      time convective events over the eastern UAE by applying
   Located along the central portion of the dust belt, the          thermal radiance thresholds to the European Organization for
Arabian Peninsula is largely considered a hotspot for atmo-         the Exploitation of Meteorological Satellites (EUMETSAT)
spheric dust emissions (Karagulian et al., 2019; Beegum et          Meteosat-7 and 10 retrievals during a 7-year period. While
al., 2018; Hofer et al., 2017). The UAE is situated on the          convection was found to be predominantly fostered along the
southeastern coast of the Arabian Peninsula and records an          Al Hajar Mountain peaks (> 80 % of events) around noon lo-
annual rainfall average less than 100 mm, which is repre-           cal time, a diurnal propagation of this convection outflows to
sentative of the region’s scarce rainfall (Wehbe et al., 2018).     the west during the afternoon periods – coincident with the
Aiming to augment natural rainfall over the country, the UAE        easterly sea breeze (Remiszewska et al., 2007).
has implemented an operational cloud seeding program for               On the other hand, rare non-orographic summertime pre-
the past 2 decades – the longest ongoing program in the re-         cipitation has also been reported over the UAE. Steinhoff

Atmos. Chem. Phys., 21, 12543–12560, 2021                                           https://doi.org/10.5194/acp-21-12543-2021
Y. Wehbe et al.: Analysis of aerosol–cloud interactions and their implications for precipitation formation                        12545

                                                                         each flight – at 11:00 and 12:00 UTC for SF1 and SF4, re-
                                                                         spectively. The mean sea-level pressure (MSLP) during SF1
                                                                         (Fig. 2a) shows the two typical pressure lows impacting the
                                                                         UAE during the summer season, namely the Pakistan–India
                                                                         low (Bollasina and Nigam, 2011) and the Arabian Gulf low
                                                                         (Bitan and Sa’Aroni, 1992). However, the SF4 case (Fig. 2b)
                                                                         occurred during the less-frequent dominance of the AHL
                                                                         (Steinhoff et al., 2018) over the southwestern region. The
                                                                         low-level atmospheric thickness (LLAT) index is used for
                                                                         heat low detection (Fig. 2c, d), as proposed by Lavaysse et
                                                                         al. (2009) for the West African heat low. The varying thresh-
                                                                         old (red color scale) is defined as the 90th percentile of the
                                                                         LLAT cumulative probability distribution function (i.e., the
                                                                         highest 10 % of LLAT values) computed from all of the grid
Figure 1. Terrain elevation (30 m, Advanced Spaceborne Thermal
Emission and Reflection Radiometer, ASTER, DEM), locations of
                                                                         points (hourly scale used here). The active AHL extends from
the C-band radars, reflectivity (dBz) and flight tracks for the 12 Au-   central Saudi Arabia to the southwest of the UAE during SF4
gust (SF1) and 19 August (SF4) cases. Al Ain airport is in close         (Fig. 2d).
proximity (∼ 5 km) to the location of the Al Ain radar.                     To further assess discrepancies between the two flight
                                                                         cases, air mass back-trajectories were computed using the
                                                                         Hybrid Single Particle Lagrangian Integrated Trajectory
et al. (2018) linked such events over the southwest to in-               (HYSPLIT) model (Stein et al., 2015). Figure 2e and f show
creased convection and latent heat over the Arabian Sea as-              the 1.5 and 4.5 km level back-trajectories to two locations
sociated with the active phases of the southwest Asian mon-              within the flight area and a third control location to the south
soon. This was shown to strengthen the circulation of the                for each flight date to distinguish between regional and local
AHL, which shifted moisture transport in favor of deep con-              air mass trajectories. During SF1, all low-level (1.5 km) tra-
vection initiation over the southwest desert inland. Kumar               jectories (Fig. 2e) show the dominant sea breeze convergence
and Suzuki (2019) also used Meteosat-10 retrievals for a                 inland and toward the Al Hajar foothills, while the upper-
satellite-based assessment of cloud climatology and seasonal             level (4.5 km) trajectories indicate long-range easterly trans-
variability in microphysical properties over the UAE. They               port from the Indian regime. However, during SF4, more lo-
reported a high occurrence of mixed-phase convective clouds              cally driven trajectories aligning with the extent of the AHL
along the coast and northeastern mountains during summer                 are observed over the Empty Quarter Desert area to the west.
periods. Their analyses of cloud types showed higher warm-                  Figure 3 shows the skew-T profiles comprised of the
cloud fractions over the mountainous regions, whereas cold-              aircraft-observed temperature and dew point temperature
cloud fractions were higher over the Arabian Gulf during                 from the surface at 970 hPa (43 ◦ C) to 400 hPa (−15 ◦ C) for
winter and strictly localized along the Al Hajar Mountains               both flight cases. Co-located ERA5 profiles (Fig. 3a, b) and
in summer. This is consistent with the radar-based analysis              radiosonde observations (Fig. 3c, d) from Abu Dhabi (AD)
of Breed et al. (2007) which showed the highest frequency of             airport (12:00 UTC) are overlaid for each case. Despite the
mixed-phase clouds from orographic convection along the Al               different synoptic situations during the SF1 and SF4 cases,
Hajar Mountains during the summer months. Consequently,                  similar cloud base heights and temperatures of 3.5 km and
the August 2019 period was selected as the target period                 9 ◦ C, respectively, are observed. These are typical values that
for the SPEC UAE campaign. A total of 11 scientific flights              fall within the long-term interquartile range of summertime
(SFs) sampled frequent orographic clouds west of the Al Ha-              convection (35-year analysis of AD airport soundings, not
jar foothills, in addition to one set of non-orographic clouds           shown). However, much drier conditions are evident in SF4
over the southwest near the Saudi border. Figure 1 shows the             compared with SF1 soundings above the 700 hPa level. Al-
flight tracks during the 12 and 19 August cases, referred to             though the ERA5 dataset provides a high vertical resolution
hereafter as SF1 and SF4, respectively, and the composite                (∼ 250 m), it represents the mean conditions within a sin-
reflectivity from the UAE National Center of Meteorology                 gle ERA5 grid cell (∼ 30 km). Hence, the mean condition as
(NCM) radar network.                                                     presented in the ERA5 data may not represent the aircraft-
                                                                         observed instance due to the high variability in the low-
                                                                         to mid-level atmospheric conditions in this region. Strong
3   Synoptic situation and thermodynamic profiles                        upper-level temperature inversions at around −5 and −3 ◦ C
                                                                         are observed during SF1 and SF4, respectively. The large dif-
Figure 2a–d show the synoptic situation using the European               ferences in the low-level dew point profiles between the air-
Centre for Medium-Range Weather Forecasts Reanalysis 5                   craft and AD soundings is primarily due to the coastal lo-
(ERA5) product (Hersbach and Dee, 2016) within 1 h before                cation of the latter. The noise in the dew point temperature

https://doi.org/10.5194/acp-21-12543-2021                                              Atmos. Chem. Phys., 21, 12543–12560, 2021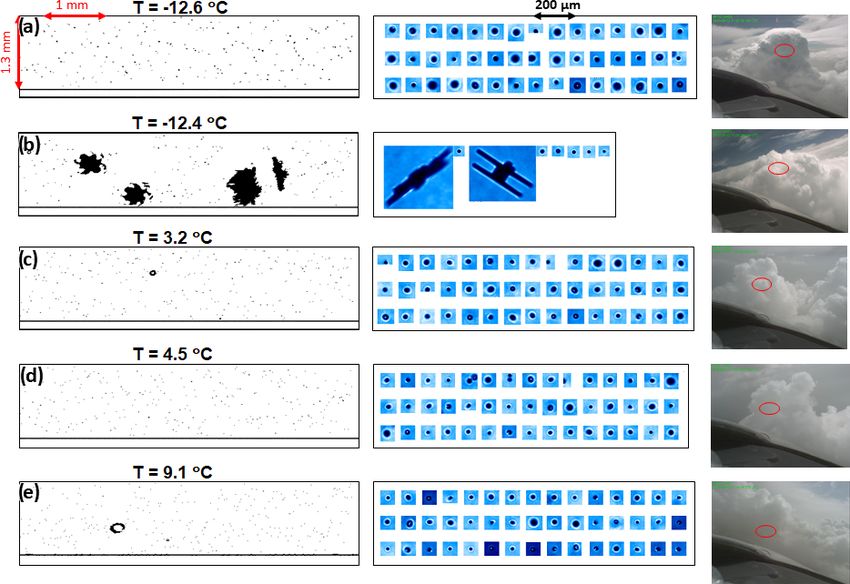
12546           Y. Wehbe et al.: Analysis of aerosol–cloud interactions and their implications for precipitation formation

Figure 2. (a, b) Mean sea-level pressure (MSLP) and (c, d) low-level atmospheric thickness (LLAT) with 925 hPa wind directions from
ERA5, and (e, f) Hybrid Single Particle Lagrangian Integrated Trajectory (HYSPLIT) back-trajectories during the SF1 and SF4 cases. Red
back-trajectories had lower altitude end points (1500 m), whereas blue back-trajectories had end points at 4500 m. Different line styles are
used to show back-trajectories to each of the three labeled end locations.

Atmos. Chem. Phys., 21, 12543–12560, 2021                                                 https://doi.org/10.5194/acp-21-12543-2021
Y. Wehbe et al.: Analysis of aerosol–cloud interactions and their implications for precipitation formation 12547
profiles between the 700 and 500 hPa levels indicates the air- As listed in Table 1, cloud droplet size distributions were
craft’s motion in and out of clouds. derived using the well-established FFSSP and 2D-S instru-
ments, and the usage of the stand-alone FCDP was lim-
ited to coarse-mode aerosol measurements to complement
4 Dataset and methods the PCASP accumulation-mode measurements. The fine-
mode PCASP measurements were quality controlled by ad-
4.1 Aircraft instrumentation
justing the sample volume to account for pressure-induced
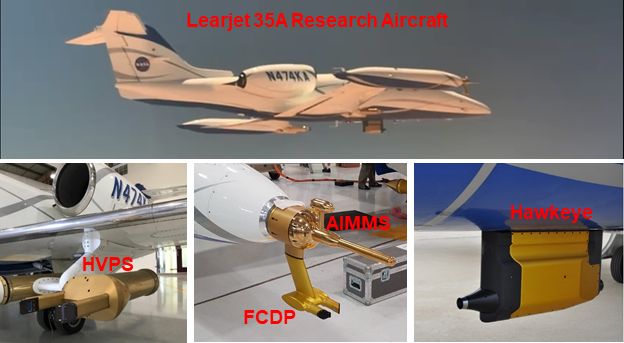
The scientific flights were conducted by the SPEC Lear- pump rate lags, especially at altitudes exceeding 4.5 km. The
jet 35A. The capability of the Learjet to conduct rapid ma- first two size bins (0.1–0.12 µm) were also excluded from
neuvers and swift ascents and descents was key for sampling the total concentration calculations to avoid data contam-
the short-lived UAE clouds while complying with local air ination from excessive noise. All PCASP total concentra-
traffic control (ATC) restrictions. The aircraft was equipped tions were filtered for out-of-cloud measurements by ap-
with state-of-the-art cloud physics instrumentation used on plying dual thresholds on the FFSSP total number concen-
multiple platforms throughout various airborne campaigns tration (20 cm−3 ) and hot-wire liquid water content (LWC;
(Lawson et al., 2019). The instruments deployed for the UAE 0.01 g m−3 ); above these thresholds, a measurement is con-
campaign included a condensation particle counter (CPC), sidered a cloud pass (Korolev and Isaac, 2006). Similar to
passive cavity aerosol spectrometer probe (PCASP), multi- a CCN counter but forced with higher supersaturation, the
ple optical array probes (OAPs) and scattering probes (see CPC provided counts of ultrafine-mode aerosols (0.01–3 µm)
Table 1). Figure 4 shows the Learjet in flight over Al Ain in through deliberate water-based condensation of intercepted
addition to selected cloud physics instrumentation. particles to reach sizes detectable by a laser counter (Wang
The scattering probes included a stand-alone fast cloud et al., 2015; Liu et al., 2006). Finally, an Aventech Aircraft-
droplet probe (FCDP) (Lawson et al., 2017) and fast forward- Integrated Meteorological Measurement System (AIMMS)
scattering spectrometer (FFSSP), with the latter upgraded to logged 1 Hz basic meteorological variables and air motion
reduce the effects of ice shattering and processing lag time measurements (Beswick et al., 2008), while a Nevzorov hot-
(O’Connor et al., 2008). The scattering probes’ retrieval and wire probe (Korolev et al., 1998) measured the total water
processing mechanisms are provided in Knollenberg (1981) content and LWC – used here as the reference value com-
and in the Appendix of Lawson et al. (2017). The instrument pared to LWC values registered by the scattering probes and
suite also included the Hawkeye (Woods et al., 2018), a re- OAPs.
cently developed composite system housing its own FCDP,
two-dimensional stereo (2D-S) probe and cloud particle im- 4.2 Cloud penetration selection and classification
ager (CPI) (Lawson et al., 2001). The CPI provides high-
resolution (2.3 µm) digital images of cloud particles for ice- A total of 13 and 22 cloud penetrations were conducted dur-
phase habit identification (Woods et al., 2018). The triple- ing SF1 and SF4, respectively. All flight ascents were south-
coincident observations from the Hawkeye were especially ward out of Al Ain, climbed up to 7 km (flight altitude limit
useful for the mixed-phase clouds targeted in the UAE, where set by ATC), and penetrated clouds on the descent back over
a size threshold was applied on the 2D-S as a trigger for the Al Ain (SF1) or the southwest (SF4). Growing turrets were
CPI to capture ice particle habits within a large population of penetrated nearest to their tops to document initial ice for-
cloud drops. Only the CPI component of the Hawkeye was mation (i.e., first ice). However, as a result of the 7 km ATC
used in this paper, given that the FCDP-Hawkeye measure- limit, there are no cloud measurements at levels colder than
ments required further calibration and testing. −12 ◦ C. Penetrations were also made around 300 m above
The OAPs included a total of three 2D-S probes (two cloud bases to measure the microphysical and dynamic prop-
stand-alone and one within the aforementioned Hawkeye) erties of the updrafts. Here, the analysis is primarily focused
and one high-volume precipitation spectrometer (HVPS) de- on penetrations from growing turrets, with the aim of study-
scribed in Lawson et al. (2006) and Lawson et al. (1993), ing early-stage cloud conditions and their evolution. Penetra-
respectively. A total of five channels (three vertical and two tions from precipitating, decaying or dissipating clouds are
horizontal) provided redundant measurements at 10 µm res- excluded from the analysis (used only for demonstration).
olution (see Table 1) which served for data quality control. To minimize data contamination from entrainment and
Post-processing of the OAP imagery involved noise filtering evaporation effects or artificial spikes in the 1 Hz acquisi-
and corrections for particle overlapping and ice shattering as tions, only measurements from cloud cores are extracted.
outlined in Lawson (2011). Size estimates from the two im- Avoiding entrainment effects is particularly challenging in
age processing methods M4 and M7 described in Lawson et this region’s dry environment where even the most undiluted
al. (2017) were used for smaller (round drops) and larger (ir- penetrations are contaminated by downdrafts. The analyzed
regular ice) shapes, respectively. cloud cores were sub-adiabatic in all cases. The steady state
(SS) and maximum drop concentration (MDC) methods pro-
posed by Tessendorf et al. (2013) are used to manually iden-
https://doi.org/10.5194/acp-21-12543-2021 Atmos. Chem. Phys., 21, 12543–12560, 2021
12548          Y. Wehbe et al.: Analysis of aerosol–cloud interactions and their implications for precipitation formation

Figure 3. Skew-T soundings from SF1 and SF4 descents (limited at 400 hPa level), co-located ERA5 grid points (a, b) and Abu Dhabi (AD)
airport (12:00 UTC) observations (c, d).

                                                                     tify the most isolated cloud core measurements within each
                                                                     penetration time series. Both methods are used to identify
                                                                     the undiluted core and better attribute the measured spectra
                                                                     to the subcloud aerosol. As the name suggests, the SS method
                                                                     is based on the assumption that LWC and droplet concentra-
                                                                     tions remain relatively constant during a 3 s window, whereas
                                                                     the MDC method averages the measurements over the 3 s
                                                                     window of maximum concentrations to better correlate with
                                                                     subcloud aerosol measurements. Both methods are applied
                                                                     by manual inspection of the time series data. We first present
                                                                     the background aerosol analysis, followed by a detailed mi-
                                                                     crophysical analysis and intercomparison between the two.

Figure 4. Learjet in flight over Al Ain and selected instruments:
HVPS, FCDP, AIMMS and Hawkeye (from left to right).

Atmos. Chem. Phys., 21, 12543–12560, 2021                                             https://doi.org/10.5194/acp-21-12543-2021
Y. Wehbe et al.: Analysis of aerosol–cloud interactions and their implications for precipitation formation 12549
Table 1. List of instruments available for the collection of data in this study. The instrument abbreviations used in the table are as follows:
condensation particle counter (CPC), passive cavity aerosol spectrometer probe (PCASP), fast cloud droplet probe (FCDP), fast forward-
scattering spectrometer (FFSSP), two-dimensional stereo (2D-S) probe, cloud particle imager (CPI), high-volume precipitation spectrometer
(HVPS) and Aircraft-Integrated Meteorological Measurement System (AIMMS).
Instrument Purpose Size range Used here
CPC Ultrafine-mode aerosol number conc. 0.01–3 µm X
PCASP Aerosol spectra and conc. 0.1–3 µm X
FCDP Coarse-mode aerosol spectra and conc. 1.5–50 µm X
FCDP-Hawkeye Coarse-mode aerosol spectra and conc. 1.5–50 µm
FFSSP Cloud particle spectra and conc. 3–100 µm X
2D-S10HVa Cloud particle shapes and spectra 10–3000 µm X
2D-S10HV-NCAR Cloud particle shapes and spectra 10–3000 µm
2D-S10V-Hawkeye Cloud particle shapes and spectra 10–3000 µm
2D-S50Hb -Hawkeye Cloud particle shapes and spectra 50–6400 µm X
CPI-Hawkeye Cloud particle shapes (ice-phase habit) 2.3–2300 µm X
HVPS Precipitation particle shapes and spectra 150 µm–2 cm X
Nevzorov hot-wire Liquid and total water content X
AIMMS Basic meteorological variables X
a 10HV indicates 10 µm resolution in both the horizontal (H) and vertical (V) channels. b 50H indicates 50 µm resolution in
the horizontal (H) channel.
5 Results and discussion
5.1 Aerosol measurements
Figure 5 shows the 3D flight tracks from both cases and
their PCASP total concentration measurements throughout.
For both flight cases, the PCASP concentrations show a 10-
fold increase on the descent over Al Ain compared with those
from the ascent, even at low altitudes (below 1500 m). This
can be explained by multiple co-occurring effects. The con-
vective outflow from the Al Hajar Mountains toward Al Ain
and the coincident timing of the SF1 descent with the peak
in diurnal sea breeze activity (around 12:00 UTC) (Eck et al.,
2008) can form a convergence zone over the region of Al Ain
which is subject to orographic trapping of dust along the Al
Hajar foothills (Schwitalla et al., 2020). The effect of the oro-
graphic dust trapping is evident from the higher PCASP de-
scent concentrations from SF1, which is further east toward
the Al Hajar ridge, compared with that of SF4 which has a
direct descent over Al Ain (see Fig. 1). Moreover, the ascent–
descent magnitude splits in the PCASP profiles are less pro-
nounced for flights on non-cloudy (dry) days (i.e., SF5 and
SF9 – not shown here). This indicates the strong contribu-
tion from the outflow of convection and thunderstorms dur-
ing cloudy days (SF1 and SF4) coupled with the prevalent
dust-laden haboob winds (Miller et al., 2008). The range of
penetrated cloud temperatures are shown for each flight, with Figure 5. The 3D flight tracks of SF1 and SF4 with PCASP to-
high concentrations of aerosols (∼ 1000 cm−3 ) at cloud base tal number concentrations (cm−3 ): SF1 penetrations over Al Ain
(∼ 9 ◦ C) in both cases. from cloud tops at −13 ◦ C down to 9 ◦ C bases (a), and SF4 pene-
The vertical profiles of PCASP total number concentra- trations over the southwest from cloud tops at −12 ◦ C down to 9 ◦ C
tions are shown in Fig. 6. During the SF1 ascent, the con- bases (b).
centrations decrease from around 400 to 100 cm−3 within
the boundary layer up to 2 km, and they increase again to
https://doi.org/10.5194/acp-21-12543-2021 Atmos. Chem. Phys., 21, 12543–12560, 202112550 Y. Wehbe et al.: Analysis of aerosol–cloud interactions and their implications for precipitation formation
180 cm−3 at around 4 km. Additional variations in aerosol The CPC generally records less variability, as it samples
concentration with altitude are observed up to the top 7 km aerosols at a significantly larger volumetric rate (50 cm3 s−1 )
level, whereas the descent shows relatively less variability. compared with that of the PCASP (1 cm3 s−1 ) (Cai et al.,
This suggests the presence of multiple dust and aerosol lay- 2013; Wiedensohler et al., 2012). Figure 7d shows larger
ers (labeled L1–L4 in Fig. 6a) during the cloud-free ascent, concentrations of PCASP compared with CPC particles dur-
and more mixed conditions with higher concentrations are ing the initial interval (13:44–13:45), whereas it shows the
observed during the descent with cloud development. A well- inverse for the final interval (13:54–13:57). However, the
mixed profile is observed for both the ascents and descents of CPC particle concentrations fall within the 20% uncer-
SF4 as clouds were present over the southwest and Al Ain, tainty margin (Rosenberg et al., 2012) of the PCASP parti-
but the magnitude split is still evident between the two pro- cle concentrations during the inner interval (13:47–13:54).
files. The observed stratification of dust and aerosol layers The comparable measurements during the majority of the
is in line with the ground-based lidar observations from Fili- SF4 flight track over the southwest (13:47–13:54) suggests
oglou et al. (2020) over Al Dhaid – situated along the Al Ha- a smaller concentration of ultrafine particles (0.01–0.1 µm)
jar foothills at 130 km from Al Ain – where they report four compared with larger particles (0.1–3 µm).
separate layers up to 6 km during August 2018. The stratifi- Figure 8 shows the background aerosol size spectra from
cation is imposed by gravitational waves produced from the SF1 and SF4 merged from overlaps between the PCASP,
sea breeze–mountain overpasses during the afternoon period FCDP, FFSSP and 2D-S10 measurements. A higher con-
and by multiple temperature inversions (see Fig. 3) which centration of fine-mode aerosols between 0.1 and 0.2 µm is
are frequently observed during the summer months (Weston observed during SF1 compared with SF4, with a peak dif-
et al., 2020). ference of approximately 5 × 10⁵ L−1 µm−1 . Alternatively,
The time series of altitude (and temperature) measure- higher tail concentrations from ultra-giant sizes of 20–50 µm
ments from SF1 and SF4 are shown in Fig. 7a and c, re- are recorded during SF4 compared with SF1. This is in line
spectively. Cloud bases are sampled at around 3 km and 9 ◦ C with the previous suggestion of higher ultra-giant CCN load-
in both cases. The selected time series of the subcloud and ing from local pollution and dust aggregation over the south-
in-cloud LWC (hot-wire), PCASP and FFSSP total number west compared with the eastern regime (Semeniuk et al.,
concentrations are displayed in Fig. 7b and d. Coincident 2015).
peaks in the LWC and FFSSP total concentrations indicate
a cloud base penetration, while intermediate intervals are 5.2 Cloud microphysics
considered subcloud measurements. In both cases, the mean
subcloud PCASP total number concentrations vary around The SS and MDC methods gave matching instances for the
500 cm−3 , although with higher variations (up to 1000 cm−3 ) most undiluted cloud core measurements (closest to adia-
during SF1. The mean background total concentration of batic cores) with adiabatic fractions between 0.6 and 0.8.
500 cm−3 is in close agreement with those recorded over the Figure 9 shows the coincident imagery from the 2D-S10,
Sahara Desert by Rosenfeld et al. (2001). On the other hand, CPI-Hawkeye and cockpit camera at multiple levels of grow-
the LWC shows excessive noise during the SF4 subcloud ing turrets sampled during SF1. The altitude, temperature,
passes with peaks of around 0.2 g m−3 compared with SF1 vertical velocity range, hot-wire LWC, FFSSP total num-
(< 0.05 g m−3 ), which may be attributed to the hot-wire re- ber concentration and median volume diameter (MVD) are
sponse to heavy dust (and haze) loading from local pollution listed in Table 2 for each level. The FFSSP and FCDP (not
over the southwest. This is corroborated by the more frequent listed) concentrations just above cloud base (9.1 ◦ C) are com-
FFSSP measurements during SF4 compared with SF1, sug- parable at 800 and 1144 cm−3 , respectively. The maximum
gesting the presence of large background aerosols from local LWC of 0.8 g m−3 is coincident with the peak updraft ve-
pollution and dust. locity of 3.1 m s−1 and an 8.7 µm MVD. At the next level
The FFSSP concentrations are always less than PCASP (4.5 ◦ C), slightly lower FFSSP (621 cm−3 ) and higher FCDP
concentrations during the SF1 subcloud time series (see (1598 cm−3 ) concentrations are recorded with a stronger up-
Fig. 7b). However, in the case of the dustier subcloud con- draft (6.9 m s−1 ) and higher LWC (1.2 g m−3 ) compared with
ditions of SF4 (Fig. 7d), there are instances where the the previous level. The marked difference between the FF-
peak FFSSP concentrations are larger than the PCASP (and SSP and FCDP concentrations at this level suggests that more
CPC) concentrations, with relative differences of less than than 50 % of the intercepted cloud droplets and large aerosols
20 %. Differences in flow rate, refractive index and relative- are within the medium size range (d < 6 µm), which is bet-
humidity-dependent errors introduce inconsistencies in the ter captured by the FCDP. Similar values are also observed
calibration curves of the optical sizing instruments with an at the 3.2 ◦ C level with a comparable updraft (6.2 m s−1 ) and
average uncertainty of 28 % considered acceptable for the LWC (1.2 g m−3 ). The 2D-S10 and CPI imagery for the low-
intercomparison of their measurements (Moore et al., 2004; est three levels (Fig. 9c–e) confirm the dominance of small
Reid et al., 2003). drops (d < 10 µm) with the exception of a couple of large
drops captured by the 2D-S10. This is consistent with the
Atmos. Chem. Phys., 21, 12543–12560, 2021 https://doi.org/10.5194/acp-21-12543-2021Y. Wehbe et al.: Analysis of aerosol–cloud interactions and their implications for precipitation formation 12551
Figure 6. Altitude profiles of out-of-cloud PCASP total number concentrations for SF1 (a) and SF4 (b). L1–L4 designate multiple dust layers
at levels of significant change in concentration gradients. The profiles are computed as the best fit from shape-preserving spline interpolation
(Kvasov, 2000) of the full 1 Hz dataset.
calculated MVD values ranging from 8.9 to 10.9 µm from observed at the lower two levels (8.6 and 8.3 ◦ C) most likely
the three warm levels. originated from melted ice that had fallen from above.
In terms of ice processes in the upper portion, ice is ob- To intercompare the evolution of droplet sizes with alti-
served by the CPI and 2D-S10 at the −12.4 ◦ C level. Very tude, Fig. 11 shows the merged size spectra from the PCASP,
few ice particles show a habit of sector plates, as expected by FFSSP, 2D-S50 and HVPS measurements during SF1 (panel
nucleation at −12 ◦ C with relatively high liquid water con- a) and SF4 (panel b) at the levels presented in Figs. 9 and
tents of 1.1 g m−3 (Pruppacher and Klett, 1980). This obser- 10, respectively. For the 9.1 ◦ C level of SF1, a peak con-
vation is within a decaying turret (−12.4 m s−1 peak down- centration of 105 L−1 µm−1 is shown for the sizes between 6
draft). Interestingly, at the highest sampled level (−12.6 ◦ C) and 10 µm, which is consistent with the imagery-based anal-
of a growing pileus cloud, a dominant population of liquid ysis (Fig. 9e). For sizes larger than 10 µm, the concentra-
drops (d < 50 µm) is observed in the absence of ice particles tions drastically decrease to around 10 L−1 µm−1 , while the
with a LWC of 1.4 g m−3 and a strong 17.8 m s−1 updraft. 2D-S50 shows sizes up to 200 µm at minimal concentrations
The calculated MVDs remain less than 20 µm in both of these of 10−3 L−1 µm−1 . At the next two 4.5 and 3.2 ◦ C levels,
subfreezing-temperature penetrations. no broadening is observed with a similar decrease in con-
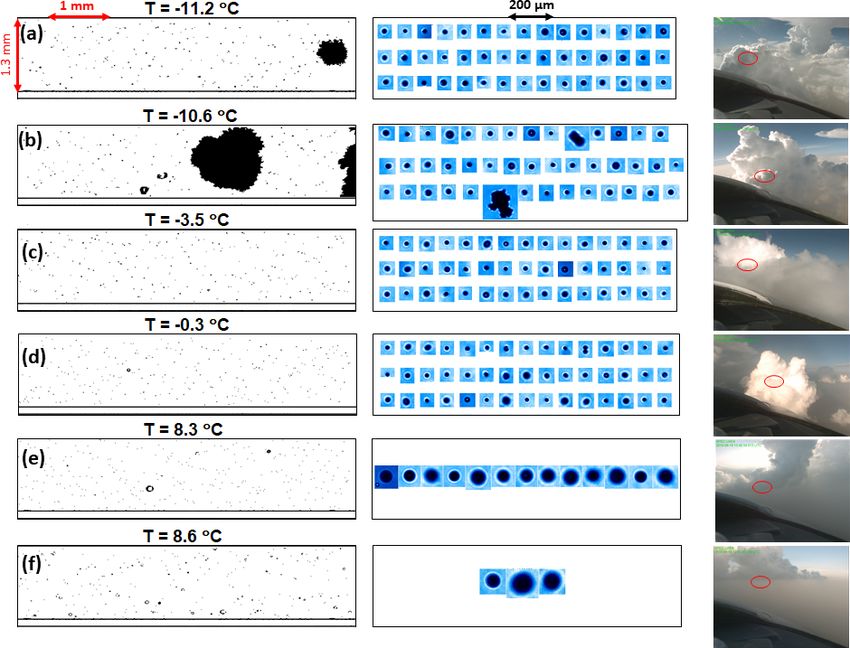
Following the same format as in Fig. 9, the growing cloud centrations for sizes larger than 10 µm. Similarly, the cloud
turret penetrations at multiple levels during SF4 are shown base penetration of SF4 at 8.6 ◦ C reveals a consistent peak
in Fig. 10. At cloud base (8.6 ◦ C), comparable concentra- in the concentrations of the 6–10 µm size range, followed
tions from the FFSSP (541 cm−3 ) and FCDP (605 cm−3 ) are by a sharp decrease in concentrations thereafter. However,
recorded at the peak 3.2 m s−1 updraft and 0.2 g m−3 LWC. the 8.3 and −0.3 ◦ C levels show slight broadening with the
The CPI and 2D-S10 capture a few 100 µm drops which ap- peaks extending to 20 µm, which may be explained by the
pear to be deliquesced dust and pollution aggregates, as sug- hygroscopic characteristics of the southwest ultrafine back-
gested from Fig. 7d. At the next slightly colder cloud base ground aerosols (see Fig. 7d). However, the presence of large
(8.3 ◦ C), more 100 µm drops are captured by the CPI with a haze particles, turbulence and downdrafts may have also con-
higher total concentration and LWC of 0.5 g.m−3 . However, tributed to the larger sizes at this level.
at the next −0.3 and −3.5 ◦ C levels, small drops (d < 50 µm) Rosenfeld and Gutman (1994) reported that an effective
dominate the imagery similar to SF1. Additionally, the LWC radius larger than 14 µm is needed to trigger C–C and warm-
remains high (1.2–1.3 g m−3 ) for the upper subfreezing lev- rain generation, which is in line with other works (Brenguier
els where graupel and ice irregulars (0.5–1 mm) are detected and Chaumat, 2001). Furthermore, Pinsky et al. (2001) re-
at −10.6 and −11.2 ◦ C. The strong updraft (24.4 m s−1 ) may ported a 3 % collision efficiency between collector and col-
have carried a limited number of large particles aloft to serve lected drops of 60 and 10 µm sizes, respectively, while the
as ice nuclei at the −11.2 ◦ C level. Hence, the larger drops efficiency was observed to increase to 45 % for collisions
with collected drops of 25 µm sizes. Consequently, the con-
https://doi.org/10.5194/acp-21-12543-2021 Atmos. Chem. Phys., 21, 12543–12560, 202112552 Y. Wehbe et al.: Analysis of aerosol–cloud interactions and their implications for precipitation formation Figure 7. Flight profiles for SF1 (a) and SF4 (c), and time series of PCASP, FFSSP, CPC and hot-wire LWC measurements for subcloud intervals during SF1 over Al Ain (b) and SF4 over the southwest (d). The inset plot in the top-left corner of panel (a) illustrates the variability in vertical velocity, as reported in Table 2, for different levels. centration of intermediate sizes (10–30 µm) should be at least (see Fig. 9b) with sizes extending to the millimeter scale. 1 order of magnitude larger than any other size range for an However, for the growing turret with a pure liquid phase at efficient C–C process. Given the dominance of small-sized −12.6 ◦ C, the broadening of the size distribution may be a re- particles with diameters less than 10 µm and the minimal sult of the large vertical velocity range (−11.2 to 17.8 m s−1 ) concentrations of intermediate sizes (10–30 µm) from mea- or turbulence that increases the supersaturation perturbations surements during both flights, an active C–C process is not (Abade et al., 2018; Grabowski and Abade, 2017; Lasher- achieved. A further inhibiting factor is the limited depth of Trapp et al., 2005). Dust aerosols, acting as ice nuclei, do warm cloud (< 1000 m) which is critical for the development not appear to be transported to this level, which agrees with of C–C (Johnson, 1993). the observations of Filioglou et al. (2020) close to the Al For the subfreezing cloud levels of SF1, the broadening Hajar foothills. For the SF4 subfreezing levels, broaden- of the particle size distribution associated with the decay- ing is observed for sizes larger than 100 µm extending up ing turret (−12.4 ◦ C) is primarily attributed to fallout ice to millimeter-sized irregulars and graupel at −11.2 ◦ C, al- Atmos. Chem. Phys., 21, 12543–12560, 2021 https://doi.org/10.5194/acp-21-12543-2021
Y. Wehbe et al.: Analysis of aerosol–cloud interactions and their implications for precipitation formation                            12553

Table 2. Penetration altitude, temperature (T ), vertical velocity range (Vv ), forward-scattering spectrometer (FSSP) total number concentra-
tion (N-FSSP), and median volume diameter (MVD) values from SF1 and SF4 (see Figs. 9 and 10).

                                Altitude         T               Vv         LWC      N-FFSSP           MVD
                                (m)           (◦ C)         (m s−1 )     (g m−3 )     (cm−3 )          (µm)
                                SF1 penetration levels (Fig. 9a–e)
                                7040        −12.6     [−11.2; 17.8]     1.4 ± 0.1     442 ± 23    17.4 ± 0.1
                                7050        −12.4      [−12.4; 1.1]     1.1 ± 0.1     223 ± 18    19.2 ± 0.1
                                4660          3.2       [−1.3; 6.2]     1.2 ± 0.1     619 ± 28    10.9 ± 0.2
                                4430          4.5       [−2.9; 6.9]     1.2 ± 0.1     621 ± 16     9.6 ± 0.6
                                3720          9.1       [−2.4; 3.1]    0.8 ± 0.05     800 ± 32     8.7 ± 0.3
                                SF4 penetration levels (Fig. 10a–f)
                                6710        −11.2         [−2.6; 4]     1.2 ± 0.1     321 ± 28    19.4 ± 0.2
                                6700        −10.6      [−7.6; 24.4]     1.3 ± 0.1     778 ± 42    19.5 ± 0.4
                                5400         −3.5       [−6.1; 4.6]     1.1 ± 0.1     479 ± 21    17.1 ± 0.3
                                4910         −0.3      [−3.4; 11.4]     1.3 ± 0.1     470 ± 33    13.2 ± 0.2
                                3620          8.3       [−2.3; 3.3]    0.5 ± 0.04     753 ± 29    10.6 ± 0.4
                                3500          8.6       [−0.5; 3.2]    0.2 ± 0.03     541 ± 26     7.1 ± 0.1

                                                                         they may act as INPs at even higher temperatures depend-
                                                                         ing on their chemical composition, size and concentration
                                                                         (Harrison et al., 2016; Peckhaus et al., 2016). Reasonable K-
                                                                         feldspar fractions were reported by Kaufmann et al. (2016)
                                                                         from samples collected over Qatar, whereas no traces were
                                                                         observed in samples from Oman. This may explain the for-
                                                                         mation of ice irregulars at the subfreezing levels of SF4 over
                                                                         the southwest near Qatar, given the ice-nucleating properties
                                                                         of K-feldspar.

                                                                         5.3    Implications for hygroscopic cloud seeding

                                                                         The general concept of hygroscopic seeding is based on
                                                                         the notion of introducing large artificial (hygroscopic) parti-
                                                                         cles to compete with smaller naturally occurring aerosols for
                                                                         available cloud LWC. Through this “competition effect”, the
                                                                         seeding particles are expected to suppress the activation of
Figure 8. Mean subcloud aerosol size distributions during SF1 (Al        smaller background aerosols, rapidly grow into larger drops
Ain) and SF4 (southwest).                                                and trigger C–C (Bruintjes et al., 2012; Cooper et al., 1997).
                                                                         Ghate et al. (2007) studied the impact of introducing giant
                                                                         (salt) seeding aerosols (1–5 µm) into marine stratocumulus
though at low concentrations within a dominant population                clouds using in situ aircraft observations off the central coast
of small liquid drops (see Fig. 10a and b). Unlike the case of           of California. Seeding plumes were identified using a thresh-
SF1, dust and pollution aggregates appear to have served as              old of 250 cm−3 for the PCASP concentrations compared
INPs given the strong updrafts (24.4 m s−1 ) at the −10.6 ◦ C            with a background concentration of ∼ 80 cm−3 . They ob-
level of SF4.                                                            served a 5-fold increase in the number of large drops (20–
   Several studies show that ultra-giant nuclei (d > 40 µm)              40 µm) relative to the background which was attributed to
may serve as precipitation embryos when their concentration              the activation of the seeding GCCN – a small fraction of
is larger than 30 m−3 (Bartlett, 1970). The potential sources            the total aerosols produced by the flares. Furthermore, Jung
of such nuclei can be large CCN, sulfate-dominant mineral                et al. (2015) tested even larger seeding particles (1–10 µm),
dust (Wurzler et al., 2000) or simply water-insoluble parti-             again in marine stratocumulus clouds off the central coast
cles serving as coalescence embryos (Lasher-Trapp, 1998).                of California, and reported a 4-fold increase in the rainfall
The work of Hoose and Möhler (2012) suggested that dust                  rate associated with seeding GCCN concentrations of 10−2 –
particles may form ice particles at T < −15 ◦ C. However,                10−4 cm−3 . More recently, Wang et al. (2019) reported on a

https://doi.org/10.5194/acp-21-12543-2021                                                Atmos. Chem. Phys., 21, 12543–12560, 2021
12554 Y. Wehbe et al.: Analysis of aerosol–cloud interactions and their implications for precipitation formation Figure 9. SF1 coincident imagery from the 2D-S10, CPI-Hawkeye and cockpit camera. Measurements from each penetration level are listed in Table 2. The cloud penetration locations (red ovals) were determined by visually inspecting video footage from the forward-facing cockpit camera within 1 min of each cloud approach. Figure 10. Same as Fig. 9 but for SF4. Measurements from each penetration level are listed in Table 2. Atmos. Chem. Phys., 21, 12543–12560, 2021 https://doi.org/10.5194/acp-21-12543-2021
Y. Wehbe et al.: Analysis of aerosol–cloud interactions and their implications for precipitation formation                       12555

Figure 11. Size distributions at multiple temperature levels of growing turrets from the PCASP (dashed), FFSSP (solid), 2D-S50 (dashed),
and HVPS (solid with circle markers) measurements during SF1 (a) and SF4 (b).

cloud seeding case study over the eastern coast of Zhejiang,          effect (∼ 1 µm), broadening the cloud drop size distribution
China, and observed the hygroscopic growth of larger-mode             by the tail effect (1–10 µm) and introducing ultra-giant seed-
seeding particles (> 2 µm) up to a limit of ∼ 18 µm drop sizes        ing particles (> 10 µm) to serve as rain drop embryos. These
associated with the competition effect.                               effects need to be thoroughly tested in model simulations
   The characteristics of the background aerosol population,          based on the observations presented here.
namely their size, concentration and chemical composition,               The measurements and analysis provided in this study
are considered key precursory properties to determine, and            have important implications for operational seeding activi-
potentially improve, the effectiveness of seeding. Segal et           ties over the UAE. Our results indicate that relatively large
al. (2004) reported optimum seeding CCN concentrations                aerosol sizes are already present in the UAE environment –
of 700 cm−3 under Mediterranean and extreme continental               over both the eastern and southwestern region – with compa-
background conditions. This concentration is unrealistic in           rable sizes to typical hygroscopic flare particles (d < 10 µm).
seeding operations and does not account for the impact of             Furthermore, the ambient aerosols appear to be naturally hy-
large background CCN; this impact is further investigated by          groscopic as suggested by their deliquescence and growth to
their simulations comparing seeded parcels with and with-             sizes of ∼ 7 µm (peak concentrations) at cloud base. This is
out large, natural CCN centered on a diameter of 0.6 µm               more pronounced over the southwestern region where min-
with concentrations of 0.15 and 0.3 cm−3 . Their results show         eral aggregates are formed from sea salt and sulfate parti-
a decrease in seeding impact when the large, natural CCN              cles emitted from local oil refineries (Semeniuk et al., 2015).
concentrations increased from 0.15 to 0.3 cm−3 . This was at-         While the C–C process remained inactive in all observed
tributed to their competition with the prescribed seeding par-        cases, it is hypothesized that the presence of large dust and
ticles centered on a 10 µm diameter with a concentration of           pollution aggregates causes a “natural competition effect” as
0.032 cm−3 . Moreover, the original calculations of Ivanova           reported by Tessendorf et al. (2021) based on their aircraft
et al. (1977) suggest that CCN diameters larger than 5 µm             observations from the Queensland Cloud Seeding Research
serve as efficient raindrop embryos, and Segal et al. (2007)          Program (QCSRP). Similarly, the modeling work of Segal et
establish a minimum concentration of 0.025 cm3 for such               al. (2004) indicates a decrease in seeding effects in the pres-
particles to cause a noticeable increase in warm-rain produc-         ence of large background CCN due to their efficient colli-
tion from a rising cloud parcel under typical conditions in           sion. Hence, given the comparable sizes between the existing
Texas.                                                                GCCN over the UAE and typical seeding particles, it is un-
   The UAE measurements show natural GCCN (diameters                  clear if hygroscopic seeding can be effective in these clouds.
5–10 µm) concentrations between 0.25 and 0.15 cm−3 , which            Modeling studies are needed to investigate whether the con-
are an order of magnitude larger than the seeding concentra-          centration and hygroscopicity of the background GCCN are
tion suggested by Segal et al. (2004, 2007). Moreover, the            high enough to cause a natural competition effect. Further-
UAE subcloud aerosol sizes extend from 0.01 to 100 µm with            more, modeling studies can help to assess the effectiveness of
total concentrations ranging from 500 to 800 cm−3 . Hence,            perhaps larger seeding particle sizes (10–15 µm) in augment-
all three conceptual models for hygroscopic seeding outlined          ing this potentially active natural competition effect and/or in
by Rosenfeld et al. (2010) are applicable to clouds studied           initiating C–C. Modeling work with different seeding materi-
over the UAE, namely accelerating C–C by the competition              als is in progress and is summarized in Geresdi et al. (2021a).

https://doi.org/10.5194/acp-21-12543-2021                                            Atmos. Chem. Phys., 21, 12543–12560, 2021
12556          Y. Wehbe et al.: Analysis of aerosol–cloud interactions and their implications for precipitation formation

6   Conclusions                                                   the influence of aerosols on clouds and precipitation in these
                                                                  clouds, as well as to study implications for hygroscopic cloud
According to the most recent review on precipitation en-          seeding in the UAE. As in Geresdi et al. (2021b), model
hancement research by the World Meteorological Organiza-          simulations can be initialized (and validated) using the ob-
tion (WMO) Expert Team on Weather Modification, a more            servations provided in this paper to assess the potential of
reliable assessment of aerosol–cloud–precipitation interac-       different seeding strategies for augmenting rainfall over this
tion is needed, particularly using in situ aircraft observa-      water-stressed region.
tions that can validate model results (Flossmann et al., 2019).
Located in a regional dust hotspot impacted by air masses
originating from five subcontinents over its coastal (west)       Data availability. The aircraft observations are archived at the
and mountainous (east) topography, the UAE is considered a        UAE National Center of Meteorology. Readers can request the
“natural laboratory” to study both mesoscale and microscale       dataset by contacting research@ncms.ae.
(aerosol–cloud–precipitation) processes within a limited ge-
ographical area – representative of the larger understudied
Arabian Peninsula environment.                                    Author contributions. SAT, CW and YW conceptualized the study.
                                                                  CW, SW and PL provided support with respect to data curation and
   Here, we present aerosol and cloud microphysical mea-
                                                                  visualization. YW performed the formal analysis and wrote the pa-
surements from research flights targeting two distinct sum-       per. All co-authors contributed advice on the interpretation of re-
mertime convective regimes in the UAE – orographic con-           sults and were involved in editing and discussing the paper.
vection over the Al Hajar Mountains bordering Oman and
non-orographic convection over the southwestern Saudi bor-
der. Despite their different forcing, the thermodynamic and       Competing interests. The authors declare that they have no conflict
microphysical properties of summertime convective clouds          of interest.
sampled from both regimes are very similar. Subcloud
aerosol sizes are shown to extend from sizes of 10 nm up
to 100 µm, with higher concentrations of larger sizes, associ-    Disclaimer. Publisher’s note: Copernicus Publications remains
ated with anthropogenic pollution over the southwest, acting      neutral with regard to jurisdictional claims in published maps and
as ultra-giant CCN. The maximum sizes are approximately           institutional affiliations.
double those observed over the Sahara Desert (Weinzierl et
al., 2009). Despite the existence of ultra-giant CCN, no indi-
cations of a natural C–C process are observed.                    Acknowledgements. The authors thank Colin Gurganus for advis-
   In general, any convective cloud with a depth greater than     ing on data processing and quality control, and István Geresdi and
500 m is expected to support effective C–C growth (Johnson,       Sisi Chen for their helpful comments and suggestions.
1993). However, the realistically lower LWC within the main
body of a convective cloud is more sensitive to cloud base
                                                                  Financial support. This material is based on work supported by
temperature and cloud depth (Warner, 1970). The sampled
                                                                  the National Center of Meteorology, under the UAE Research Pro-
cloud base temperatures in the UAE (∼ 9 ◦ C) are just below       gram for Rain Enhancement Science (UAEREP). The work is also
the 10 ◦ C temperature threshold for the onset of an active C–    supported by the Research Applications Laboratory (RAL) at the
C process (Johnson, 1993; Pruppacher and Klett, 1980), and        National Center for Atmospheric Research (NCAR), sponsored by
warm-cloud depths never exceed 1000 m in all cases. Fur-          the National Science Foundation under cooperative agreement no.
thermore, no indication of C–C is observed within any of the      1852977.
upper levels listed in Table 2 and displayed in Figs. 9, 10
and 11. In the upper levels of SF1 (−12.6 and −12.4 ◦ C),
a dominant population of liquid drops (d < 50 µm) is ob-          Review statement. This paper was edited by Zhanqing Li and re-
served with very few ice particles showing a habit of sector      viewed by three anonymous referees.
plates (expected by nucleation at −12 ◦ C). LWC values of
∼ 1.4 g m−3 with strong updrafts (∼ 17.8 m s−1 ) and MVDs
less than 20 µm are observed at these subfreezing levels. Sim-
ilar observations are also recorded in the upper levels of SF4
                                                                  References
with no signs of ice multiplication. The observations show
a relatively low concentration of background aerosols in the      Abade, G. C., Grabowski, W. W., and Pawlowska, H.: Broadening
10–15 µm size range which may further explain the inacti-           of cloud droplet spectra through eddy hopping: Turbulent en-
vation of C–C. The results have key implications for ongo-          training parcel simulations, J. Atmos. Sci., 75, 3365–3379, 2018.
ing operational cloud seeding activities over the UAE, which      Abuelgasim, A. and Farahat, A.: Effect of dust loadings, mete-
currently rely on hygroscopic material with diameters of less       orological conditions, and local emissions on aerosol mixing
than 10 µm. Modeling studies are needed to further assess           and loading variability over highly urbanized semiarid countries:

Atmos. Chem. Phys., 21, 12543–12560, 2021                                          https://doi.org/10.5194/acp-21-12543-2021
Y. Wehbe et al.: Analysis of aerosol–cloud interactions and their implications for precipitation formation 12557 United Arab Emirates case study, J. Atmos. Sol.-Terr. Phy., 199, African dust aerosols as atmospheric ice nuclei, Geophys. Res. 105215, https://doi.org/10.1016/j.jastp.2020.105215, 2020. Lett., 30, 1732, https://doi.org/10.1029/2003GL017410, 2003. Al Hosari, T., Al Mandous, A., Wehbe, Y., Shalaby, A., Al Eck, T., Holben, B., Reid, J., Sinyuk, A., Dubovik, O., Smirnov, Shamsi, N., Al Naqbi, H., Al Yazeedi, O., Al Mazroui, A., Giles, D., O’Neill, N., Tsay, S. C., and Ji, Q.: Spa- A., and Farrah, S.: The UAE Cloud Seeding Program: A tial and temporal variability of column-integrated aerosol op- Statistical and Physical Evaluation, Atmosphere, 12, 1013, tical properties in the southern Arabian Gulf and United https://doi.org/10.3390/atmos12081013, 2021. Arab Emirates in summer, J. Geophys. Res.-Atmos., 113, Almazroui, A. and Farrah, S.: The UAE seeks leading position in https://doi.org/10.1029/2007JD008944, 2008. global rain enhancement research, Journal of Weather Modifica- Feingold, G., Cotton, W. R., Kreidenweis, S. M., and Davis, J. T.: tion, 49, 54–59, 2017. The impact of giant cloud condensation nuclei on drizzle forma- Atkinson, J. D., Murray, B. J., Woodhouse, M. T., Whale, T. F., tion in stratocumulus: Implications for cloud radiative properties, Baustian, K. J., Carslaw, K. S., Dobbie, S., O’Sullivan, D., and J. Atmos. Sci., 56, 4100–4117, 1999. Malkin, T. L.: The importance of feldspar for ice nucleation by Filioglou, M., Giannakaki, E., Backman, J., Kesti, J., Hirsikko, A., mineral dust in mixed-phase clouds, Nature, 498, 355–358, 2013. Engelmann, R., O’Connor, E., Leskinen, J. T. T., Shang, X., Bartlett, J.: The effect of revised collision efficiencies on the growth Korhonen, H., Lihavainen, H., Romakkaniemi, S., and Komp- of cloud droplets by coalescence, Q. J. Roy. Meteor. Soc., 96, pula, M.: Optical and geometrical aerosol particle properties over 730–738, 1970. the United Arab Emirates, Atmos. Chem. Phys., 20, 8909–8922, Beegum, S. N., Gherboudj, I., Chaouch, N., Temimi, M., and https://doi.org/10.5194/acp-20-8909-2020, 2020. Ghedira, H.: Simulation and analysis of synoptic scale dust Flossmann, A. I. and Wobrock, W.: A review of our understanding storms over the Arabian Peninsula, Atmos. Res., 199, 62–81, of the aerosol–cloud interaction from the perspective of a bin 2018. resolved cloud scale modelling, Atmos. Res., 97, 478–497, 2010. Beswick, K. M., Gallagher, M. W., Webb, A. R., Norton, E. G., Flossmann, A. I., Manton, M., Abshaev, A., Bruintjes, R., Mu- and Perry, F.: Application of the Aventech AIMMS20AQ air- rakami, M., Prabhakaran, T., and Yao, Z.: Review of advances borne probe for turbulence measurements during the Convec- in precipitation enhancement research, B. Am. Meteorol. Soc., tive Storm Initiation Project, Atmos. Chem. Phys., 8, 5449–5463, 100, 1465–1480, 2019. https://doi.org/10.5194/acp-8-5449-2008, 2008. Freud, E., Ström, J., Rosenfeld, D., Tunved, P., and Swietlicki, E.: Bitan, A. and Sa’Aroni, H.: The horizontal and vertical extension of Anthropogenic aerosol effects on convective cloud microphysi- the Persian Gulf pressure trough, Int. J. Climatol., 12, 733–747, cal properties in southern Sweden, Tellus B, 60, 286–297, 2008. 1992. Geresdi, I., Chen, S., Wehbe, Y., Bruintjes, R., Lee, J., Tessendorf, Bollasina, M. and Nigam, S.: The summertime “heat” low over Pak- S., Weeks, C., Sarkadi, N., Rasmussen, R. M., Grabowski, W., istan/northwestern India: evolution and origin, Clim. Dynam., and Xue, L.: Sensitivity of the Efficiency of Hygroscopic Seed- 37, 957–970, 2011. ing on the Size Distribution and Chemical Composition of the Branch, O., Behrendt, A., Gong, Z., Schwitalla, T., and Wulfmeyer, Seeding Material, 101st American Meteorological Society An- V.: Convection Initiation over the Eastern Arabian Peninsula, nual Meeting, 2021a. Meteorol. Z., 29, 67–77, 2020. Geresdi, I., Xue, L., Chen, S., Wehbe, Y., Bruintjes, R., Breed, D., Bruintjes, R., Salazar, V., and Jensen, T.: NCAR feasi- Lee, J., Rasmussen, R., Grabowski, W., Sarkadi, N., and bility studies for weather modification programs over the past 10 Tessendorf, S.: Impact of hygroscopic seeding on the initia- years, Research Applications Laboratory (RAL), National Cen- tion of precipitation formation: results of a hybrid bin micro- ter for Atmospheric Research (NCAR), Boulder CO, 2007. physics parcel model, Atmos. Chem. Phys. Discuss. [preprint], Brenguier, J.-L. and Chaumat, L.: Droplet spectra broadening in cu- https://doi.org/10.5194/acp-2021-506, in review, 2021b. mulus clouds. Part I: Broadening in adiabatic cores, J. Atmos. Ghate, V. P., Albrecht, B. A., Kollias, P., Jonsson, H. H., and Breed, Sci., 58, 628–641, 2001. D. W.: Cloud seeding as a technique for studying aerosol-cloud Bruintjes, R. T., Salazar, V., Semeniuk, T. A., Buseck, P., Breed, D. interactions in marine stratocumulus, Geophys. Res. Lett., 34, W., and Gunkelman, J.: Evaluation of hygroscopic cloud seeding L14807, https://doi.org/10.1029/2007GL029748, 2007. flares, The Journal of Weather Modification, 44, 69–94, 2012. Grabowski, W. W. and Abade, G. C.: Broadening of cloud droplet Cai, Y., Snider, J. R., and Wechsler, P.: Calibration of the pas- spectra through eddy hopping: Turbulent adiabatic parcel simu- sive cavity aerosol spectrometer probe for airborne determina- lations, J. Atmos. Sci., 74, 1485–1493, 2017. tion of the size distribution, Atmos. Meas. Tech., 6, 2349–2358, Harrison, A. D., Whale, T. F., Carpenter, M. A., Holden, M. A., https://doi.org/10.5194/amt-6-2349-2013, 2013. Neve, L., O’Sullivan, D., Vergara Temprado, J., and Murray, Chen, S., Xue, L., and Yau, M.-K.: Impact of aerosols and B. J.: Not all feldspars are equal: a survey of ice nucleating turbulence on cloud droplet growth: an in-cloud seeding properties across the feldspar group of minerals, Atmos. Chem. case study using a parcel–DNS (direct numerical simu- Phys., 16, 10927–10940, https://doi.org/10.5194/acp-16-10927- lation) approach, Atmos. Chem. Phys., 20, 10111–10124, 2016, 2016. https://doi.org/10.5194/acp-20-10111-2020, 2020. Hersbach, H. and Dee, D.: ERA5 reanalysis is in production, Cooper, W. A., Bruintjes, R. T., and Mather, G. K.: Calculations ECMWF Newsletter, 147, 5–6, 2016. pertaining to hygroscopic seeding with flares, J. Appl. Meteorol., Hofer, J., Althausen, D., Abdullaev, S. F., Makhmudov, A. N., 36, 1449–1469, 1997. Nazarov, B. I., Schettler, G., Engelmann, R., Baars, H., Fomba, DeMott, P. J., Sassen, K., Poellot, M. R., Baumgardner, D., Rogers, K. W., Müller, K., Heinold, B., Kandler, K., and Ansmann, D. C., Brooks, S. D., Prenni, A. J., and Kreidenweis, S. M.: A.: Long-term profiling of mineral dust and pollution aerosol https://doi.org/10.5194/acp-21-12543-2021 Atmos. Chem. Phys., 21, 12543–12560, 2021
You can also read