Understanding atmospheric aerosol particles with improved particle identification and quantification by single-particle mass spectrometry - Atmos ...
←
→
Page content transcription
If your browser does not render page correctly, please read the page content below
Atmos. Meas. Tech., 12, 2219–2240, 2019
https://doi.org/10.5194/amt-12-2219-2019
© Author(s) 2019. This work is distributed under
the Creative Commons Attribution 4.0 License.

Understanding atmospheric aerosol particles with improved particle
identification and quantification by single-particle
mass spectrometry
Xiaoli Shen1,2 , Harald Saathoff1 , Wei Huang1,2 , Claudia Mohr1,3 , Ramakrishna Ramisetty1,a , and Thomas Leisner1,4
1 Institute of Meteorology and Climate Research, Karlsruhe Institute of Technology, Hermann-von-Helmholtz-Platz 1,
76344 Eggenstein-Leopoldshafen, Germany
2 Institute of Geography and Geoecology, Working Group for Environmental Mineralogy and Environmental System

Analysis, Karlsruhe Institute of Technology, Kaiserstr.12, 76131 Karlsruhe, Germany
3 Department of Environmental Science and Analytical Chemistry, Stockholm University, Stockholm, 11418, Sweden
4 Institute of Environmental Physics, University of Heidelberg, In Neuenheimer Feld 229, 69120 Heidelberg, Germany
a now at: TSI Instruments India Private Limited, Bangalore, 560102, India

Correspondence: Harald Saathoff (harald.saathoff@kit.edu)

Received: 12 October 2018 – Discussion started: 17 October 2018
Revised: 18 March 2019 – Accepted: 22 March 2019 – Published: 10 April 2019

Abstract. Single-particle mass spectrometry (SPMS) is a           pending on the measurement periods. These two mass spec-
widely used tool to determine chemical composition and            trometers show a good correlation (Pearson’s correlation co-
mixing state of aerosol particles in the atmosphere. Dur-         efficient γ > 0.6) regarding total mass for more than 85 %
ing a 6-week field campaign in summer 2016 at a rural             of the measurement time, indicating non-refractory species
site in the upper Rhine valley, near the city of Karlsruhe        measured by AMS may originate from particles consisting of
in southwest Germany, ∼ 3.7 × 10⁵ single particles were           internally mixed non-refractory and refractory components.
analysed using a laser ablation aerosol particle time-of-flight   In addition, specific relationships of LAAPTOF ion intensi-
mass spectrometer (LAAPTOF). Combining fuzzy classifi-            ties and AMS mass concentrations for non-refractory com-
cation, marker peaks, typical peak ratios, and laboratory-        pounds were found for specific measurement periods, espe-
based reference spectra, seven major particle classes were        cially for the fraction of org / (org + nitrate). Furthermore,
identified. With the precise particle identification and well-    our approach allows the non-refractory compounds measured
characterized laboratory-derived overall detection efficiency     by AMS to be assigned to different particle classes. Over-
(ODE) for this instrument, particle similarity can be trans-      all AMS nitrate mainly arose from sodium-salt-like particles,
ferred into corrected number and mass fractions without the       while aged-biomass-burning particles were dominant during
need of a reference instrument in the field. Considering the      events with high organic aerosol particle concentrations.
entire measurement period, aged-biomass-burning and soil-
dust-like particles dominated the particle number (45.0 %
number fraction) and mass (31.8 % mass fraction); sodium-
salt-like particles were the second lowest in number (3.4 %)      1   Introduction
but the second dominating class in terms of particle mass
(30.1 %). This difference demonstrates the crucial role of        Lifetimes of ambient aerosol particles range from hours to
particle number counts’ correction for mass quantification        several days, except for newly formed particles (∼ 3 to 5 nm),
using SPMS data. Using corrections for size-resolved and          which have a lifetime on the order of seconds (Pöschl, 2005).
chemically resolved ODE, the total mass of the particles          The atmospheric evolution of aerosol particles can alter their
measured by LAAPTOF accounts for 23 %–68 % of the total           internal and external mixing states, as well as their chemical
mass measured by an aerosol mass spectrometer (AMS) de-           and physical properties on timescales of several hours; e.g.

Published by Copernicus Publications on behalf of the European Geosciences Union.
2220                                            X. Shen et al.: Particle identification and quantification by single particle MS

they can acquire coatings of secondary inorganic (e.g. sul-          based on subtle changes in ion arrival times in the mass spec-
fates, nitrates, and ammonium) and secondary organic com-            trometer, was introduced by Marsden et al. (2018) for the
pounds (Fuzzi et al., 2015). Hence, most aerosol particles are       differentiation of mineral phases in silicates. Ternary sub-
relatively complex mixtures; they are not easy to distinguish        composition systems, such as (Al + Si)+ –K+ –Na+ and Cl− -
and trace to their primary source and/or secondary forma-            (CN + CNO)− –SO−     4 , were used to identify mineralogy and
tion pathway. Single-particle mass spectrometry (SPMS) has           internal mixing state of ambient particles (Marsden et al.,
the capability of measuring most components of the parti-            2019). In our previous study (Shen et al., 2018), laboratory-
cles in real time; thus it has been a widely used technique          based reference spectra were suggested to be a useful tool
to investigate mixing state and aging of aerosol particles for       for particle identification. These methods guide the way for
many years (Murphy, 2007; Noble and Prather, 2000; Pratt             improving the techniques to identify particle type and further
and Prather, 2012). However, there are still challenging is-         identify individual aerosol particles.
sues related to large amounts of SPMS data analysis.                    An even more challenging issue is the quantitative anal-
    Particle type identification, i.e. the assignment of every de-   ysis of individual particles’ mass and chemical composi-
tected particle to one out of a set of particle types, which         tion, which cannot be directly provided by SPMS measure-
are either predefined or deduced from the experimental data,         ments because laser ablation only allows an a priori unknown
is perhaps one of the most critical issues. Different data           fraction (neutral species) of the single particle to be vapor-
classification methods, e.g. fuzzy k-means clustering algo-          ized/desorbed and then ionized (Murphy, 2007; Reinard and
rithm, fuzzy c-means (modification of k-means), ART-2a               Johnston, 2008). In addition, matrix effects may obscure the
neural network, hierarchical clustering algorithms, and ma-          particle composition (Gemayel et al., 2017; Gross et al.,
chine learning algorithms, are applied to reduce the complex-        2000; Hatch et al., 2014). Our previous laboratory SPMS
ity and highlight the core information of mass spectrometric         study also verified the difficulty of particle quantification
data (Reitz et al., 2016; Christopoulos et al., 2018). Reitz et      due to incomplete ionization, which could not be improved
al. (2016) reviewed commonly used data classification meth-          significantly by replacing the originally used nanosecond
ods in SPMS studies and pointed out the advantage of the             excimer laser with a femtosecond laser with higher laser
fuzzy c-means clustering approach, which allows individual           power density and shorter laser pulse length (Ramisetty et
particles to belong to different particle classes according to       al., 2018). In the last two decades, great effort has been put
spectral similarities. One recent classification approach ap-        into solving such quantification issues by using specific scal-
plied machine learning algorithms and successfully distin-           ing or normalization methods. Allen et al. (2006) developed
guished SOA, mineral dust, and soil dust, as well as biologi-        an explicit scaling method to quantify SPMS data, based on
cal aerosols based on a known a priori data set (Christopou-         comparison with co-located more quantitative particle mea-
los et al., 2018). In this study we used the fuzzy c-means           surement. This approach has been widely used to obtain con-
clustering approach which is embedded in the data analy-             tinuous aerosol mass concentrations as a function of particle
sis Igor software for our laser ablation aerosol particle time-      size (Allen et al., 2006; Bein et al., 2006; Fergenson et al.,
of-flight mass spectrometer (LAAPTOF; AeroMegt GmbH).                2001) and has been improved by a hit rate correction (Qin
Based on the data classification, averaged or representative         et al., 2006; Wenzel et al., 2003). Recently, composition-
mass spectra of different particle classes can be obtained.          dependent density corrections were applied to such scaling
    Due to the relatively complex laser desorption and ioniza-       approaches to obtain chemically resolved mass concentra-
tion (LDI) mechanisms, including charge and proton trans-            tions (Gunsch et al., 2018; May et al., 2018; Qin et al., 2006,
fer, as well as ion-molecule reactions that may occur in the         2012). In these studies, the scaled SPMS data showed good
plume with many collisions (Murphy, 2007; Reilly et al.,             agreement with the results from reference instruments, e.g. a
2000; Reinard and Johnston, 2008; Zenobi and Knochen-                micro-orifice uniform deposition impactor (MOUDI), a scan-
muss, 1998), some mass spectroscopic signature peaks do              ning mobility particle sizer (SMPS), an aerodynamic particle
not necessarily reflect the primary composition of the parti-        sizer (APS), and other independent quantitative aerosol par-
cles. Gallavardin et al. (2008) used a pair of peak area ra-         ticle measurements, e.g. by a high-resolution time-of-flight
tios, such as Ca2 O+ /Ca+ vs. CaO+ /Ca+ and SiO− /SiO−          2    aerosol mass spectrometer (HR-ToF-AMS). With respect to
vs. SiO−        −
         3 /SiO2 , to differentiate calcium-/silicon-containing      particulate chemical compounds, Gross et al. (2000) reported
mineral dust. Normalized histograms of PO−                 −
                                                    3 /PO2 and       relative sensitivity factors (RSFs) for ammonium and alkali
     −        −
CN /CNO ratios were used to identify primary biological              metal cations in a single-particle mass spectrometer to corre-
aerosol particles (Zawadowicz et al., 2017). Setting thresh-         sponding bulk concentrations and accurately determined the
olds for marker peak signals can also help to classify and           relative amounts of Na+ and K+ in sea salt particles. Jeong
further identify specific particles (Köllner et al., 2017). Lu       et al. (2011) developed a method to quantify ambient partic-
et al. (2018) used natural silicon isotopic signatures to study      ulate species from scaled single-particle analysis. Healy et
the sources of airborne fine particulate matter (PM2.5 ), which      al. (2013) quantitatively determined the mass contribution of
shows how useful isotopic signatures can be for particle iden-       different carbonaceous particle classes to total mass and esti-
tification. A combination of peak area and peak shift ratio,         mated the mass fractions of different chemical species, i.e.

Atmos. Meas. Tech., 12, 2219–2240, 2019                                                www.atmos-meas-tech.net/12/2219/2019/
X. Shen et al.: Particle identification and quantification by single particle MS                                              2221

sulfate, nitrate, ammonium, organic carbon (OC), elemen-          2     Methods
tal carbon (EC), and potassium determined for each particle
class, by using RSFs. The resulting SPMS-derived mass con-        2.1    Measurement location and instrumentation
centrations of these particulate species were comparable with
the reference bulk data. Similar methodologies have been          The measurements were made as part of the TRAM01 cam-
used in other SPMS studies (Gemayel et al., 2017; Zhou et         paign at a rural site in the upper Rhine valley from 15 July to
al., 2016). It should be noted that these field-based scaling     1 September 2016 next to the tram line north of the village
approaches (field-based overall detection efficiency, ODE)        of Leopoldshafen, Germany (49◦ 60 10.5400 N, 8◦ 240 26.0700 E).
rely on the availability of a reference instrument, and their     This location is about 12 km north of the city of Karlsruhe,
corrections are mainly class-independent.                         with 300 000 inhabitants and significant industry including
   Many previous studies have also compared single-particle       a power plant and refineries (Hagemann et al., 2014). Am-
classes and bulk species (Dall’Osto et al., 2009, 2012, 2013,     bient particles were sampled for mass spectroscopic anal-
2016; Dall’Osto and Harrison, 2012; Decesari et al., 2011,        ysis with a flow rate of 1 m3 h−1 through a PM2.5 inlet
2014; Drewnick et al., 2008; Gunsch et al., 2018; Pratt           (SH 2.5 – 16, Comde-Derenda GmbH) and vertical stain-
et al., 2010, 2011; Pratt and Prather, 2012). Some studies        less steel tubes. A total suspended particulate (TSP) inlet
compared ion intensities from single-particle data (Bhave         (Comde-Derenda GmbH) was used for instruments for parti-
et al., 2002) or specific ion ratios, such as nitrate / sulfate   cle physical characterization. Trace gases were sampled via
(Middlebrook et al., 2003), OC/EC (Spencer and Prather,           an 8 mm PFA sampling tube. All sampling inlets were posi-
2006), and EC/(EC + OC) (Ferge et al., 2006), carbona-            tioned 1.5 m above a measurement container and 3.7 m a.g.l.
ceous / (carbonaceous + sulfate) (Murphy et al., 2006) with       To study the nature and to identify possible sources of the
the other bulk data. Hatch et al. (2014) used m/z 36 C+    3 as   particles in this area, their number, size, chemical composi-
a pseudo-internal standard to normalize the secondary inor-       tion, and associated trace gases, as well as meteorological
ganic and organic peak areas in organic-rich particles, result-   conditions, were measured using the following instruments:
ing in good correlation with the independent AMS measure-         condensation particle counters (CPC3022A, CPC3772, TSI
ments. Similarly, Ahern et al. (2016) used the peak area ra-      Inc.), an optical particle counter (FIDAS, PALAS GmbH),
tio of organic matter marker at m/z 28 CO+ to EC mark-            an aethalometer (AE33-7, Magee Scientific), an ozone mon-
ers (C2 −+5 ) to account for laser shot-to-shot variability and   itor (O341M, Environment SA), a SO2 monitor (AF22M
demonstrated a linear relationship between normalized or-         Environment SA), a NO2 monitor (AS32M, Environment
ganic intensity and secondary organic aerosol (SOA) coat-         SA), a CO2 monitor (NGA2000, Rosemont Inc.), and me-
ing thickness on soot particles. A normalized or relative peak    teorology sensors (WS700 & WS300, Lufft GmbH). From
area (RPA) method was suggested by Hatch et al. (2014) to         26 July to 31 August, the following mass spectrometers
account for shot-to-shot variability of laser intensities. Al-    were in operation: a high-resolution time-of-flight aerosol
though the LDI matrix effects cannot be completely over-          mass spectrometer (HR-ToF-AMS; Aerodyne Inc.) and a
come by the aforementioned method, some examples for              laser ablation aerosol particle time-of-flight mass spectrom-
good comparisons between single-particle and bulk measure-        eter (LAAPTOF; AeroMegt GmbH), providing real-time in-
ments were shown.                                                 formation on size and mass spectral patterns for bulk samples
   In this study we aim to quantify mass contributions of         and individual particles, respectively.
different particle classes based on single-particle measure-         The HR-ToF-AMS yields quantitative information (mass
ments only by employing overall detection efficiencies de-        concentration) on size-resolved particle bulk chemical com-
termined in systematic laboratory studies. As a test case         position with high time resolution and high sensitivity (De-
ambient aerosol particles were analysed in summer 2016            Carlo et al., 2006). Briefly, aerosols are sampled with a flow
at a rural site in the upper Rhine valley of Germany, us-         rate of ∼ 84 cm3 min−1 via an aerodynamic lens, which fo-
ing a LAAPTOF and a HR-ToF-AMS. Seven major particle              cuses particles with sizes of 70 to 2500 nm (vacuum aero-
classes were identified by a fuzzy c-means analysis among         dynamic diameter, dva ) into a narrow beam. The particle
a total of ∼ 3.7 × 10⁵ measured single particles. Based on        beam passes through a sizing chamber where the particles’
laboratory-determined size-dependent overall detection effi-      size is determined. Afterwards, particles encounter a 600 ◦ C
ciencies (ODEs) of LAAPTOF for different reference parti-         heater that vaporizes the non-refractory species. The vapours
cle types, mass contributions for individual aerosol particles    are ionized by electron impact (electron energy: 70 eV). The
could be estimated. Aerosol particle mass concentrations de-      generated positive ions are analysed by a time-of-flight mass
termined independently by LAAPTOF and AMS are com-                spectrometer. Particles can bounce off the heater/vaporizer,
pared, and potentially useful relationships of specific ion in-   leading to an underestimation of ambient mass concentra-
tensity ratios of LAAPTOF and AMS are discussed.                  tions measured by AMS. Collection efficiencies (CEs) are
                                                                  used to correct for this (CE is the product of net particle trans-
                                                                  mission and detection efficiency) (Canagaratna et al., 2007).
                                                                  It is important to note that the CE can vary depending on

www.atmos-meas-tech.net/12/2219/2019/                                               Atmos. Meas. Tech., 12, 2219–2240, 2019
2222                                          X. Shen et al.: Particle identification and quantification by single particle MS

composition and phase of the particles (Bahreini et al., 2005).    gree of similarity between aerosol particles in one particular
In this study, we applied a CE value of 0.5. This is in agree-     class, rather than a number percentage. Thus, we can obtain
ment with previous studies (Canagaratna et al., 2007; Mid-         similarity information for the whole data set rather than a
dlebrook et al., 2012) and close to a composition-dependent        single particle (Hinz et al., 1999; Reitz et al., 2016). One
CE calculated for this measurement campaign by Huang et            drawback is that the individual particles are not directly as-
al. (2019).                                                        signed to individual particle classes, which hinders a direct
   The LAAPTOF is a commercially available SPMS and                class-dependent quantification of particle mass. In order to
has been described elsewhere (Ahern et al., 2016; Gemayel          quantify particle mass, we first need to assign a particle class
et al., 2016; Marsden et al., 2016; Ramisetty et al., 2018;        to every individual particle, which is achieved by correlat-
Reitz et al., 2016; Shen et al., 2018; Wonaschuetz et al.,         ing the individual bipolar mass spectra with the represen-
2017). In brief, aerosols are sampled with a flow rate of          tative fuzzy class spectra using Pearson’s correlation coef-
∼ 80 cm3 min−1 via an aerodynamic lens, focusing and ac-           ficient (γ ). Since the positive LAAPTOF spectra are more
celerating particles in a size range between 70 and 2500 nm        characteristic than the negative ones (Shen et al., 2018), the
dva . Afterwards, they pass through the detection chamber          threshold value for the positive spectra correlation was set
with two diode laser beams (λ = 405 nm). Particles smaller         to γpos ≥ 0.6, while for the negative spectra, γneg was tuned
than 200 nm and larger than 2 µm are difficult to detect, due      with values ranging from 0.3 to 0.8 (refer to Table S1). Indi-
to weak light scattering by the smaller particles and due to a     vidual particles are assigned to the class for which the corre-
larger particle beam divergence for the larger particles. Once     sponding correlation coefficients for both spectra exceed the
a single particle is detected successively by both of the detec-   threshold values. All corresponding correlation coefficients
tion lasers, its aerodynamic size is determined and recorded       (γpos and γneg ) are listed in Table S1. This way, we can obtain
based on its time of flight, and an excimer laser pulse (λ =       time series of particle counts, which have good (γ > 0.6) or
193 nm) is fired for a one-step desorption/ionization of the       strong correlation (γ > 0.8) with the fuzzy results. The cor-
refractory and non-refractory species of the particle. The re-     responding correlation coefficients are also listed in Table S1,
sulting cations and anions are analysed by a bipolar time-of-      and typical examples are shown in Fig. S1. With this method,
flight mass spectrometer, resulting in mass spectra with unit      we were able to successfully classify 96 % of the measured
mass resolution. Thus, for each individual particle, its size      particles. Once the class information for individual particles
and a pair of positive and negative mass spectra are mea-          has been determined, we are able to calculate single-particle
sured.                                                             geometric size, volume, and mass as described in the follow-
                                                                   ing.
2.2    Single-particle identification and quantification              For simplicity, we assume the particles are spherical with
       methods for LAAPTOF data                                    a shape factor (χ) of 1; thus particle geometric diameter (dp ),
                                                                   volume (Vp ), and mass (mp ) can be obtained from the follow-
The general data analysis procedures for particle spectral and     ing equations:
size information were described in full detail in our previous
                                                                             dva
study (Shen et al., 2018). In brief, spectral data are classi-     dp = dm =        × ρ0 χ = 1; ρp = ρeff
fied by a fuzzy c-means clustering algorithm embedded in                     ρeff
the LAAPTOF data analysis Igor software (Version 1.0.2,               (DeCarlo et al., 2004)                                    (1)
AeroMegt GmbH) to find the major particle classes. After-               1
wards, we can obtain particle-class-resolved size (dva ) dis-      Vp = × π × dp 3                                              (2)
                                                                        6
tribution and the representative spectra, which will be cor-       mp = Vp × ρeff ,                                             (3)
related with laboratory-based reference spectra. The result-
ing correlations together with marker peaks (characteristic        where dm is the electrical mobility diameter, dva is the vac-
peaks arising from the corresponding species) and some typ-        uum aerodynamic diameter measured by LAAPTOF, ρ0 is
ical peak ratios, e.g. isotopic ratio of potassium, are used to    the standard density (1 g cm−3 ), ρp is the particle density, and
identify the particle classes. Here, we extend this approach to    ρeff is the effective density. It should be noted that in some
quantify particle class mass contributions using a large am-       previous studies, the particle shapes were also assumed to be
bient sample as test case.                                         spherical, and uniform particle densities ranging from ∼ 1.2
   The fuzzy c-means clustering approach has the advantage         to 1.9 g cm−3 were applied for total aerosol particle mass
of allowing particles to belong to multiple classes based on       quantification (Allen et al., 2000, 2006; Ault et al., 2009;
the similarity of the mass spectra (Reitz et al., 2016), namely    Gemayel et al., 2017; Healy et al., 2012, 2013; Jeong et al.,
attributing one spectrum (particle) to multiple clusters (parti-   2011; Wenzel et al., 2003; Zhou et al., 2016). In our study,
cle classes). The similarity metric is Euclidian distance be-      we have determined an average density of 1.5 ± 0.3 g cm−3
tween the spectral data vectors and a cluster centre (Hinz         for all ambient particles, based on a comparison between dva
et al., 1999; Reitz et al., 2016). In our study, the fuzzy-        measured by AMS and dm measured by SMPS. However,
clustering-derived fraction for each particle class is the de-     the density for different types of ambient particles varies,

Atmos. Meas. Tech., 12, 2219–2240, 2019                                              www.atmos-meas-tech.net/12/2219/2019/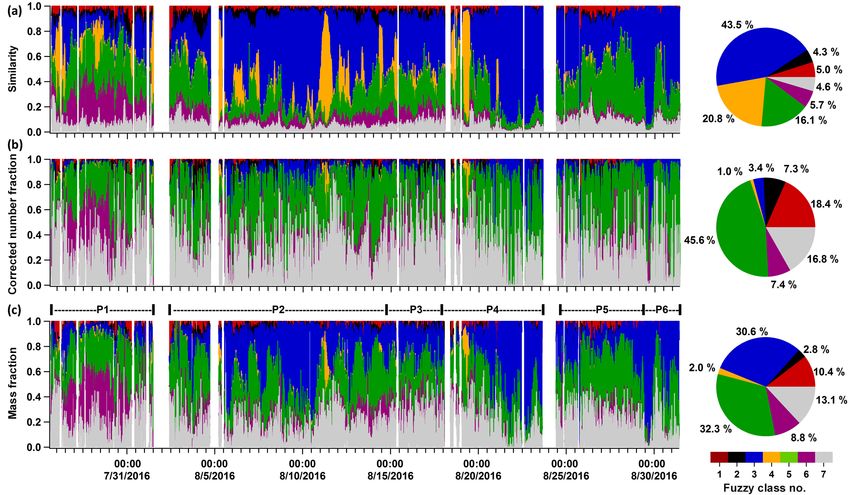
X. Shen et al.: Particle identification and quantification by single particle MS                                               2223

especially for fresh ones (Qin et al., 2006). Particle densi-       with the reference soot particles (refer to Fig. 1). For the same
ties varied during the campaign (Fig. S2), and the repre-           reason, the minimum ODE curve from all reference particles
sentative mass spectra of different particle classes indicate       was used for all dust-like particle classes. It should be noted
chemical inhomogeneity. In order to reduce the uncertainty          that dust-like particles were often mixed with other species
induced by the assumption of a uniform density, we assigned         such as organics (e.g. biomass burning–soil particles; refer
specific effective densities (derived from dva /dm ) from lit-      to Sect. 3.1) and that they likely have dust-core-shell struc-
erature data to each particle class. A density of 2.2 g cm−3        tures (Goschnick et al., 1994). We assume that their detection
was used for calcium-nitrate-rich particles (Zelenyuk et al.,       is dominated by the dust core as it significantly influences
2005), 1.25 g cm−3 for aged soot rich in ECOC and sulfate           the light scattering (size) and the particle beam divergence
(Moffet et al., 2008b; Spencer et al., 2007), 2.1 g cm−3 for        (shape).
sodium salts (Moffet et al., 2008b; Zelenyuk et al., 2005),             The chemically resolved ODE could also bring some bias
1.7 g cm−3 for secondary-inorganic-rich particles (Zelenyuk         due to the complex particle matrix. For instance, if ammo-
et al., 2005, 2008), 2.0 g cm−3 for aged-biomass-burning par-       nium sulfate is internally mixed with ammonium nitrate,
ticles (Moffet et al., 2008b), and 2.6 g cm−3 for dust-like par-    LAAPTOF can detect both of them with good efficiency.
ticles (Bergametti and Forêt, 2014; Hill et al., 2016). These       This has been verified in our laboratory, and the matrix effect
densities were used for the individual particles of each class      has been discussed in our previous study (Shen et al., 2018).
without size dependence. Similar chemically resolved densi-         As shown in Fig. 1, ODEs for ammonium nitrate are at a
ties have also been used in some previous studies (Gunsch et        higher level, while ODEs for sodium chloride are relatively
al., 2018; May et al., 2018; Qin et al., 2006, 2012).               low. This could lead to an underestimation and overestima-
   Furthermore, the single-particle identification allows for       tion of secondary-inorganic-rich and sodium salt particles,
correcting the particle number counts by using the overall          respectively. ODEs from reference particles with low detec-
detection efficiency (ODE), which depends strongly on par-          tion efficiency were applied to dust-like particles. This may
ticle size and type (Allen et al., 2000; Dall’Osto et al., 2006;    lead to an overestimation of their concentration if they are
Qin et al., 2006; Shen et al., 2018). In a previous publication,    mixed with better detectable species. Mean ODE values were
we defined ODE as the number of bipolar mass spectra ob-            applied to soot particles which may lead to an overestimation
tained from the total number of particles in the sampled air,       if they were, e.g. coated. This is because even non-absorbing
described how to generate the laboratory-derived ODE, and           species, e.g. organics, can refract light towards the absorb-
discussed the factors influencing ODE in detail (Shen et al.,       ing black carbon core, increasing light absorption (Acker-
2018). Our ODE accounts for both physical and chemical              man and Toon, 1981). Since most of the particle classes con-
factors (e.g. particle size and types shown in Fig. 1). How-        sist of mixtures of the poorly detectable types with better
ever, we did not determine relative sensitivity factors for in-     detectable types, this seems to partially compensate for the
dividual chemical compounds. As shown in Fig. 1, we have            limitation of LAAPTOF to detect certain particle types as
determined ODEs for several particle types, from particles          evident by comparison with the AMS mass concentrations
consisting of pure compounds to the more realistic ones in-         (refer to Sect. 3.2).
cluding major ambient particles (refer to Fig. 1). For sim-             As shown Fig. 1, we determined ODE values for mobility
plicity and in order to account for different types of ambient      equivalent particle sizes (dm ) ranging from 300 to 1 µm. The
particles, we averaged the ODE determined for ammonium              ODE decreases significantly for larger particles because of
nitrate, sodium chloride, PSL particles, and some other par-        increasing particle beam divergence. We assume ODEs for
ticles, e.g. agricultural soil dust, sea salt, and organic acids,   supermicron particles to follow the decreasing trend illus-
as well as secondary organic aerosol particles measured in          trated in Fig. 1. Please note that LAAPTOF cannot measure
the lab. The mean ODEs with uncertainties as a function             particles larger than a dva of 2.5 µm, which corresponds to
of particle size (dm ) are shown in Fig. 1. However, using a        a dm of 1.0 to 1.5 µm, assuming effective particle densities
mean ODE will obviously lead to some bias. For example, if          of 1.7 to 2.6 g cm−3 for different ambient particle classes,
we apply ODE mean values to all the ambient particles, the          respectively. Hence, a large fraction of the ambient particles
number of ammonium-nitrate-rich particles will be overesti-         measured by LAAPTOF could be number-corrected by using
mated due to the higher ODE of ammonium nitrate, while the          our laboratory-derived ODEs.
ammonium-sulfate-rich, sea salt particles, and some organic-
rich particles will be underestimated. Therefore, we used ref-
erence particle ODE values to estimate the size-dependent
ODE values for the particle classes observed in the field as
follows. ODE values for ammonium nitrate and sodium chlo-
ride were used to fit ODE curves for secondary-inorganic-
rich and sodium-salt-like particles, respectively. The mean
ODE values from all reference particles were used for the
class of aged soot particles since they showed best agreement

www.atmos-meas-tech.net/12/2219/2019/                                                 Atmos. Meas. Tech., 12, 2219–2240, 2019
2224                                              X. Shen et al.: Particle identification and quantification by single particle MS

                                                                         number counts and mass at each time point, and the sam-
                                                                         ple flow rate is ∼ 80 cm−3 min−1 . Using Eqs. (4) to (6) we
                                                                         can calculate the corrected number and mass fractions.
                                                                            The aforementioned assumptions and the related uncer-
                                                                         tainties in particle mass are summarized as follows: (1) am-
                                                                         bient particles are spherical with a shape factor χ = 1. How-
                                                                         ever, several ambient particle types are non-spherical with a
                                                                         shape factor χ not equal to 1, e.g. χNaCl = 1.02–1.26 (Wang
                                                                         et al., 2010) and χNH4 NO3 = 0.8 (Williams et al., 2013). This
                                                                         can cause uncertainties of 26 % and 20 % for the particle di-
                                                                         ameter and 100 % and 50 % for the particle mass of sodium-
                                                                         chloride-like and ammonium-nitrate-like particles, respec-
                                                                         tively. For soot-like particles, the shape-caused uncertainty
Figure 1. Overall detection efficiency of LAAPTOF for differ-            could be even larger, due to their aggregate structures. Such
ent types of particles as a function of the mobility diameter (dm ),     an uncertainty is difficult to reduce, since we do not have
adapted from Shen et al. (2018) and extended. Dashed lines are fit-      particle shape information for individual particles. However,
ting curves for maximum, mean, and minimum values of ODE. For            using effective densities may at least partially compensate
other organic particles (green), ODE at 400 nm is the data from sec-
                                                                         for some of the particle-shape-related uncertainties. (2) Par-
ondary organic aerosol (SOA) particles from α-pinene ozonolysis,
                                                                         ticles in the same class have the same density, which is likely
ODE at 500 nm is the data from humic acid, and ODE at 800 nm is
the data from humic acid (1.9 ± 0.3 %), oxalic acid (0.3 ± 0.1 %),       to vary and lead to an uncertainty hard to estimate. (3) The
pinic acid (1.6 ± 0.1 %), and cis-pinonic acid (1.9 ± 0.7 %). SOA        variability of the ODE values (refer to Fig. 1) depends on par-
particles were formed in the Aerosol Preparation and Characteriza-       ticle size and type. It reaches values ranging from ±100 % for
tion (APC) chamber and then transferred into the AIDA chamber.           200 nm particles to ±170 % for 800 nm size particles.
Agricultural soil dust (brown symbol) was dispersed by a rotating           Hence, the overall uncertainty in particle mass accord-
brush generator and injected via cyclones into the AIDA chamber.         ing to the assumptions is ∼ 300 %, with the ODE-caused
Sea salt particles (purple) were also sampled from the AIDA cham-        uncertainty being dominant. This is because (1) the afore-
ber. Soot particles from incomplete combustion of propane were           mentioned particle matrix effects may cause higher or lower
generated with a propane burner (RSG miniCAST; Jing Ltd.) and            ODEs than their surrogates generated in the laboratory. In
then injected into and sampled from a stainless steel cylinder of
                                                                         addition, the more complex morphology and various optical
∼ 0.2 m3 volume. SiO2 particles were directly sampled from the
                                                                         properties of ambient particles can have a strong impact on
headspace of their reservoirs. The other aerosol particles shown in
this figure were generated from a nebulizer and were size-selected       their ODE (Shen et al., 2018). (2) Instrumental aspects such
by a DMA. Note that there is uncertainty with respect to particle size   as alignment and variance in particle-laser interaction lead to
due to the particle generation method. The nebulized and DMA-            uncertainty in ODE. They are included in the uncertainties
sized samples have relative smaller standard deviation (SD) from         given in Fig. 1, for which repeated measurements after vari-
Gaussian fitting to the measured particle sizes. PSL size has the        ous alignments were used. The fluctuations of particle-laser
smallest size SD (averaged value is 20 nm), and the corresponding        interactions can be reduced by using a homogeneous laser
relative SD (RSD = SD divided by the corresponding size) is ∼ 6 %,       desorption and ionization beam (Wenzel and Prather, 2004)
since the original samples are with certain sizes. The other nebu-       or delayed ion extraction (Li et al., 2018; Vera et al., 2005;
lized samples have standard deviations ranging from 70 to 120 nm         Wiley and Mclaren, 1955). Note that we used the same siz-
SD and 3 % to 23 % RSD. Particles sampled from the AIDA cham-
                                                                         ing laser and desorption/ionization laser pulse energy (4 mJ)
ber have a much bigger size SD: ∼ 70 nm for SOA (17 % RSD),
                                                                         in the field as those used for generating ODE and aligned
∼ 100 nm for agricultural soil dust (∼ 83 % RSD), and ∼ 180 nm
for sea salt particles (∼ 34 % RSD). Considering this uncertainty,       the instrument in the field with the similar procedures as we
we have chosen a size segment of 100 nm (±50 nm) for correc-             did in the lab. During our field measurements we did cali-
tion; e.g. particles with sizes of 450 to 550 nm will use the ODE        brations of the LAAPTOF with PSL particles of 400, 500,
at 500 nm particle number correction.                                    700, and 800 nm dm , resulting in ODE values with no signif-
                                                                         icant difference compared to the ODE values determined in
                                                                         the laboratory. This finding reflects the good stability of the
  The equations for correction and calculation of mass con-              LAAPTOF performance in the temperature-controlled con-
centration are as follows:                                               tainer. Actually, once the LAAPTOF adjustments were opti-
countscorrected = 1/ODEsize-resolved and chemically resolved      (4)    mized after transport, no further adjustments were necessary
masscorrected = countscorrected × mp                              (5)    during the 6 weeks of the campaign. Moreover, it is important
                                                                         to note that the ODE curve applied herein should not be ex-
mass concentration =
                                                                         trapolated to other LAAPTOF or SPMS instruments without
    total mass/(sample flow rate × time),                         (6)    a standard check against, e.g. PSL particles. In order to evalu-
where ODEdm is the mean ODE that depends on dm ,                         ate our quantification approach, we will compare the particle
countscorrected and masscorrected are the corrected particle
Atmos. Meas. Tech., 12, 2219–2240, 2019                                                    www.atmos-meas-tech.net/12/2219/2019/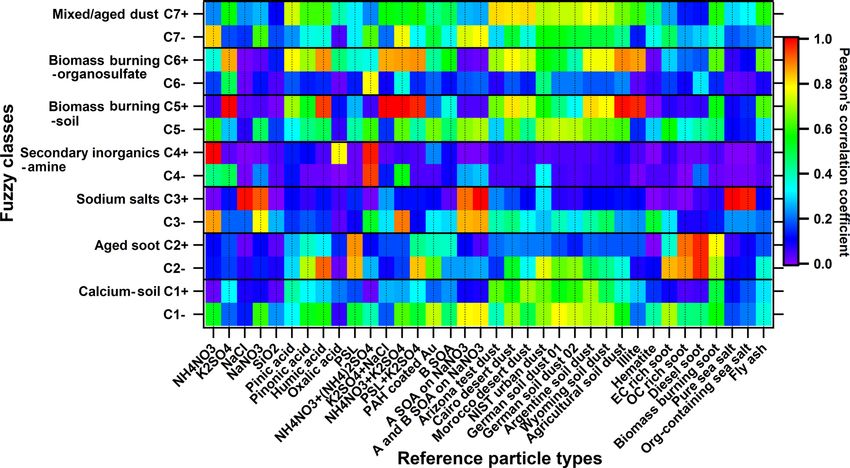
X. Shen et al.: Particle identification and quantification by single particle MS 2225
mass estimated based on single-particle measurements with to Fig. 5). The spectra of this class in our study feature
AMS total mass in Sect. 3.2. marker peaks arising from NaNO3 (m/z 115 Na(NO2 )− 2,
It is noteworthy that the major difference between our 131 NaNO2 NO− 3 , and 147 Na(NO 3 )−
2 ), Na2 SO 4 (m/z 165
quantification method and previous SPMS studies is that our Na3 SO+ +
4 ), and NaCl (m/z 81/83 Na2 Cl , 139/141 Na3 Cl2 ,
+
− −
ODE is based on elaborate laboratory work, while previous 35/37 Cl , and 93/95 NaCl2 ) (refer to Fig. 2). These signa-
studies typically used field-based scaling approaches (field- ture peaks were also observed for Na-related particle types
derived ODE). such as aged sea salt, Na-containing dust, and Na/K-sulfate-
rich particles in the other SPMS studies (Gard et al., 1998;
Gaston et al., 2011; Jeong et al., 2011; May et al., 2018;
3 Results and discussion Middlebrook et al., 2003; Schmidt et al., 2017). In the pos-
itive spectra of class 3, there is a nitrogen-containing or-
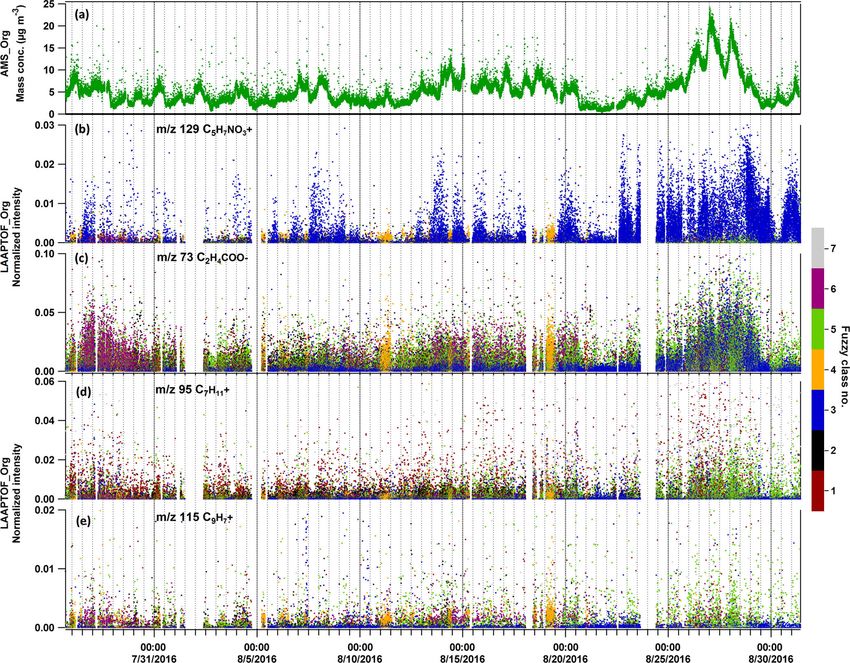
3.1 Identification of particle classes and the internal ganic compound marker at m/z 129 C5 H7 NO+ , which could
mixing originate from the OH oxidation of volatile organic com-
pounds (VOCs) in the presence of NOx on the seed parti-
During the 6-week measurement campaign, we obtained cles, since the same peak was observed during simulation
∼ 3.7 × 10⁵ bipolar LAAPTOF spectra for single particles. chamber studies with OH radicals reacting with α-pinene
Seven major particle classes were found using fuzzy c-means and/or toluene in the presence of NOx . Besides, peaks at
classification. The corresponding representative spectra with m/z 149 C4 H7 O2 NO+ +
3 and 181 C4 H7 O4 NO3 are associ-
marker peaks’ assignment are shown in Fig. 2. Consider- ated with organonitrates that can form from the oxidation
ing some weak but characteristic peaks, we show the spec- of VOCs in the presence of NOx (Perring et al., 2013) and
tra with a logarithmic scale. The linearly scaled spectra (re- are expected to increase the light absorbing capability of
fer to Fig. S3 in the Supplement) are provided for com- the particles (Canagaratna et al., 2007). Huang et al. (2019)
parison in the supporting information. Furthermore, Fig. 3 showed that organonitrates contributed to particle growth
shows the size-resolved number fraction for the seven par- during night-time at this location. This class accounts for
ticle classes measured during the field campaign TRAM01, the largest fraction in the size range from 1000 to 2500 nm
based on fuzzy classification according to the fuzzy c-means dva (refer to Fig. 3). The size distribution of class 3 parti-
clustering algorithm as well as the overall size distribution cles was dominated by two modes centred at about 1400 and
for all particles measured by LAAPTOF during the cam- 2000 nm dva , indicating two sub-particle populations in this
paign. Signatures for organic and secondary inorganic com- class. Goschnick et al. (1994) did offline depth-resolved anal-
pounds can be observed in each class, i.e. for organics m/z 24 ysis of the aerosol particles collected north of Karlsruhe in
C− − −
2 , 25 C2 H , 26 C2 H2 /CN , and 42 C2 H2 O/CNO , for
−
the upper Rhine valley and observed sodium chloride in both
− − − −
sulfate 32 S− , 64 SO2 , 80 SO3 , 81 HSO3 , 97 HSO4 , 177 fine and coarse particles, while sodium nitrate was mainly
SO3 HSO− − +
4 , and 195 HSO4 H2 SO4 , for nitrate 30 NO , 46 enriched in the coarse mode. This hints at possible sub-class
− − +
NO2 , and 62 NO3 , and for ammonium 18 NH4 and 30 assignments, which are likely to be fresh and aged sea salts.
NO+ . Similar species were previously identified offline in However, the measurement site is relatively far away from
the same region (Faude and Goschnick, 1997; Goschnick et the sea (e.g. the North Atlantic Ocean is ∼ 800 km away).
al., 1994). Note that 30 NO+ can not only originate from Therefore, we need more evidence, such as back trajectory
nitrate (majority), but also from ammonium (Murphy et al., analysis or other transport modelling, to prove that this class
2006; Shen et al., 2018). Besides, m/z 24 C− 2 could also is really fresh and/or aged sea salt. This will be discussed in
be related to elemental carbon (EC). In this case, m/z 24− a separate study.
should actually show a higher intensity than m/z 26− , and A total of 20.8 % of the total particle population belongs
further EC markers (C± n ) should show up as well. Although to class 4 (secondary inorganics–amine). This class has the
different particle classes have similar fragments, they show most prominent secondary inorganic signature and strongest
characteristic patterns with several intensive marker peaks in correlation with the reference spectra for homogeneous mix-
the corresponding spectra, which can also be identified using tures of NH4 NO3 and (NH4 )2 SO4 . In addition, it features
reference spectra (Shen et al., 2018). marker peaks for amines at m/z 58 C2 H5 NHCH+ 2 , 59
After fuzzy classification each particle was tested for its (CH3 )3 N+ , 86 (C2 H5 )2 NCH+ 2 , 88 (C H )
2 5 2 NO/C +
3 6 NO2 ,
H
+
similarity to the different particle classes. Although a simi- and 118 (C2 H5 )2 NCH2 , which were also identified by
larity is not equal to the number fraction, they are related. A SPMS in the other field and lab studies (Angelino et al.,
higher similarity of the total aerosol particles to one class 2001; Dall’Osto et al., 2016; Healy et al., 2013; Jeong et al.,
indicates that a bigger number fraction of this class may 2011; Köllner et al., 2017; Lin et al., 2017; Pratt et al., 2009;
be expected once the individual particles are assigned to it. Roth et al., 2016; Schmidt et al., 2017). Among all the repre-
As shown in Fig. 4a, the highest similarity (43.5 % of all sentative mass spectra for the seven particle classes, class 4 is
particles) is found to class 3, which is named sodium salts relatively “clean” with the fewest peaks (refer to Figs. 2 and
due to its strong correlation (γ ≥ 0.8) with Na salts (refer S3), indicating that these particles did not have had the time
www.atmos-meas-tech.net/12/2219/2019/ Atmos. Meas. Tech., 12, 2219–2240, 2019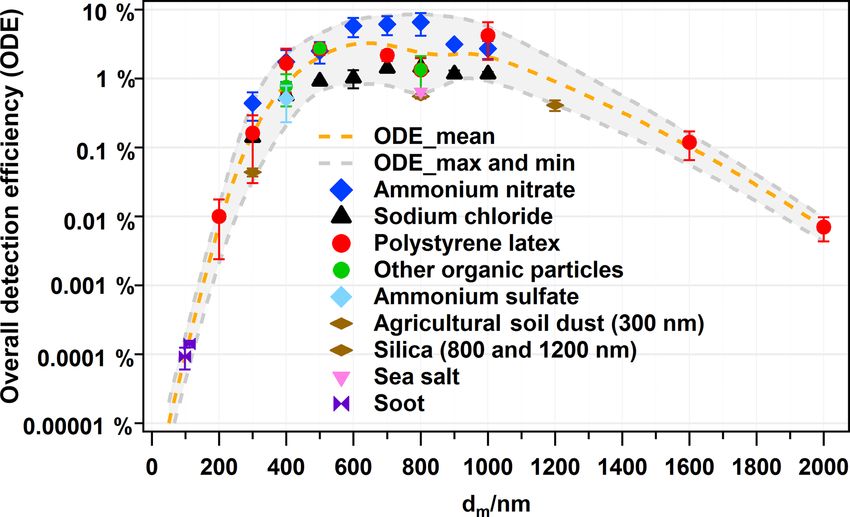
2226                                              X. Shen et al.: Particle identification and quantification by single particle MS

Figure 2. Representative mass spectra of seven particle classes measured during the field campaign TRAM01, based on fuzzy classification
according to the fuzzy c-means clustering algorithm, and averaged spectrum of a total of ∼ 3.7 × 10⁵ single particles measured. The percent-
age in each pair of spectra gives us information about the similarity of the total aerosol particles to different classes. Black labels represent
the ions characteristic for different classes. The red, blue, and orange labels represent the signatures for sulfate (32 S− , 64 SO−           −
                                                                                                                                     2 , 80 SO3 ,
         −          −                  −                       −                  +         −              −                            +
81 HSO3 , 97 HSO4 , 177 SO3 HSO4 , and 195 HSO4 H2 SO4 ), nitrate (30 NO , 46 NO2 , and 62 NO3 ), and ammonium (18 NH4 and 30
NO+ ). The green labels represent the organic compounds (26 C2 H2 /CN− and 42 C2 H2 O/CNO− ). In the overall averaged spectrum, grey
labels represent the background fragments (common ions) that exist for every particle class.
Atmos. Meas. Tech., 12, 2219–2240, 2019                                                        www.atmos-meas-tech.net/12/2219/2019/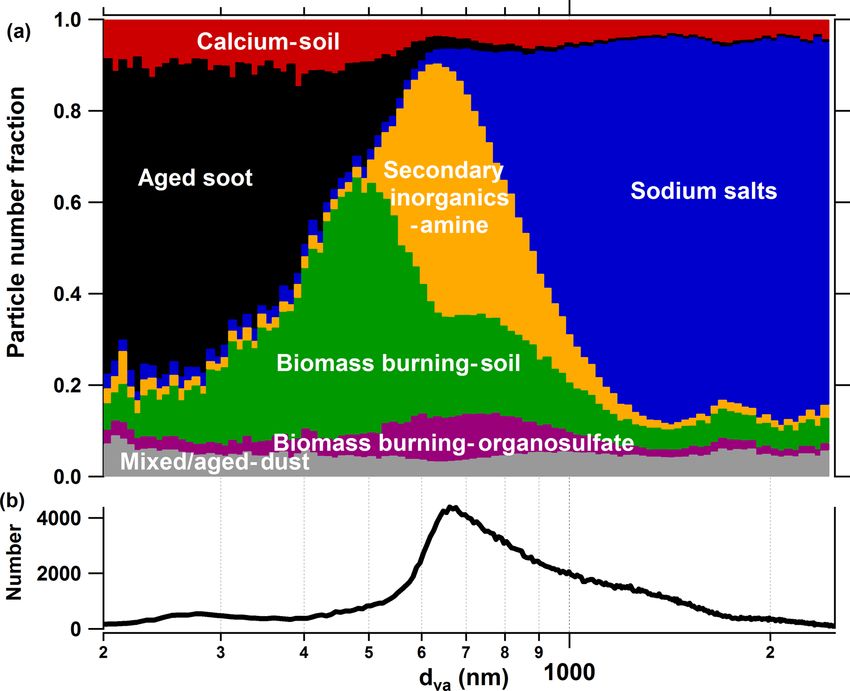
X. Shen et al.: Particle identification and quantification by single particle MS                                                     2227

                                                                       agricultural soil dust. The weak spectral signal might be due
                                                                       to the core-shell structure of the particles (Pratt and Prather,
                                                                       2009). In fact, previous studies identified soil dust as the
                                                                       particle type dominating the coarse particles sampled in the
                                                                       same region (Faude and Goschnick, 1997; Goschnick et al.,
                                                                       1994). Goschnick et al. (1994) found a core-shell structure
                                                                       in both submicron and coarse particles collected north of the
                                                                       city of Karlsruhe in the upper Rhine valley. This supports our
                                                                       hypothesis. In addition, similar to class 3, class 5 also has two
                                                                       modes in its size distribution centred at about 500 and 800 nm
                                                                       dva . Such potential sub-classes will be further analysed in the
                                                                       future.
                                                                          Particle class 6 contains 5.7 % of all particles, and they
                                                                       have sizes ranging from 400 to 1000 nm dva . This class
                                                                       is named biomass burning–organosulfate, short for aged-
                                                                       biomass-burning and organosulfate-containing particles. It
                                                                       also shows biomass burning markers such as m/z 213
Figure 3. (a) Size-resolved number fraction for seven particle         K3 SO+ 4 and features organosulfates at m/z 141 C2 H5 OSO4 ,
                                                                                                                                         −
classes measured during the field campaign TRAM01, based on                              −                           −
                                                                       155 C2 H3 O2 SO4 , and 215 C5 H11 OSO4 , which are con-
fuzzy classification according to the fuzzy c-means clustering al-     sistent with signals from sulfate esters of glycolalde-
gorithm. (b) Overall size distribution for the particles measured by   hyde/methylglyoxal, glyoxal/glycolic acid, and isoprene
LAAPTOF during the whole campaign.                                     epoxydiols (IEPOX), respectively, observed by other SPMS
                                                                       in field measurements (Froyd et al., 2010; Hatch et al., 2011a,
                                                                       b). Unfortunately, we do not have laboratory-based refer-
to uptake other components. Hence, most likely they were               ence spectra for organosulfate particles. Such reference val-
formed not very long ago by conversion of their precursors.            ues could be very useful for a further analysis. The ra-
The secondary inorganic–amine particles have a rather nar-             tio of m/z 39+ /41+ of ∼ 6.7 is closer to organics rather
row size distribution in the range between 500 and 1000 nm             than to potassium. However, we cannot rule out a significant
dva (refer to Fig. 3).                                                 potassium contribution. In addition, this class features a spe-
   Aged-biomass-burning and soil-dust-like particles (class            cific pattern of m/z 39+ , 41+ , and 43+ (which have much
5: biomass burning–soil) comprise 16.1 % of all particles ac-          higher intensities than their interstitial peaks at m/z 40+ and
cording to the similarity of the mass spectra. It has the most         42+ ) and hydrocarbon and oxygenated organic fragments at
prominent peak at m/z 39 K/C3 H+       3 and aromatic marker           m/z 53+ , 55+ , 63+ , 65+ , 67+ , 69+ , 71+ , 73+ , 81+ , 83+ ,
peaks at 50 C4 H+ 2 , 63 C H
                          5 3
                             +
                               , 77 C  H +          +          +
                                      6 5 , 85 C7 H , 91 C7 H7 ,       85+ , 95+ , 97+ , and 99+ , likely from organic acids and bio-
         +             +                +
95 C7 H11 , 104 C8 H8 , and 115 C9 H7 . The ratio of m/z 39            genic SOA (Shen et al., 2018).
+ /41+ is ∼ 11.6, which is similar to the value of (13.5±0.9)             Class 1 (5.0 % of all particles) is identified as calcium–soil,
measured for pure potassium-containing inorganic particles             short for calcium-rich and soil-dust-like particles. It contains
(e.g. K2 SO4 ) by our LAAPTOF in the laboratory. The con-              calcium-related signatures at m/z 40 Ca+ , 56 CaO+ /Fe+ , 57
tribution of organic fragments is likely the reason for the            CaOH+ , 75 CaCl+ , 96 Ca2 O+ , and 112 (CaO)+         2 , as well as
slightly lower value, as this ratio was determined to be ∼ 8           some other metal-related signatures including m/z 23 Na+ ,
for humic acid and ∼ 1.1 for α-pinene SOA (Shen et al.,                64/66 Zn+ , 65 Cu+ , 138 Ba+ , 154 BaO+ , and 206–208
2018). Hence, we assign the signal at m/z 39+ mainly to                Pb+ . Most of the signature peaks for calcium-related par-
potassium. The aromatic signature was observed by the other            ticles, such as Ca-rich soil dust, engine exhaust, and lake
SPMS (Dall’Osto and Harrison, 2012; Schmidt et al., 2017;              spray aerosols, were also identified by other SPMS studies
Silva and Prather, 2000). As suggested by previous stud-               (Dall’Osto et al., 2016; May et al., 2018; Roth et al., 2016).
ies, such potassium-rich particles can originate from biomass          This class shows a strong correlation with nitrate and corre-
burning and are often mixed with sulfate and/or nitrate (Gas-          lates well with all reference spectra of dust samples, espe-
ton et al., 2013; Lin et al., 2017; Middlebrook et al., 2003;          cially soil dust (refer to Fig. 5). Class 2 (4.3 % of all parti-
Moffet et al., 2008a; Pratt et al., 2010; Qin et al., 2012; Roth       cles), aged soot, is predominantly located in the small size
et al., 2016; Schmidt et al., 2017). This is also the case for         range (200 to 600 nm dva ) and exhibits prominent EC pat-
class 5 particles that exhibit a characteristic peak at m/z 213        terns in mass spectra (characteristic C±  n progressions with up
K3 SO+ 4 . Note that we also denoted this class as soil-dust-like      to n = 12) and is mixed with sulfate and nitrate. Such soot
particles based on the correlation diagram (Fig. 5), although          signatures are normally found in SMPS studies (Ault et al.,
there are no obvious marker ions visible. It is correlated well        2010; Dall’Osto et al., 2016; Gaston et al., 2013; Middle-
(γ ≥ 0.6) with reference spectra of dust particles, especially         brook et al., 2003; Spencer and Prather, 2006). These mass

www.atmos-meas-tech.net/12/2219/2019/                                                     Atmos. Meas. Tech., 12, 2219–2240, 2019
2228 X. Shen et al.: Particle identification and quantification by single particle MS
Figure 4. Time series of the similarity, corrected number fraction, and mass fraction of seven major particle classes and the corresponding
pie charts for total fractions. Note that the correction shown here is based on a chemically resolved or particle-class-resolved ODE. The
seven classes are class 1: calcium–soil; class 2: aged soot; class 3: sodium salts; class 4: secondary inorganics–amine; class 5: biomass
burning–soil, class 6: biomass burning–organosulfate; and class 7: mixed/aged dust. In panel (c), six periods have been marked: P1 is Period
1 from 26 July 2016 16:23 to 1 August 2016 11:43, P2 from 2 August 2016 09:43 to 14 August 2016 17:53, P3 from 14 August 2016 18:03
to 17 August 2016 21:03, P4 from 17 August 2016 21:13 to 23 August 2016 15:33, P5 from 24 August 2016 15:03 to 29 August 2016 08:33,
and P6 from 29 August 2016 08:43 to 31 August 2016 09:13.
spectra show a strong correlation to the reference spectra of ficult to achieve reasonable quantitative estimates about their
soot particles, especially diesel soot (γ =∼ 1). Class 7 (4.6 % abundance based on LAAPTOF measurements alone.
of all particles) is identified as mixed/aged dust, which con- The aforementioned full and short names for seven classes,
tains no obvious characteristic features and is correlated with as well as their signature ion peaks, are listed in Table 1.
most of the reference spectra. It has a relatively even and We emphasize here that the expression “rich” as used in this
broad size distribution covering the whole size range that study only indicates a strong signal in the mass spectra rather
LAAPTOF is able to measure. than a large fraction in mass, since there is no well-defined
We observe intensive signals at m/z 138 Ba+ and 154 relationship between LAAPTOF spectral signal and the cor-
BaO+ in class 1, 5, 6, and 7, indicating a similar source of responding quantity. The sensitivities of this instrument to
these particle types, which all have a good correlation with different species have to be established in the future.
mineral and soil dust particles (Fig. 5). Prominent lead mark- All the laboratory-based reference spectra used in this
ers at m/z 206+ to 208+ can be found in each class, except study are publicly available via the EUROCHAMP-2020
class 4, which is further evidence for these particles being database (https://www.eurochamp.org/default.aspx, last ac-
relatively young. The marker peaks for lead appear broader cess: 28 March 2019). Information on newly added reference
because at higher m/z, we observe larger peak shifts that spectra is given in Table S2.
cannot be completely corrected with the existing LAAPTOF
software. Note that even though we did not obtain spectra for 3.2 Quantification of single-particle mass and the
pure ammonium sulfate or pure biogenic SOA particles in external mixing
ambient air, it is still possible for such particles to be present.
However, laboratory measurements show a very low sensitiv- In this section, we estimate mass concentrations of the parti-
ity of the LAAPTOF to these types of particles, potentially cle classes observed in the field. This is based on the particle
due to their low absorbance at 193 nm. Due to this low in- identification discussed above as well as the assignment of
strument sensitivity for these types of particles, it is very dif- appropriate ODE values of surrogate reference particles and
on several assumptions on particle density and shape (refer to
Atmos. Meas. Tech., 12, 2219–2240, 2019 www.atmos-meas-tech.net/12/2219/2019/X. Shen et al.: Particle identification and quantification by single particle MS 2229 Figure 5. Correlation diagram of fuzzy classification results (seven classes, C1 to C7) and 36 laboratory-based reference spectra. Correlation results for the positive and negative spectra (e.g. for C1) are in the separated rows (e.g. C1+ and C1−). PAH is short for poly(allylamine hydrochloride), B SOA is short for biogenic SOA (α-pinene SOA in this study), A SOA is short for anthropogenic SOA (toluene SOA in this study), and biomass burning soot is the lignocellulosic char from chestnut wood. Note that the strong and good correlations mentioned in the paper stand for Pearson’s correlation coefficient γ ≥ 0.8 and γ ≥ 0.6, respectively. The seven classes are class 1: calcium–soil; class 2: aged soot; class 3: sodium salts; class 4: secondary inorganics–amine; class 5: biomass burning–soil; class 6: biomass burning–organosulfate; and class 7: mixed/aged dust. Sect. 2.2). Please note that both AMS and LAAPTOF cannot prise mainly larger particles (class 3: dva peaks at ∼ 1400 measure particles larger than 2.5 µm, which can be analysed and 2000 nm corresponding to dp ∼ 700 and 1000 nm; class 4 by FIDAS. FIDAS data showed that PM2.5 accounted for peaks at ∼ 680 nm dva and 400 nm dp ), which have the high- majority mass of the total aerosol particles sampled through est ODE values. In contrast the other classes comprise mainly the TSP inlet (PM2.5 = 73 % of PM10 and 64 % of PMtotal , smaller particles (dva < 500 nm; dp < 300 nm) (refer to Fig. 3), respectively). In this study, we only focus on PM2.5 parti- which have a lower ODE (refer to Fig. 1). Class 5, biomass cles. The fuzzy-classification-derived similarity (Fig. 4a) can burning–soil, accounts for the second highest number frac- be transferred into corrected number fractions using size- tion of the smaller particles and has a relatively high effec- resolved and chemically resolved ODE (Fig. 4b) and fur- tive density. After correction, the number fraction of parti- ther transferred into mass fractions (Fig. 4c) of the seven cles attributed to this class increased from 16.1 % to 45.0 %, particle classes. The corresponding time series of chemi- corresponding to 31.8 % mass fraction, and it becomes the cally resolved number and mass concentrations can be found dominating class with respect to particle number and mass. in Fig. S4. Please note that the aged soot particles (class Sodium salts are another dominating class with respect to 2), which dominate the number fraction for particles below mass (30.1 % mass fraction) due to their relatively large size. 400 nm in the fuzzy c-means analysis, comprise only a mi- These observations demonstrate the crucial role of the cor- nor fraction of the total number counts in Fig. 4 because the rections applied for particle mass quantification in SPMS total particle number is dominated by particles larger than data. Note that we can obtain similarly corrected number 500 nm (refer to Fig. 3b). Significant changes can be ob- and mass fractions by using minimum, mean, and maximum served between the similarity number fraction, the corrected ODE, respectively (Table S3). The observed external mix- number fraction, and the resulting mass fractions (cf. Fig. 4a ing of aerosol particles varied significantly with time, e.g. to b to c). Compared to the similarity fraction, the number class 6, biomass burning-organosulfate, dominated both par- fractions of class 3, sodium salts, and class 4, secondary ticle number and mass at the beginning of the measurements inorganics–amine, decrease dramatically; sodium salt parti- until 1 August, while class 3 dominated the mass for 5–10, cles changed from 43.5 % (similarity) to 3.4 % (corrected 21–24, and 29–30 August, and class 4 particles peaked twice number fraction), and secondary inorganics–amine dramat- on 11–19 August (refer to Fig. 4). ically decreased from 20.8 % to 2.4 %, while those of the As discussed above, raw LAAPTOF data overestimate other classes increase. This is because classes 3 and 4 com- the particles with higher ODE, while the ones with lower www.atmos-meas-tech.net/12/2219/2019/ Atmos. Meas. Tech., 12, 2219–2240, 2019
2230 X. Shen et al.: Particle identification and quantification by single particle MS
Table 1. Particle class numbers, names, labels, and corresponding signature ion peaks.
Class number: name (label) Signature ion peaks (anions are marked in italic)
Class 1: calcium-rich and soil-dust-like parti- 23 Na+ , 40 Ca+ , 56 CaO/Fe+ , 57 CaOH+ , 64/66 Zn+ , 65
cles (calcium–soil) Cu+ , 75 CaCl+ , 96 Ca2 O+ , 112 (CaO)+ + +
2 , 138 Ba , 154 BaO ,
206–208 Pb+
Class 2: aged-soot-like particles (aged soot) 12n Cn+ , 206–208 Pb+ ; 12n Cn− , sulfate (32 S − , 64 SO−
2 , 80
SO−
3 , 81 HSO −
3 , 97 HSO−
4 , 177 SO3 HSO −
4 , 195 HSO H
4 2 SO −
4)
Class 3: sodium-salt-like particles 23 Na+ , 39 NaO/K+ , 40 Ca+ , 46 Na+ 2 , 62 Na2 O ,
+
(sodium salts) + + + +
63 Na2 OH , 81/83 Na2 Cl , 92 Na2 NO2 , 108 Na2 NO3 ,
129 C5 H7 NO+ + +
3 , 141 Na3 Cl2 , 149 C4 H7 O2 NO3 , 165
+ + + −
Na3 SO4 , 181 C4 H7 O4 NO3 , 206–208 Pb ; 35/37 Cl , 93/95
NaCl− − −
2 , 104 NaClNO2 , 111 NaCl2 H2 O , 115 Na(NO2 )2 ,
−
119 NaSO4 /AlSiO− − −
4 , 120 NaClNO3 , 131 NaNO2 NO3 , 147
Na(NO3 )2 , 151/153 Na2 Cl3 , 177 NaClNaSO4 /SO3 HSO−
− − −
4
Class 4: secondary- inorganics-rich and amine- ammonium and amine (18 NH+ +
4 , 27 C2 H3 /CHN , 28
containing particles (secondary inorganics– CO/CH2 N+ , 30 NO+ , 43 C3 H7 /C2 H3 O/CHNO+ , 58
amine) C2 H5 NHCH+ +
2 , Amine 59 (CH3 )3 N , 86 (C2 H5 )2 NCH2 ,
+
+ +
88 (C2 H5 )2 NO/C3 H6 NO2 , 118 (C2 H5 )2 NCH2 ); nitrate (46
NO− −
2 , 62 NO3 ), sulfate
Class 5: aged-biomass-burning and soil-dust- 39 K/C3 H+ + + +
3 , 41 K/C3 H5 , 43 C3 H7 /C2 H3 O , 50 C4 H2 , 53
+ + +
like particles (biomass burning–soil) C4 H5 , 55 C4 H4 /C3 H3 O , 63 C5 H3 , 77 C6 H5 , 85 C7 H+ , 91
+
C7 H+ + + + + +
7 , 95 C7 H11 , 104 C8 H8 , 115 C9 H7 , 138 Ba , 154 BaO ,
+ +
175 K2 HSO4 , 206–208 Pb+ , 213 K3 SO4 ; sulfate
Class 6: aged-biomass-burning and positive signature peaks feature biomass burning very similar
organosulfate-containing particles (biomass to those given for class 5 organosulfate (141 C2 H5 OS O4− , 155
burning– organosulfate) C2 H3 O2 SO− −
4 , 215 C5 H11 O3 SO4 )
Class 7: mixed/aged and dust-like particles contains almost all the signature peaks from the other classes
(mixed/aged dust)
Note that “rich” used in the names stands for the strong spectral signal rather than the real mass fraction.
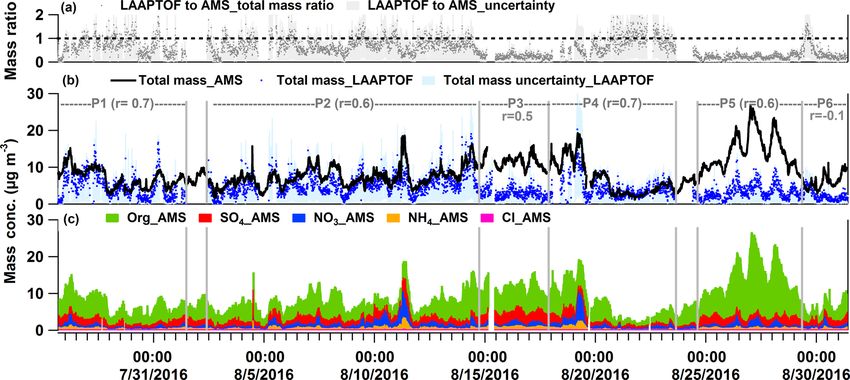
ODE will be underestimated. After correction of the num- centrations of LAAPTOF and AMS, they show much bet-
ber counts and estimation of the mass concentrations, we can ter agreement in total mass and also good correlations dur-
compare the LAAPTOF result with the quantitative instru- ing specific periods (P), such as P1, 2, 4, and 5 (refer to
ments such as AMS in the overlapping size range of 200 Figs. 6 and S5), covering ∼ 85 % of the measurement time.
to 2500 nm dva . A correction for the particles in the size Hence, the large differences in the average mass concentra-
range between 70 and 200 nm considering mass concentra- tions are caused by larger deviations during some relatively
tions may be negligible since they typically contribute only short periods or events. Considering the fact that AMS can
a minor mass fraction. It turns out that the total mass of the only measure non-refractory compounds, the good correla-
particles measured by LAAPTOF is 7 ± 3 % (with maximum tion between AMS and LAAPTOF gives us a hint that the
ODE), 16 ± 6 % (mean ODE), 60 ± 24 % (minimum ODE), species measured by AMS may mainly originate from the
and 45 ± 16 % (23 %–68 % with chemically resolved ODE) particles of complex mixtures of both refractory and non-
of the total AMS mass depending on the measurement pe- refractory species. It is worth noting that the weakest cor-
riods. Two criteria were used to select characteristic time relation (γ = −0.1) is observed in P6 when LAAPTOF mea-
periods: a period should have a stable correlation between sured the highest fraction of sodium salt particles (especially
LAAPTOF and AMS total mass; and a period should con- sodium chloride) on 29 August, while AMS is unable to mea-
tain special events or dominating particle classes observed sure refractory species such as sodium chloride. Specifically,
by LAAPTOF and/or AMS (refer to Figs. 4c and 6). De- from 09:00 to 23:53 on 29 August, LAAPTOF and AMS
spite the relatively large differences in the average mass con- tended to be slightly anti-correlated (γ = −0.3).
Atmos. Meas. Tech., 12, 2219–2240, 2019 www.atmos-meas-tech.net/12/2219/2019/You can also read